non-conventional gas supply … gadde - unconventional supply… · 2 delivering commercial insight...
TRANSCRIPT
www.woodmac.com
Delivering commercial insight to the global energy industry
Non-Conventional Gas Supply Impacts on the Energy Picture
2
Delivering commercial insight to the global energy industry
www.woodmac.com
0
10,000
20,000
30,000
40,000
50,000
60,000
70,000
2000 2005 2010 2015 2020
mm
cfd
UnconventionalConventional
34% 75%
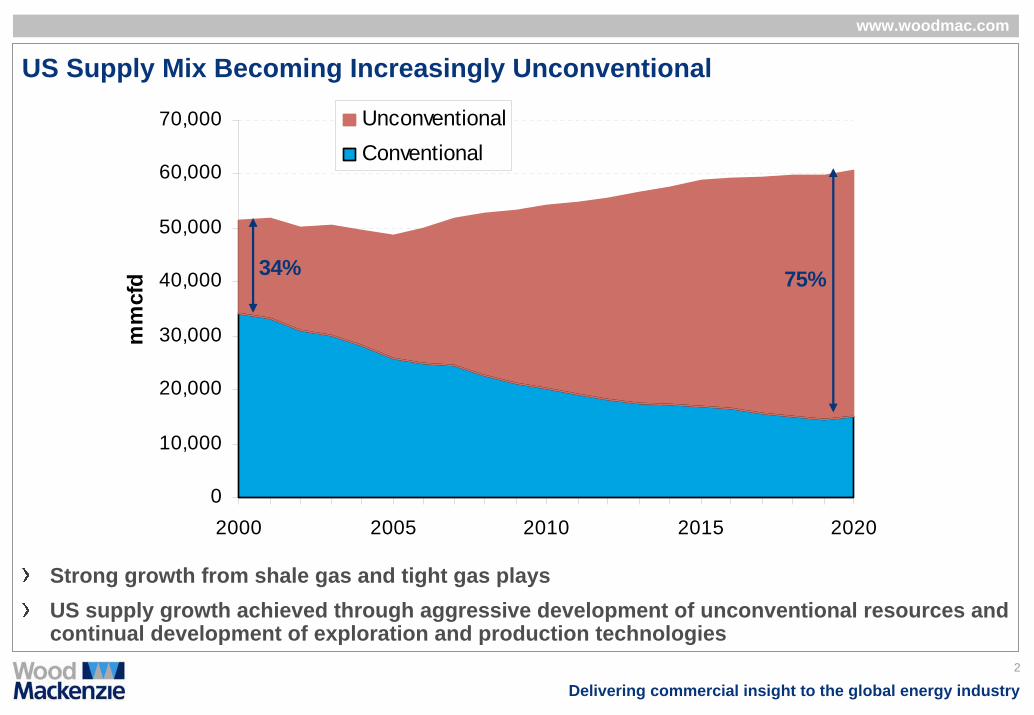
US Supply Mix Becoming Increasingly Unconventional
Strong growth from shale gas and tight gas playsUS supply growth achieved through aggressive development of unconventional resources and continual development of exploration and production technologies
3
Delivering commercial insight to the global energy industry
www.woodmac.com
0
4,000
8,000
12,000
16,000
2000 2005 2010 2015
mm
cfd
Antrim Lewis/Mancos/Mowry Appalachia DevonianBarnett Fayetteville WoodfordHaynesville Marcellus
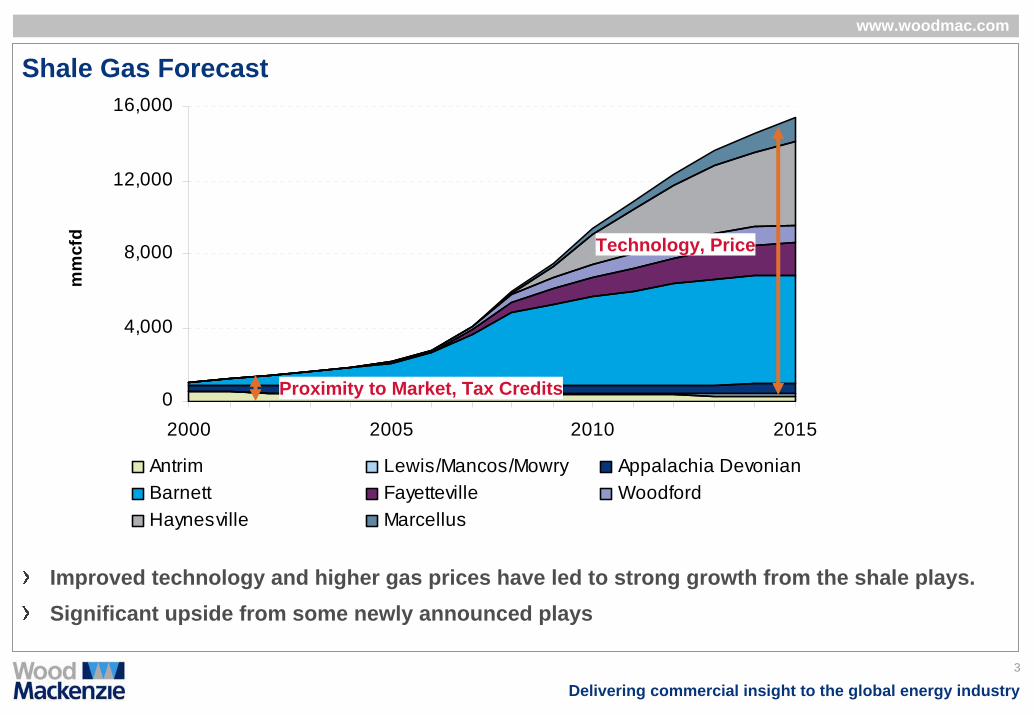
Shale Gas Forecast
Improved technology and higher gas prices have led to strong growth from the shale plays.Significant upside from some newly announced plays
Technology, Price
Proximity to Market, Tax Credits
4
Delivering commercial insight to the global energy industry
www.woodmac.com
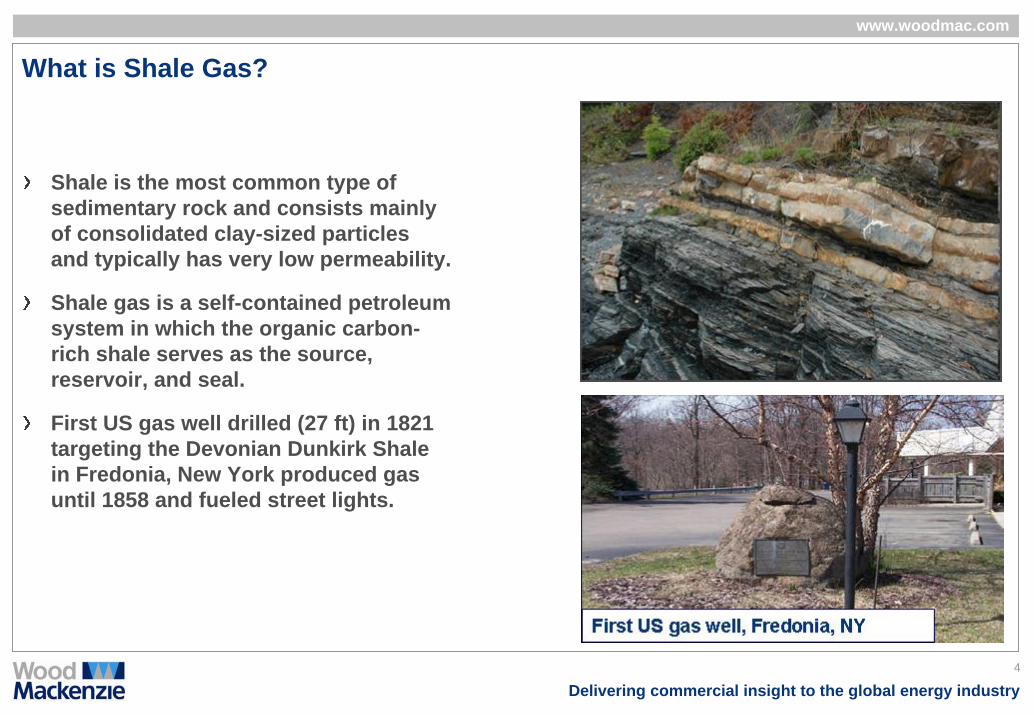
What is Shale Gas?
Shale is the most common type of sedimentary rock and consists mainly of consolidated clay-sized particles and typically has very low permeability.
Shale gas is a self-contained petroleum system in which the organic carbon-rich shale serves as the source, reservoir, and seal.
First US gas well drilled (27 ft) in 1821 targeting the Devonian Dunkirk Shale in Fredonia, New York produced gas until 1858 and fueled street lights.
5
Delivering commercial insight to the global energy industry
www.woodmac.com
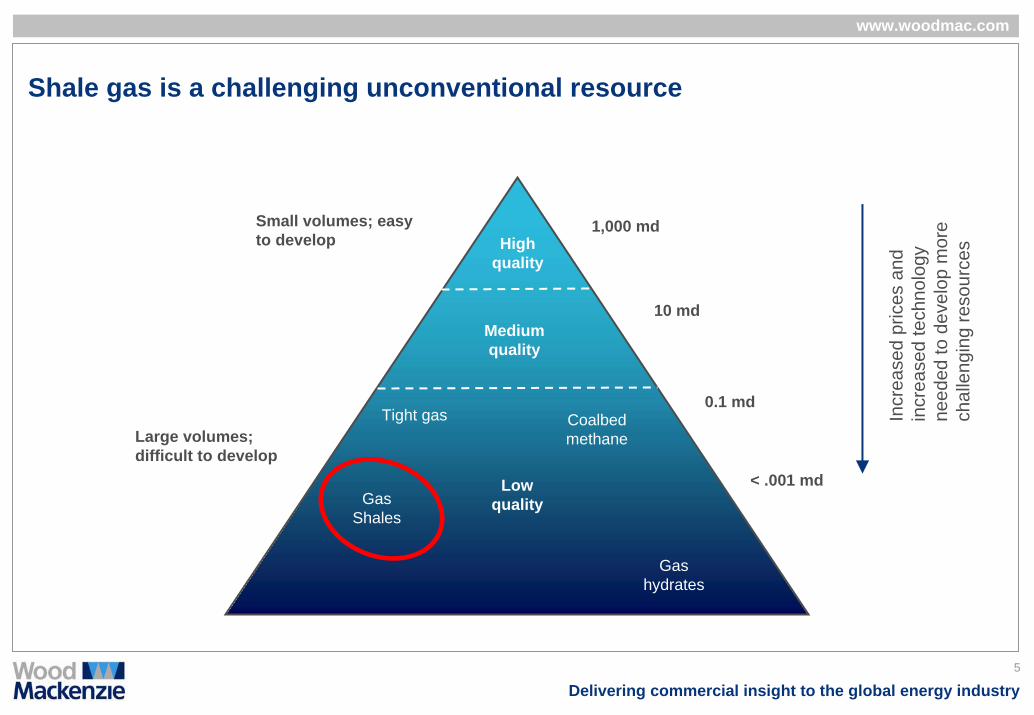
Shale gas is a challenging unconventional resource
Small volumes; easy to develop
Large volumes; difficult to develop
High quality
Medium quality
Low quality
Gas hydrates
Gas Shales
Coalbed methane
Tight gas
1,000 md
10 md
0.1 md
< .001 md
Incr
ease
d pr
ices
and
in
crea
sed
tech
nolo
gy
need
ed to
dev
elop
mor
e ch
alle
ngin
g re
sour
ces
6
Delivering commercial insight to the global energy industry
www.woodmac.com
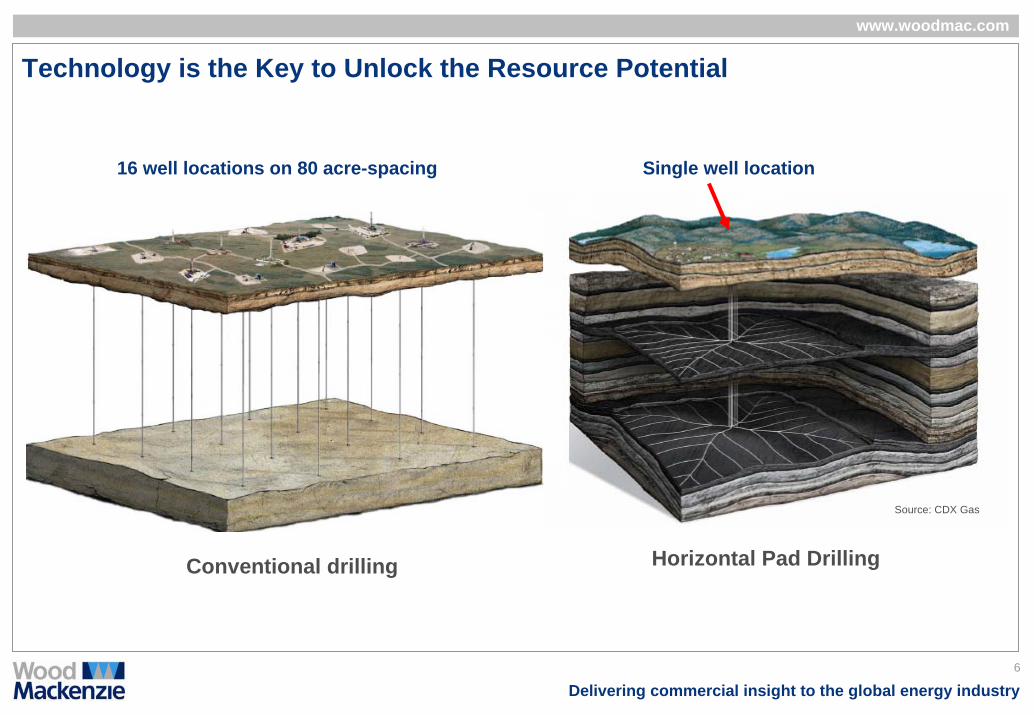
Single well location
Horizontal Pad Drilling
Source: CDX Gas
16 well locations on 80 acre-spacing
Conventional drilling
Technology is the Key to Unlock the Resource Potential
7
Delivering commercial insight to the global energy industry
www.woodmac.com
Shale Gas Assessments Out of Date
US Geological Survey (USGS)• Technically recoverable gas in Barnett
• 1996 study – 3 tcf
• 2004 study – 26 tcf
• Our estimates – 55-60 tcf
• Technically recoverable gas in Marcellus
• 2002 study – 1.9 tcf
• Pennstate studies – 300+tcf
• Haynesville & most of other shales – little or no dataPotential Gas Committee likely to include a better estimate in its next update
8
Delivering commercial insight to the global energy industry
www.woodmac.com
What Makes a Successful Shale Play?
Geology, geochemistry & thermal maturation – does gas exist?• Gas must exist in commercial quantities - ‘gas in place is king’• Shale thickness, organic content, thermal maturity define GIP
Physical properties – can gas flow commercially? • Natural fractures key to production• Shale must be brittle and facilitate fracturing
• Drilling and completions engineered to avoid geologic hazards
Gas price and costs– is the play commercial?• Break-even prices for Barnett @ 10% IRR are US$4.23–5.57/mcf gas price• Fayetteville break-even prices are around US$5.34/mcf and Woodford break-even prices are
around US$5.72/mcf• Economics are improving as operators move up the learning curve
9
Delivering commercial insight to the global energy industry
www.woodmac.com
Common Themes of Successful Shale Gas Projects
Large developments with significant upfront investment Economies of scale required for aggressive cost control Operator size matters – development dominated by larger operatorsNot all acreage is equal – “sweet spots” and early mover advantageShale gas plays require continuous technical feedback loop – need to customize general technology to fit each shale
10
Delivering commercial insight to the global energy industry
www.woodmac.com
Shales Survive Drastic CutsOperators have made significant investments in acquiring acreage
• Drilling expected to be robust to hold acreageHaynesville
• Petrohawk and Chesapeake to maintain Haynesville activity at previously planned levels despite cuts elsewhere
Fayetteville • Southwestern increased spending by $0.5 billion. Chesapeake expected to maintain 20 rigs in the play –
nearly double early 2008 levels but 3 rigs below previous estimates. Petrohawk to run 11 rigs, higher than 2008 average.
Woodford• Newfield to increase rig count from 12 to 14 – 3 rigs below previous estimates.
Barnett• Quicksilver reduced rigs from 14 to 9. Chesapeake had laid /moved 10 rigs. Rig reductions so far around 20%
BC shale• Apache to invest US$260 Million in the play. EnCana, Quicksilver and EOG also committing capital to further
test and develop the play.Marcellus
• Range and several others stepping up activity. Range deploying six fit-for-purpose rigs. Chesapeake planning to reach 20 rigs in the play by end of 2009
11
Delivering commercial insight to the global energy industry
www.woodmac.com
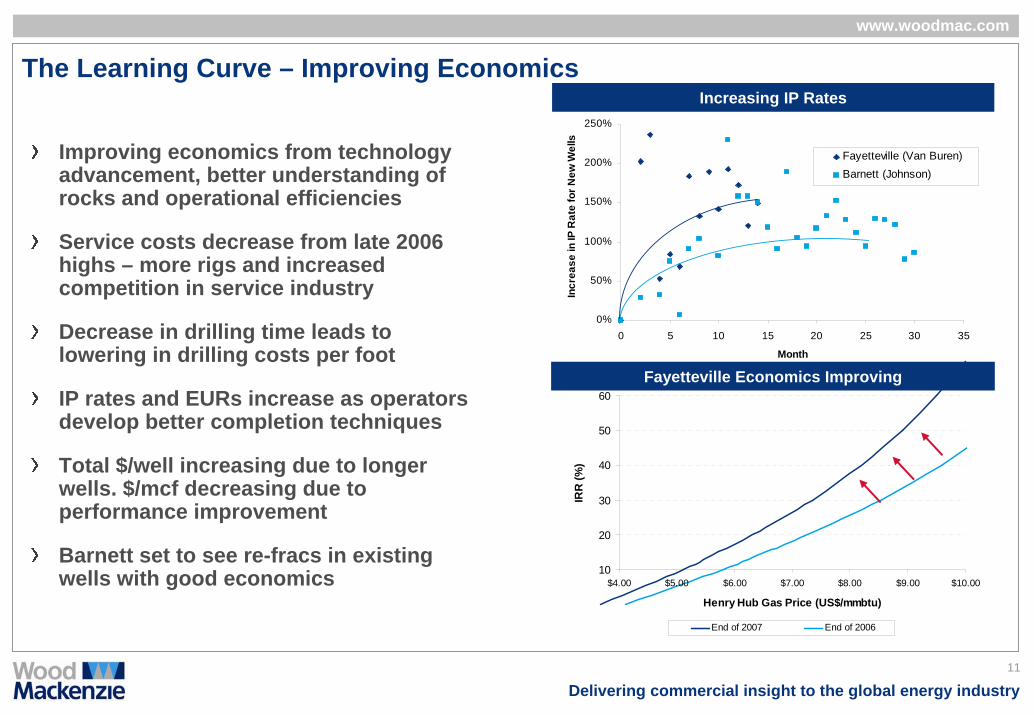
The Learning Curve – Improving Economics
Improving economics from technology advancement, better understanding of rocks and operational efficiencies
Service costs decrease from late 2006 highs – more rigs and increased competition in service industry
Decrease in drilling time leads to lowering in drilling costs per foot
IP rates and EURs increase as operators develop better completion techniques
Total $/well increasing due to longer wells. $/mcf decreasing due to performance improvement
Barnett set to see re-fracs in existing wells with good economics
0%
50%
100%
150%
200%
250%
0 5 10 15 20 25 30 35
Month
Incr
ease
in IP
Rat
e fo
r New
Wel
ls
Fayetteville (Van Buren)Barnett (Johnson)
Increasing IP Rates
10
20
30
40
50
60
$4.00 $5.00 $6.00 $7.00 $8.00 $9.00 $10.00
Henry Hub Gas Price (US$/mmbtu)
IRR
(%)
End of 2007 End of 2006
Fayetteville Economics Improving
12
Delivering commercial insight to the global energy industry
www.woodmac.com
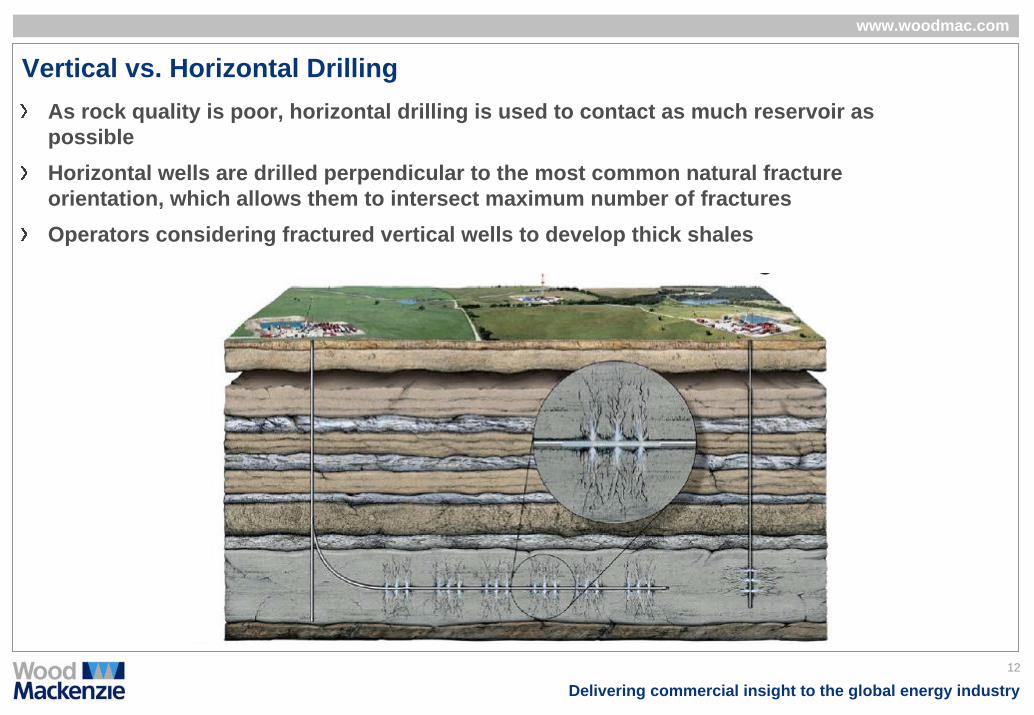
Vertical vs. Horizontal DrillingAs rock quality is poor, horizontal drilling is used to contact as much reservoir as possibleHorizontal wells are drilled perpendicular to the most common natural fracture orientation, which allows them to intersect maximum number of fracturesOperators considering fractured vertical wells to develop thick shales
13
Delivering commercial insight to the global energy industry
www.woodmac.com
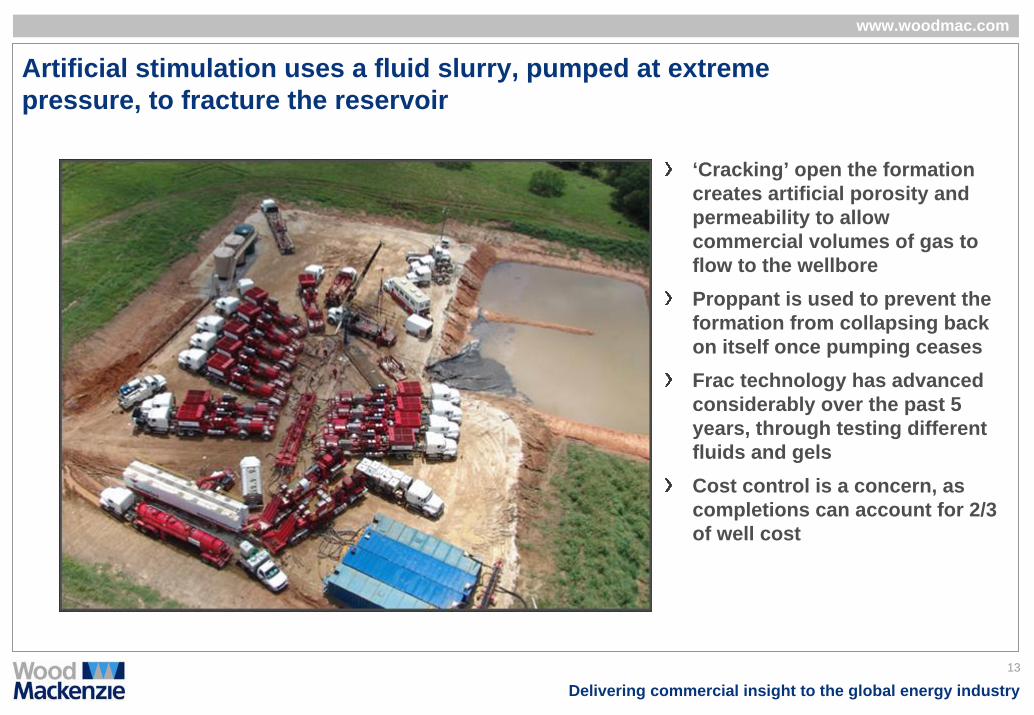
Artificial stimulation uses a fluid slurry, pumped at extreme pressure, to fracture the reservoir
‘Cracking’ open the formation creates artificial porosity and permeability to allow commercial volumes of gas to flow to the wellboreProppant is used to prevent the formation from collapsing back on itself once pumping ceasesFrac technology has advanced considerably over the past 5 years, through testing different fluids and gelsCost control is a concern, as completions can account for 2/3 of well cost
14
Delivering commercial insight to the global energy industry
www.woodmac.com
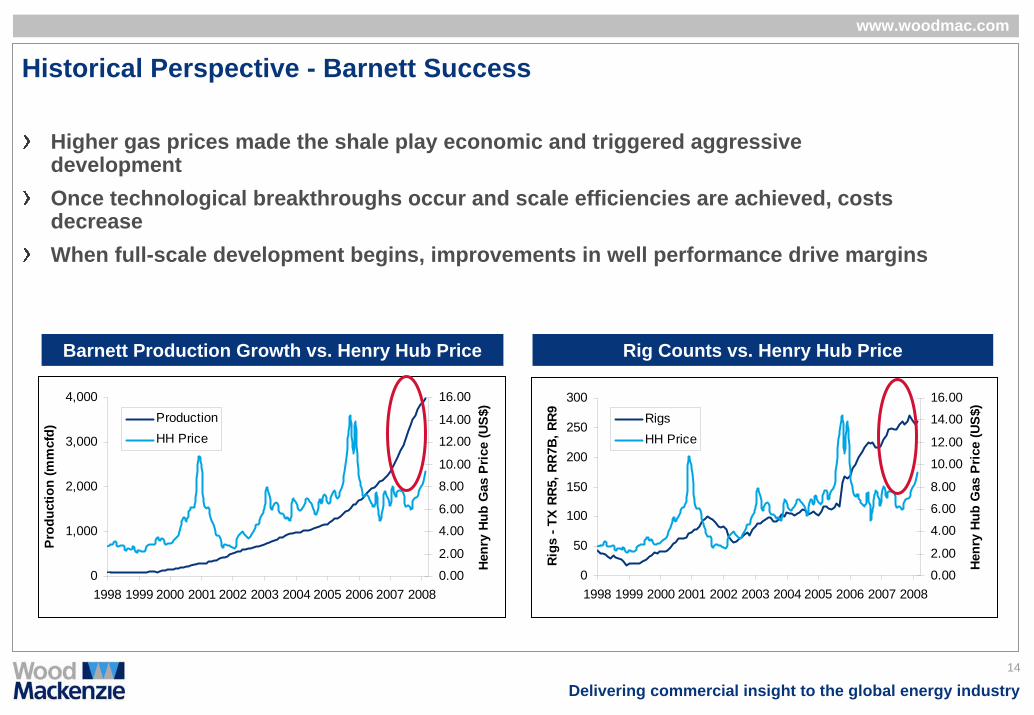
Historical Perspective - Barnett Success
Barnett Production Growth vs. Henry Hub Price Rig Counts vs. Henry Hub Price
Higher gas prices made the shale play economic and triggered aggressive developmentOnce technological breakthroughs occur and scale efficiencies are achieved, costs decreaseWhen full-scale development begins, improvements in well performance drive margins
0
50
100
150
200
250
300
1998 1999 2000 2001 2002 2003 2004 2005 2006 2007 2008
Rigs
- TX
RR
5, R
R7B,
RR9
0.00
2.00
4.00
6.00
8.00
10.00
12.00
14.00
16.00
Henr
y Hu
b G
as P
rice
(US$
)
RigsHH Price
0
1,000
2,000
3,000
4,000
1998 1999 2000 2001 2002 2003 2004 2005 2006 2007 2008
Prod
uctio
n (m
mcf
d)
0.00
2.00
4.00
6.00
8.00
10.00
12.00
14.00
16.00
Henr
y Hu
b G
as P
rice
(US$
)
ProductionHH Price

www.woodmac.com
Delivering commercial insight to the global energy industry
Important Shale Gas Plays
16
Delivering commercial insight to the global energy industry
www.woodmac.com
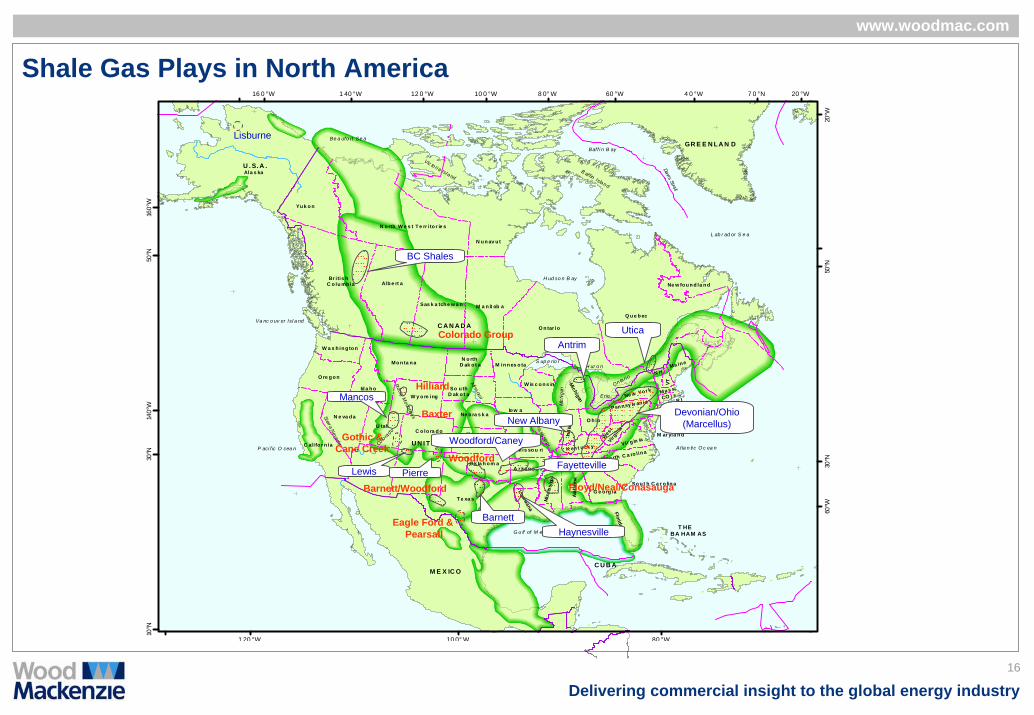
Shale Gas Plays in North America
Br itis hC o lu mb ia Alb e rt a
Sas k a tch e w a n M a n it ob a
O n tar io
Q u e b ec
Ne w fo u n d la n d
W a s h in g to n
O re g o n
C alifo r n ia
N e va d a
A rizo n a N ew M ex ico
T e xa s
O k la h o m a
Louisiana
Mis
siss
ipp
i
Ala
bam
a
G e o rg ia
Florida
So u t h C a r o lin a
N o rth C a ro lin aVir g in iaW
est
Virg
inia
Psn n sy lv an iaNe w Yor k
Ma ine
Ma s s.
R ICO
N H
VTMichigan
U tah
Id a h o
Mo n ta n a N o rthD ak o t a
So u thD ak o t a
K an s a sC o lo ra d o
W y o m ing
K en t u ck y
T e nn e ss e e
Ne b ra s k a
M in n es o ta
W is c o n s in
Io w a
Mis so u ri
A r ka n s a s
Il l in o is O h io
Ind
iana
M ar yla n d
Ne w Je r se y
C A N A D A
U N I TE D S T A TE S O F A M E R I C A
M E X IC O
H ud so n B ay
S up e rio rH ur o n
Mic
higa
n
Erie
On ta rio
Colorado
Missouri
Mississippi
A t la n ti c O c ea n
G u lf of M exi co
P aci f ic O cea n
Sierra Nevada
Rocky M
ountains
C U B A
T HEBA HAM AS
N u n av u t
N o rth W e s t T e rr ito r ie s
Yu k o n
U . S. A .Ala s ka
Be a ufo rt Se a
B affin Island
Vic to ria Island
Baff i n B ay
Davis Strait
L ab r ad or S e a
Va nc o uv er Isl a nd
GR E E N LA N D
1 40 °W16 0 °W
1 20 °W
12 0 °W
10 0° W
10 0 °W 8 0° W
80 °W
60 °W 4 0 °W 20 °W
10°N
30°N
30°N
50°N
50°N
140°
W16
0°W
60°W
20°W
7 0 °N
Baxter
Woodford
Barnett/Woodford
Antrim
Devonian/Ohio (Marcellus)New Albany
Barnett
PierreFayetteville
Woodford/Caney
Floyd/Neal/Conasauga
Lisburne
Eagle Ford & Pearsall
BC Shales
Lewis
Mancos
Colorado Group Utica
Haynesville
Hilliard
Gothic & Cane Creek
17
Delivering commercial insight to the global energy industry
www.woodmac.com
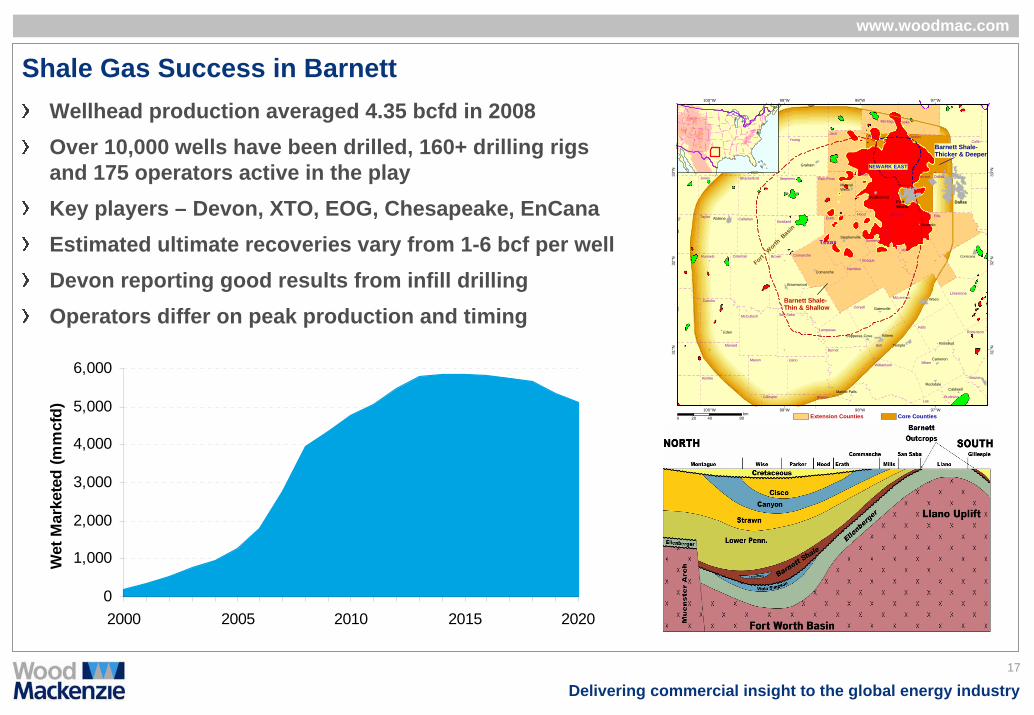
Shale Gas Success in BarnettWellhead production averaged 4.35 bcfd in 2008Over 10,000 wells have been drilled, 160+ drilling rigs and 175 operators active in the play Key players – Devon, XTO, EOG, Chesapeake, EnCanaEstimated ultimate recoveries vary from 1-6 bcf per wellDevon reporting good results from infill drillingOperators differ on peak production and timing
WeatherfordDallas
Corsicana
MineralWells
Alvarado
FortWorth
Abilene
Temple
Rockdale
Copperas Cove
Marble Falls
Killeen
Waco
Gatesville
Eden
Brownwood
Comanche
Graham
Stephenville
T
Rosebud
Cameron
Caldwell
Throckmorton
Collin
Dallas
Cooke
Jack
Tarrant
Montague
Wise
Ellis
Denton
Johnson
Palo Pinto
Somervell
Parker
McLennan
Erath
Bosque
Hood
Hill
Coryell
RobertsonFalls
Limestone
Hamilton
Brazos
LeeBurlesonBlancoGillespie
Kimble
Jones Shackelford
Runnels
TaylorEastland
Coleman
Callahan
ComancheBrown
MillsConcho
McCulloch
Menard
Mason
Burnet
Llano
San Saba
Stephens
Lampasas
MilamWilliamson
Bell
Youngnewall Haskell Throckmorton
Fort W
orth B
asin
Texas
NEWARK EAST
Barnett Shale-Thicker & Deeper
Barnett Shale-Thin & Shallow
100°W
100°W
99°W
99°W
98°W
98°W
97°W
97°W
31°N
31°N
32°N
32°N
33°N
33°N
0 40 8020km
!
! !
!
!
!
!
!
!
!
!
!
!
!
!
!
!
!
!!
!!
!
!
!
!
!! !
!
!
!
!
!
!
!
!
!
!
!
!
!
!!
!!
!
!
!
!
!
!
!
!
!
!
!
!!
!
!
!
!
!
!
!
!
!
!
!
!
!
!
!
!
!
! !
!
!
!
!
!
!
!
!
! !
!
!
!!
!
!
!
!!
!
!
!
!
!
!
!
!
!
!
!!
!
!
!!
!
!
!
!
!
! !!
!
!
!
!
!
!
!!
!
!
!!
!
!
!
!
!
!
!
!
!
! !
!
! !
!
!
!
!
!
!
!
!
!
!
!
!!
!
!
!
!
!!
!
Core CountiesExtension Counties
0
1,000
2,000
3,000
4,000
5,000
6,000
2000 2005 2010 2015 2020
Wet
Mar
kete
d (m
mcf
d)
18
Delivering commercial insight to the global energy industry
www.woodmac.com
The Future of the Barnett Shale Play
Tighter spacing: 50-acre to 20-acreRe-fracturing of existing vertical wellsExpansion of drilling success to the West and SouthMajority of expansion in Core area will be in increasingly urban setting
• Isolated, small drilling pads require high performance drilling rigs
• Quiet operations
• Fast (modular, top-drives)
• Small footprint (i.e. fit for purpose)
19
Delivering commercial insight to the global energy industry
www.woodmac.com
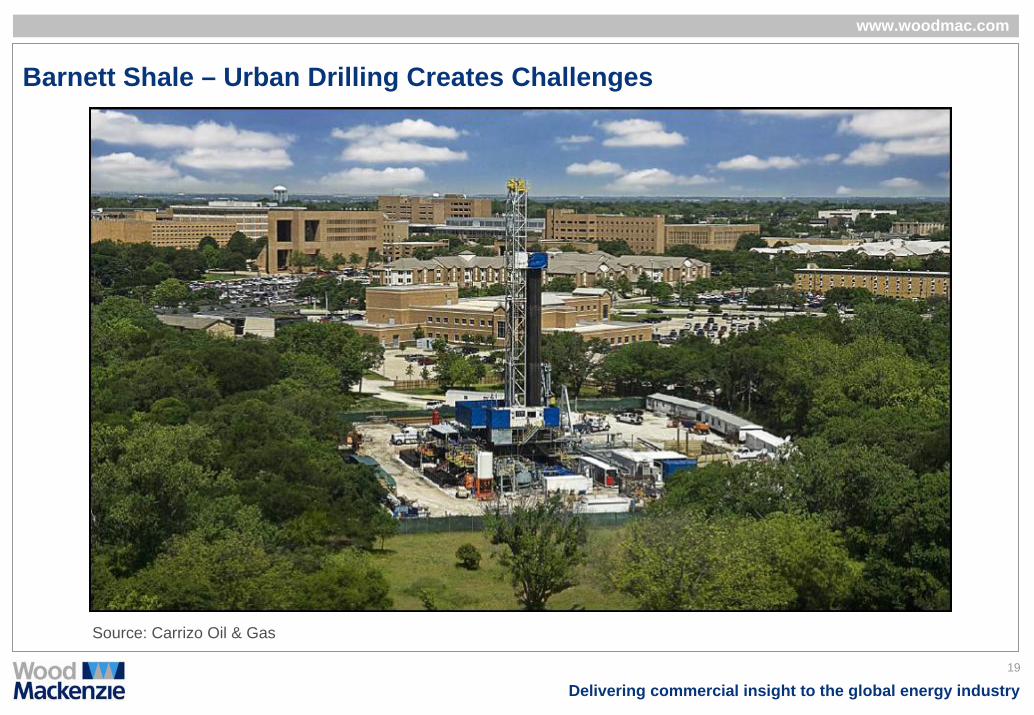
Barnett Shale – Urban Drilling Creates Challenges
Source: Carrizo Oil & Gas
20
Delivering commercial insight to the global energy industry
www.woodmac.com
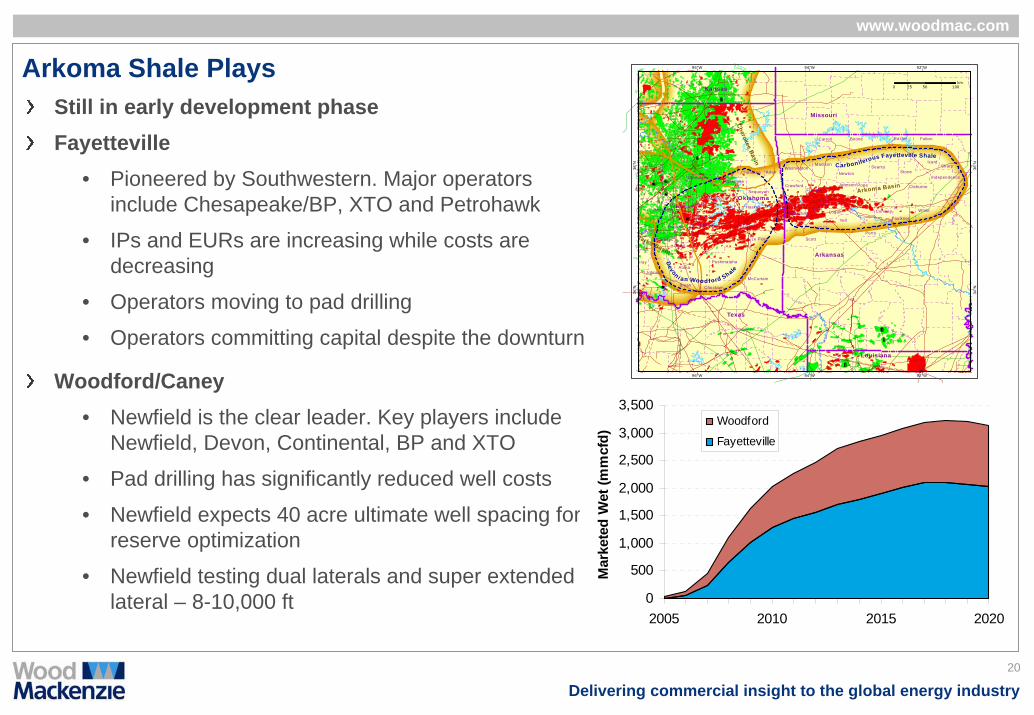
Arkoma Shale PlaysStill in early development phaseFayetteville
• Pioneered by Southwestern. Major operators include Chesapeake/BP, XTO and Petrohawk
• IPs and EURs are increasing while costs are decreasing
• Operators moving to pad drilling
• Operators committing capital despite the downturn
Woodford/Caney• Newfield is the clear leader. Key players include
Newfield, Devon, Continental, BP and XTO
• Pad drilling has significantly reduced well costs
• Newfield expects 40 acre ultimate well spacing for reserve optimization
• Newfield testing dual laterals and super extended lateral – 8-10,000 ft
Arkoma Basin
Cherokee Basin
darko Basin
Texas
Oklahoma
Arkansas
Missouri
Kansas
Carboniferous Fayetteville Shale
Devon i an Wood ford Sh ale
Louisiana
SearcyStone
Independence
SharpIzard
Baxter FultonBooneCarroll
Madison
Newton
Johnson Pope
White
Cleburne
Faulkner
Conway
Yell
Logan
Perry
FranklinCrawford
WashingtonAdairCherokee
Haskell
Sequoyah
Le Flore Scott
Sebastian
PushmatahaAtoka
Johnston
rray
Hughes
McIntosh
MuskogeeOkmulgee
Pittsburg Latimer
OkfuskeeSeminole
CoalPontotoc
Bryan Choctaw
McCurtain
96°W
96°W
94°W
94°W
92°W
92°W
34°N
34°N
36°N
36°N
0 50 10025km
0
500
1,000
1,500
2,000
2,500
3,000
3,500
2005 2010 2015 2020M
arke
ted
Wet
(mm
cfd)
Woodford
Fayetteville
21
Delivering commercial insight to the global energy industry
www.woodmac.com
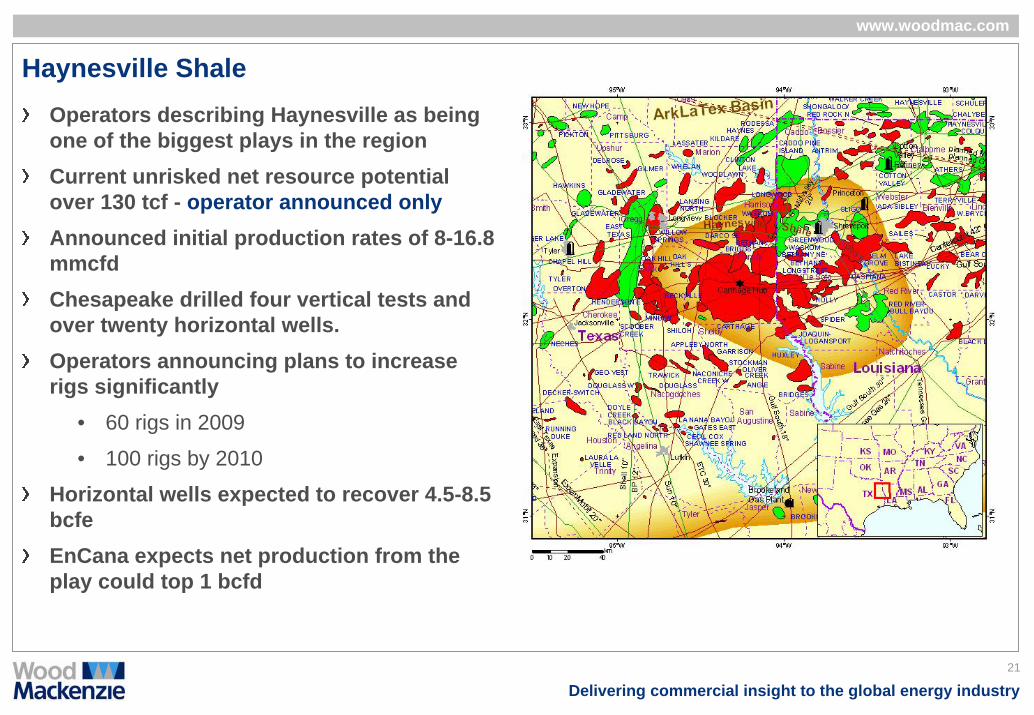
Haynesville ShaleOperators describing Haynesville as being one of the biggest plays in the region Current unrisked net resource potential over 130 tcf - operator announced onlyAnnounced initial production rates of 8-16.8 mmcfdChesapeake drilled four vertical tests and over twenty horizontal wells. Operators announcing plans to increase rigs significantly
• 60 rigs in 2009
• 100 rigs by 2010
Horizontal wells expected to recover 4.5-8.5 bcfeEnCana expects net production from the play could top 1 bcfd
22
Delivering commercial insight to the global energy industry
www.woodmac.com
How the Heck Did Aubrey Come up with 250 tcf Anyway?
180 bcf/section in Core and Tier 1 areas of Haynesville8 wells per section expected – 80 acre spacing.
• Note in Barnett it is 40 acres in some areas
Wells estimated to recover up to 52 bcf/section. Recovery of ~ 29% of OGIP. • In Barnett, operators are talking of higher recovery %. However, with more wells per
section
3 million acres or 4,700 sections in the core areas
4,700 sections x 52 bcf/section = 245 tcf of recoverable gas
23
Delivering commercial insight to the global energy industry
www.woodmac.com
Haynesville Shale
Areal extent – Sweet spots still to be determined. Deeper to the South and East and thins to the north. Thins to the West and transitions into a deep Bossier sand/shale playOperators drilling vertical/horizontal wells to delineate/hold acreage. Full-field development not yet commencedWells still in science phase. First micro-seismic fracture mappings being completedkey variables that make Haynesville successful
• Shale is thick (150-300’)
• Overpressured (increases recovery rates, gas-in-place, and the odds of natural fracturing)
• Quartz rich and low expandable clay content – important for successful fracture stimulations
24
Delivering commercial insight to the global energy industry
www.woodmac.com
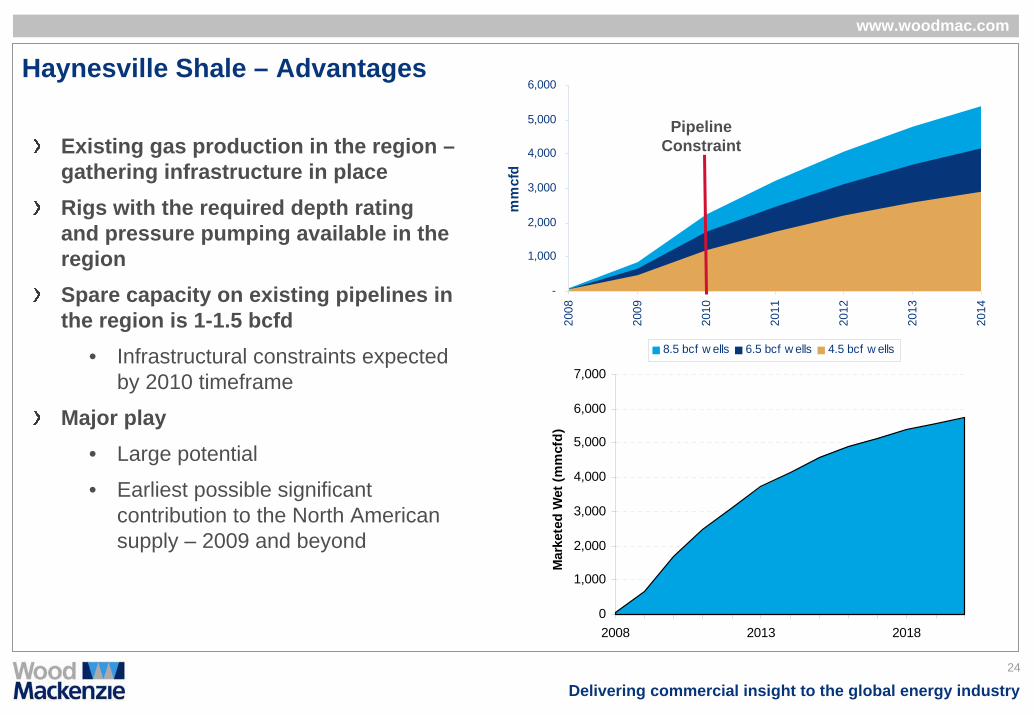
Haynesville Shale – Advantages
Existing gas production in the region –gathering infrastructure in placeRigs with the required depth rating and pressure pumping available in the regionSpare capacity on existing pipelines in the region is 1-1.5 bcfd
• Infrastructural constraints expected by 2010 timeframe
Major play• Large potential
• Earliest possible significant contribution to the North American supply – 2009 and beyond
0
1,000
2,000
3,000
4,000
5,000
6,000
7,000
2008 2013 2018
Mar
kete
d W
et (m
mcf
d)
-
1,000
2,000
3,000
4,000
5,000
6,000
2008
2009
2010
2011
2012
2013
2014
mm
cfd
8.5 bcf w ells 6.5 bcf w ells 4.5 bcf w ells
Pipeline Constraint
25
Delivering commercial insight to the global energy industry
www.woodmac.com
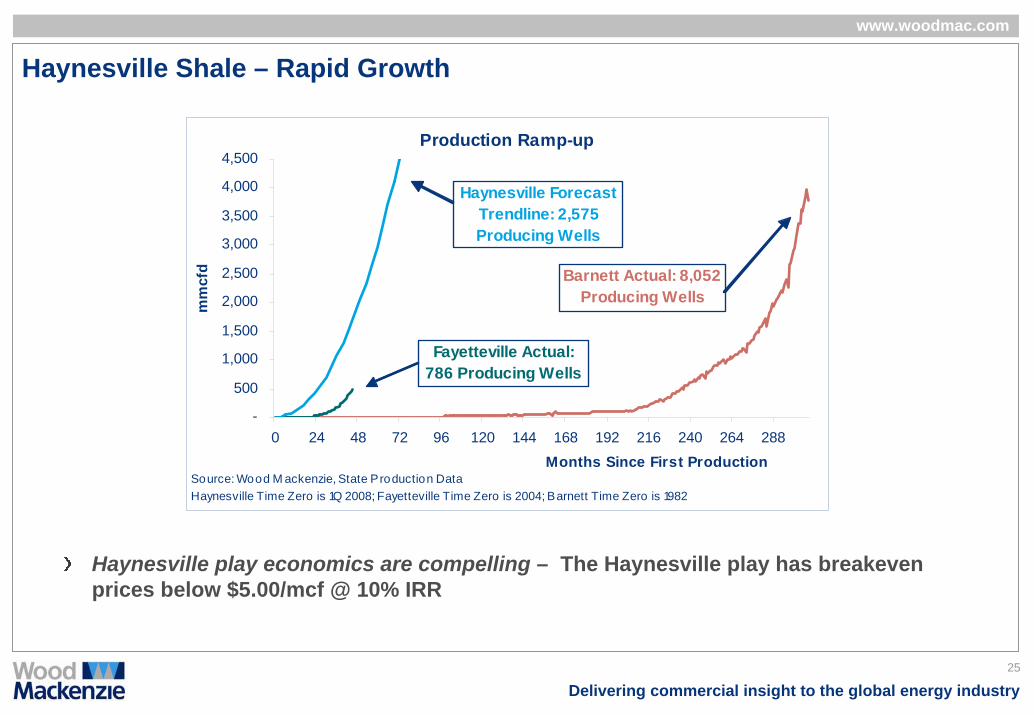
Haynesville Shale – Rapid Growth
Production Ramp-up
-
500
1,000
1,500
2,000
2,500
3,000
3,500
4,000
4,500
0 24 48 72 96 120 144 168 192 216 240 264 288
Months Since First Production
mm
cfd
Source: Wood M ackenzie, State Production DataHaynesville Time Zero is 1Q 2008; Fayetteville Time Zero is 2004; Barnett Time Zero is 1982
Barnett Actual: 8,052 Producing Wells
Haynesville Forecast Trendline: 2,575 Producing Wells
Fayetteville Actual: 786 Producing Wells
Haynesville play economics are compelling – The Haynesville play has breakeven prices below $5.00/mcf @ 10% IRR
26
Delivering commercial insight to the global energy industry
www.woodmac.com
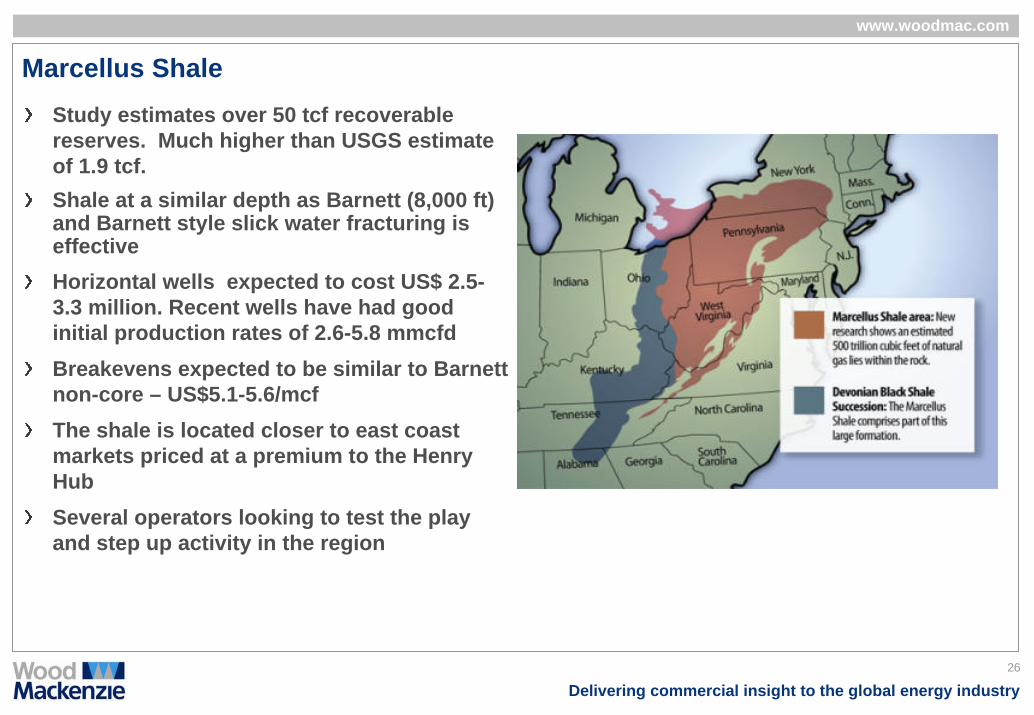
Marcellus ShaleStudy estimates over 50 tcf recoverable reserves. Much higher than USGS estimate of 1.9 tcf.Shale at a similar depth as Barnett (8,000 ft) and Barnett style slick water fracturing is effectiveHorizontal wells expected to cost US$ 2.5-3.3 million. Recent wells have had good initial production rates of 2.6-5.8 mmcfdBreakevens expected to be similar to Barnett non-core – US$5.1-5.6/mcfThe shale is located closer to east coast markets priced at a premium to the Henry HubSeveral operators looking to test the play and step up activity in the region
27
Delivering commercial insight to the global energy industry
www.woodmac.com
Marcellus Shale
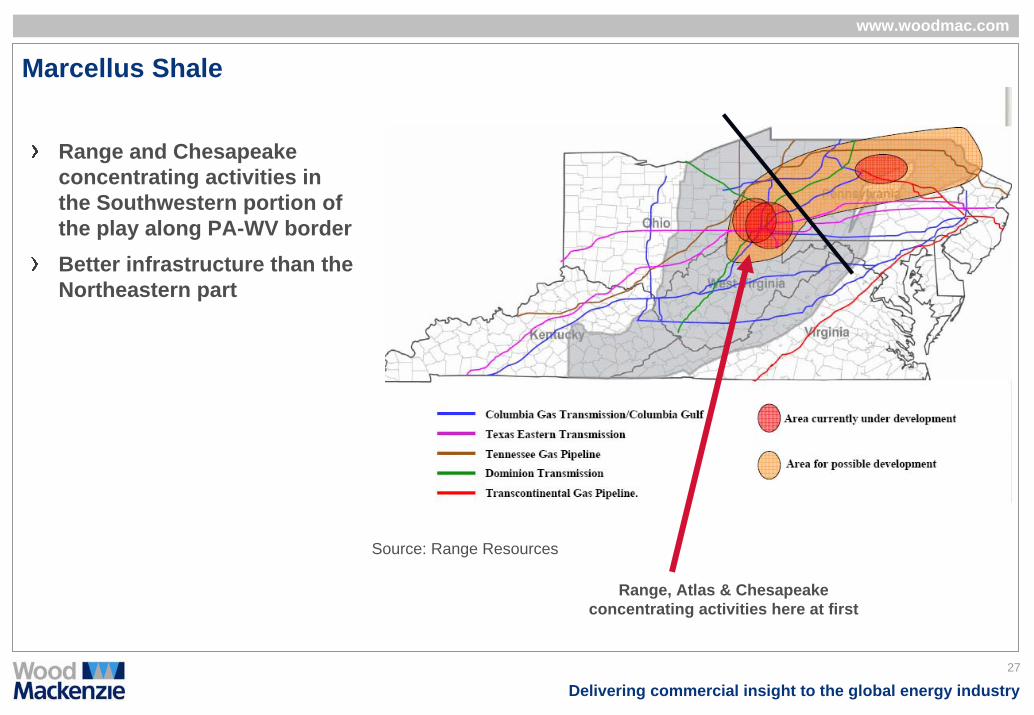
Source: Range Resources
Range and Chesapeake concentrating activities in the Southwestern portion of the play along PA-WV borderBetter infrastructure than the Northeastern part
Range, Atlas & Chesapeake concentrating activities here at first
28
Delivering commercial insight to the global energy industry
www.woodmac.com
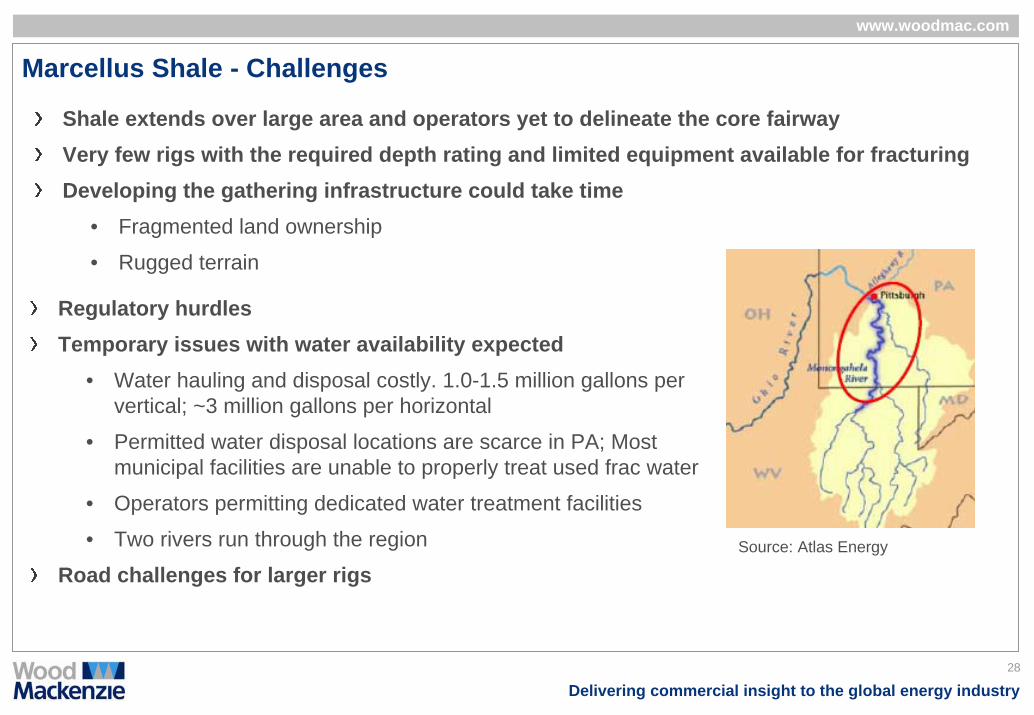
Marcellus Shale - Challenges
Shale extends over large area and operators yet to delineate the core fairwayVery few rigs with the required depth rating and limited equipment available for fracturingDeveloping the gathering infrastructure could take time
• Fragmented land ownership
• Rugged terrain
Regulatory hurdlesTemporary issues with water availability expected
• Water hauling and disposal costly. 1.0-1.5 million gallons per vertical; ~3 million gallons per horizontal
• Permitted water disposal locations are scarce in PA; Most municipal facilities are unable to properly treat used frac water
• Operators permitting dedicated water treatment facilities
• Two rivers run through the region
Road challenges for larger rigsSource: Atlas Energy
29
Delivering commercial insight to the global energy industry
www.woodmac.com
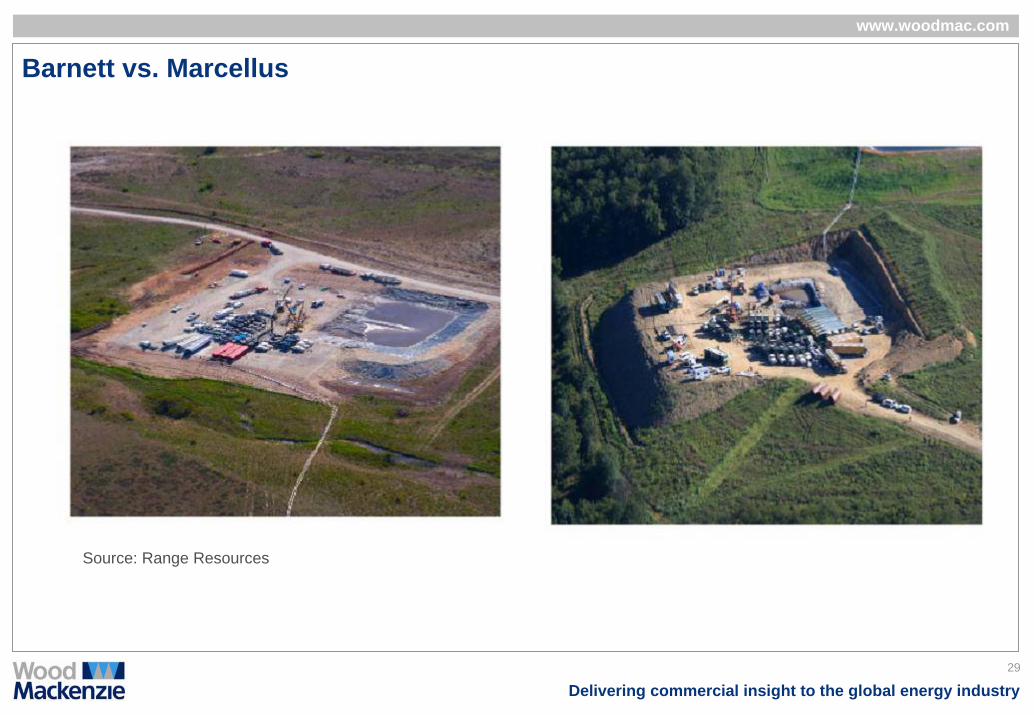
Barnett vs. Marcellus
Source: Range Resources
30
Delivering commercial insight to the global energy industry
www.woodmac.com
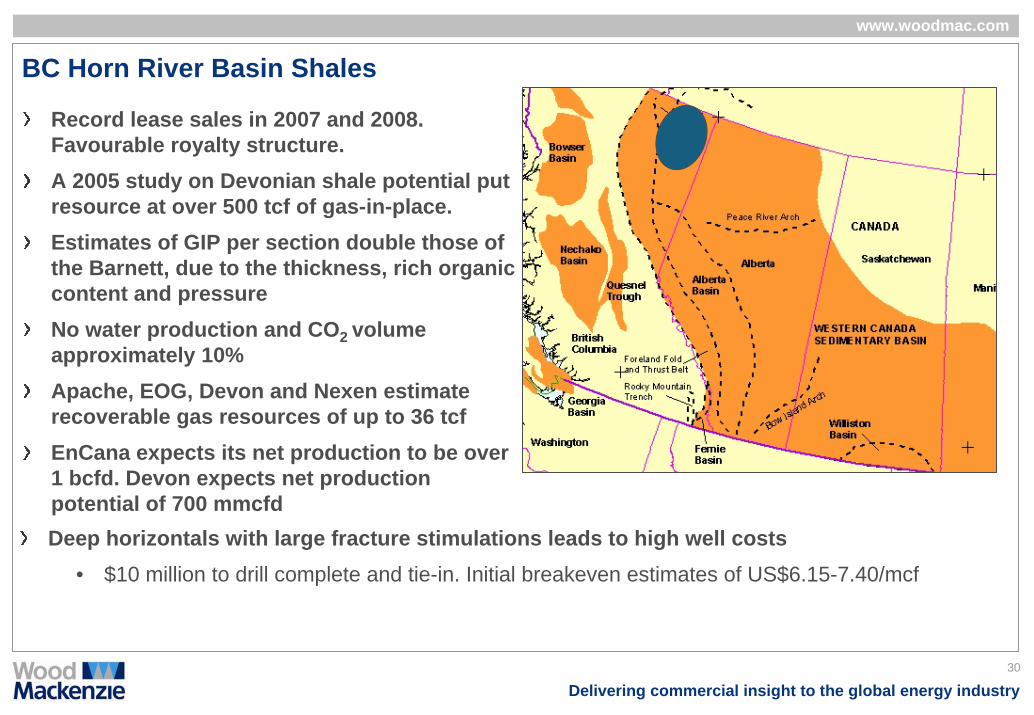
BC Horn River Basin Shales
Record lease sales in 2007 and 2008. Favourable royalty structure. A 2005 study on Devonian shale potential put resource at over 500 tcf of gas-in-place.Estimates of GIP per section double those of the Barnett, due to the thickness, rich organic content and pressureNo water production and CO2 volume approximately 10%Apache, EOG, Devon and Nexen estimate recoverable gas resources of up to 36 tcf EnCana expects its net production to be over 1 bcfd. Devon expects net production potential of 700 mmcfdDeep horizontals with large fracture stimulations leads to high well costs
• $10 million to drill complete and tie-in. Initial breakeven estimates of US$6.15-7.40/mcf
31
Delivering commercial insight to the global energy industry
www.woodmac.com
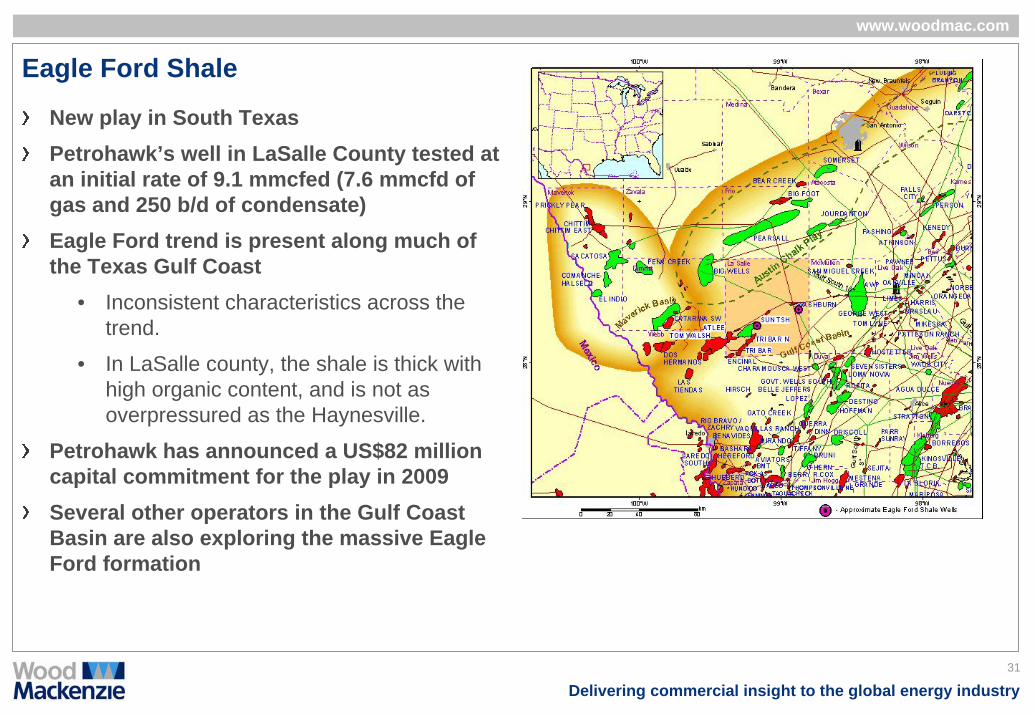
Eagle Ford Shale
New play in South Texas Petrohawk’s well in LaSalle County tested at an initial rate of 9.1 mmcfed (7.6 mmcfd of gas and 250 b/d of condensate)Eagle Ford trend is present along much of the Texas Gulf Coast
• Inconsistent characteristics across the trend.
• In LaSalle county, the shale is thick with high organic content, and is not as overpressured as the Haynesville.
Petrohawk has announced a US$82 million capital commitment for the play in 2009Several other operators in the Gulf Coast Basin are also exploring the massive Eagle Ford formation
32
Delivering commercial insight to the global energy industry
www.woodmac.com
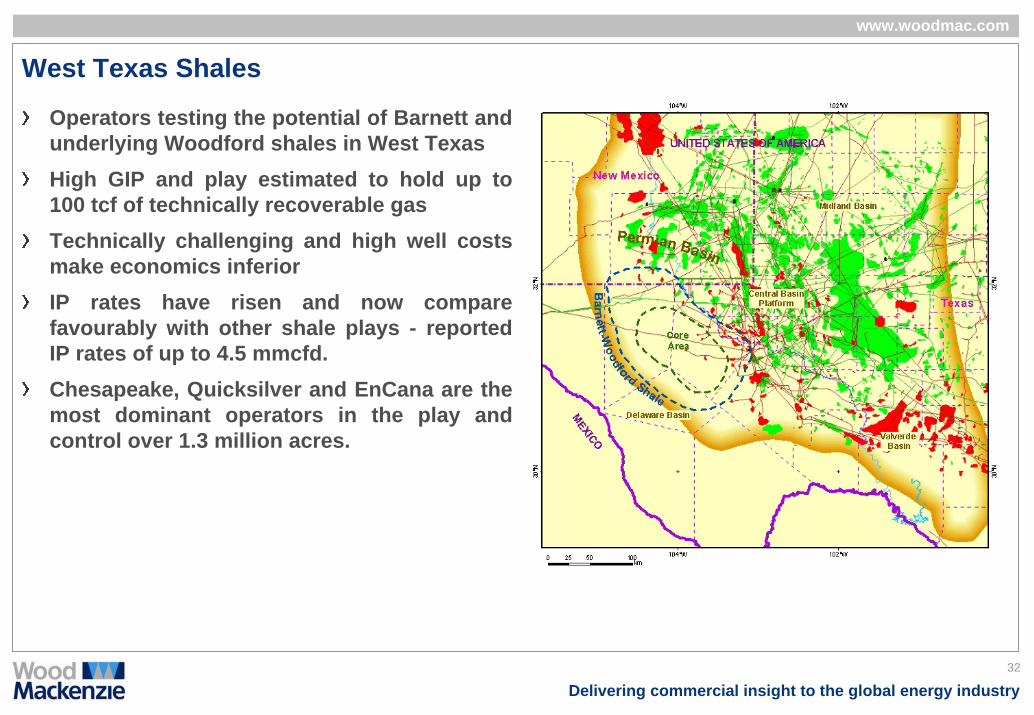
West Texas Shales
Operators testing the potential of Barnett and underlying Woodford shales in West TexasHigh GIP and play estimated to hold up to 100 tcf of technically recoverable gasTechnically challenging and high well costs make economics inferiorIP rates have risen and now compare favourably with other shale plays - reported IP rates of up to 4.5 mmcfd. Chesapeake, Quicksilver and EnCana are the most dominant operators in the play and control over 1.3 million acres.
33
Delivering commercial insight to the global energy industry
www.woodmac.com
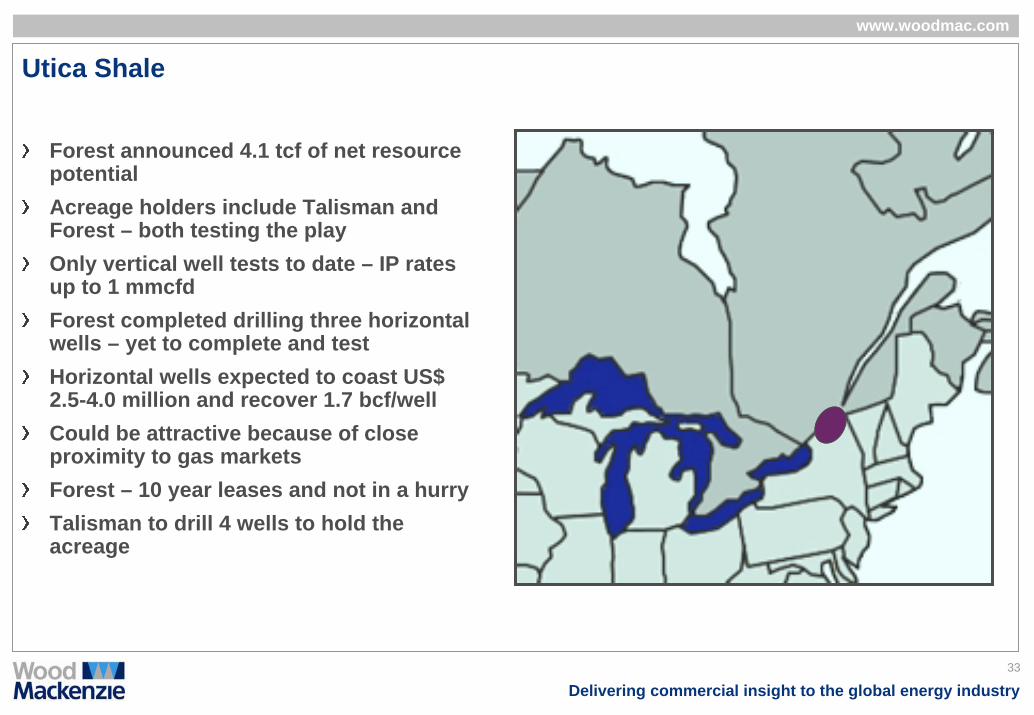
Utica Shale
Forest announced 4.1 tcf of net resource potential Acreage holders include Talisman and Forest – both testing the playOnly vertical well tests to date – IP rates up to 1 mmcfd Forest completed drilling three horizontal wells – yet to complete and testHorizontal wells expected to coast US$ 2.5-4.0 million and recover 1.7 bcf/wellCould be attractive because of close proximity to gas marketsForest – 10 year leases and not in a hurryTalisman to drill 4 wells to hold the acreage
34
Delivering commercial insight to the global energy industry
www.woodmac.com
Developing an Unconventional Shale Play
Identify and map target play – size of the pieAcquire acreageEvaluate technical characteristics and determine commercialityDelineate core fairwayDevelopment
• Develop best practices for drilling & completions
• Pilot test the optimum well spacing
• Full scale development

www.woodmac.com
Delivering commercial insight to the global energy industry
Tight Gas and CBM
36
Delivering commercial insight to the global energy industry
www.woodmac.com
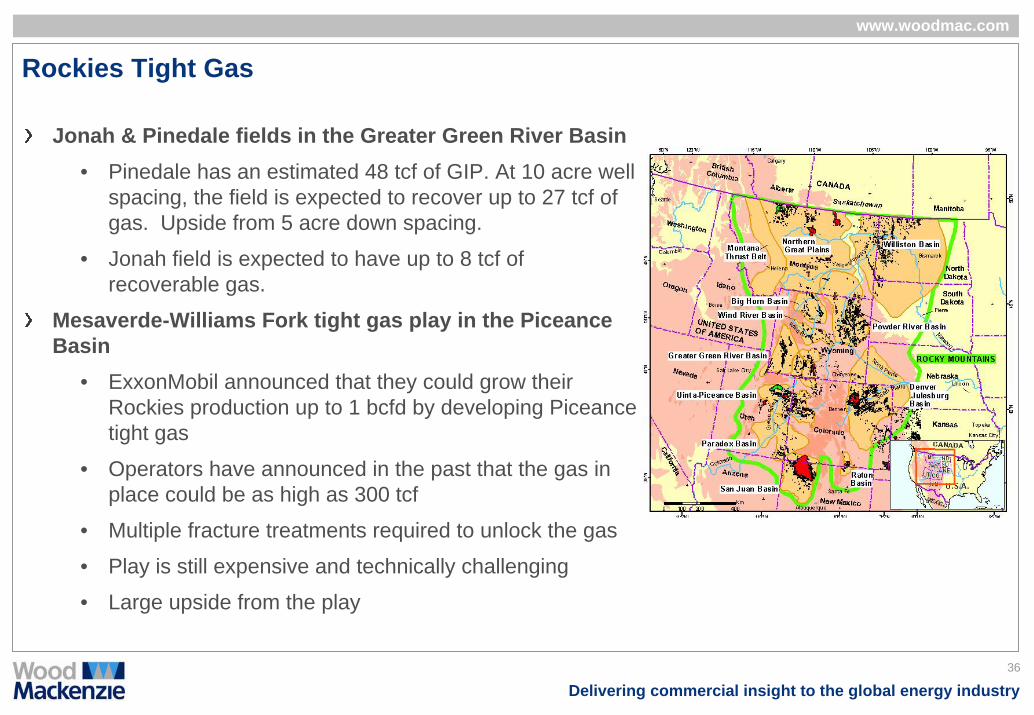
Rockies Tight Gas
Jonah & Pinedale fields in the Greater Green River Basin • Pinedale has an estimated 48 tcf of GIP. At 10 acre well
spacing, the field is expected to recover up to 27 tcf of gas. Upside from 5 acre down spacing.
• Jonah field is expected to have up to 8 tcf of recoverable gas.
Mesaverde-Williams Fork tight gas play in the Piceance Basin
• ExxonMobil announced that they could grow their Rockies production up to 1 bcfd by developing Piceance tight gas
• Operators have announced in the past that the gas in place could be as high as 300 tcf
• Multiple fracture treatments required to unlock the gas
• Play is still expensive and technically challenging
• Large upside from the play
37
Delivering commercial insight to the global energy industry
www.woodmac.com
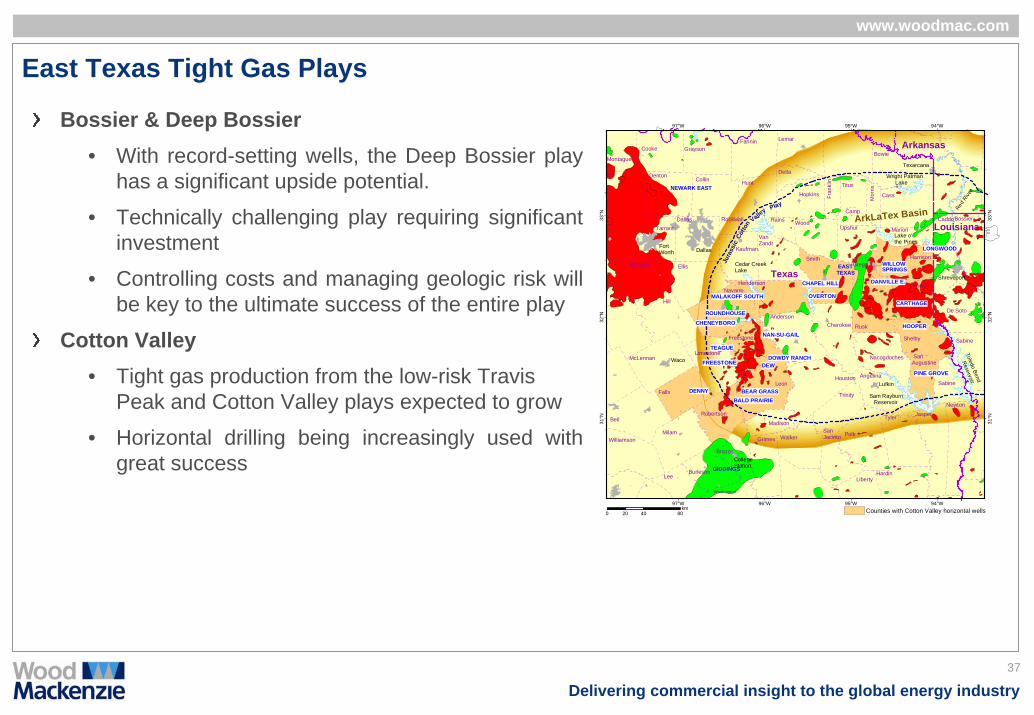
East Texas Tight Gas Plays
Bossier & Deep Bossier• With record-setting wells, the Deep Bossier play
has a significant upside potential.
• Technically challenging play requiring significant investment
• Controlling costs and managing geologic risk will be key to the ultimate success of the entire play
Cotton Valley• Tight gas production from the low-risk Travis
Peak and Cotton Valley plays expected to grow
• Horizontal drilling being increasingly used with great success
EASTTEXAS
DOWDY RANCH
BALD PRAIRIE
FREESTONE
BEAR GRASS
CARTHAGE
TEAGUE
LONGWOOD
NAN-SU-GAILHOOPER
PINE GROVE
ROUNDHOUSE
CHENEYBORO
DEW
DENNY
MALAKOFF SOUTH
NEWARK EAST
Texas
Texarcana
Jura
ssic
Cotto
n Valley Play
GIDDINGS
Louisiana
Liberty
Tyler
SanJacinto
Jasper
Hardin
Trinity
Angelina
SanAugustine
Shreveport
Waco
CHAPEL HILL
OVERTON
DANVILLE E.
WILLOWSPRINGS
Newton
Polk
Nacogdoches
Rusk
Gregg
Cherokee
Shelby
Panola
Upshur
Smith
Sabine
Fran
klin
Camp
Titus
Harrison
Cass
Wood
Mor
ris
Fannin
Bowie
Lemar
Delta
Marion
Grayson
Collin
Rockwall Rains
Kaufman
Dallas
VanZandt
Hopkins
Hunt
Cooke
Tarrant
Montague
Wise
Ellis
Denton
Johnson
McLennan
Hill
Robertson
Falls
Navarro
Limestone
Henderson
Anderson
Freestone
Walker
Madison
Houston
Brazos
Grimes
Leon
Washington
LeeBurleson
MilamWilliamson
Bell
CaddoBossier
Sabine
De Soto
ArkLaTex Basin
Arkansas
Lake o'the Pines
Wright Patman Lake
Cedar CreekLake
Toledo Bend
Reservoir
CollegeStation
Lufkin
Sam Rayburn Reservoir
Red R
iver
FortWorth Dallas
97°W
97°W
96°W
96°W
95°W
95°W
94°W
94°W
31°N
31°N
32°N
32°N
33°N
33°N
0 40 8020km Counties with Cotton Valley horizontal wells
38
Delivering commercial insight to the global energy industry
www.woodmac.com
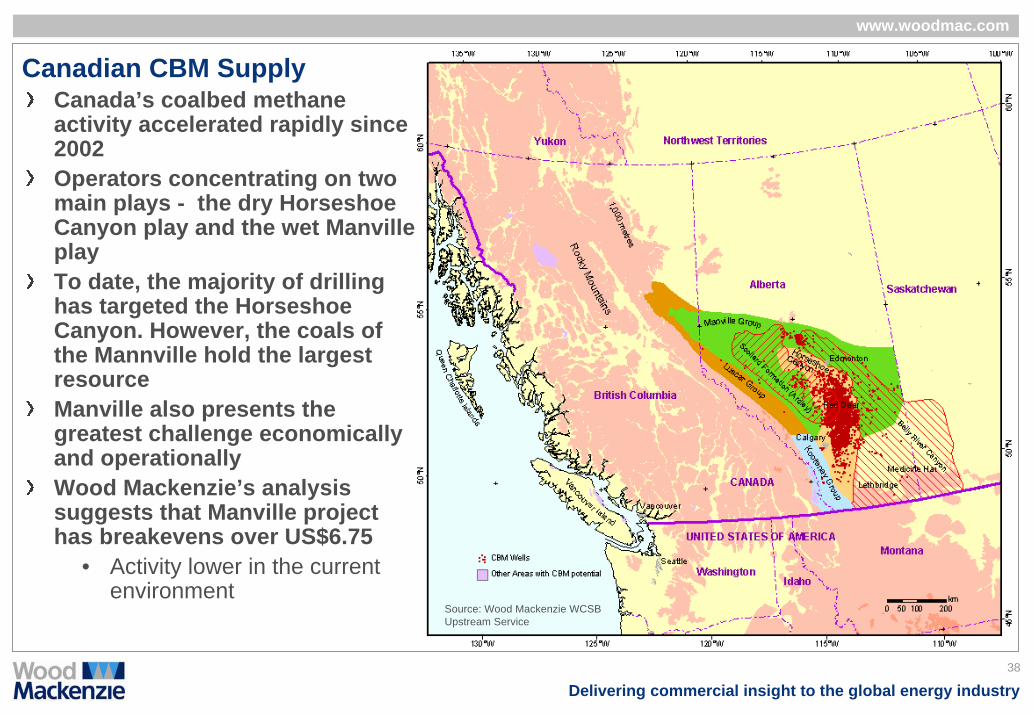
Canadian CBM Supply Canada’s coalbed methane activity accelerated rapidly since 2002Operators concentrating on two main plays - the dry Horseshoe Canyon play and the wet Manville playTo date, the majority of drilling has targeted the Horseshoe Canyon. However, the coals of the Mannville hold the largest resourceManville also presents the greatest challenge economically and operationallyWood Mackenzie’s analysis suggests that Manville project has breakevens over US$6.75
• Activity lower in the current environment
Source: Wood Mackenzie WCSB Upstream Service

www.woodmac.com
Delivering commercial insight to the global energy industry
Shale Gas Reduces LNG Imports & Leads to Unrealized Supply
40
Delivering commercial insight to the global energy industry
www.woodmac.com
0
2,000
4,000
6,000
8,000
10,000
12,000
14,000
2003
2005
2007
2009
2011
2013
2015
2017
2019
mm
cfd
Neptune
New England Gatew ay
Manzanillo
Altamira
Energy Bridge
Canaport
Baja
Cameron
Gulf (Pascagoula)
Sabine Cheniere
Golden Pass
Freeport
Elba
Cove
Everett
Lake Charles
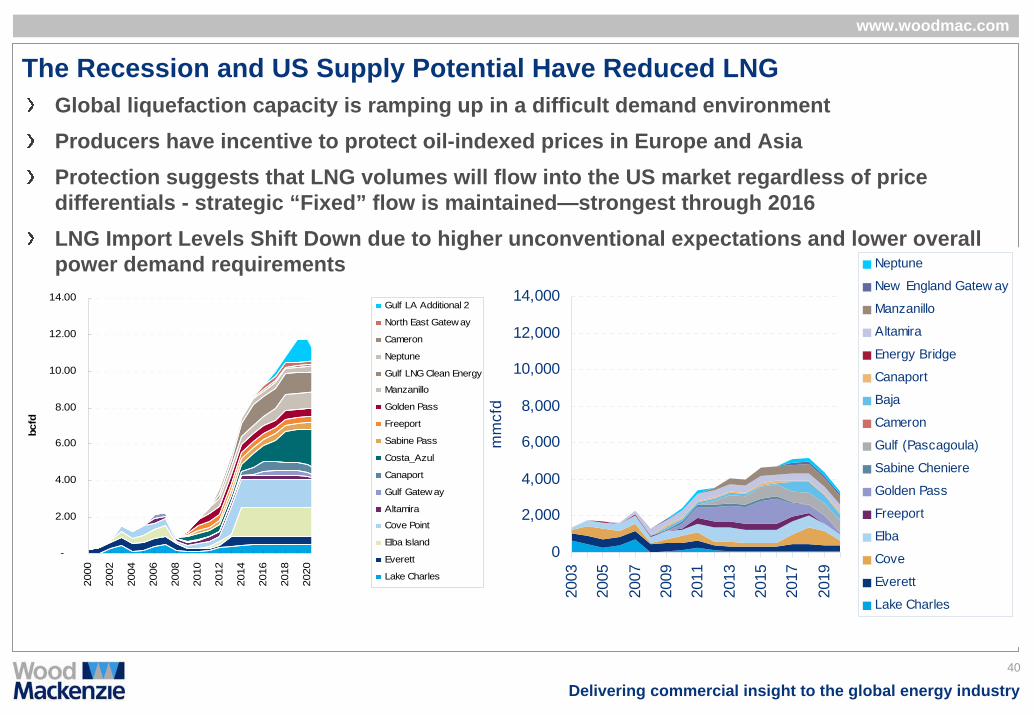
The Recession and US Supply Potential Have Reduced LNGGlobal liquefaction capacity is ramping up in a difficult demand environmentProducers have incentive to protect oil-indexed prices in Europe and AsiaProtection suggests that LNG volumes will flow into the US market regardless of price differentials - strategic “Fixed” flow is maintained—strongest through 2016 LNG Import Levels Shift Down due to higher unconventional expectations and lower overall power demand requirements
-
2.00
4.00
6.00
8.00
10.00
12.00
14.00
2000
2002
2004
2006
2008
2010
2012
2014
2016
2018
2020
2022
2024
bcfd
Gulf LA Additional 2
North East Gateway
Cameron
Neptune
Gulf LNG Clean Energy
Manzanillo
Golden Pass
Freeport
Sabine Pass
Costa_Azul
Canaport
Gulf Gateway
Altamira
Cove Point
Elba Island
Everett
Lake Charles
41
Delivering commercial insight to the global energy industry
www.woodmac.com
-
10.0
20.0
30.0
40.0
50.0
60.0
70.0
2008 2010 2012 2014
bcfd
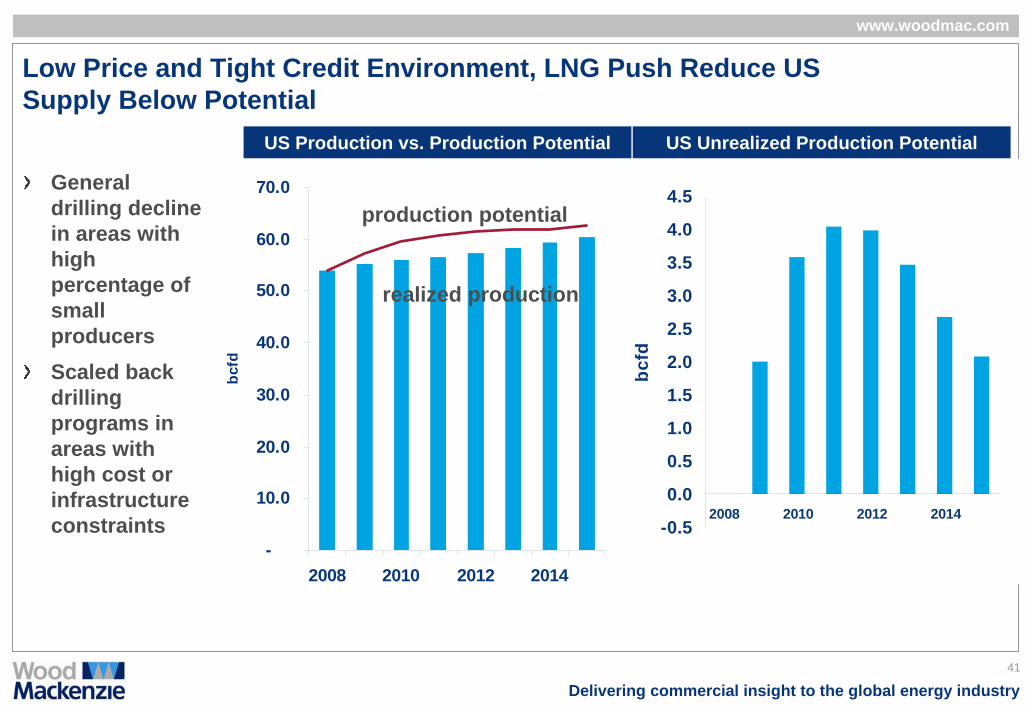
Low Price and Tight Credit Environment, LNG Push Reduce US Supply Below Potential
General drilling decline in areas with high percentage of small producersScaled back drilling programs in areas with high cost or infrastructure constraints
US Production vs. Production Potential US Unrealized Production Potential
production potential
realized production
-0.5
0.0
0.5
1.0
1.5
2.0
2.5
3.0
3.5
4.0
4.5
2008 2010 2012 2014
bcfd
42
Delivering commercial insight to the global energy industry
www.woodmac.com
Conclusions
Successful development of the recently announced shales would lead to a paradigm shift in North American supplyThe new shales benefit from technological and operational breakthroughs in existing successful shale playsSeveral other plays being tested across the country
• West Texas shales, Baxter, Hilliard, Gothic, Pierre, Niobrara, Chattanooga …..
Development of these shales ultimately depends on access to capital, operator commitment, technological improvements and commodity prices