non-energy benefits in the residential and non-residential sectors
TRANSCRIPT

2000 ACEEE Summer Study on Energy Efficiency in Buildings
NON-ENERGY BENEFITS IN THE RESIDENTIAL AND NON-RESIDENTIAL SECTORS – INNOVATIVE MEASUREMENTS AND
RESULTS FOR PARTICIPANT BENEFITS
Lisa A. Skumatz, Skumatz Economic Research Associates, Inc.Chris Ann Dickerson, Pacific Gas and Electric Company
Brian Coates, Seattle City Light
ABSTRACT
Two studies were recently completed that quantified the non-energy benefits (NEBs)from a variety of different DSM programs and used innovative methods to measurepreviously un-estimated NEBs from the participant perspective. The projects coveredsingle- and multifamily programs, as well as a commercial/industrial program. As part of thework, the authors developed program-specific (and customer class-specific) NEBs in 20categories covering “utility/ratepayer benefits”, “participant benefits”, and “environmentalbenefits”.
In particular, this paper focuses on one aspect of this research –valuing the participantside benefits. Although many authors have speculated about comfort, noise, productivity,and a wide variety of other customer benefits from programs, the authors found that therewas no information available valuing these benefits. This paper presents the results of aninnovative survey approach developed and pioneered by the author that was used to developquantitative estimates of this segment of participant-side NEBs from programs and presentsresults on the quantitative benefits as perceived by customer/participants from a variety ofprogram features and measures.
The results show that for residential programs, the value of participant benefitsoutweighs the energy savings for a number of measures. The results vary by measure andsector. On the commercial side, we were able to move beyond “case studies” and used datafrom almost 100 participants to estimate benefits. We found participant benefits fromproductivity, improved workplace aesthetics and other benefits were valued highly byparticipants, adding significant value to the programs from the customer point of view.Additional work is being conducted to refine the technique and the estimates.
CITATION
Skumatz, Lisa A., Chris Ann Dickerson, and Brian Coates. “Non-Energy Benefits in theResidential and Non-Residential Sectors—Innovative Measurements and Results forParticipant Benefits”. Proceedings from the 2000 ACEEE Summer Study on EnergyEfficiency in Buildings. Washington, DC: American Council for an Energy EfficientEconomy, August 2000 (8.353-364).

NON-ENERGY BENEFITS IN THE RESIDENTIAL AND —
NON-RESIDENTIAL SECTORS - INNOVATIVE MEASUREMENTS ANDRESULTS FOR PARTICIPANT BENEFITS
Lisa A. Skumatz, SkumatzEconomic Research Associates, Inc.Chris Ann Dickerson, Pacific Gas and Electric Company
Brian Coates, Seattle City Light
ABSTRACT
Two studies were recently completed that quantified the non-energy benefits (NEBs)from a variety of different DSM programs and used innovative methods to measurepreviously un-estimated NEBs from the participant perspective. The projects coveredsingle- and multifamily programs, as well as a commercial/industrial program. As part ofthework, the authors developed program-specific (and customer class-specific) NEBs in 20categories covering “utility/ratepayer benefits”, “participant benefits”, and “environmentalbenefits”.
In particular, this paper focuses on one aspect ofthis research —valuing the participantside benefits. Although many authors have speculated about comfort, noise, productivity,and a wide variety of other customer benefits from programs, the authors found that therewas no information available valuing these benefits. This paper presents the results of aninnovative survey approach developed and pioneered by the author that was used to developquantitative estimates of this segment of participant-side NEBs from programs and presentsresults on the quantitative benefits as perceived by customer/participants from a variety ofprogram features and measures.
The results show that, for residential programs, the value of participant benefitsoutweighs the energy savings for a number of measures. The results vary by measure andsector. On the commercial side, we were able to move beyond “case studies” and used datafrom almost 100 participants to estimate benefits. We found participant benefits fromproductivity, improved workplace aesthetics and other benefits were valued highly byparticipants, adding significant value to the programs from the customer point of view.Additional work is being conducted to refine the technique and the estimates.
Introduction
Although a number of sources in the literature address non-energy benefits in aconceptual way--usually itemizing the list of topics that might qualify as non-energybenefits--few have conducted applied research and developed quantitative estimates toidentify the size of these benefits. Certainly, for a number of years, programs have beenapproved on the basis of energy benefits alone. However, recent changes in industry avoidedcosts and increased interest in market transformation are leading to an increasing attention onincorporating what was always a logically appropriate component of the benefits and costanalysis --non-energy benefits.
Consumer Behavior and Non-Energy Effects - 8.353

Understanding the magnitude of all program benefits, including non-energy benefits,can help utilities maximize overall benefits from a particular program, or help select between —
alternative programs, holding program costs constant. By identifying all program benefits--not only to the utility, but also to customers and society—utilities (and policymakers) canconduct more complete benefit cost analyses, can develop programs that improve service tocustomers by maximizing benefits from programs, and can emphasize the benefits of thoseservices to customers.
In previous work by the authors (Skumatz and Dickerson, 1997, 1998, and 1999),’ wedeveloped an approach that assessed several dozen categories ofnon-energy benefits (NEB),sorted into three broad categories or perspectives:
• Utility, or ratepayer: we estimated the benefits from a much broader array ofbenefits categories than other work (beyond arrëarages), including reducedliabilities, fewer customer service calls, and many others.
• Participant: the work took the “next step” and developed quantitativeestimates of the non-energy benefits accruing to program participants,including health and safety, comfort, economic, housing stock, and a widerange ofother benefits.
• Societal: a combination of literature from related fields and primary researchwas used to “triangulate” on estimates of the societal benefits, includingenvironmental and job benefits, from the range ofDSM programs covered inthe projects.
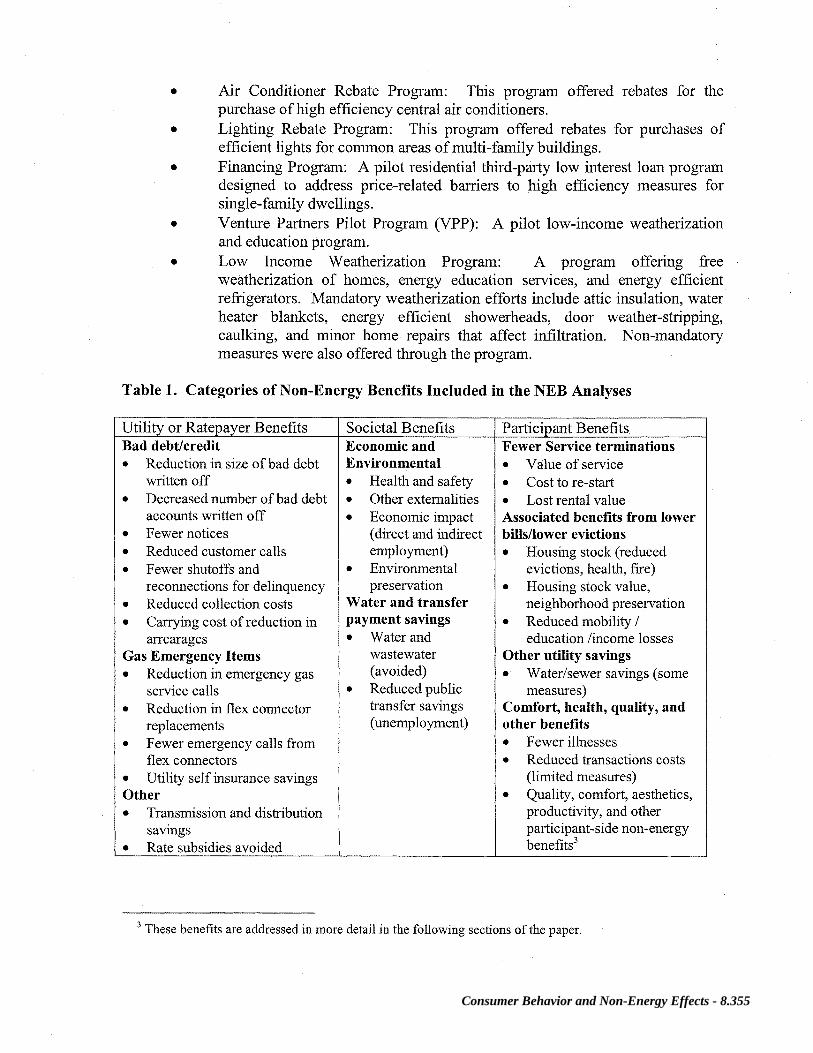
Table 1 shows the list of categories ofbenefits included in these three perspectives.In previous articles, we addressed findings associated with all these categories of benefits,but provided only preliminary information on the last benefit listed (quality, comfort, etc.).The estimates of residential program NEBs — utility-side, societal, and a portion of theparticipant benefits — can be found in these previous studies. In addition, the previous studiesexamined the value of participant benefits from fewer terminations, fewer evictions, andother utility savings. This paper summarizes only that portion of the work that developedestimates ofwhat we call here the “comfort/productivity” portion ofparticipant side benefits.
Residential Programs Evaluated
The programs analyzed covered an assortment of audiences and program types.Information on programs offered between 1994 and 1998 were modeled to compare therelative non-energy benefits between different types ofprograms. Residential programs forthe single and multi-family sectors included: 2
• Refrigerator Rebate Program: This program offered residential customersrebates when they purchased a new energy efficient, CFC-free refrigeratorthat exceeded Federal Appliance Standard. The program also included asmaller effort that provided incentives directly to salespersons.
‘And a very detailed literature review onNEBs is included in several ofthese previous studies.2 In another project, we also examined the non-energy benefits associated witha non-DSM program called
“REACH”, a program that provides bill-payment assistance to low income customers “in crisis”, and is fundedby shareholder contributions.
8.354
• Air Conditioner Rebate Program: This program offered rebates for thepurchase ofhigh efficiency central air conditioners. —
• Lighting Rebate Program: This program offered rebates for purchases ofefficient lights for common areas ofmulti-family buildings.
• Financing Program: A pilot residential third-party low interest loan programdesigned to address price-related barriers to high efficiency measures forsingle-family dwellings.
• Venture Partners Pilot Program (VPP): A pilot low-income weatherizationand education program.
• Low Income Weatherization Program: A program offering freeweatherization of homes, energy education services, and energy efficientrefrigerators. Mandatory weatherization efforts include attic insulation, waterheater blankets, energy efficient showerheads, door weather-stripping,caulking, and minor home repairs that affect infiltration. Non-mandatorymeasures were also offered through the program.
Table 1. Categories of Non-Energy Benefits Included in the NEB Analyses
Utility orRatepayer Benefits Societal Benefits Participant BenefitsBad debt/credit Economic and Fewer Service terminations• Reduction in size ofbad debt Environmental • Value of service
written off • Health and safety • Cost to re-start• Decreased number ofbad debt • Other externalities • Lost rental value
accounts written off • Economic impact Associated benefits from lower• Fewer notices (direct and indirect bifis/lower evictions• Reduced customer calls employment) • Housing stock (reduced• Fewer shutoffs and • Environmental evictions, health, fire)
reconnections for delinquency preservation • Housing stock value,• Reduced collection costs Water and transfer neighborhood preservation
• Carrying cost of reduction in payment savings • Reduced mobility /arrearages • Water and education /income losses
Gas Emergency Items wastewater Other utifity savings• Reduction in emergency gas (avoided) • Water/sewer savings (some
service calls • Reduced public measures)• Reduction in flex connector transfer savings Comfort, health, quality, and
replacements (unemployment) other benefits• Fewer emergency calls from • Fewer illnesses
flex connectors • Reduced transactions costs• Utility self insurance savings (limited measures)Other • Quality, comfort, aesthetics,• Transmission and distribution productivity, and other
savings
• Rate subsidies avoided
participant-side non-energybenefits3
These benefits are addressed in more detail in the following sections of thepaper.
Consumer Behavior and Non-Energy Effects - 8.355

Commercial/Industrial Program Evaluated
The authors evaluated a commercial and industrial program that offered a joint auditprogram — covering energy and water measures. This program was called the OperationsResource Assessment Program (ORA). The audit was followed up with a report includingrecommended retrofit or O&M changes that would lead to savings for the customers, and anaction letter. The utility also offered financial assistance for some of the recommendedmodifications. The program offered a wide range of possible measures, including HVACand duct systems, air compressors, lighting, water deduct meters, VSDs, power factorrecommendations, insulation, metering, refrigeration systems, and numerous other capitaland O&M measures. As part of the program evaluation, SERA conducted interviews withmore than 100 participants, examining satisfaction, measures implemented, reasons for notimplementing measures, and many other questions. As a special add-on to the project, SERAundertook to develop an estimate of the participant side benefits realized from the program.This would provide a more complete view of the overall benefits from the program, andcould provide information for the utility to better target and market the program in the future.
Estimating Participant Side Benefits
Based on ourprevious work in NEBs, we determined that theparticipant-side benefitswere an area that had significant potential for additional benefits. However, in our review ofprevious research work, we found this area had been virtually unstudied. We found virtuallyno work on the residential side examining this issue beyond the conceptual stage — listinghypothetical lists of types ofbenefits. On the commercial side, we found several interestingpapers that had developed estimates of productivity increases for specific programs inindividual firms. The research summarized here provided an opportunity to developvaluations from a larger number ofparticipants and variety ofmeasures and program types.
In our previous modeling efforts for the Venture Partners Pilot (VPP) program(Skumatz and Dickerson 1997, 1998, 1999), we attempted to estimate the impacts from a fewimportant categories of participant benefits using “reasonable” assumptions, for the currentstudy, we were interested in exploring possible ways to develop more refined estimates ofimportant auxiliaryparticipant benefits.
Developing Innovative Alternatives to “Willingness to Pay”
Arguably the most direct method of assessing the value of non-energy benefits tocustomers would be to ask them directly. However, the most direct form of the question(e.g., “what is the dollar value of the reduction in drafts in your home after it wasweatherized”) can be difficult for program participants and residents to answer and can leadto unreliable results. This is a “willingness to pay” approach, and there is considerableliterature establishing the validity, usefulness, and constraints of this approach (Mitchell andCarson, 1989). However; on a practical side, we find customers have difficult timesassigning dollars to softer types ofbenefits. It can be a difficult concept for customers tograsp, and when administering surveys, respondents often seem to be “guessing” at specificdollar figures.
8.356

The authors were concerned that potentially valuable benefits were beingunrecognized. As a result ofthis concern, SERA, Inc. developed an innovative approach forobtaining customers’ self-reported valuation of non-energy benefits that we hoped would beeasier and more reliably answered by participants. We found promising results. Our basicidea was to ask customers to characterize the value ofthe non-energy benefits relative to theenergy savings on their monthly energy bill.
We found that customers were quite willing to talk about these benefits and werereadily able to answer our questions about relative values. Because we had estimates of theaverage bill savings from each of the programs, we could then attribute a dollar value to thenon-energy benefits after the fact. This approach seemed to get past the customer barrier ofhaving to assign a specific dollar to any kind of benefit, but particularly to these types ofsofter benefits. This approach opened the door to discussions about the measures, thepositive and negative aspects ofprogram actions, and provided benefits that we could readilytranslate to dollar amounts.
Data Gatheringand NEBs for Residential Participant Benefits
As a first step, we reviewed the literature on benefits and assembled a list of possiblecomfort/productivity benefits that had been previously mentioned or hypothesized for eachmeasure included in the programs. Then, we added a number of potential benefits that webelieved might arise in interviews. These were used as the possible pre-coded responses.We also left many blanks so we could record customer responses that didn’t fit into the pre-coded categories. This was put in a spreadsheet format that was used to guide the interviewsand perform the calculations.
A sample of participants from each of the studied programs was contacted bytelephone. As a first step, respondents were asked to enumerate the non-energy benefits theyrecognized from the program, then asked whether they valued that benefit more than or lessthan the bill savings benefit from the program. Then, for each ofthe benefits they mentionedplus a list of 30 benefits we had prepared ahead of time, we asked respondents to tell us“how much more [less] valuable” they felt the benefit was to them than the bill savings theyexperienced (or expected) as part of the program. These answers gave us a specific valuemultiplier to use in the non-energy benefits model (e.g., “about half as valuable as the billsavings,” or “about three times as valuable as the bill savings,” “about the same as the billsavings,” etc.4) As a final step, we asked whether, in total, the non-energy benefitsassociated with the specific measure were more valuable, less valuable, or about the samevalue as the energy savings. This last item let us “scale” responses if customers provided ahigher sum through the individual items.
We also asked respondents a question about the relative importance of each of the“comfort/productivity. . .“ benefits. We reviewed the list of benefits and for each item askedrespondents to indicate how important the benefit was to them on a scale of 1-5 (with 5 beinga very important benefit). Totaling these numbers enabled us to develop a “score” for each
“We only asked residents to get as specific as “about the same”, about half again as valuable, about 3/4 asvaluable, etc. and then ran the numbers past them. This approach onlyrequired residents to get as specific aswe felt they could be on this type of issue (we wouldn’t expect an answer like 37% as valuable!) and soindividual responses were answers like 100%, 125%, 50%, 25%, etc. Average were then calculated from thesevalues, and we rounded these averages in this paper.
Consumer Behavior and Non-Energy Effects - 8.357

type of benefit and to compare the relative importance of the benefits associated with eachprogram. Following a similar procedure, we also asked about negative effects of the —
program, which were usually “none”, but did provide a few interesting comments. Wecompleted a total of almost 100 surveys with program participants, allowing us to developpreliminary estimates ofparticipant-reported value ofthese “comfort/productivity” NEBs.
The survey but illustrated some of the benefits that residents recognized from theseprograms, and provide preliminary quantitative estimates ofparticipant-side benefits to use inthe model. Our list included many dozens of possible benefits for each measure, many ofwhich were mentioned at least once by one or more respondents. The types of benefitsreported most frequently by respondents (in decreasing order of mention) are summarized inTable 2.
Table 2. Residential Participant-Side Non-Energy Benefit Categories By Type ofMeasureor Program (Source: Skumatz Economic Research Associates, Inc. surveys)
Central A/C Window measures Refrigerators Weatherization MultifamilyMeasures Lighting
• Higher Highervalue in a More Insulation was ranked • Building isvalue in house I house nicer features, in order with less nicerhouse, a Save money I bigger drafty, • Replacing lesshouse nicer lower bill / use less • Save money environmental, save frequently
• More energy I lower bill, money, andhigher Better safetyfeatures, • Feel good about use less house value, was rankedbigger, environment energy • CO monitors — very with high‘faster a House less drafty / Quieter strong feelings of value
a Save more comfort ‘ Kitchen improved safety (especially inmoney,lowerbill,use less
a May not have tomoveLess worried about
•
nicerExpect lessrepair
• Weather-strippingand caulking: greatercomfort and fewer
commonareas)
• Bill savingsa
energy bills • Environmen drafts, quieter was ranked• House less • Easier to clean tal a Greater awareness / high by this
drafty — • Windows now learned strategies sectormore open and didn’t from weatherization a Environmentalcomfort before programs benefits
• Quieter • New coatingsreduce upholsteryfading
• Lower bill• Better water flow
from new bathlfaucetreplacements
When interviewing residents and owners to gather information on their estimatedNEBs, we found that for HVAC measures, several interviewees were invalids and valuedcomfort very highly. We also asked customers if they had experienced negative effects fromthe programs or measures. The vast majority of respondents reported no negative impacts.Those that were reported are enumerated in Table 3. Refrigerators elicited the majority ofcomments.
Non-Residential (C/I) Data Collection Efforts and NEB Categories
These questions were asked as part of longer telephone interview that wereaddressing a range of topics, including:
8.358

• Satisfaction with specific program elements,• Program strengths, weaknesses, and suggested enhancements,• Decision-making issues,
• Measures implemented as part of the programs, and outside the program, and• Reasons for not implementing measures,
• Costs and assistance received for each measure implemented, and• A variety ofother questions.
Table 3. Residential Participant Reports of Negative NEBs (Source: Skumatz EconomicResearch Associates, Inc. surveys)
Refrigerators IIVAC
• Not delivering savings promised • Bill went up• Noisy, or icemaker isnoisy • Not delivering savings• Smaller, not as good as old machine promised
• Exterior material doesn’t seem as strong as old metal • Noisy• Doesn’t fit in the space
• Have to bend a lot to use refrigerator because freezers on top Windowsare larger than before • Contractors didn’t finish on
• Cold spots in the back time
• Freezer light freezes “off’• Machine too tall to clean the top easily ‘ Majority listed no negative• Sideby side hard to store things in and “boxes you in” comments
Because it was part of a longer survey, the time that could be allocated to the specialadded section on participant benefits -was relatively short. Therefore, we were not able to askabout the value of each type of benefit associated with each measure installed; rather, foreach measure installed, we asked the participant to:
• Enumerate the list of non-energy benefits they felt they received/ realized inassociation with the measures
• Tell us whether the sum of all the non-energy benefits was more valuable orless valuable to them than the energy savings for the measures. We thenasked them to assess how much more or how much less valuable the NEBswere, using multipliers.
In the case of the commercial/industrial benefits, each participant had relativelyreliable and convenient estimates of the level of energy benefits expected with each measure.This was provided in the detailed report each participant received enumerating expected costsand savings for each recommended measure. Therefore, in the non-residential case, the linkbetween value of energy savings and NEB value would be even closer to the respondent’sconsciousness than the residential estimates.
Commercial and industrial participants were surprisingly willing to provide feedbackon the non-energy benefits that they received from the variety of operational and capitalmeasures implemented over the course of the last two years. These results are summarized in
Table 4.
Consumer Behavior and Non-Energy Effects - 8.359

Other measures were also addressed, but fewer were installed, so their results are notseparately reported here. However, many of the same types of benefits were mentioned for —
variable speed drives and other equipment.
Table 4. Commercial I Industrial Participant-Side Non-Energy Benefit Categories ByType ofMeasure (Source: Skumatz Economic Research Associates, Inc. surveys)
Lighting measures HVAC measures W ater measures Refrigeration• Better lighting • Lower maintenance • Reduced water • Lower maintenance• Safety/security Longer equipment losses and bills • Longer equipment• Lower maintenance lifetimes • Greater efficiency lifetimes• Improvedwork • Greater comfort and control ofwater • Reduced noise
environment • Better air quality, use • Greatercontrol of• Better aesthetics airflow, quality • Reduced over equipment,
• Reduced glare, • Better productivity watering of temperatures, etc.eyestrain • Higher tenant landscaping • Greaterproduct life,
• Improved satisfaction • Labor savings lower losses of
productivity • Better aesthetics • Better aesthetics product• Better control • Better control • Greater tenant/ guest • Reduced water use
• Other • Environmental satisfaction • Better aesthetics• No extra benefits benefits • Better water flow
• No extra benefits -
Value ofParticipant-Valued Non-Energy Benefits
The savings estimates from the participant assessments are presented in Table 5below. The results are presented as percentage multiples to be applied to energy savingsfrom the programs. Multiplying by the energy savings for the measure provides anapproximation of the participant value of the comfort, and as potential extra value in dollarterms. The benefits are presented generally by measure, not by program, so they can beadded or not as programs include or exclude particular measures. The models we developedallow us to adjust the savings based on the percent of customers receiving particularmeasures in the programs.
Table 5. Estimated Value ofParticipant-Reported Non-Energy Benefits — Extra NEBValue as a Percent ofEnergy Savings from the Measure (Source: Skumatz EconomicResearch Associates surveys)
End Use Commercial ResidentialHVAC 100% 120%Window measures - 110%Refrigerators 25% 100%Washers - 50%(small sample*)
Weatherization - 60%Lighting 40% 100% (multifamily only)Education, associated with measure programs - 1 0%(small sample*)Water measures (comm’ 1) 60% -
Overall measures—all end uses 50% -
8.360

The results of the interviews made it clear that customers recognize a significant non-energy value to the measures implemented — beyond those traditionally recognized byprogram planners and regulators.
We find that the estimates by residential customers were consistently higher thanthose provided by commercial/industrial participants. There may be several reasons for thisresult. The commercial study was completed after the residential one, and our techniquesand clarifications with the customers had improved somewhat.
Another difference is that the commercial customers had ready access to estimates ofthe dollar value of the estimated energy savings from the measures; in fact, most had thereport in their hands as they had just been asked other questions about the proposed andimplemented measures. The residential customers did not, and many may have beenunaware of the savings from particular measures or programs. The values reported byparticipants may be influenced by whether or not they have a recollection of the dollar size ofenergy savings. Some may feel this is a concern, and we are planning to revisit and test thison the residential side. However, if dollars are used as the ultimate unit into which all valuesare translated, and if we know the value ofthe energy savings to the customer in bill savings(even if the customer doesn’t), and if the customer feels comfortable reporting the relativevalue they place on comfort benefits relative to the energy savings, the value should be arelatively appropriate estimate, regardless. However, as we mentioned, we are testingwhether differences arise in the field.5
Finally, it may be that the values are different. Residential customers may be lessbottom-line oriented than commercial businesses and/or they may place higher value on thesecomfort benefits.6
Variability in Responses and Other Issues
Customers were very willing to respond to these questions, and we were able to keeptheir focus throughout our battery of value-related questions and requests for problems (or“negative benefits”). On the residential side, there was some variation in the ranges ofbenefits assigned to specific measures. We found that those homes with invalids (we hadseveral in our sample) tended to value the comfort /draftiness and temperature control aspectsof HVAC systems more highly than other customers. There were several customers whoreported exorbitant values from some of the measures. We had one multifamily buildingreport that the safety aspects of the lighting were worth “100 times” the savings (even afterwe pressed for another value). Another thought the HVAC system benefits were 10 timesmore important than the savings.7 Excluding these responses, the greatest variation camefrom HVAC (.2 to 3 times the value) and window measures (1-4).
One reviewer also suggested that the results might differ by average bill savings or bill amount. This is aninteresting hypothesis, butwe did nothave customerbill information to conduct this analysis. It would be aninteresting exploration for future work.
6 Thismay especially be true for segments with invalids, etc. A few ofthese were captured inour surveys.
In these types of cases, we assigned their multiplier value as equal to thenext highest value in calculatingthe averages.
Consumer Behavior and Non-Energy Effects - 8.361

We provided an opportunity for customers to value individual benefits, but thecategories they provided were not always clearly exclusive of other benefits.8 For that —
reason, the numbers used in this paper are based on their responses to the final question —
overall, what would you say was the relative value of the total of NEBs compared to theenergy savings. This approach should have reduced the problems associated with double-counting individual benefits.
Effects on Assessment of Program Costs and Benefits
Residential. These participant “comfort/productivity” benefits represent significant valuewhen translated into dollar terms. Depending on the program, we found these values rangedfrom about $10 to more than $80 to the customers. Presumably, since these benefits do notgo away,9 these would translate to annual benefits.
Detailed estimates of the NEBs from each of the roughly 30 categories werecomputed for each of the single- and multi-family programs of interest and were presented inother work (Skumatz and Dickerson, 1999). Included in these estimates were participantside benefits above and beyond these “comfort/productivity” benefits, such as savings fromreduced mobility, fewer disconnection hassles, among others. We find the following effectson total NEB values and computations by including these additional participant benefits:
• Added 60% to more than 100% to the previous estimates of participant sideNEBs, depending on program.
• Consistently represented between 20% and 30% of the total NEBs for theprograms modeled, combining societal, utility, and participant perspectives.
• Led to significant improvements in overall payback calculations when allbenefits were included.
Commercial/Industrial. Seattle City Light staff prepared a detailed analysis of programenergy and water savings, and a detailed payback analysis of the ORA program (Coates,Pearson, and Skumatz, 2000). Using these figures, we find the following dollar effects fromthe inclusion of these types ofNEBs.
• Estimated NEB savings from the program in terms of value to the customers
were on the order of $170,000 per year, or $2.7 million over the measurelifetimes.
Marketing and Transformation
This work is especially important because it provides evidence on those non-energyfactors that participants value most from these programs and measures. In previous survey
As one reviewer pointed out, air conditioning benefits reported included “highervalue in house, nicer
house”, which seemedto incorporate many of the other comments. However, generally, customers assignedvalues either to the encompassing comment, or to the individual components ofthat benefits, notboth. Inaddition, we asked them to value their overall perception of (all the) non-energy benefits relative to energysavings, and these are the numbers used in this paper. This step should have excisedthis double-counting issue.
Although they may decay as measures begin to leak or become noisier over time, which might lead, us toreduce the value of the benefits over time. However, the energy savings tend to similarly decay, so themultiplier values may remain appropriate.
8.362

work, we found that market actors (e.g. contractors) insist that customers “don’t buyefficiency”. Instead, they buy services and other things. It may well be that “efficiency’~not something that some customers are very interested in buying — and this survey showed anumber of features that they recognize that they did buy. Speaking in participant valuelanguage — comfort and noise on the residential side and aesthetics, productivity,maintenance, and workplace quality on the commercial side — may resonate much morehighly with customers. Although they may receive many of these benefits whether or notthey pick efficient models, it may be important to emphasize that efficient models bring allthese benefits along with the energy savings.
In addition, dc-emphasizing “efficiency” in marketing programs, and instead focusingon some of the benefits categories identified as important in this research may be a usefultool in helping convince participants to upgrade equipment — especially when the equipmentisn’t yet broken. Efficiency may sell “green” customers, but some businesses may be muchmore swayed in their decision-making by factors like maintenance and breakdown issues,product losses, etc. Again, all new equipment brings these savings, but showing total savingsfrom the customer’s point of view using some of these comfort/productivity multipliers andadding the energy savings as well may help make the case more fully to decision-makers.
The research also gives service providers with information that can help in programmarketing and customer retention. They can emphasize these benefits when they market theprograms, can design the mix of measures to maximize benefits at a fixed program budget,and can target programs to those customers that might gain greatest benefits. The work alsohelps provide an estimate of the value of additional services provided to customers.
Summary
This specialized research fills in one of the gaps in the assessment of non-energybenefits for DSM programs. For some time, program planners have asserted that customersgain benefits from the programs that go beyond the direct energy savings (e.g., greatercomfort, improved features, lighting quality issues, etc.),
In the residential sector, comfort-related benefits were cited, and on the commercialside, a few studies have indicated there may be productivity and workplace benefits.However, few studies estimated the value ofthese benefits.
In this research, efforts were made to move beyond “conceptual” lists of benefits.SERA developed and applied an innovative approach to deriving measures of these benefits,and estimated the participant benefits for a variety ofprograms covering single-family, multi-family, and commercial/industrial customers.-
The research demonstrates that important benefits accrue not only to the utility and itsratepayers, but the results indicate that participating customers realize large benefits aboveand beyond the basic energy savings they enjoy from programs. These revised and totalNEB impacts can be examined from the utility / ratepayer, participant, or societalperspective, and the effect on program payback and other metrics is high.1°
10The primary purposes of this exploratory work were to identify whether the approachcould work, and to
develop orders of magnitude or better estimates of the value ofthese types of benefits to customers. The levelof the reported value to customers is high, and even if the estimates are reduced tobe conservative (since we didnothave very large sample sizes), the dollar value to customers is significant.
Consumer Behavior and Non-Energy Effects - 8.363

These benefits could potentially play an important role in program targeting andoutreach. Rather than continuing to focus on “efficiency” in marketing efficient measures —
and programs, the marketing might instead focus on those features that are highly valued bythe participants themselves, and mention efficiency as an additional bonus. This may bemore effective in achieving turnover to efficient equipment.
In addition, the estimates provide useful information for program design andtargeting. The work, and the scenario and modeling approaches described for the programscan be used to optimize programs by examining program design alternatives to maximizebenefits to customers,1’ keeping program costs constant.
Finally, based on the results of the estimation process, we have identified areas thatwe are pursuing in continuing work in this area ofNEBs. As part of the remaining projectefforts, we are focusing on:
• Refining the survey approach and refining the customer participant survey totest different versions of the valuation to variations in the way in which thequestions are phrased.
• Testing whether residential valuation responses would vary if customers wereprovided with average dollar values for savings from the measures.
• Modeling additional programs, including education/information programs.This survey approach showed good promise for getting reasonable estimates of
comfort/productivity benefits — in both residential and commercial/industrial sectors.Customers seemed to be comfortable providing “relative” values, and we can “benchmark”by using the average energy savings for the program participants. The value of the benefitsis significant, and makes it clear that customers see good benefits from these programs thatgo well beyond the energy savings.
References
Coates, Brian, Dennis Pearson, and Lisa A. Skumatz. 2000. A Process and ImpactEvaluation of the Operation Resource Assessment Service. Seattle City Light,Seattle, Washington.
Mitchell, Robert Cameron, and Richard T. Carson. 1989. Using Surveys to Value Public -
Goods, Resources for the Future, San Francisco, California.Skumatz, Lisa A., Ph.D., 1997. Recognizing All Program Benefits: Estimating the Non-
Energy Benefits of PG&E~ Venture Partner’s Pilot Program (VPP), 1997 EnergyEvaluation Conference, Chicago, Illinois.
Skumatz, Lisa A., Ph.D. and Chris Ann Dickerson, 1998. Extra! Extra! Non-EnergyBenefits of Residential Programs Swamp Load Impacts!”, 1998 ACEEE ConferenceProceedings, Asilomar, California, August.
Skumatz, Lisa A., Ph.D., and Chris Ann Dickerson, 1999. What Do Customers Value? WhatBenefits Utilities? Designing to Maximize Non-Energy Benefits from EfficiencyPrograms in the Residential Sector, 1999 Energy Evaluation Conference, Denver,August.
‘~Or the utilitycould work to maximize combined benefits to society, the utility and participants if these
results are combined with the estimates of benefits from other perspectives presented in previously publishedwork (Skumatz and Dickerson, 1999)
8.364