non-game fish species distribution and habitat associations in the
TRANSCRIPT

NON-GAME FISH SPECIES DISTRIBUTION AND HABITAT ASSOCIATIONS
IN THE UPPER SNAKE RIVER BASIN OF IDAHO
Report Period July 1, 2011 to June 30, 2012
Kevin A. Meyer, Principal Fisheries Research Biologist James A. Lamansky, Jr., Senior Fisheries Research Biologist
Daniel J. Schill, Fisheries Research Manager Donald W. Zaroban (Idaho Department of Environmental Quality)
IDFG Report Number 12-01
January 2012

NON-GAME FISH SPECIES DISTRIBUTION AND HABITAT ASSOCIATIONS
IN THE UPPER SNAKE RIVER BASIN OF IDAHO
ANNUAL PERFORMANCE REPORT
By
Kevin A. Meyer James A. Lamansky, Jr.
Daniel J. Schill Idaho Department of Fish and Game
600 South Walnut Street P.O. Box 25
Boise, ID 83707
and
Donald W. Zaroban
Idaho Department of Environmental Quality 1410 N. Hilton Street Boise, Idaho 83706
IDFG Report Number 12-01 January 2012

i
TABLE OF CONTENTS Page
ABSTRACT ................................................................................................................................... 1
INTRODUCTION .......................................................................................................................... 2
METHODS .................................................................................................................................... 3
Study area .................................................................................................................................. 3 Fish Sampling ............................................................................................................................ 4 Stream Habitat Conditions ......................................................................................................... 5 Approximating Abundance ......................................................................................................... 5 Data Analyses ............................................................................................................................ 6
RESULTS ..................................................................................................................................... 7
DISCUSSION ................................................................................................................................ 9
RECOMMENDATIONS ............................................................................................................... 13
ACKNOWLEDGEMENTS ........................................................................................................... 14
LITERATURE CITED .................................................................................................................. 15

1
ABSTRACT
The distribution and abundance of game fish populations are often closely monitored, whereas sampling of non-game species is typically neglected. We used a broad-scale salmonid sampling project to simultaneously assess the distribution and relative abundance of non-game fish species in small streams (i.e., ≤ 15 m wetted width) in the Snake River basin of southern Idaho, and to relate their distribution and abundance to stream habitat conditions in the study area. Of the 1,738 reaches surveyed, 586 were dry or contained too little water to support fish, and an additional 193 wet reaches did not contain any fish. At least one species of non-game fish was captured at 525 stream reaches, and all 18 native non-game fish species believed present in study area streams were captured. The most widely distributed species was speckled dace Rhinichthys osculus (present in 21% of surveyed reaches, excluding dry and nearly sites), followed by bridgelip sucker Catostomus columbianus (19%), Paiute sculpin Cottus beldingi (15%), and redside shiner Richardsonius balteatus (13%), whereas the species least often present (≤1%) were leopard dace Rhinichthys falcatus and peamouth Mylocheilus caurinus. Common carp Cyprinus carpio (captured at three locations) and oriental weatherfish Misgurnus anguillicaudatus (two locations) were the only non-native non-game species encountered. Catostomids and cyprinids generally formed a composite fish assemblage that was associated with higher stream order (i.e., farther from headwaters), lower elevation, and lower stream gradient reaches where streams were wider and deeper. Stream order was the strongest loading factor for canonical correlations constructed for study reaches both above and below Shoshone Falls, suggesting that the increased abundance of catostomids and cyprinids generally occurred on a longitudinal downstream gradient. Biologists sampling game fish populations in streams should also record data on non-game species to more closely monitor their status through time.
Authors:
Kevin A. Meyer, Principal Fisheries Research Biologist
James A. Lamansky, Jr., Senior Fisheries Research Biologist
Daniel J. Schill, Fisheries Research Manager
Donald W. Zaroban, Scientist (Idaho Department of Environmental Quality)

2
INTRODUCTION
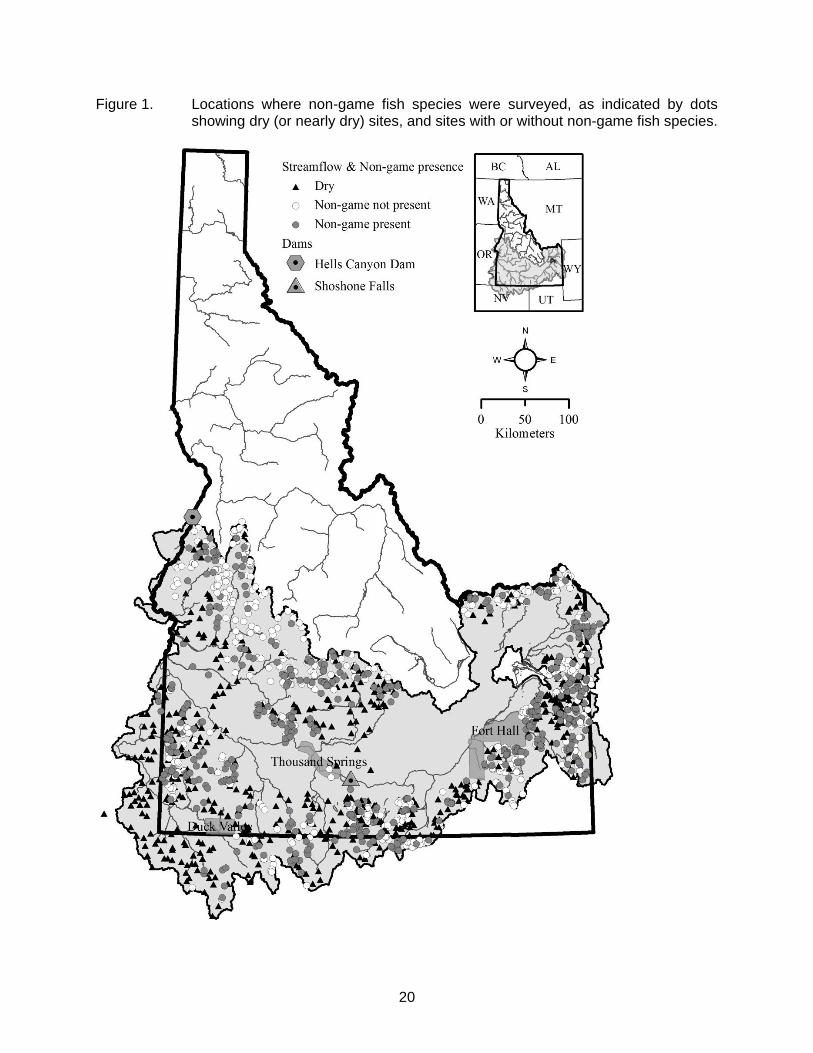
The Snake River basin above Hells Canyon Dam comprises approximately 58% of the land surface area of the state of Idaho (Figure 1). Since settlement in the 1800s by humans of European descent, aquatic resources in the Snake River basin, like the rest of western North America, have undergone extensive alterations due to hydropower, agriculture, grazing, mining, logging, and other extraction-based land uses. Despite these impacts, the only fish species that have been extirpated from the Snake River basin in southern Idaho are anadromous species (salmon and lamprey) whose passage has been blocked by dams lacking fish ladders. Due to their sport-fishing and aesthetic value, native game fish populations in the basin have been closely monitored (e.g., Meyer et al. 2006, 2009; High et al. 2008; Schill 2009), in part so that management practices such as harvest regulations can be adjusted if fish population metrics indicate changes are needed. Rarely are the economic or intrinsic values of native non-game fish species altered by the recreational community, thus management regulations for native non-game species have rarely been necessary and population monitoring has rarely been conducted. This lack of information is an impediment to understanding the conservation status of many native non-game fish species in Idaho (Idaho Department of Fish and Game 2007).
The Snake River basin above Hells Canyon Dam historically supported 26 native fish
species (Simpson and Wallace 1982), 20 of which are considered non-game species. Fish distribution patterns in the Snake River basin have been influenced by numerous climatic and geologic events. Smith (1978) argued that the predominant factors affecting fish fauna patterns in the intermountain region of the western United States are the degree of isolation between basins, and the late Cenozoic history of fluctuating wet and dry periods, which also included glaciation. In addition, late Pleistocene volcanic activity in the region repeatedly altered drainage patterns and may have exterminated some or all fishes from the upper Snake River basin (Hubbs and Miller 1948; Johnson 2002). Shoshone Falls, a 65-m high waterfall on the Snake River at river kilometer 992 (Figure 1), formed 2-3 million years ago and precluded the invasion of many Columbia River fish species (such as redband trout Oncorhynchus mykiss gairdneri and northern pikeminnow Ptychocheilus oregonensis) into the upper drainages of the Snake River basin. Taken collectively, these processes form a multifaceted history of hydrologic isolation, diversion, and reconnection, which has resulted in a complex pattern of fish distribution in the Snake River basin.
Overlaying this complex hydrologic history is the fact that fish distribution patterns are
also affected by combinations of local biotic and abiotic factors and associated regional factors that determine how suitable stream reaches are for particular species (Angermeier and Winston 1998; Hughes et al. 2006). For example, stream size, elevation, channel gradient, water temperature, and substrate composition have commonly been shown to influence the distribution and relative abundance of non-game fish species across North America (e.g., Grossman et al. 1998; Quist et al. 2004a, 2004b; Torgersen et al. 2006; Rashleigh et al. 2005). Understanding fish distribution patterns across the landscape and mechanisms that influence fish assemblages can contribute important knowledge for management and conservation purposes. For instance, a common purpose of developing relationships between fish assemblages and stream habitat conditions is to develop indices of biological integrity to assess environmental quality in flowing waters (e.g., Mebane et al. 2003), or to help facilitate preservation and rehabilitation of riverine ecosystems (e.g., Scott and Hall 1997; Hughes et al. 1998).
Information regarding species assemblages and stream habitat conditions across the
landscape is especially lacking in the intermountain region of the western United States (Quist

3
et al. 2004a), where fish assemblages are relatively depauperate compared to streams in eastern North America (Lee et al. 1980). Establishing relationships between stream-dwelling fish and their environment is often problematic because these types of studies are often focused at small scales (Faush et al. 1988). Although they may adequately describe fish distribution or abundance patterns within a particular study area, small-scale studies may have limited ability to explain patterns across the landscape if inadequate sample sizes failed to fully characterize fish-habitat associations, or the limited study area was not representative of other areas of a species’ range.
The primary objective of this paper was to help fill the aforementioned data gap
regarding the distribution and abundance of non-game fish (native and non-native) species in the Snake River basin above Hells Canyon Dam. To accomplish this, we used field crews deployed to collect data on stream-dwelling salmonids across the landscape to simultaneously gather quantitative information on non-game species occupying lotic environments in the study area. Because little work has been done in the Snake River basin in southern Idaho to describe fish-habitat associations for non-game fish species, a second objective was to assess which stream habitat conditions were associated with the distribution and relative abundance of these species. Our large, spatially balanced sample size (over 1,700 stream surveys) over a broad spatial scale helped circumvent the aforementioned fish-habitat study limitations.
METHODS
Study area
The Snake River in Idaho flows approximately 1,000 km from east to west across southern Idaho, then flows north to the confluence with the Columbia River. The study area included most of the Snake River basin (approximately 84,000 km2) above Hells Canyon Dam (Figure 1). We excluded the Malheur River, Powder River, Burnt River, and Pine Creek drainages because they reside entirely in Oregon, and also excluded the Snake River drainage in Wyoming (upstream of Palisades Reservoir) except for those tributaries that were contained at least in part within Idaho. Similarly, Nevada and Oregon basins were included if they were contained at least in part within Idaho. Within Idaho, we did not sample the Lost River drainages (Birch Creek, Little Lost River, Big Lost River), or streams located within the boundaries of the Duck Valley and Fort Hall Indian reservations (Figure 1). We also excluded the copious springs directly adjacent to the Snake River in south-central Idaho, known as the Thousand Springs, for two reasons. First, they represent very unique habitat in the study area, and many springs are actually more lentic type habitats rather than streams. Also, most of these springs are immediately adjacent or within very close proximity to the Snake River, and species presence is often more strongly influenced by the fish assemblage of the Snake River rather than the habitat characteristics of the spring.
Within this study area, native non-game fish species include five catostomids (bluehead
sucker Catostomus discobolus, bridgelip sucker Catostomus columbianus, largescale sucker Catostomus macrocheilus, mountain sucker Catostomus platyrhynchus, and Utah sucker Catostomus ardens); nine cyprinids (chiselmouth Acrocheilus alutaceus, leopard dace Rhinichthys falcatus, longnose dace Rhinichthys cataractae, northern leatherside chub Lepidomeda copei, northern pikeminnow, peamouth Mylocheilus caurinus, redside shiner Richardsonius balteatus, speckled dace Rhinichthys osculus, and Utah chub Gila atraria); and four cottids (mottled sculpin Cottus bairdi, Paiute sculpin Cottus beldingi, shorthead sculpin Cottus confusus, and Wood River sculpin Cottus leiopomus). Shoshone sculpin Cottus greenei

4
are also native to the study area but only occur in the Thousands Springs area of south-central Idaho, not in any particular river drainages. Pacific lamprey Entosphenus tridentata were native below Shoshone Falls but were extirpated from the study area long ago by a series of ladder-less dams built on the Snake River and many tributaries.
Fish Sampling
Between 1999 and 2005, we surveyed stream reaches throughout the Snake River basin in southern Idaho from mid June to mid October, once high spring flows had receded. Study reaches were distributed randomly across a 1:100,000 scale stream network in 1st through 6th order streams (Strahler 1964) based proportionally on the length of stream within each stream order stratum. However, streams that were greater than 15 meters wide (mean wetted width) or 1 meter deep (average depth) were excluded so that backpack electrofishing could be used to collect fish. These exclusions eliminated 3% of the randomly drawn samples, but were necessary because the wide stream width and deeper water reduced our ability to efficiently collect small non-game fish, making fish capture data unreliable at these locations.
We attempted to sample 100 linear meters of stream at each survey location, but due to
stream conditions, riparian vegetation, and our ability to set lower and upper blocknets, study reaches ranged from 25 to 337 m in length (average = 98 m). Blocknets (7-mm mesh size) were installed to prevent fish movement out of the site during sampling.
We collected fish with Smith-Root Model 15D backpack electrofishers at settings of 1-3
ms pulses, 30-60 Hz, and 200-700 volts. One to four electrofishing passes were conducted using 1-3 electrofishers (depending on stream size, water volume, and stream gradient) to deplete salmonids for population estimation. At the same time, non-game fish species were netted, identified to species, and a subsample were measured for total length (mm) and weight (g). Non-game fish species were not depleted, but rather, an index of abundance was approximated by visually estimating the numerical abundance of each species while electrofishing. Often this was accomplished by netting each non-game fish observed, but at sites where some species were highly abundant, estimates of abundance for some species were approximated by counting fish of that species as they were stunned, without netting every fish. After all the passes were completed, we used a scale similar to Grossman et al. (1998) to categorize each species (at a scale of 100 linear meters of stream, which was about our average reach length) as absent (0), sparse (1-10), common (10- 50), or abundant (50-100, or more).
We vouchered a total of 981 non-game fish specimens from 107 study reaches
throughout the study area to corroborate our identifications of fish species. Vouchered specimens were preserved in 10% formalin and were later identified by zoological staff at the Orma J. Smith Museum of Natural History. Field crews identified species correctly 86% of the time, and most errors involved incorrectly identifying Paiute or shorthead sculpin as mottled sculpin. Because the non-sculpin error rate was low (6%), we assumed our occupancy (i.e., present or absent) and relative abundance data were correct for all species except sculpin. We corrected errors for these three sculpin species at sites where vouchers were collected. In addition, we collected an additional 409 sculpin specimens from 41 additional study reaches to verify sculpin species distribution in the study area. Finally, the database of vouchered sculpin specimens at the Orma J. Smith Museum (n = 1,361 records for the study area) was used to corroborate any further questionable identifications.

5
Stream Habitat Conditions
We assessed several stream habitat conditions that we felt could potentially influence non-game fish occurrence or abundance at a study reach. Elevation (meters) was determined from USGS 1:24,000 scale maps for the downstream end of each site, based on coordinates obtained from GPS units. Stream gradient (percent) was estimated using the software All Topo Maps Version 2.1 for Windows (iGage mapping Corporation, Salt Lake City, Utah) by tracing (at 1:24,000 scale) the length of stream between two or three contour lines incorporating the site (approximately 1 km) and dividing the stream length by the elevation change between the contour lines. Specific conductivity (μS/cm) was measured with a calibrated, handheld conductivity meter accurate to ± 2%.
Ten equally spaced transects were established throughout each sample site and were
used for the remaining measurements. Average stream wetted width (m) was calculated from the ten transect readings. Across transects, mean water depth was estimated by measuring depth at 1/4, 1/2, and 3/4 distance across the channel, and the sum of the measurements was divided by four to account for zero depths at the stream margins for trapezoidal-shaped channels (Arend 1999). From these measurements we calculated the width:depth ratio. Substrate composition was visually estimated as the percent of stream bottom within one meter of each transect that was comprised of silt (<0.06 mm, diameter of b axis), sand (0.06–1.99 mm), gravel (2-63 mm), cobble (64-249 mm), boulder (250-3,999 mm), or bedrock (>4,000 mm). However, to reduce the number of independent variables considered in our analyses, silt, sand, and bedrock were discarded because they were heavily skewed toward zeros or low values. Cobble and boulder substrate likely affect many fishes in a similar manner (Allan 1995) and were therefore combined into one percentage. Percent unstable banks and stream shading were also visually estimated within one meter of each transect. All ocular estimates were averaged across all transects yielding an overall mean for each study reach.
One additional stream condition that was considered to potentially affect occupancy and
relative abundance of non-game fish species was trout density in the stream reach. In our study area we encountered rainbow trout Oncorhynchus mykiss, cutthroat trout O. clarkii, brook trout Salvelinus fontinalis, bull trout Salvelinus confluentus, and brown trout Salmo trutta, all of which prey on non-game fish species in some stream settings (Scott and Crossman 1973; Wydoski and Whitney 2003). Consequently, we pooled the abundance of all trout as an additional stream condition that may have influenced the distribution and abundance of non-game fish species in our study area.
Approximating Abundance
Capture efficiency is generally low for most stream-dwelling non-game fish species using backpack electrofishers (e.g., Reynolds et al. 2003; Burns 2007; Reid et al. 2008). We therefore assumed that when indexing fish abundance, we only observed or captured a fraction of the total number of fish of each species in any given electrofishing pass. Accordingly, we rounded each abundance index value up to the upper end of the category (e.g., all “sparse” delineations were given an abundance value of 10).
We approximated total abundance for each species within each major river drainage
using the stratified random sampling formulas from Scheaffer et al. (1996). We first summed the total length of stream for each stream order (or stratum) using the ArcView® geographic information system (GIS), and divided this total by 100 meters of stream (our typical study site length) to calculate the number of sampling units (Ni) in each stratum (Li). Our abundance index

6
estimates were also standardized to density per 100 linear meters of stream. We then
calculated a mean abundance ( y i) for each species within each stream order (stratum), with an
associated variance. For total population size (Ncensus), we used the formula:
1
L
census i i
i
N N y
and for variance of Ncensus we used the formula:
1
²( ) ²
Li i i
census i
i ii
N n sV N N
N n
where si² is the variance of the observations in stratum i, and ni is the sample size within stratum i. From this, we calculated 90% confidence intervals (CIs) around the abundance approximations. All sample sites, including dry and fishless sites, were included in these approximations. Because many (about 90%) of the sixth-order streams had been excluded because they were greater than 15 m wide, we did not approximate abundance for sixth-order streams.
Abundance approximations developed from the relative abundance categories may have been biased to an unknown extent. To assess this level of bias, we compared the approximations developed herein for Wood River sculpin to estimates previously made for Wood River sculpin by Meyer et al. (2008), which were based on multiple-pass depletion estimates rather than the indices of abundance described above.
Data Analyses
For the nine species who occupied at least 30 study reaches, we assessed the relationship between stream habitat conditions and the relative abundance of non-game fish species with logistic regression analyses. A benefit of using logistic regression analysis is that this technique does not require that variables be normally distributed or of equal variance (Tabachnick and Fidell 1989). We assessed multicollinearity in the independent variables by calculating variance inflation factors (VIFs), all of which were less than 5.0, indicating that multicollinearity was low in our data set (Menard 1995). Moreover, correlations coefficients (r) between independent variables were >0.40 for only two comparisons (stream width vs. stream depth, r = 0.53; stream width vs. width:depth ratio, r = 0.58).
Separate logistic regression models were constructed for each species. For the
response variable, we assigned index values to the relative abundance data (0 = absent; 1 = sparse; 2 = common; 3 = abundant) and to the occupancy data (0 = absent; 1 = present) and produced models for each, but because the results were nearly identical we only present the occupancy models. Stepwise methods were used for including independent variables in the
models, and adjusted R² for discrete models (hereafter termed 2R ; Nagelkerke 1991) was used
to assess the amount of variation explained by the models. Only first-order interactions were tested for significance, and they were rarely significant for the best models. To reduce type-I error rate inflation caused by the inclusion of multiple independent variables in multiple individual logistic regressions, we set α = 0.01 for stepwise inclusion. For each species we only included in our analyses those study reaches within the native distribution for that particular species. We used the Hosmer and Lemeshow goodness of fit test to ensure the data

7
adequately fit logistic regression models for each species, and this test failed to reject the fit of any of our final models. We used the estimate of the area under the receiver operating characteristic (ROC) curve to assess the predictive ability of the final models (Hanley and McNeil 1982). We did not include any quadratic terms because species occupancy data was not parabolic in shape when plotted against any stream habitat conditions.
In addition to the above logistic regression analyses, we used canonical correlation
analyses to relate the suite of stream habitat conditions to the relative abundance of all non-game fish species simultaneously. Canonical correlation analysis is a multivariate statistical model that facilitates the study of relationships among a set of multiple dependent variables and multiple independent variables, and reduces the concern of committing type I errors due to conducting multiple statistical tests on the same independent variables (thus we relaxed α to 0.05). It is therefore an ideal analytical tool for elucidating relationships between biological assemblages of species and their environment (ter Braak and Verdonschot 1995).
The relative abundance data (upwardly rounded) were square-root transformed prior to
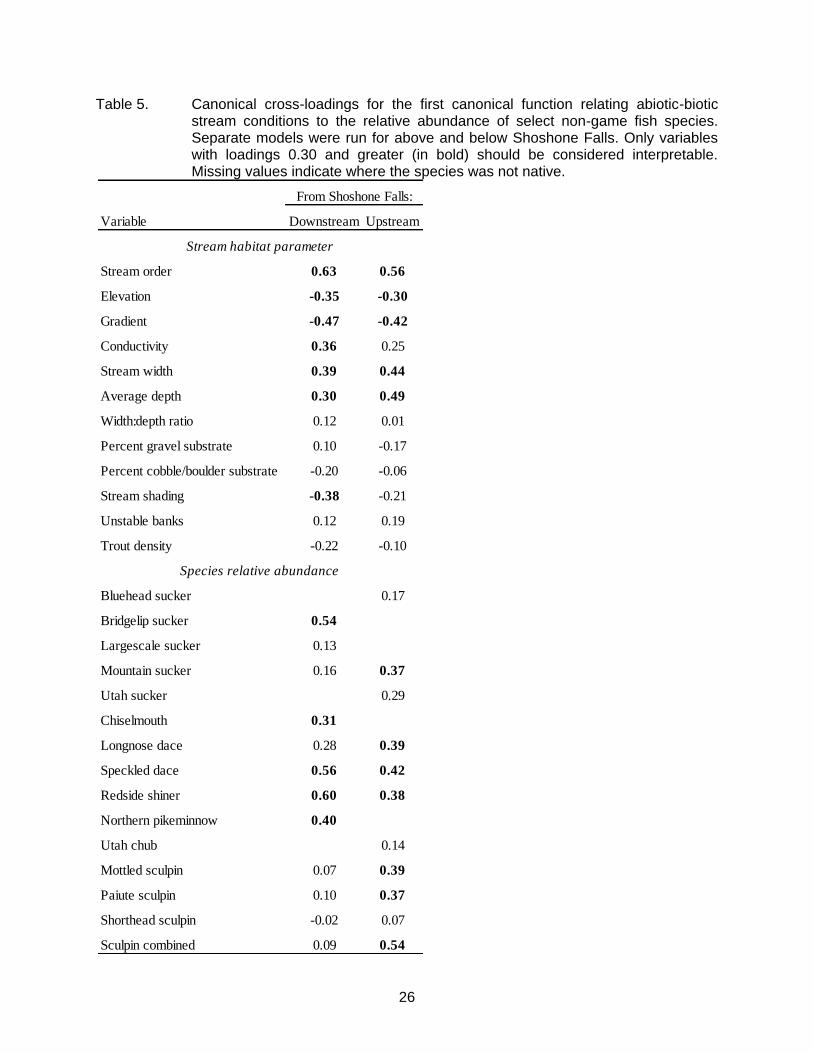
model construction to increase linearity (i.e., moderate skewness) in the fish-habitat relationships. As recommended by Hair et al. (1998), we interpreted relationships between fish and habitat parameters using canonical cross-loadings, and used loading values of 0.3 and greater to indicate which parameters were robust contributors for each canonical function that was interpretable (Tabachnick and Fidell 1989). Because the native distribution of several species was interrupted by Shoshone Falls, we conducted separate canonical correlation analyses for above and below the falls. All statistical analyses were performed with SAS statistical software (SAS Institute Inc. 2009).
Within the study area, four species of sculpin occur, one of which (Wood River sculpin)
is endemic only to the Big Wood River drainage. Fish-habitat relationships have already been developed for this species (Meyer et al. 2008) based on data collected as part of this study; therefore, we did not include this species in our analyses. Although the remaining three species of sculpin (mottled, Paiute, and shorthead) sometimes have disparate habitat preferences and distribution patterns (Peden et al. 1989; Quist et al. 2004c), in the Snake River basin of southern Idaho they appear to fill a similar habitat niche across the landscape, with allopatric-sympatric distribution patterns that appear to be somewhat indiscriminate within and among drainages. Thus, although we modeled each species separately, we also combined all sculpin species into one metric to assess whether this combination better described the distribution and abundance of sculpin in the study area, compared to what was ascertained for individual species.
RESULTS
A total of 1,738 reaches were surveyed in small streams in the Snake River basin above Hells Canyon Dam. Stream characteristics varied widely at the study reaches we sampled (Table 1), ranging from 696 to 2,964 meters in elevation, 0.1 to 32.5% in gradient, and 4 to 1,585 µS/cm in specific conductivity. Of the reaches surveyed, 30% were in 1st order streams, 39% were 2nd order, 22% were 3rd order, 7% were 4th order, and <3% were 5th and 6th order.
Of the 1,738 reaches surveyed, 586 were dry or nearly dry (i.e., contained too little water
to support any fish species; Table 2). An additional 193 reaches also did not contain any fish, although flowing water was present during sampling. At least one species of non-game fish was captured at 525 stream reaches. All 18 native non-game fish species still present in the study area were captured during our surveys.

8
The most widely distributed species was speckled dace (detected in 21% of surveyed
reaches where they were potentially native, excluding dry and nearly dry sites; Tables 2 and 3), followed by bridgelip sucker (19%), Paiute sculpin (15%), redside shiner (13%), shorthead sculpin (12%), and mottled sculpin (12%). Wood River sculpin were detected in 49% of the surveyed reaches within their native range, excluding dry and nearly dry sites, but were native to only one river drainage. Species found in ≤1% of the reaches where they were potentially native included leopard dace and peamouth, whereas northern leatherside chub, largescale sucker, Utah chub, and bluehead sucker were found in ≤2% of the reaches where they were potentially native.
Common carp Cyprinus carpio and oriental weatherfish Misgurnus anguillicaudatus were
the only non-native non-game fish species encountered during our surveys. Common carp were captured at one location each in the Rock Creek (Twin Falls), Portneuf River, and Boise River drainages. Oriental weatherfish were caught at two locations in the Boise River drainage, including one site that also contained common carp. These two species were categorized as ‘sparse’ at each location where they were captured, and were too rare to include in our statistical analyses.
When present, redside shiners were most often categorized as ‘abundant’ (59% of the
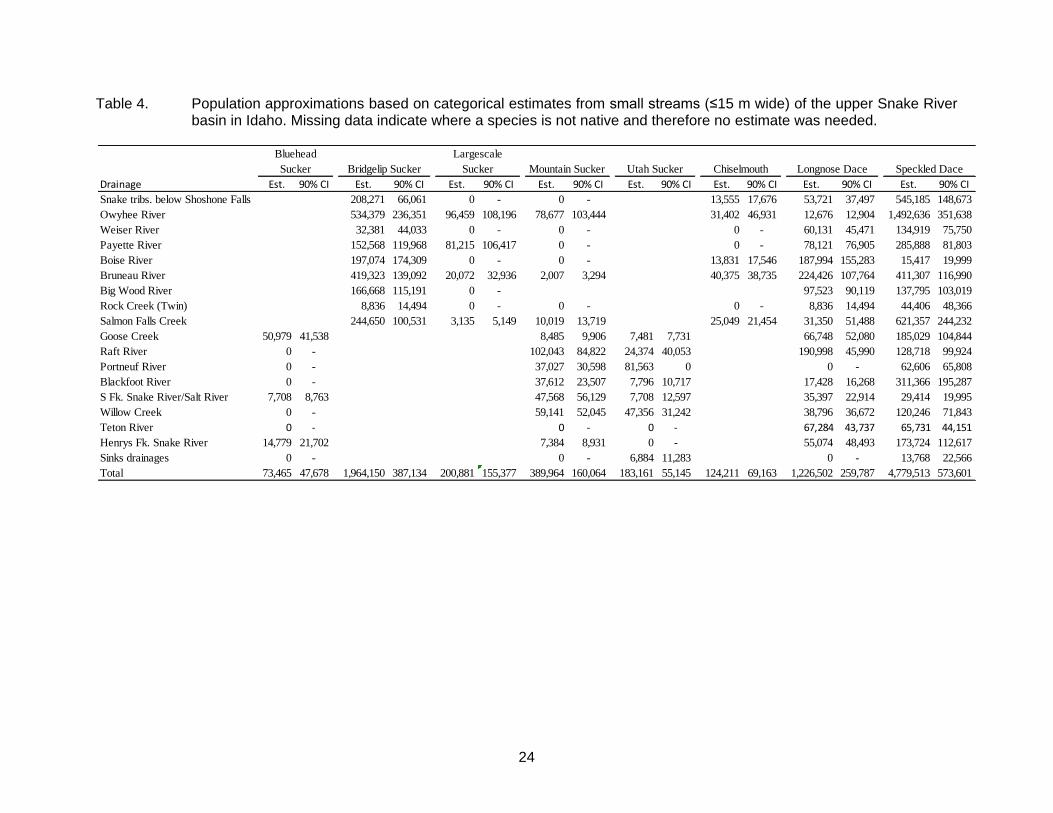
reaches in which they were captured; Table 3), as were speckled dace (55%), and all species of sculpin (on average, 50% of the time). Commonly occurring species that were rarely categorized as ‘abundant’ included bluehead sucker (10%), mountain sucker (15%), chiselmouth (21%), and northern pikeminnow (22%). Speckled dace appeared to be the most abundant non-game fish species (Table 4), with an approximate abundance of nearly 4.8 million fish in the upper Snake River basin. Redside shiner was next most abundant at 3.1 million. Shorthead sculpin was the most abundant cottid and bridgelip sucker was the most abundant catostomid.
The canonical correlation model constructed for species occurring below Shoshone Falls
yielded twelve canonical functions, which collectively produced a statistically significant model
(Wilks’ = 0.27, F144, 4307 = 4.91, P <0.0001) that explained a combined 73% of the variance shared between the variable sets across all functions. However, dimension reduction analysis indicated that only the first four functions (with squared canonical correlations of 0.49, 0.18, 0.16, and 0.11) explained a significant (at α = 0.05) amount of shared variance between the variable sets. Moreover, only the first function contained variables with cross-loadings of 0.30 and greater, which were thereby considered interpretable. This function explained 49% of the shared variance between the variable sets, and indicated that the relative abundance of several species, including redside shiner, speckled dace, bridgelip sucker, northern pikeminnow, and chiselmouth, were all positively related to an increase in stream order (i.e., farther from headwaters), stream width, mean depth, and conductivity (Table 5). These species were all negatively related to stream gradient, stream shading, and elevation.
For species occurring above Shoshone Falls, the canonical correlation model was
strikingly similar, yielding twelve canonical functions which collectively produced a statistically
significant model (Wilks’ = 0.33, F132, 4290 = 4.91, P <0.0001) that explained a combined 67% of the variance shared between the variable sets across all functions. Dimension reduction analysis indicated that the first four functions (with squared canonical correlations of 0.47, 0.15, 0.09, and 0.09) explained a significant amount of shared variance between the variable sets, but once again, only the first function contained variables with cross-loadings 0.30 and greater. This function explained 47% of the shared variance between the variable sets, and indicated that the
9
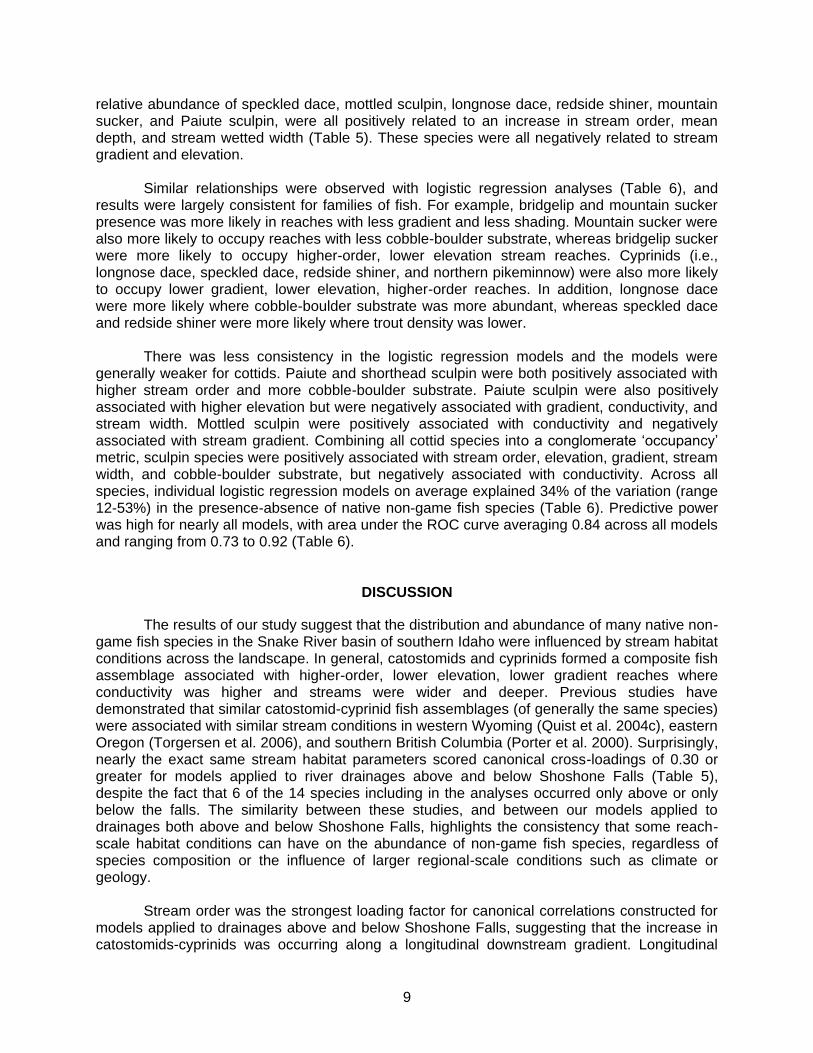
relative abundance of speckled dace, mottled sculpin, longnose dace, redside shiner, mountain sucker, and Paiute sculpin, were all positively related to an increase in stream order, mean depth, and stream wetted width (Table 5). These species were all negatively related to stream gradient and elevation.
Similar relationships were observed with logistic regression analyses (Table 6), and
results were largely consistent for families of fish. For example, bridgelip and mountain sucker presence was more likely in reaches with less gradient and less shading. Mountain sucker were also more likely to occupy reaches with less cobble-boulder substrate, whereas bridgelip sucker were more likely to occupy higher-order, lower elevation stream reaches. Cyprinids (i.e., longnose dace, speckled dace, redside shiner, and northern pikeminnow) were also more likely to occupy lower gradient, lower elevation, higher-order reaches. In addition, longnose dace were more likely where cobble-boulder substrate was more abundant, whereas speckled dace and redside shiner were more likely where trout density was lower.
There was less consistency in the logistic regression models and the models were
generally weaker for cottids. Paiute and shorthead sculpin were both positively associated with higher stream order and more cobble-boulder substrate. Paiute sculpin were also positively associated with higher elevation but were negatively associated with gradient, conductivity, and stream width. Mottled sculpin were positively associated with conductivity and negatively associated with stream gradient. Combining all cottid species into a conglomerate ‘occupancy’ metric, sculpin species were positively associated with stream order, elevation, gradient, stream width, and cobble-boulder substrate, but negatively associated with conductivity. Across all species, individual logistic regression models on average explained 34% of the variation (range 12-53%) in the presence-absence of native non-game fish species (Table 6). Predictive power was high for nearly all models, with area under the ROC curve averaging 0.84 across all models and ranging from 0.73 to 0.92 (Table 6).
DISCUSSION
The results of our study suggest that the distribution and abundance of many native non-game fish species in the Snake River basin of southern Idaho were influenced by stream habitat conditions across the landscape. In general, catostomids and cyprinids formed a composite fish assemblage associated with higher-order, lower elevation, lower gradient reaches where conductivity was higher and streams were wider and deeper. Previous studies have demonstrated that similar catostomid-cyprinid fish assemblages (of generally the same species) were associated with similar stream conditions in western Wyoming (Quist et al. 2004c), eastern Oregon (Torgersen et al. 2006), and southern British Columbia (Porter et al. 2000). Surprisingly, nearly the exact same stream habitat parameters scored canonical cross-loadings of 0.30 or greater for models applied to river drainages above and below Shoshone Falls (Table 5), despite the fact that 6 of the 14 species including in the analyses occurred only above or only below the falls. The similarity between these studies, and between our models applied to drainages both above and below Shoshone Falls, highlights the consistency that some reach-scale habitat conditions can have on the abundance of non-game fish species, regardless of species composition or the influence of larger regional-scale conditions such as climate or geology.
Stream order was the strongest loading factor for canonical correlations constructed for
models applied to drainages above and below Shoshone Falls, suggesting that the increase in catostomids-cyprinids was occurring along a longitudinal downstream gradient. Longitudinal

10
changes in fish assemblage structure are generally thought to be due either to continual species additions to downstream reaches (Sheldon 1968), or to biotic zonation resulting from changes in geomorphology or thermal characteristics (Huet 1959). In our study, species such as sculpin, which are more closely associated with headwater streams, were still present at many of the lower elevation reaches, suggesting that biotic zonation perhaps had not yet materialized in our study for at least some species. However, as previously mentioned, we could not quantitatively sample streams larger than 15 m wetted width, thus zonation may have been unlikely to have occurred (or perhaps could not be detected) at the edge of our sampling framework.
Two cyprinids, speckled dace and redside shiners, were especially widespread and
abundant species, being captured in all major river drainages (i.e., those greater than 1,000 km²) and most of the smaller drainages (Table 3), and being more often categorized as ‘abundant’ than were most other non-game species (Table 4). Both species are habitat generalists (Pearsons et al. 1992; Wydoski and Whitney 2003) and thus would be expected to be found in a variety of stream conditions. Nevertheless, both showed an affinity for higher-order, lower gradient, lower elevation reaches. Longnose dace was the only species of the catostomid-cyprinid fish assemblage that was directly associated with cobble-boulder substrate. A positive association for longnose dace with cobble-boulder substrate has been demonstrated previously (Mullen and Burton 1995; Thompson et al. 2001), and is probably the result of longnose dace using substrates as a shelter from the current (Culp 1989) or as a foraging mechanism to feed on macroinvertebrates on the surface of larger substrates (Thompson et al. 2001). None of the remaining cyprinids or catostomids were positively associated with cobble-boulder substrate, but two of the three sculpin species (and the conglomerate sculpin metric) were. Direct associations with rocky substrate has been repeatedly demonstrated for many stream-dwelling sculpin (e.g., Brown 1991; Hesthagen and Heggenes 2003; Meyer et al. 2008), and is likely the result of shelter, foraging, and spawning needs (Wydoski and Whitney 2003).
At least one of the three main Cottus species in the Snake River basin of southern Idaho
(Paiute, mottled, and shorthead) was present in 317 reaches, and at least two species were sympatric in 49 reaches. Their prevalence was not surprising since they are known to inhabit small mountain streams more so than most other non-game fish species in the Intermountain West. However, fish-habitat associations for sculpin were generally weaker and less consistent than for other non-game species in our study, and logistic regression model results differed and the models were weaker for individual sculpin species compared to the conglomerate sculpin metric. As we originally hypothesized, perhaps these species of sculpin fill a somewhat similar habitat niche across the Snake River basin in southern Idaho. If so, the weakness of individual sculpin models could stem in part from a somewhat haphazard distribution for these species, influenced more by geomorphic processes (Smith 1978) and stream capture events (Burridge et al. 2007) than by stream habitat conditions. At smaller scales within the Snake River basin, habitat features may more prominently influence distribution patterns for sculpin populations. For instance, in one of the drainages included in our study (i.e., the Salt River), allopatric and sympatric distributions of Paiute and mottled sculpin were associated with elevation and thermal characteristics (Quist et al. 2004c). Alternatively, others have argued that, for sculpin populations, microhabitat and macrohabitat conditions are of little importance; rather, they are regulated most strongly by density-dependent processes such as competition for food and space (Petty and Grossman 1996; Grossman et al. 2006).
Our results suggest that some of the non-game fish species in our study area are much
more abundant than are game fish species (cf. Meyer et al. 2006, 2009; High et al. 2008; Schill 2009). In particular, speckled dace and redside shiner were very abundant, as were all three sculpin species. Bridgelip sucker were also quite abundant, considering they are only native

11
below Shoshone Falls. The actual estimates of total abundance were based on visual approximations at each sample reach, and thus were never intended to be highly accurate. However, our estimate for Wood River sculpin (0.8 ± 0.3 million) was not drastically different than the estimate of 1.4 ± 0.6 million in Meyer et al. (2008) that was based on depletion electrofishing. Thus the visual approximations of abundance at each site appear to be at least reasonably precise, although almost certainly biased low for several reasons. First, our use of 1:100,000 scale stream hydrography results in substantially less total stream kilometers than using a 1:24,000 scale layer (Shepard et al. 2005), which inherently lowers the total abundance estimates. Second, abundance estimates based on depletion have repeatedly been shown to underestimate salmonid abundance because they overestimate capture efficiency (see Meyer and High 2011). Capture efficiencies for non-game fish species in streams are often comparable to salmonids (e.g., Hudy and Shiflet 2009; Hense et al. 2010), thus depletions likely underestimate non-game abundance as well. Total abundance for sculpin species were considered to be the most likely estimates to be biased by our methodology because their benthic nature and lack of a swim bladder made them the most difficult species to visually observe and net, and depletion capture efficiencies for Wood River sculpin support this conclusion (mean = 0.42 for Wood River sculpin compared to 0.63 for salmonids; KAM, unpublished data). Taken collectively, these biases suggest that our approximations almost certainly underestimate true abundance, but this assertion should be evaluated by more intensive quantitative sampling on non-game fish species. Nevertheless, the general agreement for Wood River sculpin between approximations of abundance in this study and the more quantitative estimates from Meyer et al. (2008) lends credence to our finding that several non-game fish species are extremely abundant in the upper Snake River basin.
Surprisingly, non-native non-game fish species were almost entirely absent from small
streams in the Snake River basin in southern Idaho. While this is an encouraging finding, it should be noted that non-native non-game species are prevalent in many larger rivers and lentic habitats in southern Idaho (IDFG 2007). In fact, 13 non-native non-game fish species exist in the Snake River basin in southern Idaho, 9 of which were likely established from the release of aquarium pet fish, a problem that will probably worsen in the coming decades (Gertzen et al. 2008; Strecker et al. 2011). Of the remaining 4 species, only common carp and grass carp Ctenopharyngodon idella are widely distributed in southern Idaho. Idaho is largely devoid of commonly used bait fish such as fathead minnow Pimephales promelas, golden shiner Notemigonus crysoleucas, and red shiner Cyprinella lutrensis, in part because the use of live bait fish has been prohibited in Idaho since 1960, with other restrictions dating back to 1941 that restricted most use of live bait for Idaho anglers. Exotic non-game fish have apparently not yet invaded small streams in southern Idaho, although climate change may increase the likelihood of successful invasions as warmer water temperatures alter the types of fish that can establish self-sustaining populations (Rahel and Olden 2008).
In our study, much of the variation in the occupancy and relative abundance of native
non-game fish species in the Snake River basin was unexplained by our fish-habitat models (both canonical correlation and logistic regression), suggesting that non-game fish species population metrics were additionally influenced by other factors that we did not measure. One such factor may be stream flow, which has been shown to influence non-game fish species assemblages (Poff and Allan 1995; Grossman et al. 1998), usually via effects on mortality and subsequent recruitment. Water temperature has also been shown to affect fish species assemblages (Porter et al. 2000; Quist 2004c), although our metric of elevation might be considered a surrogate for water temperature (Bozek and Hubert 1992). Moreover, as our models consistently indicated, most of the species found in our study (except sculpin species) occurred at lower elevation streams, thus their occupancy and abundance were likely more
12
closely associated with stream conditions in larger streams at lower elevations, rather than the small streams in our study. Unfortunately, quantitative sampling techniques for non-game fish species in larger streams are difficult to implement, and the abundance of many of these species (e.g., dace and shiners) can be overwhelming both in small streams and large rivers, due mainly to their schooling nature, making it difficult to quantitatively sample them in an unbiased manner. Fish-habitat relationships in general are often weak and not applicable to areas outside the study area where the relationships were developed (Fausch et al. 1988), in part because complex interactions between multiple habitat factors simultaneously affecting organisms are not all measured and accounted for in statistical models (Cade and Noon 2003), nor are they necessarily consistent spatially or temporally.
Our probability of detecting a species at any given site was not equal to one. Thus, at an
unknown number of locations, we mistakenly concluded that a species was absent when in fact they were present at a site. Not accounting for imperfect detection may have lead to inaccurate conclusions regarding the magnitude of effect for each variable included in our models (MacKenzie 2005). Imperfect detection probability is an active area of research in applied ecology (e.g., Mackenzie et al. 2002; He and Gaston 2003; Royle et al. 2005). False species absences in our study probably occurred most often for the rarest species, and we did not attempt to identify stream conditions that influenced their occupancy because these data were less reliable. For the remaining species that were more abundant, errors still occurred at locations where their abundance was very low, but we do not believe that false absences in our data introduced substantial bias to our conclusions. Meyer and High (2011) concluded that, at measured capture efficiencies of 20-60% for salmonids in the Snake River basin, if abundance was as low as only two fish in 100 meters of stream, the likelihood of catching at least one of these fish with three depletion passes would be about 95%. Although sculpin are more difficult to capture than salmonids because they are smaller in size and have no swim bladder, capture probabilities for Wood River sculpin were only about 35% lower than for salmonids (K. Meyer, unpublished data).
Within the small streams of the Snake River basin above Hells Canyon Dam, we
captured all 18 native non-game fish species still present in the study area. This was somewhat surprising because we surveyed <1% of the stream kilometers included in our study, and some species such as northern leatherside chub are extremely rare in the study area, while others are more closely associated with larger rivers (e.g., chiselmouth, northern pikeminnow) which we excluded from our study. While it is encouraging that all native non-game fish species were represented in our study, most species were absent from a high percentage of study reaches, and even when present, most species were rarely abundant. We believe that for many species this may be reflective of a stronger affinity for larger rivers rather than an actual decline in distribution or abundance.
Whether the distribution and abundance of native non-game fish species in southern
Idaho has declined from historical levels cannot be ascertained from our results because (1) there is little previous work to compare our results to, and (2) our exclusion of large rivers makes our current assessment incomplete. The ubiquity of studies across North America demonstrating a decline in the distribution and abundance of native non-game fish species (e.g., Warren et al. 2000; Haslouer et al. 2005; Hoagstrom et al. 2007; Moyle et al. 2011), and the declines in native game fish within the actual study area (e.g., Thurow et al. 1997), suggests that non-game fish species in southern Idaho have likely experienced some level of decline. However, perhaps more important is monitoring whether existing populations maintain their current distribution and abundance for the foreseeable future. Accordingly, future studies that fill the gaps in our data set, or use our data as a baseline for direct comparison, may more

13
completely elucidate the current status of native non-game fish species in the Snake River basin of southern Idaho. This study underscores the need for management agencies to focus more effort on recording data for non-game fish species (rather than just the targeted game species of interest) during standard fish sampling surveys, both in small, higher-elevation streams where quantitative sampling is more easily conducted, and in larger downstream rivers, where quantitative sampling may be more difficult but many non-game species may be more likely to occur. An added benefit is that monitoring population metrics and distributions on non-game species may serve as better ecological indicators of change because their population dynamics are less influenced by management actions.
RECOMMENDATIONS
1. Data collection on the occupancy and relative abundance of non-game fish species should be more regularly incorporated into the sampling protocols used by biologists in Idaho to more closely monitor these overlooked species during routine sampling of game fish. This would take little additional work (since the crew is already surveying the site) but would add much new information.
2. Field crews should be trained on non-game fish species identification in order to
minimize misidentifications that later translate to misguided conclusions.
3. Vouchered specimens should be collected to verify species identification, and when possible the vouchered specimens should be archived in the database at the Orma J. Smith Museum.
4. Information on sampling efficiency is needed for non-game fish species in order to assess detection rates and more accurately approximate actual abundance.

14
ACKNOWLEDGEMENTS
We thank the many field personnel who assisted in data collection, most notably John Cassinelli. Reviews by Tim Copeland, Chris Sullivan, and Erin Larson greatly improved the manuscript.
15
LITERATURE CITED
Allan, J. D. 1995. Stream ecology, structure and function of running water. New York: Chapman and Hall.
Angermeier, P. L., and M. R. Winston. 1998. Local vs. regional influences on local diversity in stream fish communities of Virginia. Ecology 79:911-927.
Arend, K. K. 1999. Macrohabitat identification. In: Aquatic habitat assessment: common methods. Bain, M. B., and N. J. Stevenson, eds. American Fisheries Society, Bethesda, Maryland, pp. 75-93.
Bozek, M. A., and W. A. Hubert. 1992. Segregation of resident trout in streams as predicted by three habitat dimensions. Canadian Journal of Zoology 70:886-890.
Brown, L. R. 1991. Differences in habitat choice and behavior among three species of sculpin (Cottus) in artificial stream channels. Copeia 1991:810-819.
Burns, A. D. 2007. Comparison of two electrofishing gears (backpack and parallel wires) and abundances of fishes of the upper Greenbrier River drainage. MS Thesis, West Virginia University. 72 p.
Burridge, C. P., D. Craw, and J. M. Waters. 2007. An empirical test of freshwater vicariance via river capture. Molecular Ecology 16:1883-1895.
Cade, B. S., and B. R. Noon. 2003. A gentle introduction to quantile regression for ecologists. Frontiers in Ecology and the Environment 1:412-420.
Culp, J. M. 1989. Nocturnally constrained foraging of a lotic minnow (Rhinichthys cataractae). Canadian Journal of Zoology 67:2008-2012.
Fausch, K. D., C. L. Hawkes, and M. G. Parsons. 1988. Models that predict standing crop of stream fish from habitat variables: 1950-1985. General Technical Report PNW-GTR-213. U.S. Forest Service, Pacific Northwest Research Station, Portland, Oregon.
Gertzen, E., O. Familiar, and B. Leung. 2008. Quantifying invasion pathways: fish introductions from the aquarium trade. Canadian Journal of Fisheries and Aquatic Sciences 65:1265-1273.
Grossman, G. D., R. E. Ratajczak, Jr., J. T. Petty, M. D. Hunter, J. T. Peterson, and G. Grenouillet. 2006. Population dynamics of mottled sculpin (Pisces) in a variable environment: information theoretic approaches. Ecological Monographs 76:217-234.
Grossman, G. D., R. E. Ratajczak, M. Crawford, and M. C. Freeman. 1998. Assemblage organization in stream fishes: effects of environmental variation and interspecific interactions. Ecological Monographs 68:396-420.
Hair, J. F. Jr., R. E. Anderson, R. L. Tatham, and W. C. Black. 1998. Multivariate Data Analysis, 5th edition. Prentice Hall, Inc. 1998. Upper Saddle River, NJ.
Hanley, J. A. and B. J. McNeil. 1982. The Meaning and use of the area under a receiver operating characteristic (ROC) curve. Radiology 143:29-36.
Haslouer, S. G., M. E. Eberle, D. R. Edds, K. B. Gido, C. S. Mammoliti, J. R. Triplett, and J. T. Collins. 2005. Current status of native fish species in Kansas. Transactions of the Kansas Academy of Science 108:32-46.
He, F., and K. J. Gaston. 2003. Occupancy, spatial variance, and the abundance of species. American Naturalist 162:332-342.

16
Hense, Z., R. W. Martin, and J. T. Petty. 2010. Electrofishing capture efficiencies for common stream fish species to support watershed-scale studies in the central Appalachians. North American Journal of Fisheries Management 30:1041-1050.
Hesthagen, T., and J. Heggenes. 2003. Competitive habitat displacement of brown trout by Siberian sculpin: the role of size and density. Journal of Fish Biology 62:222-236.
High, B., K. A. Meyer, D. J. Schill, and E. R. J. Mamer. 2008. Distribution, abundance, and population trends of bull trout in Idaho. North American Journal of Fisheries Management 28:1687-1701.
Hoagstrom, C. W., S. S. Wall, J. G. Kral, B. G. Blackwell, and C. R. Berry Jr. 2007. Zoogeographic patterns and faunal changes of South Dakota fishes. Western North American Naturalist 67:161-184.
Hubbs, C. L., and R. R. Miller. 1948. The zoological evidence: correlation between fish distribution and hydrographic history in the desert basins of Western United States. Pages 17–166 in The Great Basin, with emphasis on glacial and postglacial times. Bulletin of the University of Utah, Biological Series 10, no. 38.
Hudy, M., and J. Shiflet. 2009. Movement and recolonization of Potomac sculpin in a Virginia stream. North American Journal of Fisheries Management 29: 196-204.
Huet, M. 1959. Profiles and biology of western European streams as related to fish management. Transactions of the American Fisheries Society 88:155-163.
Hughes, R. M., P. R. Kaufmann, A. T. Herlihy, T. M. Kincaid, L. Reynolds, and D. P. Larsen. 1998. A process for developing and evaluating indices of fish assemblage integrity. Canadian Journal of Fisheries and Aquatic Sciences 55:1618-1631.
Hughes, R. M., L. W. Wang, and P. W. Seelbach. 2006. Landscape influences on stream habitats and biological assemblages. American Fisheries Society Symposium 48. American Fisheries Society, Bethesda, Maryland. 697 p.
IDFG (Idaho Department of Fish and Game). 2007. Fisheries Management Plan 2007-2012. Boise, Idaho.
Johnson, J. B. 2002. Evolution after the flood: Phylogeography of the desert fish Utah chub. Evolution 56:948-960.
Lee, D. S., C. R. Gilber, C. H. Hocutt, R. E. Jenkins, D. E. McAllister, and J. R. Stauffer. 1980. Atlas of North American freshwater fishes. North Carolina Museum of Natural History. Raleigh, N.C.
MacKenzie, D. I. 2005. What are the issues with presence-absence data for wildlife managers? Journal of Wildlife Management 69:849-860.
MacKenzie, D. I., J. D. Nichols, G. B. Lachman, S. Droege, J. A. Royle, and C. A. Langtimm. 2002. Estimating site occupancy rates when detection probabilities are less than one. Ecology 83:2248-2255.
Mebane, C. A., T. R. Maret, and R. M. Hughes. 2003. An index of biological integrity (IBI) for Pacific Northwest rivers. Transactions of the American Fisheries Society 132:239-261.
Menard, S. 1995. Applied logistic regression analysis. Sage Publications. Thousand Oaks, California.

17
Meyer, K. A., F. S. Elle, and J. A. Lamansky. 2009. Environmental factors related to the distribution, abundance, and life history characteristics of mountain whitefish in Idaho. North American Journal of Fisheries Management 29:753-767.
Meyer, K. A., and B. High. 2011. Accuracy of removal electrofishing estimates of trout abundance in Rocky Mountain streams. North American Journal of Fisheries Management 31:923-933.
Meyer, K. A., D. J. Schill, M. R. Campbell, C. C. Kozfkay. 2008. Distribution, abundance, and genetic population structure of Wood River sculpin, Cottus leiopomus. Western North American Naturalist 68:508-520.
Meyer, K. A., D. J. Schill, J. A. Lamansky, M. R. Campbell, and C. C. Kozfkay. 2006. Status of Yellowstone cutthroat trout in Idaho. Transactions of the American Fisheries Society 135:1329-1347.
Moyle, P. B., J. V. E. Katz, and R. M. Qui ̃ones. 2011. Rapid decline of California’s native inland fishes: a status assessment. Biological Conservation 144:2414-2423.
Mullen, D. M., and T. M. Burton. 1995. Size-related habitat use of longnose dace (Rhinichthys cataractae). American Midland Naturalist 133:177-183.
Nagelkerke, N. J. D. 1991. A note on a general definition of the coefficient of determination. Biometrika 78:691-692.
Pearsons, T. N., H. W. Li, and G. A. Lamberti. 1992. Influence of habitat complexity on resistance and resilience of stream fish assemblages to flooding. Transactions of the American Fisheries Society 121:427-436.
Peden, A. E., G. W. Hughes, and W. E. Roberts. 1989. Morphologically distinct populations of the shorthead sculpin, Cottus confusus, and mottled sculpin, Cottus bairdi, (Pisces, Cottidae), near the western border of Canada and the United States. Canadian Journal of Zoology 67:2711-2720.
Petty, J. T., and G. D. Grossman. 1996. Patch selection by mottled sculpin (Pisces: Cottidae) in a southern Appalachian stream. Freshwater Biology 35:261-276.
Poff, N. L., and J. D. Allan. 1995. Functional organization of stream fish assemblages in relation to hydrological variability. Ecology 76:606-627.
Porter, M. S., J. Rosenfeld, and E. A. Parkinson. 2000. Predictive models of fish species distribution in the Blackwater drainage, British Columbia. North American Journal of Fisheries Management 20:349-359.
Quist, M. C., W. A. Hubert, and F. J. Rahel. 2004a. Relations among habitat characteristics, exotic species, and turbid-cyprinids in the Missouri River drainage of Wyoming. Transactions of the American Fisheries Society 133:727-742.
Quist, M. C., W. A. Hubert, and D. J. Isaak. 2004b. Fish assemblage structure and relations with environmental conditions in a Rocky Mountain watershed. Canadian Journal of Zoology 82:1554-1565.
Quist, M. C., W. A. Hubert, and D. J. Isaak. 2004c. Factors affecting allopatric and sympatric occurrence of two sculpin species across a Rocky Mountain watershed. Copeia 2004(3):618-624.
Rahel, F. J., and J. D. Olden. 2008. Assessing the effects of climate change on aquatic invasive species. Conservation Biology 22:521-533.

18
Rashleigh, B., R. Parmar, J. M. Johnston, and M. C. Barber. 2005. Predictive habitat models for the occurrence of stream fishes in the Mid-Atlantic highlands. North American Journal of Fisheries Management 25:1353-1366.
Reid, S. M., N. E. Jones, and G. Yunker. 2008. Evaluation of single-pass electrofishing and rapid habitat assessment for monitoring redside dace. North American Journal of Fisheries Management 28: 50-56.
Reynolds, L., A. T. Herlihy, P. R. Kaufmann, S. V. Gregory, and R. M. Hughes. 2003. Electrofishing effort requirements for assessing species richness and biotic integrity in western Oregon streams. North American Journal of Fisheries Management 23:450-461.
Royle, J. A., J. D. Nichols, and M. Kéry. 2005. Modeling occurrence and abundance of species when detection is imperfect. Oikos 353:353-359.
SAS Institute Inc. 2009. SAS/STAT ® 9.2 User’s Guide, Second Edition. Cary, NC: SAS Institute Inc.
Scheaffer, R. L., W. Mendenhall, and L. Ott. 1996. Elementary survey sampling, fifth edition. Duxbury Press. Belmont, California.
Schill, D. J. 2009. Population studies of desert redband trout. Ph.D. Dissertation. University of Idaho, Moscow. 180 pp.
Scott, M. C., and L. W. Hall. 1997. Fish assemblages as indicators of environmental degradation in Maryland coastal plain streams. Transactions of the American Fisheries Society 126:349-360.
Scott, W. B., and E. J. Crossman. 1973. Freshwater fishes of Canada. Fisheries Research Board of Canada Bulletin 184.
Sheldon, A. L. 1968. Species diversity and longitudinal succession in stream fishes. Ecology 49:193-198.
Shepard, B. B., B. E. May, and W. Urie. 2005. Status and conservation of westslope cutthroat trout within the western United States. North American Journal of Fisheries Management 25:1426-1440.
Simpson, J. C., and R. L. Wallace. 1982. Fishes of Idaho. Moscow, ID: University of Idaho Press. 238 p.
Smith, G. R. 1978. Biogeography of intermountain fishes. Great Basin Naturalist Memoirs 2:17-42.
Strahler, A. N. 1964. Quantitative geomorphology of drainage basins and channel networks. In: Chow, V. T., ed. Handbook of Applied Hydrology. McGraw-Hill, New York, New York, section 4-2.
Strecker, A. L., P. M. Campbell, and J. D. Olden. 2011. The aquarium trade as an invasion pathway in the Pacific Northwest. Fisheries 36:74-85.
Tabachnick, B. G., and L. S. Fidell. 1989. Using Multivariate Statistics, 2nd edition. New York: HarperCollins.
ter Braak, C. J. F., and P. F. M. Verdonschot. 1995. Canonical correspondence analysis and related multivariate methods in aquatic ecology. Aquatic Sciences 57:255-289.
Thompson, A. R., J. T. Petty, and G. D. Grossman. 2001. Multi-scale effects of resource patchiness on foraging behavior and habitat use by longnose dace, Rhinichthys cataractae. Freshwater Biology 46:145-160.

19
Thurow, R. F., D. C. Lee, and B. E. Rieman. 1997. Distribution and status of seven native salmonids in the interior Columbia River Basin and portions of the Klamath River and Great basins. North American Journal of Fisheries Management 17:1094-1110.
Torgersen, C. E., C. V. Baxter, H. W. Li, and B. A. McIntosh. 2006. Landscape influences on longitudinal patterns of river fishes: spatially continuous analysis of fish-habitat relationships. American Fisheries Society Symposium 48:473-492.
Warren, M. L., H. W. Robison, S. T. Ross, W. C. Starnes, B. M. Burr, S. J. Walsh, H. L. Bart, Jr., R. C. Cashner, D. A. Etnier, B. J. Freeman, B. R. Kuhajda and R. L. Mayden. 2000. Diversity, distribution, and conservation status of the native freshwater fishes of the Southern United States. Fisheries 25:7-31.
Wydoski, R. S., and R. R. Whitney. 2003. Inland Fishes of Washington, 2nd edition. University of Washington Press.
20
Figure 1. Locations where non-game fish species were surveyed, as indicated by dots showing dry (or nearly dry) sites, and sites with or without non-game fish species.

21
Table 1. Descriptive statistics for abiotic-biotic stream attributes at study reaches in the upper Snake River basin, Idaho.
Abiotic/biotic stream condition mean SD min max
Stream order 2.2 1.0 1.0 6.0
Elevation (m) 1747 328 696 2964
Stream gradient (%) 3.6 3.6 0.1 32.5
Specific conductivity (µS/cm) 200 170 4 1585
Stream width (m) 3.3 2.4 0.5 14.2
Average depth (m) 0.13 0.15 0.00 4.30
Width:depth ratio 26.9 13.1 1.7 127.0
Gravel substrate (%) 29 11 0 80
Cobble/boulder substrate (%) 34 19 0 100
Stream shading (%) 21 21 0 88
Unstable banks (%) 8 15 0 88
Trout density (Number/m²) 0.16 0.32 0.00 3.91

22
Table 2. Number of sites in which native non-game fish species were collected with backpack electrofishers in small streams in the Snake River basin of southern Idaho. Shaded gray areas indicate the known or probable native range for each species.
Snake tribs.
below Sho-
shone Falls
Owyhee
River
Weiser
River
Payette
River
Boise
River
Bruneau
River
Big
Wood
River
Rock
Creek
(Twin)
Salmon
Falls
Creek
Dry
Creek
Marsh
Creek
Goose
Creek
Raft
River
Rock Creek
(Bannock)
Bannock
Creek
Portneuf
River
Blackfoot
River
South Fk.
Snake
River
Salt
River
Willow
Creek
Teton
River
Henrys Fk.
Snake River
Sinks
drainagesb
Total
Number of sites 156 208 61 115 105 91 90 19 67 7 10 81 92 16 6 82 76 80 64 58 89 87 78 1738
Dry or nearly dry sites 64 133 12 13 12 39 49 11 32 4 2 30 29 14 2 10 14 27 6 23 24 16 20 586
Sites with fish (trout included) 78 70 40 72 80 50 29 8 32 3 8 42 54 1 3 52 57 48 50 30 54 54 44 959
Sites with trout 60 45 35 64 73 42 21 7 23 3 8 37 54 0 3 48 43 46 48 23 54 51 43 831
Sites with:
Bluehead Sucker 7 2 1 2 12
Bridgelip Sucker 27 17 3 5 6 24 6 1 16 105
Largescale Sucker 4 3 1 1 9
Mountain Sucker 2 1 2 2 4 6 10 2 7 7 2 45
Utah Sucker 2 1 2 2 2 6 1 16
Chiselmouth 3 2 2 4 3 14
Leopard Dace 1 1
Longnose Dace 7 3 5 3 3 16 3 1 1 7 6 3 11 3 5 4 81
Speckled Dace 43 41 6 12 2 25 6 4 23 16 6 4 17 4 11 9 6 10 1 246
Redside Shiner 20 23 4 6 6 27 3 1 17 9 7 1 4 1 6 11 1 7 1 155
Northern leatherside Chub 2a
6 1 7
Utah Chub 2 1 0 0 1 7 0 0 0 0 0 0 11
Peamouth 1 1
Northern Pikeminnow 4 10 1 4 4 6 3 32
Mottled Sculpin 3 5 9 5 2 1 1 3 15 23 8 11 5 13 15 5 9 133
Paiute Sculpin 10 17 6 3 1 2 23 14 16 34 8 15 14 163
Shorthead Sculpin 1 10 4 41 3 11 70
Wood River Sculpin 20 20aMay have been misidentified.
bWe did not include Big Lost River, Little Lost River, or Birch Creek in the Sinks drainages.

23
Table 3. Percent of study reaches (excluding dry and nearly dry sites) in small streams in the Snake River basin of southern Idaho where species were categorized into one of four relative abundance indices. Calculations for each species only included data from drainages in which they were native.
Percent of wet sites where fish were:
Species Absent Sparse Common Abundant
Bluehead Sucker 98.0 0.8 1.0 0.2
Bridgelip Sucker 80.8 4.0 5.5 9.7
Largescale Sucker 98.4 0.9 0.0 0.7
Mountain Sucker 95.9 1.7 1.8 0.5
Utah Sucker 97.4 0.3 1.6 0.7
Chiselmouth 97.2 1.2 1.0 0.6
Leopard Dace 99.8 0.2 0.0 0.0
Longnose Dace 93.0 1.6 2.8 2.6
Speckled Dace 78.6 3.5 6.1 11.8
Redside Shiner 86.5 1.8 3.7 7.9
Northern leatherside Chub 98.8 1.2 0.0 0.0
Utah Chub 98.2 0.5 0.7 0.7
Peamouth 99.8 0.2 0.0 0.0
Northern Pikeminnow 93.7 2.6 2.4 1.4
Mottled Sculpin 88.0 2.8 4.6 4.6
Paiute Sculpin 84.5 3.6 5.5 6.4
Shorthead Sculpin 87.6 1.8 4.3 6.4
Wood River Sculpin 51.2 4.9 9.8 34.1
24
Table 4. Population approximations based on categorical estimates from small streams (≤15 m wide) of the upper Snake River basin in Idaho. Missing data indicate where a species is not native and therefore no estimate was needed.
Bluehead
Sucker Bridgelip Sucker
Largescale
Sucker Mountain Sucker Utah Sucker Chiselmouth Longnose Dace Speckled Dace
Drainage Est. 90% CI Est. 90% CI Est. 90% CI Est. 90% CI Est. 90% CI Est. 90% CI Est. 90% CI Est. 90% CI
Snake tribs. below Shoshone Falls 208,271 66,061 0 - 0 - 13,555 17,676 53,721 37,497 545,185 148,673
Owyhee River 534,379 236,351 96,459 108,196 78,677 103,444 31,402 46,931 12,676 12,904 1,492,636 351,638
Weiser River 32,381 44,033 0 - 0 - 0 - 60,131 45,471 134,919 75,750
Payette River 152,568 119,968 81,215 106,417 0 - 0 - 78,121 76,905 285,888 81,803
Boise River 197,074 174,309 0 - 0 - 13,831 17,546 187,994 155,283 15,417 19,999
Bruneau River 419,323 139,092 20,072 32,936 2,007 3,294 40,375 38,735 224,426 107,764 411,307 116,990
Big Wood River 166,668 115,191 0 - 97,523 90,119 137,795 103,019
Rock Creek (Twin) 8,836 14,494 0 - 0 - 0 - 8,836 14,494 44,406 48,366
Salmon Falls Creek 244,650 100,531 3,135 5,149 10,019 13,719 25,049 21,454 31,350 51,488 621,357 244,232
Goose Creek 50,979 41,538 8,485 9,906 7,481 7,731 66,748 52,080 185,029 104,844
Raft River 0 - 102,043 84,822 24,374 40,053 190,998 45,990 128,718 99,924
Portneuf River 0 - 37,027 30,598 81,563 0 0 - 62,606 65,808
Blackfoot River 0 - 37,612 23,507 7,796 10,717 17,428 16,268 311,366 195,287
S Fk. Snake River/Salt River 7,708 8,763 47,568 56,129 7,708 12,597 35,397 22,914 29,414 19,995
Willow Creek 0 - 59,141 52,045 47,356 31,242 38,796 36,672 120,246 71,843
Teton River 0 - 0 - 0 - 67,284 43,737 65,731 44,151
Henrys Fk. Snake River 14,779 21,702 7,384 8,931 0 - 55,074 48,493 173,724 112,617
Sinks drainages 0 - 0 - 6,884 11,283 0 - 13,768 22,566
Total 73,465 47,678 1,964,150 387,134 200,881 155,377 389,964 160,064 183,161 55,145 124,211 69,163 1,226,502 259,787 4,779,513 573,601

25
Table 4. continued.
Redside Shiner Utah Chub
Northern
Pikeminnow Mottled Sculpin Paiute Sculpin Shorthead Sculpin
Wood River
Sculpin
Drainage Est. 90% CI Est. 90% CI Est. 90% CI Est. 90% CI Est. 90% CI Est. 90% CI Est. 90% CI
Snake tribs. below Shoshone Falls 169,821 64,995 31,764 29,192 0 - 0 - 0 -
Owyhee River 696,952 255,597 163,857 108,115 13,728 13,840 174,648 119,850 14,273 23,439
Weiser River 80,952 62,658 13,492 22,153 109,668 75,140 0 - 196,507 135,815
Payette River 235,510 114,803 77,399 64,573 161,935 103,370 0 - 103,323 81,121
Boise River 197,343 122,272 90,615 83,593 50,292 44,054 0 - 1,695,837 489,488
Bruneau River 512,717 126,773 70,713 54,791 25,666 30,850 0 - 55,902 52,713
Big Wood River 89,919 89,037 751,898 288,096
Rock Creek (Twin) 8,836 14,494 0 - 1,767 2,899 0 - 0 -
Salmon Falls Creek 403,121 132,456 19,338 24,567 0 - 254,242 131,159 0 -
Goose Creek 83,249 56,091 16,084 20,180 199,927 107,678 16,128 13,585
Raft River 219,757 114,311 4,880 8,019 718,714 242,490 11,487 9,684
Portneuf River 40,782 67,003 20,391 33,502 58,423 38,358 227,132 64,910
Blackfoot River 48,158 43,950 214,817 200,821 97,561 96,605 135,902 100,661
S Fk. Snake River/Salt River 15,540 17,231 0 - 49,990 23,570 358,906 159,376
Willow Creek 124,785 70,216 0 - 165,683 103,400 59,087 36,369
Teton River 4,428 7,243 0 - 32,203 32,035 163,930 63,521
Henrys Fk. Snake River 126,921 101,177 0 - 128,647 70,528 207,888 88,869
Sinks drainages 13,768 22,566 0 - 0 - 0 -
Total 3,072,557 426,643 256,172 204,751 467,178 166,718 1,814,204 343,324 1,609,351 291,285 2,065,842 517,642 751,898 288,096
26
Table 5. Canonical cross-loadings for the first canonical function relating abiotic-biotic stream conditions to the relative abundance of select non-game fish species. Separate models were run for above and below Shoshone Falls. Only variables with loadings 0.30 and greater (in bold) should be considered interpretable. Missing values indicate where the species was not native.
From Shoshone Falls:
Variable Downstream Upstream
Stream habitat parameter
Stream order 0.63 0.56
Elevation -0.35 -0.30
Gradient -0.47 -0.42
Conductivity 0.36 0.25
Stream width 0.39 0.44
Average depth 0.30 0.49
Width:depth ratio 0.12 0.01
Percent gravel substrate 0.10 -0.17
Percent cobble/boulder substrate -0.20 -0.06
Stream shading -0.38 -0.21
Unstable banks 0.12 0.19
Trout density -0.22 -0.10
Species relative abundance
Bluehead sucker 0.17
Bridgelip sucker 0.54
Largescale sucker 0.13
Mountain sucker 0.16 0.37
Utah sucker 0.29
Chiselmouth 0.31
Longnose dace 0.28 0.39
Speckled dace 0.56 0.42
Redside shiner 0.60 0.38
Northern pikeminnow 0.40
Utah chub 0.14
Mottled sculpin 0.07 0.39
Paiute sculpin 0.10 0.37
Shorthead sculpin -0.02 0.07
Sculpin combined 0.09 0.54

27
Table 6. Logistic regression model results relating fish occupancy (i.e., present or absent) at study reaches in the Snake River basin to stream habitat conditions within the reach. Stream conditions that were significantly (α = 0.01) related to a species’ occupancy is indicated by plus (direct relationship) or minus (inverse relationship) symbols.
Abiotic/biotic stream conditions
Species
Stream
order
Elev-
ation
Grad-
ient
Conduct-
ivity
Mean
width
Mean
depth
Width:
depth
ratio
Percent
gravel
substrate
Percent
cobble/
boulder
substrate
Percent
stream
shading
Percent
unstable
banks
Trout
density
Bridgelip sucker + - - - 0.53
Mountain sucker - - - 0.22
Longnose dace + - + 0.35
Speckled dace + - - + - 0.48
Redside shiner + - - - 0.52
Northern pikeminnow + - - 0.47
Mottled sculpin - + 0.15
Paiute sculpina
+ + - - - + 0.26
Shorthead sculpin + + + 0.12
Sculpin combinedb
+ + + - + + 0.32aAlso significant were the interaction terms conductivity*width (+) and conductivity*gradient (+)
bAlso significant were the interaction terms elevation*gradient (-), elevation*conductivity (+), and conductivity*width (+)

28
Prepared by: Approved by: IDAHO DEPARTMENT OF FISH AND GAME Kevin A. Meyer Daniel J. Schill Principal Fisheries Research Biologist Fisheries Research Manager James A. Lamansky, Jr. Edward B. Schriever, Chief Senior Fisheries Research Biologist Bureau of Fisheries Daniel J. Schill Fisheries Research Manager Donald W. Zaroban Scientist (Idaho Department of Environmental Quality)