non-intrusive performance profiling for entire software ......debugging with raw log only 2 users...
TRANSCRIPT

Non-intrusive Performance Profiling for
Entire Software Stacks based on
The Flow Reconstruction Principle
Xu Zhao, Kirk Rodrigues, Yu Luo, Ding Yuan, Michael Stumm

Motivations
► Debugging distributed system stacks is difficult
► Existing tools are limited
► Intrusive: manually built-in domain knowledge
► Machine learning on logs: unable to reconstruct execution flow
► Static analysis [Zhao OSDI’14]: cannot cross different software components
► Use programmers’ intuition in postmortem execution analysis
2

The Flow Reconstruction Principle
Programmers log sufficient information so that they can reconstruct
the execution flow in distributed stacks
► Three rules
3
11/02/16 18:00 Thread starts
► Log events at critical points in the control path
► Log object identifiers to differentiate concurrent runs
► Log sufficient identifiers to unambiguously identify an object
Thread1
Thread2
11/02/16 18:01 Thread starts
The Flow Reconstruction Principle
Programmers log sufficient information so that they can reconstruct
the execution flow in distributed stacks
► Three rules
4
► Log events at critical points in the control path
► Log object identifiers to differentiate concurrent runs
► Log sufficient identifiers to unambiguously identify an object
Thread1
Thread2
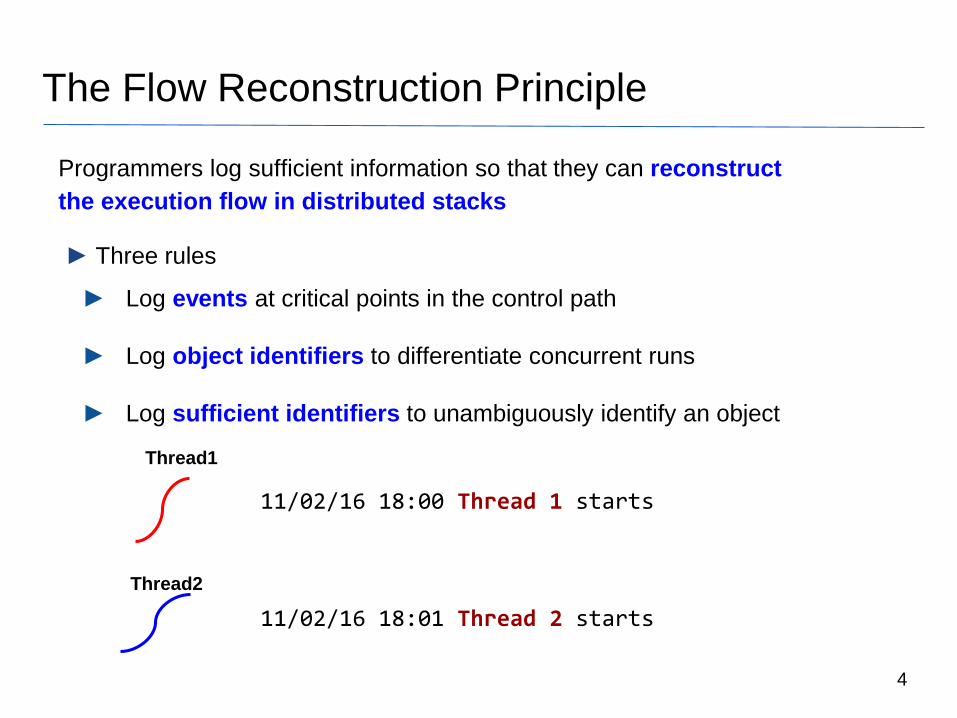
11/02/16 18:00 Thread 1 starts
11/02/16 18:01 Thread 2 starts

The Flow Reconstruction Principle
Programmers log sufficient information so that they can reconstruct
the execution flow in distributed stacks
► Three rules
5
► Log events at critical points in the control path
► Log object identifiers to differentiate concurrent runs
► Log sufficient identifiers to unambiguously identify an object
Thread1
Thread2
11/02/16 18:00 [Process 2355] Thread 1 starts
11/02/16 18:01 [Process 1224] Thread 2 starts

The Flow Reconstruction Principle
Programmers log sufficient information so that they can reconstruct
the execution flow in distributed stacks
► Three rules
6
► Log events at critical points in the control path
► Log object identifiers to differentiate concurrent runs
► Log sufficient identifiers to unambiguously identify an object
Thread1
Thread2
11/02/16 18:01 Thread 2 starts
11/02/16 18:01 Process 1224 starts a Thread
11/02/16 18:02 Thread 1 starts
11/02/16 18:01 Process 2355 starts a Thread
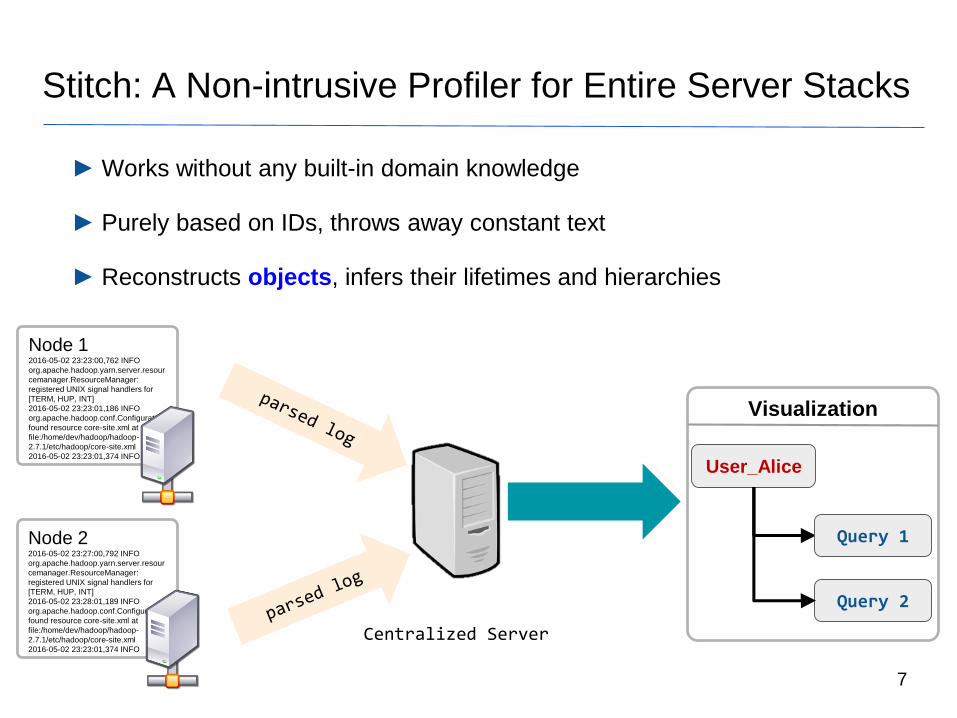
Stitch: A Non-intrusive Profiler for Entire Server Stacks
7
► Works without any built-in domain knowledge
► Purely based on IDs, throws away constant text
► Reconstructs objects, infers their lifetimes and hierarchies
Node 12016-05-02 23:23:00,762 INFO
org.apache.hadoop.yarn.server.resour
cemanager.ResourceManager:
registered UNIX signal handlers for
[TERM, HUP, INT]
2016-05-02 23:23:01,186 INFO
org.apache.hadoop.conf.Configuration:
found resource core-site.xml at
file:/home/dev/hadoop/hadoop-
2.7.1/etc/hadoop/core-site.xml
2016-05-02 23:23:01,374 INFO
Node 22016-05-02 23:27:00,792 INFO
org.apache.hadoop.yarn.server.resour
cemanager.ResourceManager:
registered UNIX signal handlers for
[TERM, HUP, INT]
2016-05-02 23:28:01,189 INFO
org.apache.hadoop.conf.Configuration:
found resource core-site.xml at
file:/home/dev/hadoop/hadoop-
2.7.1/etc/hadoop/core-site.xml
2016-05-02 23:23:01,374 INFO
Centralized Server
Visualization
User_Alice
Query 1
Query 2

Outline
► Real world example
► Design of Stitch
► User study and correctness evaluation
8

Real World Example
► User study on 14 programmers
► We reproduced a real world performance anomaly: YARN-4610
► Symptom: user Alice reports her Hive query takes longer than expected
► Separate programmers into 2 groups: debug using raw log or with Stitch
► 45 mins time limit
9

Debugging with Raw Log
► Only 2 users using raw log can diagnose within the time limit
► Reading each log message is infeasible: over 5,000 lines of logs
► Users take two approaches: bottom-up and top-down
► Bottom-up results in a wild goose chase
10
$ grep “ERROR\|WARN” –R logs/
./node0/userlogs/application_1462245782384_0024/container_1462245782384_0024_01
_000576/syslog:2016-05-02 23:46:37,010 ERROR [Thread-50]
org.apache.hadoop.mapreduce.v2.app.rm.RMContainerAllocator: Could not
deallocate container for task attemptId attempt_1462245782384_0024_r_000001_1
... [707 more]

Debugging with Raw Log
► Only 2 users using raw log can diagnose within the time limit
► Reading each log message is infeasible: over 5,000 lines of logs
► Users take two approaches: bottom-up and top-down
► Bottom-up results in a wild goose chase
11
► Top-down gets closer, but still cannot diagnose failure within time limit
► Determine slowest map task

Debugging with Stitch
► All 7 Stitch users succeeded, spending 13 mins on average
► Stitch speeds-up debugging time by a factor of 3.5
► Demo
12

Outline
► Real world example
► Design of Stitch
► User study and correctness evaluation
13

Client: Log Parsing
► Detect log printing processes and log files
► Periodically read /proc
► Log parsing: separate dynamic and constant parts of the raw log
► Extract string constants from binaries, match against the log
► Filter non-identifiers using a blacklist (“memsize”, “ms”, “progress”, etc.)
14
16/04/02 00:58 MongoDB starting: pid=22925 port=27017 dbpath=/var/lib/mongodb
// Code that prints this msg:
l << "MongoDB starting : pid=" << pid << " port=" <<
serverGlobalParams.port << " dbpath=" << storageGlobalParams.dbpath;
Parsed Log
Timestamp Identifier Type
16/04/02 00:58
22925 pid
27017 port
/var/lib/mongodb filePath

Server: Identifier Relations
► 1:1 relation
► Can be used interchangeably
► 1:n relation
► Hierarchical relationship
► m:n relation
► Combination is required to unambiguously identify an object
15
Host1 IP 192.168.0.100
Process 42 Thread 1
Thread 2Process 43
Query 20161102_0001
User Bob
Query 20161102_0002
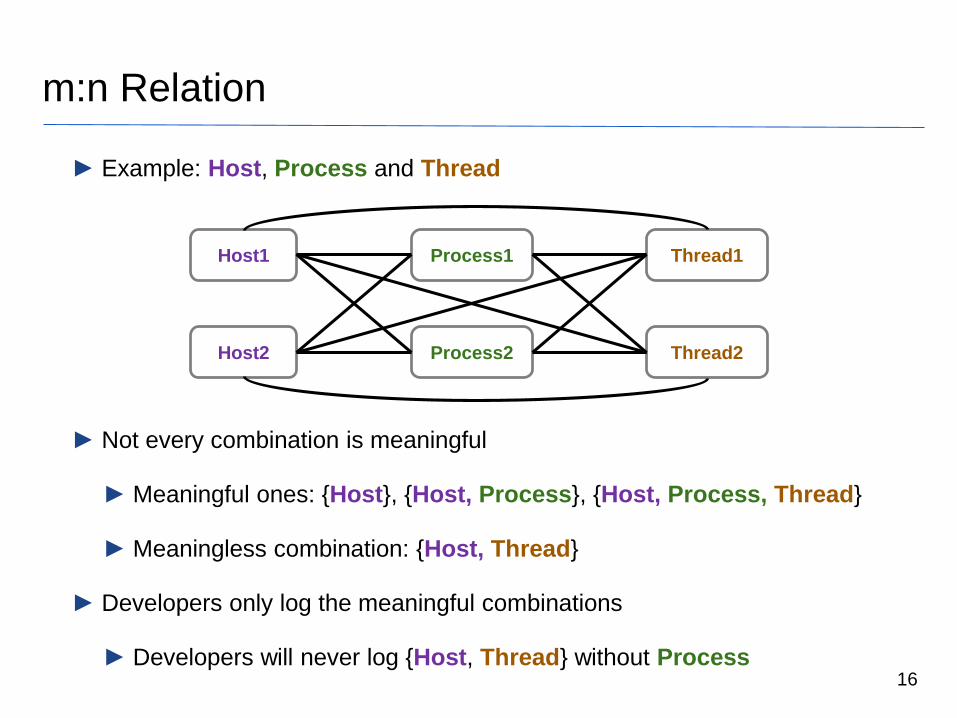
m:n Relation
► Example: Host, Process and Thread
► Not every combination is meaningful
► Meaningful ones: {Host}, {Host, Process}, {Host, Process, Thread}
► Meaningless combination: {Host, Thread}
► Developers only log the meaningful combinations
► Developers will never log {Host, Thread} without Process 16
Host1
Host2 Process2
Process1 Thread1
Thread2

Lifetime and Hierarchy
► Lifetime of objects inferred from event timestamps
► Hierarchy is inferred from 1:n relation
17
User_Bob
Query 20161102_0001
Query 20161102_0002
OBJECT EVENT TIMELINE
1 16/04/02 00:58 User Bob creates Hive query: Query 20161102_00012 16/04/02 01:03 User Bob creates Hive query: Query 20161102_00023 16/04/02 01:06 User Bob Hive query Query 20161102_0001 finishes4 16/04/02 01:10 User Bob Hive query Query 20161102_0002 finishes

Outline
► Real world example
► Design of Stitch
► User study and correctness evaluation
18

Evaluation
► How much time does Stitch save in debugging?
► How accurate is Stitch in identifying objects?
► Do real-world systems follow the Flow Reconstruction Principle?
19

User Study Evaluation
► 14 users work with 3 cases
○ Performance debugging – An anomaly caused by a YARN scheduler bug
○ Bottleneck identification – Identify slow node in a MapReduce job
○ Hierarchy identification – OpenStack components involved in request
► At least 4.6x faster debugging with Stitch20

Correctness Evaluation
► Hive, Spark and OpenStack workload: 200 nodes run for 24 hours
► Production workload: 24-node cluster running for four months
► Together there are 19 software components
► Stitch correctly identifies 96% of all objects in four software stacks21
System Objects Object Types Object Accuracy
Hive 295,042 32 90%
Spark 192,969 31 94%
OpenStack 214,882 14 100%
Production 8,141 24 100%
Total 711,034 101 96%

Limitations
► Stitch does not capture causal relations
► Stitch’s efficacy relies on developers following the Flow Reconstruction
Principle
► Violations of the principle will mislead human debugging
► Stitch’s accuracy is sensitive to the quality of identifiers and type-extraction
► Log parsing is a solved problem
► Industrial solutions exist, e.g., Splunk, VMWare LogInsight, LogStash
22

Related Work
► Intrusive tools [Aguilera SOSP’03] [Barham OSDI’04] [Chanda
EuroSys’07]
► Captures causal relationships
► Built-in domain knowledge
► Static analysis tools [Zhao OSDI’14] [Yuan ASPLOS’10]
► Captures causal relationships
► Cannot cross layers
► Machine learning solutions [Xu SOSP’09] [Nagaraj NSDI’12]
[Yu ASPLOS’16]
► Cannot reconstruct execution flow
23

Conclusions
The Flow Reconstruction Principle
► Log events at critical points in the control path
► Log object identifiers to differentiate concurrent runs
► Log sufficient identifiers to unambiguously identify an object
24
Node 12016-05-02 23:23:00,762 INFO
org.apache.hadoop.yarn.server.resource
manager.ResourceManager: registered
UNIX signal handlers for [TERM, HUP,
INT]
2016-05-02 23:23:01,186 INFO
org.apache.hadoop.conf.Configuration:
found resource core-site.xml at
file:/home/dev/hadoop/hadoop-
2.7.1/etc/hadoop/core-site.xml
2016-05-02 23:23:01,374 INFO
org.apache.hadoop.security.Groups:
clearing userToGroupsMap cache
2016-05-02 23:23:01,486 INFO
org.apache.hadoop.conf.Configuration:
Node 22016-05-02 23:23:00,762 INFO
org.apache.hadoop.yarn.server.resource
manager.ResourceManager: registered
UNIX signal handlers for [TERM, HUP,
INT]
2016-05-02 23:23:01,186 INFO
org.apache.hadoop.conf.Configuration:
found resource core-site.xml at
file:/home/dev/hadoop/hadoop-
2.7.1/etc/hadoop/core-site.xml
2016-05-02 23:23:01,374 INFO
org.apache.hadoop.security.Groups:
clearing userToGroupsMap cache
2016-05-02 23:23:01,486 INFO
org.apache.hadoop.conf.Configuration:
Stitch
Stitch: non-intrusive profiler for distributed stacks
Visualization
User_Alice
Query 1
Query 2

Q & A
25

Source of Inaccuracy
► Hive ID: Stage- : violating Flow Reconstruction Principle
► Stage- and Query ID in separate log messages
► Spark ID: inode and HostName - small scale of workload
► inode and HostName are 1:1 instead of m:n
► Appear together in an error log message
26