non invasive estimating of cattle live weight using...
TRANSCRIPT

13
Non Invasive Estimating of Cattle Live Weight Using Thermal Imaging
Denis Stajnko, Peter Vindiš, Marjan Janžekovič and Maksimiljan Brus University of Maribor, Faculty of Agriculture and Life Sciences, Pivola 10, 2311 Hoče,
Slovenia
1. Introduction
The body mass is one of highly important indicators of the development of the young cattle, therefore it is essential to follow it up. Only the animals with sufficient body frame and with well muscled top - quality body parts can be successfully fattened to high body mass. To obtain the highest precision in measuring of cattle weight gain, weighing should take place repeatedly in the period prior to slaughter. Methods for assessing growth by the weighing of animals are an important factor in monitoring production capacity of cattle according to their inheritance capacity, food conversion, average daily gain and carcass yield all of which subsequently affect the output of the herd. The most reliable information about the body mass of cattle can be obtained by weighing the animals. Accurate data on the body mass are obtained by weighing with the use of various weighing devices, such as the spring weighing devices or more modern electronic weighing devices. Since in most cases, weighing is done manually the process often needs at least two stockmen, and takes 3 to 5 minutes per bull. In addition, the procedure is stressful for the whole herd, and from an ergonomic point of view, unsatisfactory (Brandl & Jørgensen, 1996). However, the raisers did not have available weighing devices frequently and the animals cannot be often weighed, thus the individual body parts are measured alternatively. Usually, measuring of the whither size suffices, because the body frame, size and length are in positive relation to intensity and capacity of meat production. However, the information acquired is less accurate than the one obtained by the weighing. The differences are affected by the breed type, satiety of the animal, manner of feeding and even tightness of the tape during measuring (Kogel & Utz, 1988). It is also known, as much as the calves deviate from the optimal body development, the establishing of the body mass deviates. Thus, in order to calculate the body mass more accurately, it is necessary to consider also the trunk length in addition to the whither size. In the following chapters the comparison between the manual and automated electronic weighing systems is going to be presented firstly, which clearly shows the most important advantages of the modern systems. Then, the non invasive, indirect weight determination from the dimensions of the animal, measured by an image-processing model will be presented and explained that can be used for automatic and precise estimation of body dimensions from images of live animals and for predicting the body weight of individual cattle.
www.intechopen.com
New Trends in Technologies: Control, Management, Computational Intelligence and Network Systems
244
2. Manual weighing
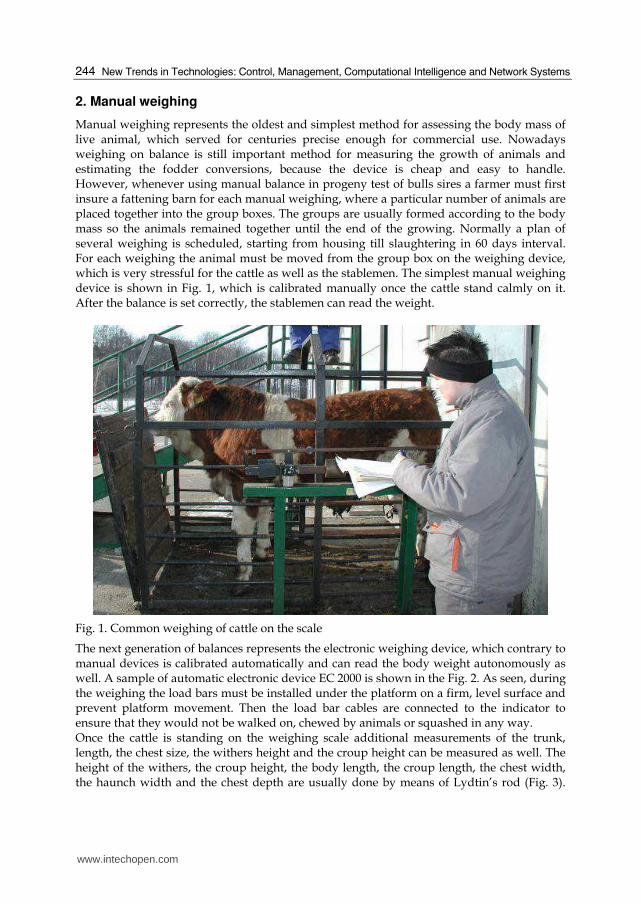
Manual weighing represents the oldest and simplest method for assessing the body mass of live animal, which served for centuries precise enough for commercial use. Nowadays weighing on balance is still important method for measuring the growth of animals and estimating the fodder conversions, because the device is cheap and easy to handle. However, whenever using manual balance in progeny test of bulls sires a farmer must first insure a fattening barn for each manual weighing, where a particular number of animals are placed together into the group boxes. The groups are usually formed according to the body mass so the animals remained together until the end of the growing. Normally a plan of several weighing is scheduled, starting from housing till slaughtering in 60 days interval. For each weighing the animal must be moved from the group box on the weighing device, which is very stressful for the cattle as well as the stablemen. The simplest manual weighing device is shown in Fig. 1, which is calibrated manually once the cattle stand calmly on it. After the balance is set correctly, the stablemen can read the weight.
Fig. 1. Common weighing of cattle on the scale
The next generation of balances represents the electronic weighing device, which contrary to manual devices is calibrated automatically and can read the body weight autonomously as well. A sample of automatic electronic device EC 2000 is shown in the Fig. 2. As seen, during the weighing the load bars must be installed under the platform on a firm, level surface and prevent platform movement. Then the load bar cables are connected to the indicator to ensure that they would not be walked on, chewed by animals or squashed in any way. Once the cattle is standing on the weighing scale additional measurements of the trunk, length, the chest size, the withers height and the croup height can be measured as well. The height of the withers, the croup height, the body length, the croup length, the chest width, the haunch width and the chest depth are usually done by means of Lydtin’s rod (Fig. 3).
www.intechopen.com

Non Invasive Estimating of Cattle Live Weight Using Thermal Imaging
245
The beginning and the end of certain body dimension are taken by two foldable arms, which can be moved vertically on the rod. However, for measuring of animals the stableman must apply additional devices as the 117 cm long hollow Lydtin’s rod, measuring tape – meter and the compasses (Fig. 3 left). The measuring tape is a 2.00 cm long scale made of linen or metal and serve to measure the chest size. Unfortunately, there are certain differences between the body masses stated by individual authors. The compasses are metallic and ensure measuring of up to 60 cm length (Kräußlich, 1994; Cepon et al., 2006).
Fig. 2. A cattle standing on the electronic weighing device EC 2000
Fig. 3. Lydtin’s rod, measuring tape – meter and compasses (left), a cattle during measuring a wither (right)
www.intechopen.com

New Trends in Technologies: Control, Management, Computational Intelligence and Network Systems
246
3. Automatic weighing
Automatic weighting systems have been intensively researched for pigs, sheep and poultry,
however in cattle production only weighting of dairy cows is reported by Cveticanin &
Wendl (2004) and Pastell et al., (2006). Different automatic weighing systems have been
intensively researched in cattle as well as dairy production.
The sophisticated radio frequency identification system was found to be a highly effective
tool for documenting bunk attendance, feeding behaviour and weighing of animals on the
scale in cattle production, whenever animals were equipped with two separate RF
transponders (Schwartzkopf-Genswein et al., 2002).
There is a worldwide movement towards automation in cattle husbandry, with the objective
of fully automating every process from feeding to milking. Automatic milking has become a
common practice in dairy production and, at the end of the year 2003, about 2200 farms
worldwide used a milking robot (Rousing et al., 2004). Milking robots offer a unique
possibility for the dynamic measurement of body weight. For example, it is highly probable
that hoof problems can easily be noted by separately measuring the load on each leg. Dairy
farming is developing into full automated production system in which scientists want to
automate every single process from feeding to milking in order to reduce production costs
and maximise milk yield. Dynamic weighing of cattle represents an important segment of
this system. Weighing in motion without stopping the animal’s movement after it leaves the
milking parlour is of interest due to continuity of the milking process and smaller variations
of body weight when measured at the same time of the day. The forces to the ground during
the cow’s passage are recorded on walk-through weighers (Rousing et al., 2004).
Cveticanin & Wendl (2004) designed the fuzzy-logic dynamic weighing system for dairy cows
based on a mathematical model for simulating a cow’s walk, which calculates the body weight
with an average error of less than 2 %. The simplified two- legged system measures the force
to the ground produced by a cow’s feet when the animal is crossing the scale. Depending on
walking speed and force, a body weight is calculated and compared with the database.
Pastell et al. (2006) described another automatic weighing system made from four strain gauge balance devices installed in a milking robot. The computer program was able to measure the average weight, the weight variation of each leg and the total weight with 90 % accuracy. From many different models, two might be suggested for monitoring of young sires.
3.1 The GrowSafeTM
system
The GrowSafeTM (Fig. 4) system consisted of two antennas, each embedded in a rubberized mat lining the outer wall of the 30 m feedbunks, passive transponders (Texas Instruments Inc., Dallas, TX) encased in plastic ear tags (Allflex, Dallas, TX), a data-logging reader panel connected to the antennae, and a computer to which data were uploaded and analysed (Gibb & McAllister, 1999; Schwartzkopf-Genswein et al., 1999). The antennae emitted a 130 kHz electromagnetic field, and detected the transponders borne by the cattle whenever they came within 50 cm of the feedbunk. This system can identify and record bunk attendance at the bunk of an unlimited number of
animals simultaneously. The reader panel logs the presence of each transponder every 6 s
for as long as the transponders are within the read range of the antenna. These data can be
use to derive the bunk visit frequency and duration. For the purpose of summarizing the
transponder data, different meal criterion can be selected. According to Gibb & McAllister
www.intechopen.com

Non Invasive Estimating of Cattle Live Weight Using Thermal Imaging
247
(1999) a 300 s meal criterion is most suitable, since it is based on visual observation and
validation work carried out by (Schwartzkopf-Genswein et al., 2002) and is the same as that
reported by Sowell et al. (1998) for beef cattle.
Passive radio transponder data is possible to be collected on all the animals for 24 h per day throughout the growing period. The computer on which the data are storied must be checked every week to ensure that all cells are read when the animals’ transponders are held next to the cell.
Every time an animal visits the water trough GrowSafe BeefTM measures weight and drinking behaviour, so the graph can be plotted illustrating the number of visits hourly at
each GrowSafe BeefTM drinking position over a three day period.
Fig. 4. GrowSafe BeefTM weighing system
At least two other system similar to the GrowSafe BeefTM system are known from the literature. First, Cveticanin & Wendl (2004) designed the fuzzy-logic dynamic weighting system of dairy cow based on the mathematical model for simulating cow walk, which calculates the body weight with the absolute average error less than 2 %. The simplified two legged system measures the force to the ground when the animal is crossing the scale and generate a curve, which is compared with the database. Pastell et al. (2006) described another automatic weighing system made from four strain gauge balances equipment installed into a milking robot. The computer program was able to measure the average weight, the weight variation of each leg and total weight with 90 % accuracy.
4. Weight determination using body measurements
Since weighting of older cattle represents a dangerous job for the stableman, the significant correlation between live weight and dimensions of the cattle has led many authors to study the possibility of estimating body weight from the dimensions of the cattle. Heinrichs et al. (1992) indicated that the linear regression of body weight on heart girth had the highest R2, followed by hip width, body length and wither height. Although all measurements are highly correlated, addition of the second body measure contributes a little predictive benefit
www.intechopen.com

New Trends in Technologies: Control, Management, Computational Intelligence and Network Systems
248
in the estimation of Holstein heifers’ body weight. Also Wilson et al. (1997) detected the addition of heart girth as a second measurement to the wither height as the most important contribution for estimating the body weight of Holstein veal calves. Enevoldsen & Kristensen (1997) evaluated the use of wither height, hip height and width to predict the body weight. Seven regression models were developed based on indicators, which are relatively simple to obtain precisely because the anatomical locations are easy to identify. Also Willeke & Dürsch (2002) detected high significant correlation in hip height, heart girth and weight also for the Simmental heifers suggested the third order polynomial equation as the most fitting. The chest size as a basis for the determination of the body mass of living cattle is increased close behind the shoulder-bones. During this measuring the animal must stand with the legs placed parallel and the head should be kept normally (Fig. 1). Each time after the measurement is taken, the body mass is read according to the table. However, it must be kept into account that the determination of the body mass on the basis of the chest size is only approximate.
5. Determining dimensions by image analysis
Computer-controlled systems for the remote monitoring of livestock have the potential to increase production efficiency and improve animal health and welfare. Examples of potential applications for image analysis based systems in pig husbandry were suggested by Schofeld (2003) and include recording of animal weight, growth rate, quality and conformation, control of diet, monitoring behavioural vices and providing management decision support. Schofeld (1993) describes how remote monitoring systems have the greatest value where continuous observation of intermittent events is essential, and where data collection is tedious and labour intensive, e.g. monitoring weight gain, feeding behaviour and breeding processes including heat detection and farrowing. A visual image analysis (VIA) system can provide continuous automatic collection of size and shape data in pigs. Thus, it serves as an accurate means of for reflecting pig live mass and for tracking changes in the pig size over time periods that are sufficiently short for commercial use (White et al., 2004). In order to apply image analysis to the weighing of bulls, the determination of animal body dimensions from images must be possible. Prior to using the image processing, a prediction function was established using the relationship between body dimensions from acquired images and the live weight of the specific cattle breed. Since the image is only a 2-D plain projection of the animal, the loss of one dimension limits the application of such a system to measuring vertical and horizontal dimensions. Therefore, the prediction functions should be precise enough to obtain valid information and can be similar to those described in the previous chapter only when the hip height and wither height are included in the polynomial equations. According to Schaefer & Tong (1998), the thermal expression of warm-blooded animals is highly correlated with various tissue composition characteristics of specific animals, which involve the relative proportions and total quantities of different types of tissue in the animal. Therefore infrared thermal images taken of liveanimals are suggested for detecting and inspecting the body composition noninvasively. Kmet et al. (2000) studied the application of image processing for slaughter value analysis on the basis of three images (above, left and rear) captured from 15-month-old, live
www.intechopen.com

Non Invasive Estimating of Cattle Live Weight Using Thermal Imaging
249
Simmental bulls. Live weight was found to be highly correlated with a stepwise linear regression model based on the animal shoulder width, lumbar protuberance in the body width, upper body area and rear thigh area. In the next chapter we are going to present the results of original approach for determining the body dimensions and estimating the body mass of cattle via thermal camera and image analysis developed by Stajnko et al. (2008), which was based on the data collected from May 2006 to June 2008 at the Faculty’s experimental farm in Rogoza.
6. Image analysis procedure
As opposed to common RGB visual techniques, thermography is based on sensing an object’s own heat radiation. This enables evaluation of different characteristics of observed objects with the use of visual cameras. The authors have found few references concerning application of thermal imaging for determining plant parts, counting fruit, vegetable, seedlings or selecting weeds from plants and background. In our experiment the examined cattle were captured from the side by the AGEMA 570 (Flir SystemsTM) thermal camera with an image resolution of 320x240 pixels. The emissivity of the object was set to 0.98 and the temperature resolution was better than 0.5°C, which enables precise detection of body heat in any environmental condition. The measurements were performed using cold concrete wall surroundings, which enabled a temperature difference and therefore a sharp edge between the animal and the background on the capture images. The uncertainty of body edge measurements depends on the image resolution and the position of animal in relation to the camera. Therefore, for holding the distance between the camera and the object constant for all measurements, the animals were guided through a narrow corridor, which also prevented the animal from moving perpendicular to the camera. When the animal was walking through the corridor, we were waiting until it stood in an appropriate position on the image frame. Such procedure was possible because the animals were not aware of being captured by the thermal camera.
Fig. 5. Sample thermal images at 320x240 pixel resolution showing a 280 kg cattle before (left) and after temperature adjustment (right)
Since a thermal camera supports only its own IMG image format, each series of images was first converted into a BMP format prior to further image processing. As seen from Fig. 5, during this process, contrasts between the cattle body and the background was extended by adjusting the temperature scale on each series of thermal images according to the average body and surroundings temperature.
www.intechopen.com
New Trends in Technologies: Control, Management, Computational Intelligence and Network Systems
250
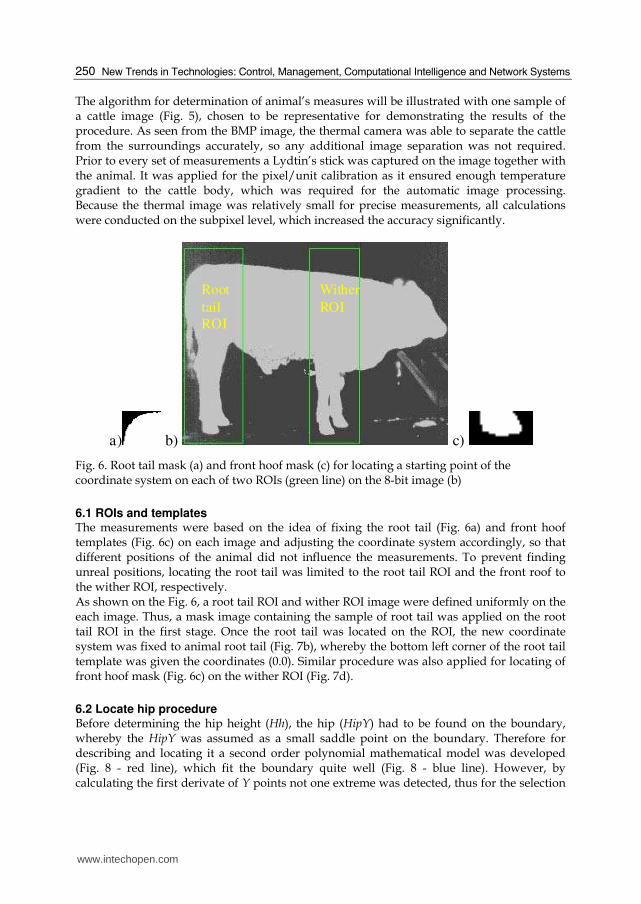
The algorithm for determination of animal’s measures will be illustrated with one sample of a cattle image (Fig. 5), chosen to be representative for demonstrating the results of the procedure. As seen from the BMP image, the thermal camera was able to separate the cattle from the surroundings accurately, so any additional image separation was not required. Prior to every set of measurements a Lydtin’s stick was captured on the image together with the animal. It was applied for the pixel/unit calibration as it ensured enough temperature gradient to the cattle body, which was required for the automatic image processing. Because the thermal image was relatively small for precise measurements, all calculations were conducted on the subpixel level, which increased the accuracy significantly.
a) b) c)
Root
tail
ROI
Wither
ROI
Fig. 6. Root tail mask (a) and front hoof mask (c) for locating a starting point of the coordinate system on each of two ROIs (green line) on the 8-bit image (b)
6.1 ROIs and templates The measurements were based on the idea of fixing the root tail (Fig. 6a) and front hoof templates (Fig. 6c) on each image and adjusting the coordinate system accordingly, so that different positions of the animal did not influence the measurements. To prevent finding unreal positions, locating the root tail was limited to the root tail ROI and the front roof to the wither ROI, respectively. As shown on the Fig. 6, a root tail ROI and wither ROI image were defined uniformly on the each image. Thus, a mask image containing the sample of root tail was applied on the root tail ROI in the first stage. Once the root tail was located on the ROI, the new coordinate system was fixed to animal root tail (Fig. 7b), whereby the bottom left corner of the root tail template was given the coordinates (0.0). Similar procedure was also applied for locating of front hoof mask (Fig. 6c) on the wither ROI (Fig. 7d).
6.2 Locate hip procedure Before determining the hip height (Hh), the hip (HipY) had to be found on the boundary, whereby the HipY was assumed as a small saddle point on the boundary. Therefore for describing and locating it a second order polynomial mathematical model was developed (Fig. 8 - red line), which fit the boundary quite well (Fig. 8 - blue line). However, by calculating the first derivate of Y points not one extreme was detected, thus for the selection
www.intechopen.com

Non Invasive Estimating of Cattle Live Weight Using Thermal Imaging
251
a)
d)
of saddle points the following relational and logical operations were additionally carried out:
HipY y'(i)=0 and y''( i-1) > 0 and y''(i+1)< 0 (1)
b) c)
e) f)
Hip Y
Hbymin
Fig. 7. Image processing to obtain the body dimensions; a) root tail ROI, b) fixing new root coordinate, c) hip height measurement, d) wither ROI, e) fixing front hoof coordinates, f)wither height measurement.
-20
-10
0
10
20
30
40
50
60
1 3 5 7 9 11 13 15 17 19 21 23 25 27 29 31 33 35 37 39
Pixel value (x)
Pix
el v
alu
e (Y
)
HipY measurement Hip Y polynom value Hip Y 2nd derivative
Fig. 8. A second-polynomial mathematical model (red) for detecting the hip on the boundary layer (white).
6.3 Procedure for measuring hip As seen from the Fig. 7c, the hip height (Hh) was defined as a vertical distance between the HipY and the bottom part of the back hoof (Hbymin), which had to be located from the root tail ROI.
www.intechopen.com

New Trends in Technologies: Control, Management, Computational Intelligence and Network Systems
252
6.4 Locate wither procedure Before determination of the wither height (Wh), the wither point (WitY) was found on the upper part of the boundary layer first. A wither was assumed to be a local maximum point inside the wither ROI. Therefore another polynomial mathematical model was developed, which fit the real wither accurately. After processing the first derivate of Y points on such model, the minimum extreme points were calculated (yellow line) and compared to measured data according to the following relational and logical operations:
Wymax y'(i)=0 and y( i-1) < y(i) < y(i+1) (2)
6.5 Measure wither A wither was defined as a vertical distance between wither (WitY) and the most bottom part of the front hoof (Hfymin) on the boundary layer. As seen from the Fig. 7f, this point was assumed to be the most bottom point of the wither ROI.
6.6 Calculating weight On the basis of the eight-year data set, three models for calculating the cattle weight were developed, which include main body characteristics of each animal of the given Simmental herd. Since, in the period of progeny test all cattle were in fact sons of eight cattle sire lines, the herd was genetically relative unique. Thus, the applied data served excellently for evaluating our group of experimental animals. As already reported by Enevoldsen & Kristensen (1997) and Heinrichs et al. (1992) measurement of heart-girth (chest circumference) was commonly used to estimate dairy heifer body weight from previously derived equations or tables. However, many experiments showed that variability of heart girth measurements depended significantly from the weighing classes (42–590 kg). Thus measured standard deviations can varied from 2.19 cm to 2.74 cm within one observer. However, repeatability between two heart-girth measurements by an individual observer on the same animal using a blind heart girth tape was >0.99. additionally correlation coefficients between two measurements by different observers using blind measuring tapes on the same animal also were >0.99, with 99% of total differences due to observer and heifer, indicating very little random variation. Based on previous experiences of Enevoldsen & Kristensen (1997) and Heinrichs et al. (1992) the wither height and the hip height was determined as most significant body dimensions for estimating the cattle body weight also in our experiment with thermal camera and image analysis system. From this reason we choose wither and height measures as most convenient for estimating the cattle live weight. The following three regression models were chosen to be investigated:
(BW 1) Bw = -1072.47+12.47*Wh R2=0.89 ( p<0.01) (3)
(BW 2) Bw = -1277.40+13.50*Rh R2=0.93 ( p<0.01) (4)
(BW 3) Bw = -1236.50+3.01*Wh+10.301*Rh R2=0.93 ( p<0.01) (5)
Various commercial programs for performing the above described procedure exist. For our research the IMAQ Vision 7.1. and Labview 7.0. from National Instruments® were used in our research. Statistical analyses of results obtained manually and by thermal imaging were performed using SPSS Package Program 13.0.
www.intechopen.com

Non Invasive Estimating of Cattle Live Weight Using Thermal Imaging
253
7. Accuracy of the thermal image procedure
The summary statistics for means, standard deviations and coefficient of variation for whither height and hip height of the experimental Simmental cattle at different age of animals are presented in the Table 1. In the Table 2 the mean cattle weight estimation is represented on the basis of three regression models BW 1, BW 2 and BW3, respectively which clearly show that the body weight of animals was better predicted with all models from the middle period of testing than at the first two measurements. Also Wilson et al. (1992) reported better results for week 16 than week 8 and 4, whenever testing the Holstein veal calves for the period of 14 weeks. Thus, it was suggested for the future experiments to take BW 3 model with the wither height and hip height input parameters as most accurate for estimating weight of young cattle at the average age of 139 days. At the second weighting (day 207) all three models overestimated the BW most however, the BW 1 model most closely fit the measured data. For all successive weightings the BW was estimated equally with all models, while for the last measurement at day 449, the SD for BW 1 was slightly higher than for the other two. Although the BW 1 resulted in the smallest absolute difference from the weighted BW again, it is seen from the SD values that additional body dimensions need to be introduced into future models for this particular age of animals.
AGE Whm Whe Hhm Hht
(days) x SD CV x SD CV x SD CV x SD CV
139 102 3.54 3.47 102 5.81 5.70 109 3.21 2.94 109 6.04 5.54
207 107 4.83 4.51 112 4.12 3.68 115 3.57 3.10 120 2.74 2.28
261 116 3.23 2.78 120 3.73 3.11 122 3.22 2.64 126 3.28 2.60
317 122 2.92 2.39 125 3.91 3.13 129 2.3 1.78 129 3.09 2.40
380 129 3.19 2.47 128 3.12 2.44 133 3.06 2.30 134 2.92 2.18
401 128 4.01 3.13 130 2.45 1.88 135 3.71 2.75 135 2.34 1.73
449 133 3.27 2.46 132 1.92 1.45 138 3.21 2.33 137 1.50 1.09
R2 0.7479* 0.7554**
** - p<0.01, Whm wither height manually, Whe wither height estimated, Hhm hip height manually, Hhe hip height estimated Table 1. Mean wither height (Wh) and hip height (Hh) of Simmental cattle measured manually and estimated with thermal camera at different ages (n=24)
The established correlation coefficients for estimating the body weight on the basis of our three models are very close to results of Enevoldsen & Kristensen (1997) on Danish Frisien and Jersey cows, whereby the established R2 varied between 0.80 and 0.89. Moreover, the results of our linear regression models correspond very well with the linear models developed by Wilson et al. (1997) for measuring the body weight of special-fed Holstein veal calves, the established R2 was 0.73 for the wither height and 0.89 for the hip height, respectively. Knowing that several hundred animals were manually measured in both experiments, the thermography and image analysis procedure is feasible and an equivalent method sufficient for predicting the body weight on live animals.
www.intechopen.com

New Trends in Technologies: Control, Management, Computational Intelligence and Network Systems
254
Furthermore, when comparing the results of our experiment with Heinrichs et al. (1992), who on a much bigger sample of experimental heifers, undoubtedly established better correlations for hip height (R2=0.95), for wither height (R2=0.94) and for both dimensions together (R2=0.98), the indirect estimating of body weight from images still represents an accurate procedure to be evaluated also in other breeds and fodder conditions. The high correlation indicates that all three models applied in the research estimated the cattle weight accurately during the whole observing period, although a little difference between all of them appeared at a specific age of cattle.
AGE BWm (kg) BW 1 (kg) BW 2 (kg) BW 3 (kg)
days x SD x SD Index BW1/ BWm
x SD Index BW2/ BWm
x SD Index BW3/ BWm
139 181 31,19 193 72,42 110 190 81,58 105 189 79,48 104
207 254 38,78 318 51,27 125 346 37,01 136 339 39,56 133
261 356 46,98 420 46,53 118 424 44,27 119 423 44,27 119
317 450 35,9 481 48,66 107 470 41,68 104 473 42,76 105
380 498 26,68 522 38,91 105 527 39,37 106 527 39,28 106
401 528 51,15 551 30,57 104 550 31,54 104 551 30,93 104
449 594 30,29 573 23,94 96 568 20,27 96 570 20,75 96
R2 0,796** 0,792** 0,798**
** - p<0,01 BWm body weight manually BW 1 estimated body weight with model 1 BW 2 estimated body weight with model 2 BW 3 estimated body weight with model 3
Table 2. Mean body weight of experimental Simmental cattle measured manually and estimated with three models at different ages (n=24).
The high regression statistics indicate that all models applied in the research estimated the bull weight accurately across the whole observing period, although the BW2 models with Hh as the input parameter appeared to be more precise. The system was proven to facilitate fast, frequent investigation of bulls even in the growing pens without painful stress for the whole herd. However, for extended on-line application in the open field, introduction of the specific BW2 models is preferable to BW1. Thus, for measuring the Wh, a steadier posture of the animal during image capture is required, which is relatively difficult to achieve. This procedure proved to be particularly difficult with young bulls till day 340 since these animals were rather wild in the pens and during measuring on the scales. However, additional optimising of the chosen parameters measured by the thermal camera could even improve predictions of the live weight of young animals. The system was proved to enable a faster investigation of cattle frequently even in the growing pens without painful stress for the whole herd. However, for wider on-line application in the open field, the introduction of the simplest BW 1 with the Hh is preferred, since the measuring of Wh requires better positioning of the animal during capture with the camera, which is relatively difficult to achieve. This procedure was shown particularly
www.intechopen.com

Non Invasive Estimating of Cattle Live Weight Using Thermal Imaging
255
difficult with young cattle until day 340 that were still very wild in the pens and during measuring on the scales.
8. Acknowledgement
The authors acknowledge the vital contributions made by the following colleagues: Marko Ocepek, who was responsible for the manual measurements, Petra Eker the head of the stable and stableman Aleš Pauman, who were always willing to help during the measurements on the scale.
9. References
Brandl, N. & Jørgensen, E. (1996). Determination of live weight of pigs from dimensions measured using image analysis. Computers and electronics in agriculture. 15., 52-72, ISSN 0168-1699
Cepon, M.; Klopcic, M., Potocnik, K., Zgur, S. & Dovc, P. (2006). Technical rules and description of methods for measuring and calculating production and other properties and methods for predicting genetic values for pure breed reproductive cattle in Slovenia, Biotechnical Faculty, Zootechnical department, Domžale.
Cveticanin, D. & Wendl, G. (2004). Dynamic weighing of dairy cows: using a lumped-parameter model of cow walk. Comput. Electron. Agric., 44., 63–69, ISSN 0168-1699
de Haer, L.C.M. & Merks, J.W.M. (1992). Patterns of daily food intake in growing pigs. Anim. Prod., 54., 95–104, ISSN 0003-3561
de Koning K. & Rodenburg, J. (2004). Automatic milking: state of the art in Europe and North America. In: Automatic Milking. A Better Understanding, Meijering A; Hogeveen H; deKoning C. J. A. M., (Ed.), 27–41, Wageningen Academic Publishers, ISSN 0168-1699, Wageningen
Enevoldsen, C. & Kristensen, T. (1997). Estimation of Body Weight from Body size measurements and body condition scores in dairy cows. Journal of Dairy Science, 80., 9., 1988-1995, ISSN 0022-0302
Gibb, D.J. & McAllister, T.A. (1999). The impacts of feed intake and feeding behaviour of cattle on feedlot and feedbunk management, Proceedings of the 20th Western Nutrition Conference on Marketing to the 21st Century, pp. 101–116
Heinrichs, A.J.; Rogers, G.W. & Copper, J.B. (1992). Predicting body weight and wither height in Holstein using body measurements. Journal of Dairy Science, 75., 12., 3546-3581, ISSN 0022-0302
Kmet, J.; Sakowski, T., Huba, J., Peskovicova, D., Chrenek, J. & Polak, P. (2000). Application of video image analysis in the slaughter value estimation of live Simmental bulls. Archiv für Tierzucht, 43., 4., 411-416, ISSN 0003-9438
Kogel, S. & Utz, J. (1988). Wie gut eigenen sich Fleckviehbullen fur Gebrauchskreuzungen. Tierzuchter, 40., 385-388, ISSN 0040-7364
Kräußlich, H. (1994). Tierzuchtungslehre. Verlag Eugen Ulmer, ISBN 3-8001-4371-2, Stuttgart Pastell, M.; Takko, H., Gröhn, H., Hautala, M., Poikalainen, V., Praks, J., Veermäe, I., Kujala,
M. & Ahokas, J. (2006). Assessing cows’ welfare: weighing the cow in a milking robot. Biosyst. Eng., 93., 1., 81–87, ISSN 1537-5110
Rousing, T.; Bonde, M., Badsberg, J.H. & Sørensen, J.T. (2004). Stepping and kicking behaviour during milking in relation to response in human-animal interaction test
www.intechopen.com

New Trends in Technologies: Control, Management, Computational Intelligence and Network Systems
256
and clinical health in loose housed dairy cows. Livest. Prod. Sci., 88., 1–8, ISSN 0301-6226
Schaefer, A.L. & Tong, A.K. (1998). Process for determining a tissue composition characteristic of an animal. Patent number PCT/CA1998/000209
Schofeld, C. P. (1993). Image analysis for non-intrusive weight and activity monitoring of live pigs. In: Proceedings of the 4th International Symposium on Livestock Environment, pp. 503-510, ISBN 0929355415,University of Warwick, England, ASAE Publication
Schwartzkopf-Genswein, K.S.; Atwood, S. & McAllister, T.A. (2002). Relationships between bunk attendance, intake and performance of steers and heifers on varying feeding regimes. Appl. Anim. Behav. Sci., 76., 3., 179–188, ISSN 0168-1591
Sowell, B.F.; Bowman, J.G.P, Branine M.E. & Hubbard, M.E. (1998). Radio frequency technology to measure feeding behavior and health of feedlot steers. Appl. Anim. Behav. Sci., 59., 277–284, ISSN 0168-1591
Stajnko, D.; Brus, M. & Hočevar, M. (2008). Estimation of bull live weight through thermo graphically measured body dimensions Computers and Electronics in Agriculture, 61., 2., May 2008, 233-240, ISSN 0168-1699
White, R.P.; Schofield, C.P., Green, D.M., Parsons, D.J. & Whittemore, C.T. (2004). The effectiveness of a Visual Image Analysis (VIA) system for monitoring the performance of growing/finishing pigs. Anim. Sci., 78, 409–418, ISSN 1357-7298
Willeke, H. & Dürsch, T. (2002). Prediction of the body weight of Simmental heifers using heart girth measurements. Archiv für Tierzucht, 45., 1., 23-28, ISSN 0003-9438
Wilson, L.L.; Egan, C.L. & Terosky, T.L. (1997). Body measurements and body weights of special-fed Holstein Veal Calves. Journal of Dairy Science, 80., 11., 3077-3082, ISSN 0022-0302
www.intechopen.com

New Trends in Technologies: Control, Management,Computational Intelligence and Network SystemsEdited by Meng Joo Er
ISBN 978-953-307-213-5Hard cover, 438 pagesPublisher SciyoPublished online 02, November, 2010Published in print edition November, 2010
InTech EuropeUniversity Campus STeP Ri Slavka Krautzeka 83/A 51000 Rijeka, Croatia Phone: +385 (51) 770 447 Fax: +385 (51) 686 166www.intechopen.com
InTech ChinaUnit 405, Office Block, Hotel Equatorial Shanghai No.65, Yan An Road (West), Shanghai, 200040, China
Phone: +86-21-62489820 Fax: +86-21-62489821
The grandest accomplishments of engineering took place in the twentieth century. The widespreaddevelopment and distribution of electricity and clean water, automobiles and airplanes, radio and television,spacecraft and lasers, antibiotics and medical imaging, computers and the Internet are just some of thehighlights from a century in which engineering revolutionized and improved virtually every aspect of human life.In this book, the authors provide a glimpse of the new trends of technologies pertaining to control,management, computational intelligence and network systems.
How to referenceIn order to correctly reference this scholarly work, feel free to copy and paste the following:
Peter Vindis, Maksimiljan Brus, Denis Stajnko and Marjan Janzekovic (2010). Non Invasive Weighing of LiveCattle by Thermal Image Analysis, New Trends in Technologies: Control, Management, ComputationalIntelligence and Network Systems, Meng Joo Er (Ed.), ISBN: 978-953-307-213-5, InTech, Available from:http://www.intechopen.com/books/new-trends-in-technologies--control--management--computational-intelligence-and-network-systems/non-invasive-weighing-of-live-cattle-by-thermal-image-analysis

© 2010 The Author(s). Licensee IntechOpen. This chapter is distributedunder the terms of the Creative Commons Attribution-NonCommercial-ShareAlike-3.0 License, which permits use, distribution and reproduction fornon-commercial purposes, provided the original is properly cited andderivative works building on this content are distributed under the samelicense.