non-linearity of scorecard log-odds · 2017-10-04 · non-linearity of scorecard log-odds ross...
TRANSCRIPT

Non-Linearity of Scorecard Log-OddsRoss McDonald, Keith Smith, Matthew Sturgess, Edward HuangRetail Decision Science, Lloyds Banking Group
Edinburgh Credit Scoring Conference26th August 2009

2
Lloyds Banking Group� Lloyds Banking Group was formed by the acquistion of HB OS by Lloyds
TSB
� Three key relationship brands:
� The retail bank currently has� 30 million customers� 23 million current accounts� Number one positions in Mortgages and Savings
� Retail Decision Science employs ~150 specialists an d modellers in Acquisition, Account Management, Collections and Re coveries, Basel and Impairment, Infrastructure, Portfolio Modelling, Fraud and Marketing.

3
Outline
�The Problem – Non-linear score to log-odds relationship in scorecard models
�Why does it matter? – Uses of scorecard models, where do we need pr(event)?
�Why does it happen? – Uneven data distributions, correlation across bins
�How can we fix it? – Some remedies, pros and cons

4
The Problem
Log-Odds Against Inferred Log-Odds Divergence Maximisation - All Bins
-1
0
1
2
3
4
5
6
7
8
9
10
-1 0 1 2 3 4 5 6 7 8
Inferred Log-Odds
Act
ual L
og-O
dds
Log-odds 1-1 Trend

5
The Problem
Log-Odds Against Inferred Log-Odds Divergence Maximisation
0-1 0 1 2 3 4 5 6 7 8 9 10
Inferred Log-Odds
Act
ual L
og-O
dds
Class1 Class2 Poly. (Class1) Poly. (Class2)

6
The Problem� Scorecard models - we frequently notice a curvature in the relationship between
actual (data-estimated) log-odds and the log-odds inferred from the model predictions
� Seen in many different modelling scenarios (default, marketing propensity, fraud etc.)
� The curvature is approximately quadratic
� Common to many linear modelling techniques
� Gini measures ranking performance - very good Ginis
� Deviation at the lower and upper ends of the range – low odds and high odds
� Associated with irregular score distributions

7
Does it Matter?
NO – If we only care about rank order of accounts, bad rates above and below the cut-off.
Low Propensity High PropensityCut-off
�The traditional ways of assessing scorecard performance� Gini� K-S statistic� ROC curve� Concordance� Log-odds to score plot� Log-Likelihood
�Only the log-odds plot reveals incorrect p(event)

8
Does it Matter?� ‘Traditional’ scorecard development� Fit model to training data
� Validate ranking performance of model on test set� Select cutoff� Deploy scorecard – use cutoff to make automated decisions (eg. grant credit,
send mail, flag as fraud), vary as required to control volumes
� As long as the model’s ranking performance is good, we do not really care how good the model’s predictions p(event) are
� Any monotonic transformation of the model’s predictions will preserve ranking performance, Gini
� We make use of this when we scale scorecard coefficients to a standard form (eg, 600 for equal log odds, every +10 doubles log-odds)

9
Does it Matter?�YES In some scenarios, model accuracy p(event) does matter� Eg:
� Application scorecard built on historic data, predicted bad rates for applicants today used to monitor business strategy and vary cut-off
� Basel 2 – estimated point-in-time PDs by segment based on scorecard default rate estimates
� Capital allocation (based on profitability of a campaign / action)
� Targeting marketing campaigns on multiple dimensions
� Account level strategies that use estimated default rate derived from a scorecard, eg. risk-based repricing, account closure, credit line increase or decrease, collectionsprocesses
� Where we use estimated PD as one component to calculate NPV, expected loss, expected value

10
Does it Matter?�Eg. we predict propensity to respond to a marketing campaign,
divide the scores into segments, and target based on predicted response rates
1 2 3 4 5 6 7 8 9 10
15% 12% 9% 6% 2% 1% 0.5% 0.25% 0.15% 0.05%
Expected response rate 10.5%acceptable

Why Does it Happen?
�Scorecards are usually linear or generalised linear (ie. logistic) models
�Advantages:�1 coefficient per variable (or bin)� Interpretability – both model coefficients and output�Robustness�Easy to implement�Output can be linearly scaled to log-odds�Do not need technical understanding to use scorecards once
built�Disadvantages:
� May not capture complex interactions easily� Possible instability of fitting method� Non-linearity of log-odds

12
Why Does it Happen?
Class 1
Class 2
Optimal separating hyperplancfixed bycutoff)
Direction of optimal separation(defined byfitted modelcoefficients)
Contours of equal score

13
Why Does it Happen?
�Model-building methods:� Maximisation of Fisher Distance / Divergence
� ‘Maximise the separation of the means of score distributions while minimising the total variance’
ββµµβ
rr
rrr
)(
))((
21
221
Σ+Σ′−⋅
Ronald Fisher

14
Why Does it Happen?
�Maximisation of Fisher Distance / Divergence -�2 options:
� Linear Discriminant Analysis� Assume equal covariance matrix for both classes - then differentiate and set
equal to zero.� Optimal solution is then given by
� Direct optimisation – Use an optimisation method to solve directly.
( )211
==− −Σ= yy µµβ rrr

15
Why Does it Happen?
Log-Odds Against Inferred Log-Odds Linear Discriminant Analysis
-1
0
1
2
3
4
5
6
7
8
9
10
-1 0 1 2 3 4 5 6 7 8
Inferred Log-Odds
Act
ual L
og-O
dds
Log-odds 1-1 Poly. (Log-odds)

16
Why Does it Happen?
Log-Odds Against Inferred Log-Odds Linear Discriminant Analysis
0
-1 0 1 2 3 4 5 6 7 8 9 10
Inferred Log-Odds
Act
ual L
og-O
dds
Class1 Class2 Poly. (Class1) Poly. (Class2)

17
Why Does it Happen?
Log-Odds Against Inferred Log-Odds Divergence Maximisation - All Bins
-1
0
1
2
3
4
5
6
7
8
9
10
-1 0 1 2 3 4 5 6 7 8
Inferred Log-Odds
Act
ual L
og-O
dds
Log-odds 1-1 Trend

18
Why Does it Happen?
Log-Odds Against Inferred Log-Odds Divergence Maximisation
0-1 0 1 2 3 4 5 6 7 8 9 10
Inferred Log-Odds
Act
ual L
og-O
dds
Class1 Class2 Poly. (Class1) Poly. (Class2)

19
�Logistic Regression
Why Does it Happen?
kkxxxp
p ββββ ++++=
K22110
1
2log
�Solved by maximising likelihood, usually using iterative Newton-Raphson to solve non-linear equations (or can solve directly).
�When there is only one binned variable in the model (so no overlap of dummy variables), it can be shown that
−=
∑
∑
=
=
1
1
)1(log
i
i
xi
xi
j y
y
cβ Weights of Evidence

20
Why Does it Happen?
Log-Odds Against Inferred Log-Odds Logistic Regression - All bins
-1
0
1
2
3
4
5
6
7
8
9
10
-1 0 1 2 3 4 5 6 7 8
Inferred Log-Odds
Act
ual L
og-O
dds
Log-odds 1-1 Poly. (Log-odds)

21
Why Does it Happen?
Log-Odds Against Inferred Log-Odds Linear Discriminant Analysis
0
-1 0 1 2 3 4 5 6 7 8 9 10
Inferred Log-Odds
Act
ual L
og-O
dds
Class1 Class2 Poly. (Class1) Poly. (Class2)

22
� It can be shown that if the score distributions are normal with means and and variances and then the log-odds to score
relationship is quadratic:
Why Does it Happen?
2µ1µ 21σ 2
2σ
cbsas ++2
� Where
−++
===
−=
−=
22
22
21
21
2
1
22
221
1
22
21
2
1log
)1(
)2(log
,
,11
2
1
σµ
σµ
σσ
σµ
σµ
σσ
ClassP
ClassPc
b
a
� ie. Unequal reciprocal variances in score distributions lead to curvature.� Note that this assumes normally distributed scores.� Why do we get unequal variances?

Why Does it Happen?
�A simple model� Let’s suppose we have a linear model:
� ie. we have binned all our variables 0/1 and included all bins in the model.� Assume each X is the outcome of a Bernouilli trial with parameter p
dependent on class. ie. for class 1 we have probability p of observing a 1, (1-p) of observing a 0 etc. but p is conditional on class.
� Across the set of bins for a single binned variable the x’s will sum to exactly 1. This is a special case of the multinomial distribution with sum parameter n = 1.
� Within a variable, Var(Xi) = pi(1-pi), Cov(Xi, Xj) = -pipj
knknkkmm xxxxscore βββββ +++++++= ...... 111111110 K

24
Why Does it Happen?
22222121121211110 xxxxscore βββββ ++++=� A simple model, 2 variables, 2 bins:
( )( )
),(2),(2
),(2),(2
)1(2
)1(2)|(
2212221112112211
2112211221112111
212122212
222
21
111112112
122
11
XXCovXXCov
XXCovXXCov
pp
ppclassscoreVar
ββββββββ
ββββββββ
+++
+−−+
+−−+=
� For curvature, the reciprocal of these terms has to differ across classes. 2 components: covariance terms within a bin eg. p11(1-p11). These won’t be equal across classes except in very rare cases (eg. perfect separation, where p11=1 or 0).
� Large covariance terms for bins across different variables Cov(X12,X21) etc.� Can we reduce curvature by eliminating correlated bins?
Within variable bins
Bins across variables

25
How Can We Fix It?
�Can we improve the curvature by eliminating correlated bins?�High bin correlation occurs for several reasons:
� High correlation of ‘missing’ category. Eg. Scorecard models often incorporate bureau data. If one field is missing, others are often missing for the same reason (no relevant data, failure to match address, etc.)
� Correlation of values that have an underlying connection – eg. high credit balance usually means high interest charges.
� Correlation of values where there is no qualifying data – eg. variables summarising arrears behaviour for someone who has never been in arrears.
� It is common practice when building a scorecard to monitor variable correlation.
�Correlation can lead to instability, since we may end up with multiple optimal solutions for coefficients. Reduces interpretability –coefficients may change sign
�Risk: even highly correlated variables can add useful information.

26
How Can We Fix It?
Log-Odds Against Inferred Log-Odds Logistic Regression - 0.5 Threshold
-1
0
1
2
3
4
5
6
7
8
9
10
-1 0 1 2 3 4 5 6 7 8
Inferred Log-Odds
Act
ual L
og-O
dds
Log-odds 1-1 Poly. (Log-odds)

27
How Can We Fix It?
Log-Odds Against Inferred Log-Odds Logistic Regression - 0.45 Threshold
-101234
56789
10
-1 0 1 2 3 4 5 6 7 8
Inferred Log-Odds
Act
ual L
og-O
dds
Log-odds 1-1 Poly. (Log-odds)

28
How Can We Fix It?
Log-Odds Against Inferred Log-Odds Logistic Regression - 0.4 Threshold
-1
0
1
2
3
4
5
6
7
8
9
10
-1 0 1 2 3 4 5 6 7 8
Inferred Log-Odds
Act
ual L
og-O
dds
Log-odds 1-1 Poly. (Log-odds)

29
How Can We Fix It?
Log-Odds Against Inferred Log-Odds Logistic Regression - 0.3 Threshold
-1
0
1
2
3
4
5
6
7
8
9
10
-1 0 1 2 3 4 5 6 7 8
Inferred Log-Odds
Act
ual L
og-O
dds
Log-odds 1-1 Poly. (Log-odds)

30
How Can We Fix It?
Log-Odds Against Inferred Log-Odds Logistic Regression - 0.5 Threshold
0-1 0 1 2 3 4 5 6 7 8 9 10
Inferred Log-Odds
Act
ual L
og-O
dds
Class1 Class2 Poly. (Class1) Poly. (Class2)

31
How Can We Fix It?
Log-Odds Against Inferred Log-Odds Logistic Regression - 0.45 Threshold
0-1 0 1 2 3 4 5 6 7 8 9 10
Inferred Log-Odds
Act
ual L
og-O
dds
Class1 Class2 Poly. (Class1) Poly. (Class2)

32
How Can We Fix It?
Log-Odds Against Inferred Log-Odds Logistic Regression - 0.4 Threshold
0-1 0 1 2 3 4 5 6 7 8 9 10
Inferred Log-Odds
Act
ual L
og-O
dds
Class1 Class2 Poly. (Class1) Poly. (Class2)

33
How Can We Fix It?
Log-Odds Against Inferred Log-Odds Logistic Regression - 0.3 Threshold
0
-1 0 1 2 3 4 5 6 7 8 9 10
Inferred Log-Odds
Act
ual L
og-O
dds
Class1 Class2 Poly. (Class1) Poly. (Class2)

34
How Can We Fix It?
Impact on Gini of Eliminating Correlated Variables
0%
20%
40%
60%
80%
100%
120%
1 0.9 0.8 0.7 0.6 0.5 0.4 0.3 0.2 0.1
Threshold on (absolute) correlation
Gin
i as
% o
f orig
inal
Gin
i

35
How Can We Fix It?
�Other ideas for fixing non-linearity:�Adopt a different binning method. Rather than using dummy
variables, each variable takes a value equal to the weights of evidence value for the current bin. This is equivalent to using dummy variables and enforcing the condition that all model coefficients must be proportional to the weights of evidence. In this case leads to a reduction of 10% in Gini.
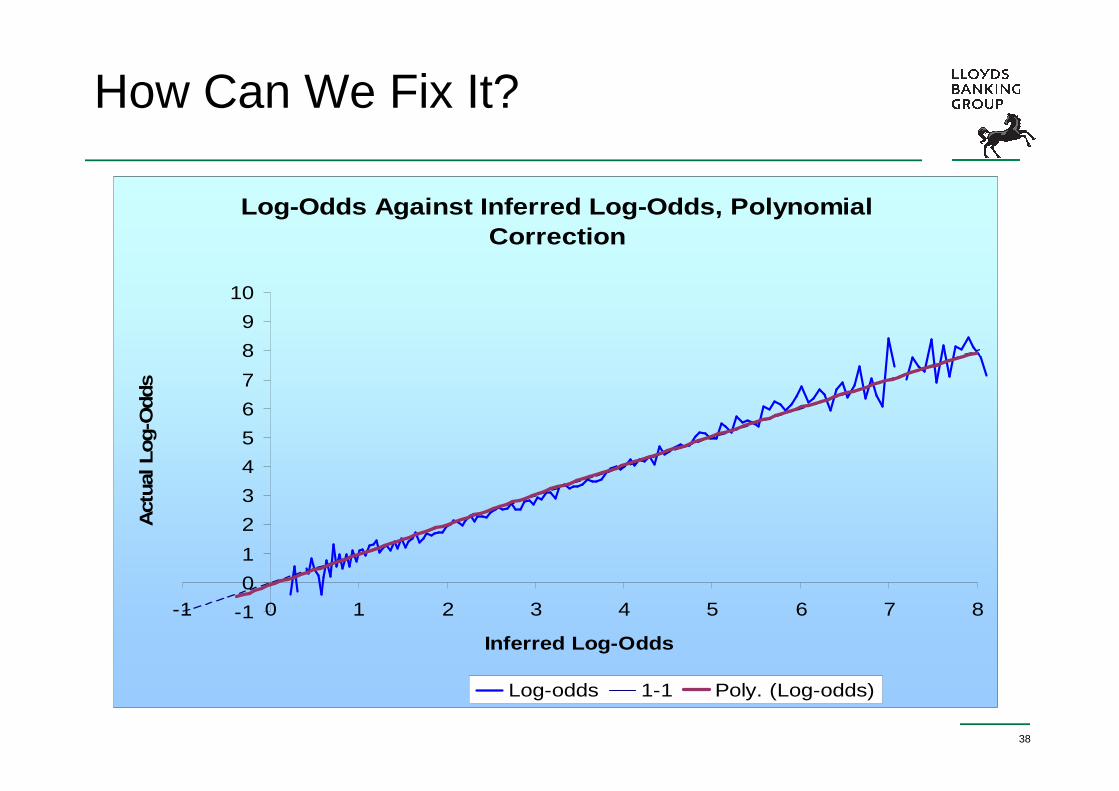
�Apply a retrospective, non-linear scaling to the model scores to align to log-odds (eg. apply a quadratic transformation). No impact on Gini. Disadvantage in that an extra transformation must be applied – no longer derive score by summing values
β

36
How Can We Fix It?
Log-Odds Against Inferred Log-Odds Weights of Evidence Binning
-1
0
1
2
3
4
5
6
7
8
9
10
-1 0 1 2 3 4 5 6 7 8
Inferred Log-Odds
Act
ual L
og-O
dds
Log-odds 1-1 Poly. (Log-odds)

37
How Can We Fix It?
Log-Odds Against Inferred Log-Odds Weights of Evidence Binning
0
-1 0 1 2 3 4 5 6 7 8 9 10
Inferred Log-Odds
Act
ual L
og-O
dds
Class1 Class2 Poly. (Class1) Poly. (Class2)
38
How Can We Fix It?
Log-Odds Against Inferred Log-Odds, Polynomial Correction
-1
0
1
2
3
4
5
6
7
8
9
10
-1 0 1 2 3 4 5 6 7 8
Inferred Log-Odds
Act
ual L
og-O
dds
Log-odds 1-1 Poly. (Log-odds)

39
How Can We Fix It?
Log-Odds Against Inferred Log-Odds Weights of Evidence Binning
0
-1 0 1 2 3 4 5 6 7 8 9 10
Inferred Log-Odds
Act
ual L
og-O
dds
Class1 Class2 Poly. (Class1) Poly. (Class2)

40
Conclusion
�Causes:�Non-linear (quadratic) curvature caused by uneven score
distributions.�This caused by underlying (non-normal) qualities of the data
between classes, exacerbated by collinearity across variable bins
� It has no adverse effect on ranking performance or Gini, but is a problem where we rely on accurate estimation of p(event)
�Solutions:�Eliminate collinear bins when building the model�Enforce weights of evidence proportionality in binning�Try different modelling techniques�Non-linear rescaling of output model scores

41
Questions?