non-performing loans in the eccu: determinants and ... · pdf filenon-performing loans in the...
TRANSCRIPT

WP/16/229
Non-Performing Loans in the ECCU: Determinants and Macroeconomic Impact
by Kimberly Beaton, Alla Myrvoda (IMF), and Shernnel Thompson (Eastern Caribbean Central Bank)
IMF Working Papers describe research in progress by the author(s) and are published to elicit comments and to encourage debate. The views expressed in IMF Working Papers are those of the author(s) and do not necessarily represent the views of the IMF, its Executive Board, or IMF management.

© 2016 International Monetary Fund WP/16/229
IMF Working Paper
Western Hemisphere Department
Non-Performing Loans in the ECCU: Determinants and Macroeconomic Impact
Prepared by Kimberly Beaton, Alla Myrvoda (IMF), and Shernnel Thompson (ECCB)1
Authorized for distribution by Trevor Alleyne
November 2016
Abstract
This paper assesses the determinants of NPLs in the Eastern Caribbean Currency Union (ECCU) and whether a deterioration in asset quality may result in negative feedback effects from the banking system to economic activity. The results suggest that the deterioration in asset quality can be attributed to both macroeconomic and bank-specific factors. Banks with stronger profitability and lower exposure to the construction sector and household loans tend to have lower NPLs. Further, some evidence indicates that foreign owned banks systematically have lower NPLs than domestic banks, pointing to the presence of important differences across bank practices with an impact on asset quality. Finally, the results emphasize the strength of macrofinancial feedback loops in the ECCU.
JEL Classification Numbers: E32, E44, E51, G21
Keywords: Macrofinancial linkages, non-performing loans, credit growth, feedback effects.
Author’s E-Mail Addresses: [email protected]; [email protected]; [email protected]
1 We are grateful to Trevor Alleyne, Leo Bonato, Dmitriy Kovtan, Nicole Laframboise, Inci Otker, Dominique Simard, Jarkko Turunen and colleagues at the Eastern Caribbean Central Bank (ECCB) for helpful comments and suggestions. Hanlei Yun provided excellent research assistance.
IMF Working Papers describe research in progress by the author(s) and are published to elicit comments and to encourage debate. The views expressed in IMF Working Papers are those of the author(s) and do not necessarily represent the views of the IMF, its Executive Board, or IMF management.
3
ABSTRACT ________________________________________________________________________________________ 2
I. INTRODUCTION ________________________________________________________________________________ 4
II. STYLIZED FACTS _______________________________________________________________________________ 6
III. LITERATURE REVIEW _________________________________________________________________________ 9 A. The Determinants of Non-Performing Loans ____________________________________________________9 B. The Macroeconomic Spill-overs of NPLs ______________________________________________________ 10
IV. THE DETERMINANTS OF NON-PERFORMING LOANS IN THE ECCU _____________________ 11 A. Data and Methodology ________________________________________________________________________ 11 B. Results _________________________________________________________________________________________ 13
V. THE DYNAMICS OF NON-PERFORMING LOANS AND MACROECONOMIC EFFECTS _____ 19 A. Data and Methodology ________________________________________________________________________ 19 B. Results _________________________________________________________________________________________ 22
VI. CONCLUSIONS ______________________________________________________________________________ 28
VII. APPENDIX ___________________________________________________________________________________ 30

4
I. INTRODUCTION
Eastern Caribbean Currency Union (ECCU) banks have experienced substantial financial distress following the global financial crisis. At the core of banks’ financial distress has been a significant increase in non-performing loans (NPLs). As of end-2015, banks’ NPLs stood at 17 percent of total loans, well above the region’s prudential guideline of 5 percent. Weak asset quality has contributed to a marked deterioration in banks’ profitability and the overall financial soundness of the banking sector - culminating in the insolvency of three banks in the region and their intervention and resolution by the Eastern Caribbean Central Bank (ECCB).2
Despite the resolution of the three banks most affected by high NPLs, NPLs remain high throughout the regional banking system and present an important obstacle to private sector access to financing. Banks’ deleveraging in response to the deterioration in asset quality has led to a significant contraction in credit to the private sector that persists and continues to be an important restraint on the region’s economic growth. As the regional financial sector is dominated by banks, the strength of the adverse macro-financial feedback loop may be particularly severe for the small economies of the region. For both businesses and households, bank lending remains the largest source of financing, given that other financial intermediaries, such as credit unions and microfinance institutions, have historically played a more complementary role while financial markets remain relatively underdeveloped.
The deterioration in asset quality across the region also reflects the need to strengthen the region’s financial infrastructure and related ability to manage financial risk. Proper screening, collateral use, and effective monitoring help banks manage financial risk. This, however, requires financial markets to establish credit information-sharing institutions, such as credit bureaus and credit-rating agencies; enact sound foreclosure and bankruptcy resolution frameworks; and develop orderly prior pledge (lien) registries, among others. While the work of the ECCU region on a number of these aspects is on-going, regional financial infrastructure requires further strengthening. Specifically, the lack of a credit bureau and credit-rating agencies continues to restrain the availability of borrower’s financial history to potential lenders; shallow property markets limit banks’ ability to value collateral at market value; while long collateral resolution periods, and outdated foreclosure and bankruptcy resolution frameworks often help discourage banks’ willingness to supply credit. These shortfalls of financial infrastructure, in addition to undermining the proper functioning of financial intermediation, to some extent may also have contributed to the increase in NPLs, triggered by the onset of the global financial crisis, and in part may be stalling the speedy clean-up of NPLs.
2 All of which were formally resolved between November, 2015 and April, 2016, after having been intervened by the Eastern Caribbean Central Bank (ECCB) in 2011, namely, the Antigua and Barbuda Investment Bank (ABIB), Caribbean Commercial Bank CCB and the National Bank of Anguilla (NBA). The ECCB assumed control of ABIB in July, 2011.
(continued…)
5
In recognition of the need to improve asset quality while strengthening the region’s financial infrastructure, the ECCB has taken the lead on facilitating the NPL resolution process and reducing financial risk to prevent the future accumulation of delinquent loans. Together with the ECCU member countries, the ECCB is establishing the Eastern Caribbean Asset Management Corporation (ECAMC) to help improve banks’ asset quality and clean-up their balance sheets through the purchases of banks' NPLs.3 Regional foreclosure legislation is under development to help reduce the time and cost of resolving problem loans, while appraisal guidelines have been developed for bankers to help banks to value collateral more effectively. To strengthen the region’s ability to assess credit risk, a regional credit bureau is also being established. Finally, the ECCB is taking steps to improve regulation and supervision of banks in the region, including through proper risk management via risk-based supervision under new strengthened regional legislation.
Notwithstanding the progress made to improve asset quality and support a durable strengthening of financial sector stability through improvements to the region’s financial infrastructure, NPLs remain elevated. Given the banking sector’s significance in financing private sector within the ECCU, its soundness is imperative to support sustainable economic growth and macroeconomic stability. Against this backdrop, this paper seeks to assess the determinants of NPLs in the ECCU and the extent to which the deterioration in bank asset quality may result in negative feedback effects from the banking system to economic activity. First, the determinants of NPLs are evaluated, including the relative importance of macroeconomic developments, both global and country-specific, and bank-specific factors. The analysis is conducted with a unique bank-level panel dataset with universal coverage of all banks, both domestic and foreign, operating in the ECCU. Second, the feedback effects between the banking sector through NPLs and the real economy are assessed using a panel vector autoregression (PVAR) approach to provide insight into how the recent increase in NPLs in the ECCU may affect economic activity.
The results suggest that the deterioration in asset quality in the ECCU can be attributed to both macroeconomic factors, including the prolonged recession in the region following the global financial crisis and slow pace of economic recovery, and bank-specific factors. Banks with stronger profitability and lower exposure to the volatile construction and tourism sectors and household loans tend to have lower NPLs. There is also some evidence that foreign owned banks systematically have lower NPLs than domestic banks, suggesting that there are important institutional differences across bank practices with a meaningful impact on asset quality. Finally, the results emphasize the strength of macro-financial feedback loops in the ECCU. Strengthened asset quality will be important to reverse these negative feedback loops and support sustained economic growth, meanwhile stronger economic growth will be imperative to strengthen asset quality and financial stability.
3Once operational, the ECAMC will have comprehensive powers to expedite the collection of NPLs or their collateral.

6
The paper is organized as follows. Section II provides an overview of the recent dynamics of bank asset quality in the ECCU. Section III reviews the related literature, while Section IV evaluates the determinants of NPLs and Section V assesses the macroeconomic feedback effects from the banking sector to the real economy. Finally, Section VI concludes and suggests policy implications for the ECCU.
II. STYLIZED FACTS
The ECCU banking system is plagued by high levels of NPLs. NPLs are elevated across the region, with NPL ratios well above the prudential guideline of 5 percent in all ECCU member countries. The high level of NPLs appears to be, in part, a legacy of the global financial crisis, which burst the domestic credit cycle as it spilled over to the region. Prior to the crisis, credit had expanded rapidly, mainly spurred by economic activity in the tourism industry and related construction. The expansion in credit led to higher private and public sector debt and a rapid increase in its growth rate, increasing borrowers’ vulnerability to macroeconomic shocks and the exposure of the banking sector to credit risk. The crisis, which was primarily transmitted to the ECCU through lower demand for the region’s tourism services, resulted in a prolonged region-wide recession. The commensurate loss in income reduced borrowers’ capacity to repay and resulted in a sharp deterioration in asset quality across the banking system. In many countries, the upward trend in the NPL ratio has continued relentlessly, consistent with the slow pace of economic recovery experienced by much of the region subsequent to the crisis. Low profitability has restricted banks’ ability to raise provisioning, which remains inadequate throughout the region.
Country-specific factors also contributed to the spike in the NPL ratio in some countries. For example, the debt-for-land swap completed between the government and domestic banks in St. Kitts and Nevis contributed to the sharp rise in the NPL ratio over 2011-2015. On a sectoral basis, the increase in the NPL ratio since the global financial crisis has been driven largely by tourism, construction, and personal loans (which accounted for 18, 18 and 43 percent of total loans at the end of 2015, respectively). Slower tourist arrivals had a significant impact on tourism-dependent industries and related construction, leading to a loss of income for households and impairing the ability of both businesses and households to repay loans. As a result, the increase in NPLs was concentrated in the construction, tourism and agricultural industries.
0
20
40
60
80
100
120
140
0
4
8
12
16
20
1996
2001
2006
2011
2015
1996
2001
2006
2011
2015
1996
2001
2006
2011
2015
1996
2001
2006
2011
2015
1996
2001
2006
2011
2015
1996
2001
2006
2011
2015
ATG DMA GRD KNA LCA VCT
Nonperforming Loans and Provisioning in the ECCU(NPLs in percent of total loans, Provisioning in percent of NPLs)
NPLs/Total Loans
Provisioning Ratio (RHS)
Sources: ECCB and IMF staff calculations

7
Nonperforming Loans by Economic Sector (2015) The construction, tourism, and agriculture industries have the highest incidence of NPLs…
…while personal loans and credit to construction and tourism industries constitute the bulk of NPLs in ECCU.
There is wide dispersion in the level of NPLs across individual banks, suggesting that bank-specific factors contributed to the deterioration in asset quality in the ECCU. In 2015, the median NPL ratio across individual banks was 12.8 percent however, the lowest ratio was 4.5 percent and the highest was 24.8 percent. While the NPL ratio is high across all banks regardless of whether their ownership is domestic (i.e. locally owned) or foreign; there is also considerable dispersion in the level of NPLs by ownership type. For most ECCU countries, domestic banks tend to have higher NPL ratios. The exceptions are Grenada and St. Vincent and the Grenadines where the NPL ratio is higher for foreign-owned banks.
NPLs Across Foreign and Domestic Banks in the ECCU 1/
1/ Green = NPL ratio < 5 percent; Orange = NPL ratio >5 percent and <20 percent; Red = NPL ratio >20 percent.
0
10
20
30
40
Construction Manufacturing Personal Tourism Agriculture Total
Nonperforming Loans in the ECCU by Economic Sector 1/ (in percent of total loans; by sector)
2015
2005
Sources: ECCB. 1/The NPL ratios by sector are for the entire ECCU region.
2005 2006 2007 2008 2009 2010 2011 2012 2013 2014 20153.5 2.4 3.5 3.1 5.8 6.4 8.9 12.0 13.7 15.4 10.7 6.8 4.7 3.4 5.0 6.6 12.6 11.3 10.8 14.2 11.9 7.5
4.2 4.8 3.6 3.9 4.9 7.9 8.3 12.6 9.0 9.2 8.6 20.5 18.2 15.6 25.0 10.8 14.1 19.1 19.7 21.3 21.0 12.4
15.8 11.6 10.1 9.4 5.3 8.6 9.1 10.2 12.4 13.3 13.6 32.3 5.9 5.0 4.1 5.6 8.9 9.2 14.8 15.2 14.9 16.8
3.3 2.2 2.2 3.4 4.5 5.8 7.7 12.7 9.9 10.3 9.5 7.9 6.6 5.4 5.5 4.1 5.3 5.8 8.9 12.1 16.8 22.2
9.9 7.1 4.8 5.8 6.8 13.3 14.6 16.7 14.5 15.4 16.2 16.5 10.5 7.3 8.3 9.9 10.7 10.9 13.3 29.1 20.6 20.9
4.7 4.8 4.1 5.4 8.3 8.8 8.1 8.7 10.0 13.3 11.1 5.9 3.9 2.8 2.2 8.5 8.3 7.1 5.8 6.2 6.2 6.0
ForeignIndigenous
ForeignIndigenous
Grenada
St. Vincent and the Grenadines
Foreign
Indigenous
St. Kitts and Nevis
ForeignIndigenous
St. LuciaForeign
Indigenous
Antigua and Barbuda
ForeignIndigenous
Dominica
0
10
20
30
40
50
1996
Q4
1997
Q4
1998
Q4
1999
Q4
2000
Q4
2001
Q4
2002
Q4
2003
Q4
2004
Q4
2005
Q4
2006
Q4
2007
Q4
2008
Q4
2009
Q4
2010
Q4
2011
Q4
2012
Q4
2013
Q4
2014
Q4
2015
Q4
Non-performing Loans in the ECCU(In percent of total loans; by individual bank)
Source: ECCB.
NPLs
Median
18%
7%
2%
10%
43%
18%
Utilities
Agriculture
Construction
Trade
Manufacturing
Other
Personal
Public administration
Tourism
ECCU: Distribution of NPLs by Sector(In percent of total)
Sources: ECCB; and IMF staff estimates and calculations.

8
More profitable banks tend to have lower NPL ratios. In the ECCU, stronger bank profitability (evidenced by banks’ return on assets), which may be reflective of the quality of bank management, is correlated with lower NPL ratios.4 Of course, the causality also runs in the other direction as higher NPLs directly erode profitability through higher provisioning. Amongst commercial banks, foreign owned banks have generally exhibited stronger profitability and lower NPL ratios relative to domestic banks. The stronger profitability of foreign banks is partly attributable to their relatively lower cost of funds compared to domestic banks.
Elevated NPLs may result in adverse macro-financial feedback loops. In particular, elevated NPLs may affect the real economy through the credit supply channel, as accumulating NPLs force banks to tighten their underwriting standards and limit the supply of credit to the private sector. Indeed, in the ECCU, NPLs appear to be negatively correlated with credit growth. Following the global financial crisis, credit terms and conditions tightened as banks restricted access to credit and focused on strengthening their balance sheets. Combined with weak economic fundamentals and demand for credit, the reduction in credit supply resulted in a contraction in credit to the private sector (primarily in the private business segment) beginning in early 2013 that persists. Similarly, the erosion of bank asset quality and the associated contraction in credit have likely reinforced the economic contraction and contributed to adverse macro-financial feedback loops in the region. As expected, higher NPLs tend to be correlated with both lower credit growth and weaker economic growth.
Nonperforming Loans and Economic Activity High NPLs continue to impede private sector access to credit, as credit growth has remained negative since early 2013.
The economic recovery in the ECCU after the global financial crisis has occurred despite the continued contraction in credit.
4 The same dynamic is apparent if the net interest margin is considered as an alternative measure of bank profitability.
0
10
20
30
40
50
-30 -10 10 30 50 70
NPL
Rat
io
Credit Growth
Indigenous
Foreign
Linear (Indigenous)Linear (Foreign)
Sources: ECCB.
ECCU: Nonperforming Loans and Credit Growth,1996-2015(NPLs in percent of total loans; Credit Growth in percent, year-over-year)
-10
-5
0
5
10
15
20
25
-6
-3
0
3
6
9
12
15
1996
1997
1998
1999
2000
2001
2002
2003
2004
2005
2006
2007
2008
2009
2010
2011
2012
2013
2014
2015
ECCU: Credit Growth and GDP Growth(in percent, year-over-year)
Real GDP Credit Growth (RHS)
Sources: ECCB Sources: ECCB.
0
10
20
30
40
50
-2 -1 0 1 2 3 4
NPL
Rat
io
Return on Average Assets
IndigenousForeignLinear (Indigenous)Linear (Foreign)
Sources: ECCB.
ECCU: Nonperforming Loans and Bank Profitability,1996-2015(NPLs in percent of total loans; Return on Avg Assets (Net Profit before Taxes/Average Assets))

9
III. LITERATURE REVIEW
A. The Determinants of Non-Performing Loans
This paper focuses on identifying the determinants of NPLs and analyzing the feedback effects of macro-financial linkages in the ECCU. Among the determinants, the economic literature identifies a number of factors which help explain the evolution of NPLs including: global and domestic macroeconomic, bank-level, and institutional indicators. Many studies thoroughly record the effect of macroeconomic indicators, often supplemented by global variables to account for the effect of changes in the external financing conditions, and more recently using more granular bank-level statistics. Institutional indicators, however, largely remain the least explored group of NPL determinants, given the level of difficulty associated with measuring such indicators. For instance, availability and coverage of credit bureaus and credit rating agencies, efficiency of foreclosure and bankruptcy resolution frameworks, effectiveness of property rights implementation, and functioning of specialized courts for foreclosure resolution, are often difficult to measure, particularly in the context of a cross country comparison.
Macroeconomic indicators
Domestic macroeconomic conditions establish a link between business cycle and banking performance, as changes in macroeconomic conditions are likely to directly affect the borrower’s ability to service debt. For instance, GDP growth is often found to have a negative correlation with NPLs, displaying the anti-cyclical properties of NPLs (Espinoza, 2010; Love, 2013; Klein, 2013; Beck, 2015; Nkusu, 2011; Skarica, 2014). The finding of economic slowdown associated with higher NPLs, as unemployment rises and borrowers face greater difficulties repaying debt, has become common. Some studies directly incorporate unemployment in their models, and also find a strong positive relationship between unemployment and NPLs, as higher unemployment lowers borrowers’ capacity to service debt (Klein, 2013; Nkusu, 2011).
Other variables are also found to be important determinants of NPLs. The effect of higher inflation on NPLs may either be positive or negative: if wages remain sticky, higher inflation reduces borrowers’ repayment capacity, potentially rising NPLs; otherwise, real debt service tends to decline with higher inflation, driving down NPLs (Klein, 2013). Similarly, changing interest rates (or policy rates) directly affect borrower’s lending capacity, more so if the share of variable-rate interest rate loans is significant (Nkusu, 2011; Beck, 2013; Love, 2013). Higher credit growth increases credit risk, as it is often associated with looser loan underwriting standards, resulting in higher NPLs (Klein, 2013, Espinoza, 2013). Similar to inflation, exchange rate depreciation may have a negative or a positive effect on NPLs. Thus, exchange rate depreciation in a country with flexible exchange rate regimes and a large amounts of lending in foreign currency, may have a positive effect on NPL accumulation (Klein, 2013; Beck, 2015). On the other hand, currency depreciation can improve debt-servicing capabilities of export-oriented firms and lower the NPL ratio. Some models also incorporate house prices and stock exchange indices, which may influence NPLs through the wealth effect (Beck, 2015). The effect of stock exchange indices on NPLs, however, is not
10
obvious, but relies on the assumption that share prices are correlated with house prices, on which data remain scarce (Skarica, 2014).
Bank-specific indicators
More recent studies have benefited from a more granular data on individual banks, by controlling for bank-specific indicators, which could cause or indicate risky lending behavior. These include the capital adequacy ratio, different measures of efficiency (ROE, cost-to-income ratio, expense-to-asset ratio), bank size, net interest margin, credit growth, and portfolio composition, among others. Similar to macroeconomic indicators, bank-specific variables are often found to have statistically significant explanatory powers of NPLs. For instance, Klein (2013) finds that equity-to-assets ratio is negatively correlated with NPLs, confirming the “moral hazard” hypothesis, whereby banks with relatively low capital respond to moral hazard incentives by increasing the riskiness of their loan portfolio, resulting in higher future NPLs. Higher profitability often contributes to lower NPLs, as better managed banks are believed to have higher quality assets (Love, 2013; Klein, 2014). Meanwhile excessive lending, measure by loans-to-assets ratio tend to be correlated with higher NPLs (Klein, 2013).
Global variables
Global variables are in some cases used to account for the changes in the external financial conditions. For instance, Espinoza and Prasad (2013) and Klein (2013) use VIX as proxy of global financial volatility and risk aversion, which they find to be a highly significant determinant of NPLs, with NPLs increasing with global risk. Some studies also incorporate oil prices as a determinant of NPLs. In oil exporting countries, higher oil prices would be reflected in higher profits and income levels, decreasing the number of defaults on loans; in oil importing countries, however, higher oil prices may reduce borrowers’ income, resulting in higher NPLs.
B. The Macroeconomic Spill-overs of NPLs
Many studies analyze the feedback effects between the banking sector and economic performance using a panel VAR approach. In these models, the impact of the real economy on the NPLs is largely accounted for by weakening borrower’s capacity to repay the loan. Meanwhile, NPLs are assumed to affect the real economy mostly through the credit supply channel, although other non-credit supply channels have also been suggested, such as the effect of debt overhang on investment for instance. Most studies use some combination of single vs. cross-country coverage, in conjunction with country-aggregate vs. bank-level observations. Thus, data granularity varies from single economy multiple bank-level observations, to cross-country aggregate country-level data (similar to this paper), and, finally, to cross-country bank-level coverage data sets. Love and Ariss (2013), for instance, explore macroeconomic and bank-level variables to assess the feedback effects, using single economy bank-level data: the entire universe of banks operating in Egypt between 1993 and 2010. The study builds a framework using capital inflows, GDP growth, and lending rate as macroeconomic variables, and loan growth, reserves – proxy for loan quality – and return on average equity as bank-
11
specific indicators. The study observes that a positive shock to macroeconomic indicators results in improvements to credit quality.
The second group of studies, similar to this paper, focus on consolidated banking sector and aggregate economic indicators for a number of countries, which offers the advantage of increasing sample size while adding a cross-country advantage. For instance, Nkusu (2011) looked at 26 advanced economies, over the period of 1998-2009. Results suggest that deterioration in the macroeconomic environment—proxied by slower growth, higher unemployment or falling asset prices—is associated with debt service problems, reflected into rising NPL. Meanwhile, asset quality tends to reinforce the business cycle and is therefore procyclical. Klein (2013) looks at 16 CESEE economies5 over the period of 1998-2011, using data on country aggregates of NPLs, credit growth, unemployment, GDP growth and inflation. Findings suggest that NPLs have a negative and significant effect on credit, inflation, and real GDP growth, while contributing to higher unemployment. Conversely, higher GDP growth and lower inflation lead to lower NPLs.
The third set of studies explores macro-financial feedback using bank-level data across a number of countries. For example, Espinoza and Prasad (2010), focused on a sample of 80 banks from the Gulf Cooperation Council (GCC) region, suggesting that higher loan delinquency rate has a strong negative, albeit short-lived effect on non-oil GDP growth. Conversely, as macroeconomic conditions worsen and lending rates increase, NPLs deteriorate.
This paper contributes to the current literature on determinants of NPLs and macro-financial feedback loops mainly by using a unique data set of bank-specific and country aggregate series for the independent ECCU economies, spanning from 1996 to 2015. The granularity, time depth, and high frequency (quarterly) of exploiting cross-country bank-specific data is likely to yield more robust results when analyzing the determinants of NPLs. Meanwhile, employing a panel VAR approach to annual country-aggregate data allows the use of macroeconomic variables – which are only available at lower frequency (e.g., real GDP, FDI) – while taking advantage of the cross-country perspective.
IV. THE DETERMINANTS OF NON-PERFORMING LOANS IN THE ECCU
A. Data and Methodology
Bank level panel data is used to estimate the determinants of NPLs in the ECCU. The quarterly dataset spans 1996Q1-2015Q4 and, uniquely, has universal coverage of all banks operating in the ECCU independent countries over this time frame, including all domestic and foreign banks (branches and subsidiaries). The sample includes 2359 observations: 34 banks; six countries (Antigua and Barbuda, Dominica, Grenada, St. Kitts and Nevis, St. Lucia, and St. Vincent and the Grenadines); and 80 quarters (1996Q1-2015Q4). The data are aggregated by individual bank. Of the 34 banks in the sample, 12 are domestic banks, 6 are subsidiaries of foreign banks and 15 are branches of foreign banks. The foreign banks are predominately branches and subsidiaries of Canadian banks, with a bank from Trinidad and 5 Central, Eastern, and Southeastern Europe (CESEE).

12
Tobago also operating a subsidiary in Grenada. As of end-2015, foreign banks held 47 percent of total banking system assets (or 109 percent of GDP) and 40 percent of total deposits in the banking system (or 79 percent of GDP).
The basic dynamic panel regression specification is:
, . , . , , ,
, , (1)
where , . denotes the logit transformation of the NPL ratio for bank i in country j at time t. This transformation ensures that the dependent variable spans the interval ∞, ∞ and is distributed symmetrically. It also ensures that all predicted values are non-negative and between 0 and 1.
The dependent variable is explained by its lag ( , ), global ( , country-specific , , and bank-level ( , , variables. Importantly, unlike for other cross-country studies of the determinants of NPLs (e.g. Espinoza and Prasad (2010), Klein (2013), and Nkusu (2011)), the classification of non-performing loans is consistent across all countries given that bank supervision and regulation is harmonized across the currency union with the ECCB as the regulator of the regional banking system. In the context of the banking union, institutional factors, such as the quality of bank supervision and financial regulation, were not considered as explanatory variables. The specification also controls for individual country effects and the type of bank ownership by including a foreign bank
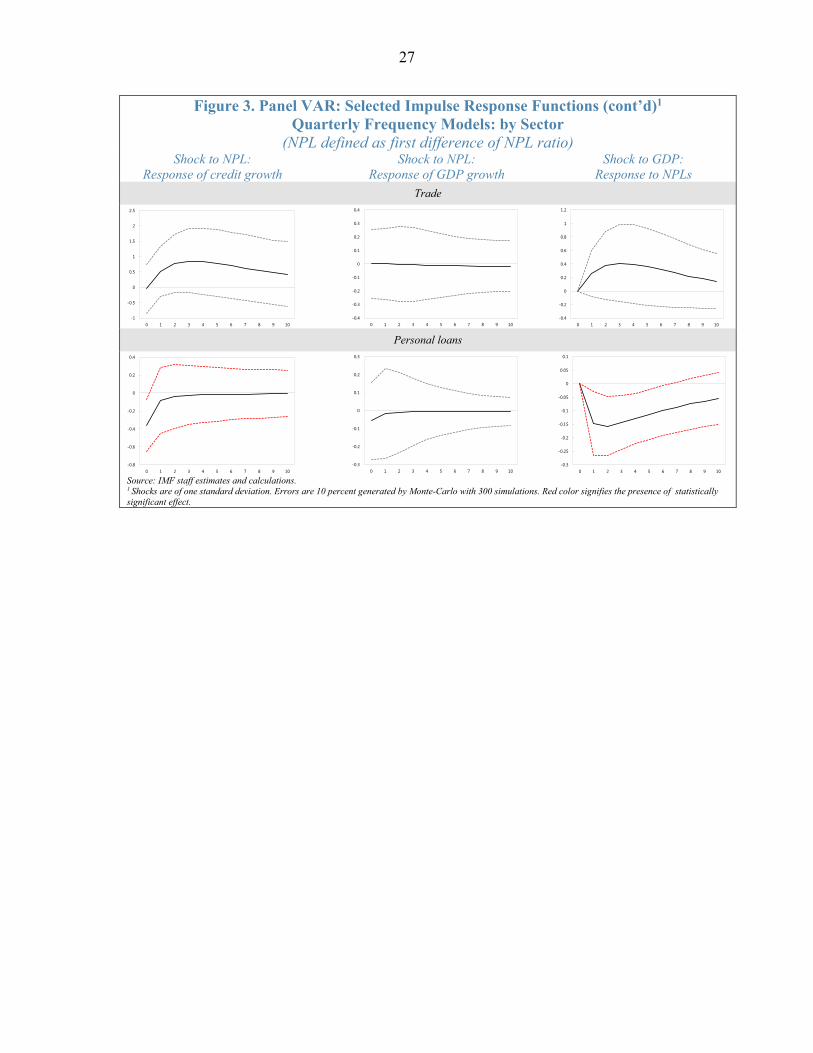
and country dummy variable. The data used in the estimation and its sources are described in Appendix Table A1.
The model is estimated with three alternative estimation techniques. First, the model is estimated with fixed effects to control for unobserved heterogeneity across banks. Second, the model is estimated with random effects, which allows us to include the country-specific and foreign-bank dummy variables to assess whether the type of bank ownership and country of origin impact bank asset quality. Finally, the model is estimated using generalized method of moments with instrumental variables (GMM-IV) to control for endogeneity of both the lagged dependent variable and the error term and the bank-specific variables. This methodology provides coefficient estimates that are corrected for endogeneity, heteroscedasticity and autocorrelation.6 Lagged values of the endogenous variables and of the
6 While the literature (e.g. Klein (2013) and Espinoza and Prasad (2010)) has utilized the system GMM methodology to control for dynamic panel bias that yields estimates of the coefficient on the lagged dependent variable that are biased downward (Nickell (1981)) in standard fixed effects estimation, Nickell (1981) has shown that this bias is equivalent to 1/T, where T is the number of time periods. As our dataset includes 80 time periods, this bias is relatively small (1.25 percent). Moreover, system GMM is applicable only for datasets where the number of cross-sections exceeds the time dimension. As such, GMM-IV is used to control for endogeneity.
13
bank-specific dependent variables considered endogenous were used as instruments. The global and country-specific variables were treated as strictly exogenous.
The impact of bank ownership structure on NPLs is also assessed by interacting the foreign bank dummy variable with all other variables in the benchmark model. The general specification of the model with interactions is:
, , , , , , ∗ , , , (2)
where , , is a vector of all the explanatory variables in the benchmark model except for the variable , , which is the variable that interacts with the foreign bank dummy in each alternative specification. This specification is used to test if domestic and foreign banks’ NPLs react similarly to changes in the macroeconomic environment and other indicators of bank performance. All models including the interaction terms were also estimated with GMM-IV and maintained the same assumptions and restrictions with respect to the instrument set as the GMM-IV estimation of equation (1).
B. Results
The results of the baseline model (Table 1) confirm that macroeconomic developments are important determinants of banks’ asset quality. The baseline specification restricted to the macroeconomic determinants of NPLs suggests that both global and country-specific macroeconomic developments affect NPLs in the region. Asset quality in the banking system is affected by spillovers from global macroeconomic developments, with the results suggesting that stronger growth in advanced economies lowers NPLs in the ECCU, consistent with the high degree of openness of the small economies of the ECCU member countries. 7, 8 Somewhat conversely, tourism growth, included in the regression as a proxy for domestic economic activity due to the unavailability of data on quarterly GDP and unemployment for the region, is found to increase NPLs. This may be associated with the inherent riskiness of lending to the tourism sector; however, this result holds even when controlling for the concentration of banks’ lending to the tourism sector. The results are robust to fixed effects, random effects, and GMM-IV estimation.
Bank-specific variables are also found to be important determinants of NPLs.9 Higher bank profitability, captured by the return on assets, is found to lower NPLs. However, this result
7 While some studies have found that the exchange rate can have an impact on asset quality, due to the impact of exchange rate depreciation on borrowers’ capacity to service their foreign currency loans, this is not investigated for the ECCU given the fixed exchange rate to the US dollar.
8 Given the prevalence of natural disasters in the region, a dummy variable was also included to capture the potential impact of natural disasters on NPLs; however, it was not found to be significant.
9 Capital and equity variables were not considered in the baseline specification given the inclusion of foreign bank branches, which do not maintain local capital, in the dataset. Capital and equity measures were included in
(continued…)

14
does not hold when the endogeneity of return on assets is controlled for in the GMM-IV estimation. The analysis also controls for the composition of outstanding loans and finds that bank asset quality tends to decrease with a higher concentration of banks’ lending portfolios in loans to households and the construction sectors.10 Contrary to expectations, lagged credit growth is found to result in lower NPLs, suggesting that the impact of credit growth on the denominator outweighs the impact of increased lending and its inherent riskiness on the numerator of the dependent variable. In contrast to previous studies, other indicators of bank efficiency (e.g. expense to income ratio), excessive lending (e.g. loans-to-assets and loans-to-deposit ratios) and interest rates were not found to have a significant impact on bank asset quality. NPLs were also found to have relatively high auto-correlation, suggesting that a shock to NPLs could have a prolonged effect on the ECCU banking system. These results are also robust to the choice of estimation method.
The global financial crisis contributed to the deterioration in bank asset quality in the ECCU. To evaluate the effect of the global financial crisis, a dummy variable for the period 2008-2015 was included in the baseline regression specification including and excluding bank-specific variables. In both instances, the dummy variable is positive and significant, suggestive of a structural increase in the level of NPLs in the region since the global financial crisis.
The baseline results suggest that the type of bank ownership has an impact on NPLs. The foreign bank dummy variable is significant with a negative coefficient in both the baseline specification with and without bank-specific factors and regardless of whether the time dummy is included or excluded from the model specification. This result suggests that there are some institutional features in the business model of domestic banks which are not captured by the bank-specific variables that contribute to higher NPLs than in foreign banks. These could include differences in due diligence and/or risk management practices as well as differences in banks’ strategies to recover on NPLs.
a regression restricted to indigenous banks and foreign subsidiaries and were not found to be significant determinants of bank asset quality in the ECCU.
10 The concentration of bank lending to the government and private businesses were also investigated as potential determinants and not found to be significant.

Table 1: Determinants of NPLs in the ECCU 1/
1./ The dependent variable is the logit transformation of the NPL ratio for bank i in country j at time t. RE, FE, and GMM-IV indicate random effects, fixed effects, and GMM instrumental variables estimation, respectively.
(1) (2) (5) (6) (9) (10) (3) (4) (7) (8) (11) (12)
VARIABLES FE FE RE RE GMM-IV GMM-IV Fe FE RE RE GMM-IV GMM-IV
NPLst-1 0.828*** 0.788*** 0.858*** 0.835*** 0.917*** 0.901*** 0.803*** 0.771*** 0.834*** 0.816*** 0.900*** 0.894***
(0.0103) (0.0112) (0.00918) (0.00970) (0.0191) (0.0202) (0.0114) (0.0120) (0.0103) (0.0106) (0.0286) (0.0283)
Advanced Economy Growtht-2 -0.0107** 0.00344 -0.00972** 0.00142 -0.00893** -0.00157 -0.00979** 0.00307 -0.00856** 0.00190 -0.00763* 9.14e-05
(0.00422) (0.00447) (0.00423) (0.00451) (0.00435) (0.00474) (0.00428) (0.00453) (0.00427) (0.00456) (0.00438) (0.00492)
Tourism Growtht-2 0.00224*** 0.00283*** 0.00217*** 0.00260*** 0.00205** 0.00234** 0.00238*** 0.00290*** 0.00239*** 0.00280*** 0.00219** 0.00247**
(0.000737) (0.000730) (0.000740) (0.000736) (0.000932) (0.000930) (0.000768) (0.000761) (0.000770) (0.000766) (0.000992) (0.000996)
Credit to the Private Sectort-1 -0.00172*** -0.00134** -0.00146*** -0.00123** -0.00351* -0.00333*
(0.000540) (0.000535) (0.000529) (0.000526) (0.00187) (0.00186)
Return on Assetst-1 -0.0369** -0.0158 -0.0381*** -0.0257* 0.0405 0.0851
(0.0147) (0.0148) (0.0139) (0.0139) (0.0874) (0.0961)
Construction Loans/Total Loanst-1 0.0148 -0.000277 0.0276*** 0.0246*** 0.0320** 0.0318**
(0.0106) (0.0106) (0.00842) (0.00837) (0.0129) (0.0129)
Household Loans/Total Loanst-1 0.162*** 0.162*** 0.0491* 0.0350 0.0541** 0.0439*
(0.0518) (0.0511) (0.0286) (0.0284) (0.0256) (0.0254)
Foreign Banks' Dummy -0.0905*** -0.106*** -0.0502** -0.0611*** -0.103*** -0.117*** -0.0666*** -0.0752***
(0.0207) (0.0206) (0.0212) (0.0216) (0.0230) (0.0229) (0.0258) (0.0257)
Dominica 0.0124 0.0234 -0.000408 0.00698 0.0105 0.0198 -0.00396 0.00535
(0.0317) (0.0314) (0.0325) (0.0323) (0.0323) (0.0321) (0.0323) (0.0326)
Grenada -0.0504 -0.0523* -0.0396 -0.0413 -0.0609* -0.0623** -0.0432 -0.0404
(0.0306) (0.0304) (0.0318) (0.0315) (0.0314) (0.0311) (0.0354) (0.0355)
St. Kitts and Nevis -0.0568** -0.0627** -0.0356 -0.0401 -0.0761** -0.0880*** -0.0612* -0.0719**
(0.0289) (0.0287) (0.0316) (0.0313) (0.0300) (0.0298) (0.0336) (0.0339)
St. Lucia 0.0500* 0.0630** 0.0229 0.0318 0.0550* 0.0629** 0.0202 0.0224
(0.0291) (0.0289) (0.0244) (0.0246) (0.0296) (0.0293) (0.0259) (0.0262)
St. Vincent and the Grenadines -0.0366 -0.0406 -0.0314 -0.0343 -0.0488 -0.0515 -0.0445 -0.0435
(0.0327) (0.0325) (0.0348) (0.0346) (0.0338) (0.0335) (0.0358) (0.0358)
2009-2015 Dummy 0.192*** 0.144*** 0.0951*** 0.186*** 0.139*** 0.105***
(0.0223) (0.0215) (0.0175) (0.0236) (0.0224) (0.0271)
Constant -0.412*** -0.619*** -0.261*** -0.391*** -0.133*** -0.221*** -0.281*** -0.525*** -0.162*** -0.301*** -0.0120 -0.107
(0.0295) (0.0377) (0.0305) (0.0359) (0.0446) (0.0533) (0.0605) (0.0672) (0.0499) (0.0543) (0.0696) (0.0701)
Observations 2,418 2,418 2,418 2,418 2,415 2,415 2,361 2,361 2,361 2,361 2,356 2,356
R-squared 0.732 0.740 0.823 0.825 0.734 0.741 0.823 0.823
Number of Bank_code 35 35 35 35 34 34 34 34
Standard errors in parentheses
*** p<0.01, ** p<0.05, * p<0.1

To explore in more detail the impact of ownership structure on NPLs, the foreign bank dummy variable was interacted with all other variables in the benchmark model. The results (Table 2) suggest that the determinants of NPLs are broadly comparable across domestic and foreign banks, with some differences. In Table 2, the interaction terms are highlighted in red; the top coefficient refers to domestic banks and the bottom coefficient to foreign banks. The results suggest that the asset quality of foreign banks is more responsive to macroeconomic developments and, similarly, banks’ profitability. For foreign banks, higher profitability reduces NPLs, while, for domestic banks, there appears to be no link between bank profitability and asset quality. However, the point estimates for ROA are not statistically different for the two types of banks (Table 3).11 The results also suggest that foreign banks’ asset quality is more responsive to the concentration of lending to households and domestic banks to the construction sector, consistent with the relatively higher concentration of each bank types lending to these sectors; however, the differences in the coefficients are not statistically significant (Table 3).
11 Table 3 presents the same specifications as in Table 2, except that instead of estimating the coefficient for each type of bank, we estimate the coefficient for the base bank (indigenous) and the coefficient for the difference between domestic and foreign banks (the interaction term). The advantage of this presentation is that it shows if the difference in coefficients between the two banks is statistically different.

17
Table 2: Determinants of NPLs in the ECCU: Differences Between Domestic and Foreign Banks 1/
1./ The dependent variable is the logit transformation of the NPL ratio for bank i in country j at time t. GMM-IV panel estimation. In each equation where an interaction term is present the value of the coefficient is for the indigenous banks, unless it clearly states it is for foreign banks.
(1) (2) (3) (4) (5) (6) (7)
NPLst-1 0.900*** 0.901*** 0.901*** 0.907*** 0.884*** 0.896*** 0.903***
(0.0286) (0.0286) (0.0285) (0.0277) (0.0219) (0.0289) (0.0287)
Advanced Economy Growtht-2 -0.00763* -0.00412 -0.00761* -0.00776* -0.00705 -0.00723* -0.00769*
(0.00438) (0.00831) (0.00438) (0.00435) (0.00433) (0.00439) (0.00440)
Foreign banks -0.00942*
(0.00519)
Tourism Growtht-2 0.00219** 0.00218** 0.00169* 0.00222** 0.00228** 0.00227** 0.00224**
(0.000992) (0.000993) (0.000947) (0.000994) (0.000981) (0.000986) (0.000992)
Foreign banks 0.00243*
(0.00140)
Credit to the Private Sectort-1 -0.00351* -0.00349* -0.00353* -0.00181 -0.00299 -0.00347* -0.00339*
(0.00187) (0.00188) (0.00187) (0.00172) (0.00194) (0.00192) (0.00189)
Foreign banks -0.00271*
(0.00161)
Return on Assetst-1 0.0405 0.0430 0.0406 0.0445 0.0298 0.00958 0.0483
(0.0874) (0.0876) (0.0874) (0.0892) (0.0252) (0.0853) (0.0887)
Foreign banks -0.0502*
(0.0267)
Construction Loans/Total Loanst-1 0.0320** 0.0322** 0.0320** 0.0307** 0.0258** 0.0437* 0.0323**
(0.0129) (0.0129) (0.0129) (0.0129) (0.0112) (0.0257) (0.0128)
Foreign banks 0.0211*
(0.0114)
Household Loans/Total Loanst-1 0.0541** 0.0533** 0.0547** 0.0456* 0.0535** 0.0535** 0.0396
(0.0256) (0.0256) (0.0257) (0.0249) (0.0254) (0.0267) (0.0342)
Foreign banks 0.0630
(0.0448)
Foreign Banks' Dummy -0.0666*** -0.0554* -0.0680*** -0.0529** -0.0494* -0.138 -0.0452
(0.0258) (0.0334) (0.0262) (0.0248) (0.0268) (0.0967) (0.0500)
Dominica -0.00396 -0.00397 -0.00402 0.00171 -0.00637 -0.00834 -0.00236
(0.0323) (0.0323) (0.0323) (0.0318) (0.0320) (0.0318) (0.0324)
Grenada -0.0432 -0.0430 -0.0432 -0.0398 -0.0579* -0.0440 -0.0384
(0.0354) (0.0354) (0.0354) (0.0353) (0.0333) (0.0339) (0.0351)
St. Kitts and Nevis -0.0612* -0.0615* -0.0609* -0.0553* -0.0642* -0.0572* -0.0595*
(0.0336) (0.0336) (0.0337) (0.0329) (0.0335) (0.0330) (0.0338)
St. Lucia 0.0202 0.0198 0.0202 0.0203 0.0219 0.0233 0.0239
(0.0259) (0.0259) (0.0259) (0.0261) (0.0246) (0.0259) (0.0286)
St. Vincent and the Grenadines -0.0445 -0.0443 -0.0445 -0.0365 -0.0555 -0.0415 -0.0397
(0.0358) (0.0359) (0.0358) (0.0346) (0.0355) (0.0357) (0.0358)
Constant -0.0120 -0.0191 -0.00997 -0.0237 -0.0620 0.0174 -0.0248
(0.0696) (0.0706) (0.0690) (0.0701) (0.0581) (0.0859) (0.0781)
Observations 2,356 2,356 2,356 2,356 2,356 2,356 2,356
R-squared 0.823 0.823 0.823 0.823 0.826 0.825 0.823
Robust standard errors in parentheses
*** p<0.01, ** p<0.05, * p<0.1

18
Table 3: Determinants of NPLs: Differences Between Domestic and Foreign Banks 1/
1./ The dependent variable is the logit transformation of the NPL ratio for bank i in country j at time t. GMM-IV panel estimation.
(1) (2) (3) (4) (5) (6) (7)
NPLst-1 0.900*** 0.901*** 0.901*** 0.900*** 0.893*** 0.898*** 0.900***
(0.0286) (0.0286) (0.0285) (0.0289) (0.0255) (0.0291) (0.0288)
Advanced Economy Growtht-2 -0.00763* -0.00412 -0.00761* -0.00803* -0.00628 -0.00689 -0.00758*
(0.00438) (0.00831) (0.00438) (0.00436) (0.00453) (0.00441) (0.00439)
Tourism Growtht-2 0.00219** 0.00218** 0.00169* 0.00217** 0.00233** 0.00222** 0.00219**
(0.000992) (0.000993) (0.000947) (0.000991) (0.00101) (0.000991) (0.000991)
Credit to the Private Sectort-1 -0.00351* -0.00349* -0.00353* -0.00413 -0.00350** -0.00358* -0.00350*
(0.00187) (0.00188) (0.00187) (0.00283) (0.00175) (0.00187) (0.00190)
Return on Assetst-1 0.0405 0.0430 0.0406 0.0341 0.262 0.0336 0.0393
(0.0874) (0.0876) (0.0874) (0.0882) (0.331) (0.0879) (0.0890)
Construction Loans/Total Loanst-1 0.0320** 0.0322** 0.0320** 0.0317** 0.0287** 0.0873* 0.0323**
(0.0129) (0.0129) (0.0129) (0.0128) (0.0118) (0.0446) (0.0127)
Household Loans/Total Loanst-1 0.0541** 0.0533** 0.0547** 0.0556** 0.0699** 0.0719** 0.0475
(0.0256) (0.0256) (0.0257) (0.0265) (0.0340) (0.0308) (0.0353)
Foreign Banks' Dummy -0.0666*** -0.0554* -0.0680*** -0.0734** 0.0223 -0.250* -0.0537
(0.0258) (0.0334) (0.0262) (0.0327) (0.107) (0.135) (0.0508)
Dominica -0.00396 -0.00397 -0.00402 -0.00471 -0.00428 -0.00272 -0.00440
(0.0323) (0.0323) (0.0323) (0.0325) (0.0342) (0.0322) (0.0325)
Grenada -0.0432 -0.0430 -0.0432 -0.0434 -0.0618* -0.0301 -0.0416
(0.0354) (0.0354) (0.0354) (0.0354) (0.0345) (0.0360) (0.0352)
St. Kitts and Nevis -0.0612* -0.0615* -0.0609* -0.0606* -0.0815* -0.0570* -0.0614*
(0.0336) (0.0336) (0.0337) (0.0333) (0.0418) (0.0331) (0.0338)
St. Lucia 0.0202 0.0198 0.0202 0.0212 0.00184 0.0281 0.0228
(0.0259) (0.0259) (0.0259) (0.0259) (0.0382) (0.0265) (0.0285)
St. Vincent and the Grenadines -0.0445 -0.0443 -0.0445 -0.0442 -0.0629* -0.0279 -0.0437
(0.0358) (0.0359) (0.0358) (0.0356) (0.0373) (0.0374) (0.0361)
Advanced Economy Growtht-2 * Foreign bank' -0.00530
(0.00993)
Tourism Growtht-2 * Foreign bank's dummy 0.000733
(0.00168)
Credit to the Private Sectort-1 * Foreign bank's 0.00134
(0.00311)
Return on Assetst-1* Foreign bank's dummy -0.300
(0.318)
Construction Loans/Total Loanst-1* Foreign
bank's dummy -0.0612
(0.0424)
Household Loans/Total Loanst-1* Foreign ban 0.0158
(0.0610)
Constant -0.0120 -0.0191 -0.00997 -0.00611 -0.0812 0.150 -0.0185
(0.0696) (0.0706) (0.0690) (0.0710) (0.0697) (0.140) (0.0783)
Observations 2,356 2,356 2,356 2,356 2,356 2,356 2,356
R-squared 0.823 0.823 0.823 0.824 0.815 0.824 0.823
Robust standard errors in parentheses
*** p<0.01, ** p<0.05, * p<0.1

19
V. THE DYNAMICS OF NON-PERFORMING LOANS AND MACROECONOMIC EFFECTS
A. Data and Methodology
As a complement to the multivariate analysis of determinants of NPLs, this section assesses feedback effects between the banking sector through NPLs and the real economy using a panel VAR approach (Abrigo and Love (2015)). The panel VAR enables an examination of the interactions among variables, including the duration and magnitude of the effect. The technique applies the traditional VAR approach to panel data by treating all variables as endogenous while allowing unobserved heterogeneity across banks. In this way, the advantage of the approach is that it eliminates the assumption of feedback directionality between the variables in the model as in Section IV. The estimations are based on the following model:
⋯ , (3)
∆ , , ∆ , , ∆ , , ∆ , , ∆ ,
where Yi,t is a vector of five endogenous variables; ∆npli,t denotes growth in level NPLs of the overall banking system in country i in year t; ∆crediti,t denotes growth in the level of credit to the private sector in country i in year t; ∆FDIi,t denotes growth in the level series of foreign direct investment in country i in year t ; ∆GDPi,t denotes real GDP growth in country i in year t; and ∆CPIi,t – average annual CPI inflation in percent.12 Xi,t is a vector of exogenous covariates; ui and eit are vectors of dependent variable-specific panel fixed effects and idiosyncratic errors, respectively. All variables are taken as level growth rates in the baseline model to exclude the secondary transmissions channel through the denominator and provide a more intuitive interpretation of results.
In this model, the fixed effects variable – ui – captures country-specific effects, which are assumed to be fixed over time. To account for the correlation of fixed effects with the regressors due to the presence of lags of the dependent variable in the equation, the analysis uses a forward mean-differencing (Helmert procedure) to remove the mean of all forward future observations available for each country-year, which retains the orthogonality between the lagged regressors and the transformed variables13. The methodology uses lagged regressors as instruments and estimates the coefficients using the GMM methodology (Klein, 2013).
12 Two different specifications were considered for the definition of NPLs: the annual percentage change in non-performing loans and the first difference of the NPL-to-total loans ratio. While qualitatively both specifications largely generate similar results, the former specification was used for more intuitive interpretation of results.
13 Estimates are produced using lagged regressors as instruments and estimate the coefficient by GMM methodology; 300 Monte Carlo simulations are used to generate the confidence intervals. Impulse responses are orthogonalized.

20
The feedback effects of the model are assessed using impulse response functions, which demonstrate the behavior of one variable in response to innovations in another variable, holding other shocks constant. Confidence intervals are generated using Monte Carlo simulations. Orthogonal shocks are identified using the Cholesky decomposition. Thus, variables that enter equation (3) first are assumed more exogenous than the variables that appear later in the model, suggesting that they affect the subsequent variables both contemporaneously and with a lag; meanwhile, the variables toward the end of the equation are assumed to affect the first ones only with a lag (Love, 2013). Thus, similarly to Klein (2013), we assume that FDI growth, GDP growth, and inflation, affect delinquent loans only with a lag, while non-performing loans have a contemporaneous effect on economic activity, largely through credit. As such, as a baseline specification, non-performing loans appear first in the ordering, followed by credit growth, FDI growth, GDP growth, and CPI inflation. FDI is added to the model to account for the strong linkages between foreign direct investment inflows, particularly into the tourism sector, and economic performance in the ECCU. Results are broadly robust to alternative ordering of variables.
To take into account the close linkages between the ECCU and advanced economies, and regional susceptibility to natural disasters, the model includes global macroeconomic indicators as exogenous variables. Given that both global and domestic macroeconomic developments are found to be important determinants of NPLs and to capture the strong spillovers between advanced economies and the ECCU the model includes advanced economies’ real GDP growth as an exogenous variable. Given the region’s susceptibility to natural disasters, a dummy variable to capture the impact of natural disasters is also included as an exogenous variable, defined to take the value of one for the year in which a disaster occurred and zero otherwise.
The model is estimated for a panel data set of the 6 independent ECCU economies over the period 1997 to 2015.14 Data specifications and sources are shown in Appendix table A1, while Appendix table A2 provides the descriptive statistics of the panel VAR variables. The panel is estimated in annual frequency given that the major macroeconomic indicators, such as real GDP and FDI are unavailable in higher frequency.
The annual model is based on 6 countries covering the period of 18 years. While the distribution of the ratios of NPLs to total loans is clustered around the median of 7.9 percent of total loans with the standard deviation of 4.5 percentage points, the median growth rate of the non-performing loans is about 8.8 percent, with a standard deviation of about 36 percent (table A2). Higher NPLs toward the end of the period are largely reflective of the global financial crises, which led to an increase of loan delinquency rates throughout the ECCU.
Correlations between the variables appear to be in line with the economic theory, which suggests that higher real GDP growth rates raise population income, thus, improving borrowers’ capacity to repay, and lowering the delinquency rate. Similarly, higher FDI inflows, which in the ECCU tend to concentrate in the tourism industry, also stimulate economic activity and raise income levels, leading to lower NPLs. The inflation coefficient,
14 For a total of 114 observations. The data are aggregated by country.

21
however, may take on either positive or negative sign. Specifically, higher inflation may erode the real value of borrowers’ debt service and lower NPLs, thus producing a negative sign; and alternatively, if wages do not keep up with rising inflation, borrowers’ ability to repay loans would decline, leading to higher NPLs, signifying a positive relationship between inflation and NPL growth. Meanwhile, higher private credit is expected to be positively correlated with NPL growth, as periods of accelerated credit accumulation may be accompanied by looser underwriting standards, potentially leading to higher NPLs. Simple correlations of variables in our sample indicate that NPLs are negatively correlated with inflation, FDI, and real GDP growth rates; while the correlation with the credit growth remains positive (Table 4).
Table 4. Correlation Matrix (Annual frequency, in percent, year-on-year growth)
To assess the level of integration, the preference was given to the Fisher-ADF and PP unit root tests, which do not require balanced samples, and are based on the overall test statistic generated using individual unit-root test. The results indicate that all panel VAR variables are stationary of order I(0). This analysis was also supplemented by a cointegration test on the panel VAR to avoid inference based on spurious relationships. The results of the Johansen’s trace and maximum-eigenvalue tests support the presence of cointegrating relationships in the models, providing basis for the implementation of panel VAR analysis (Table A3).
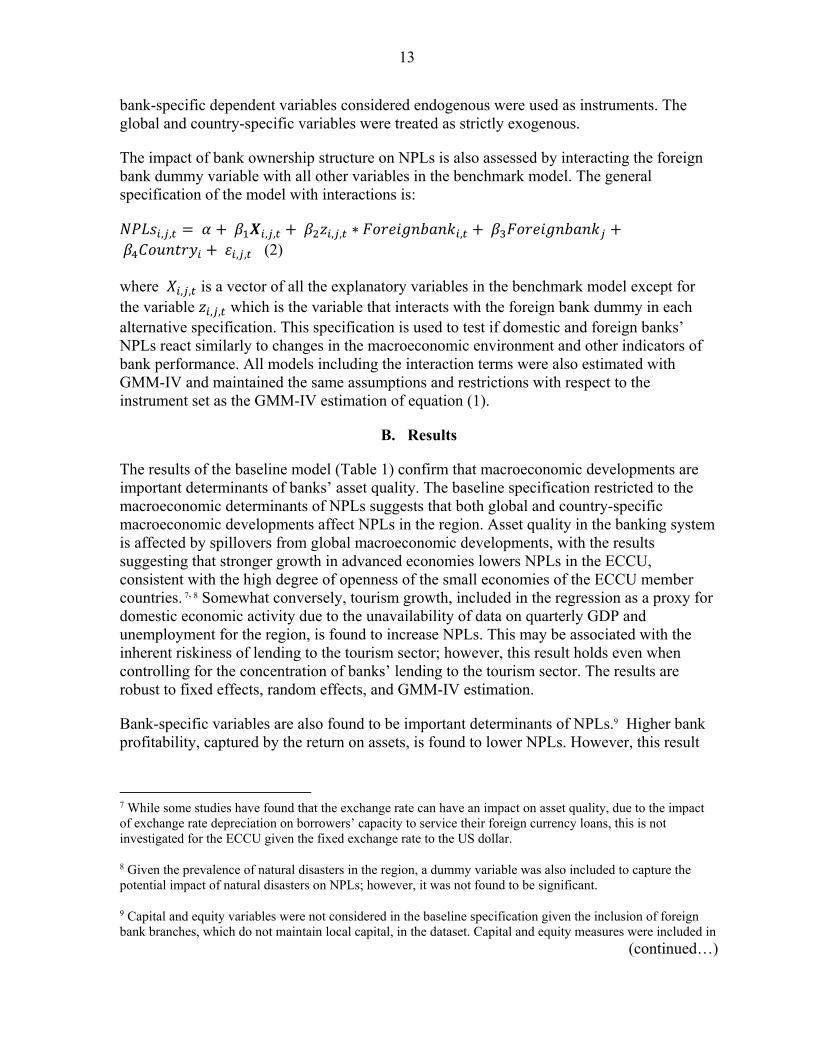
To assess whether the strength of the feedback effects from the banking system to the real economy varies depending on the type of industry considered, quarterly models are also estimated using industry specific data on NPLs and credit growth. 15 Since indicators of economic performance, such as real GDP, are unavailable in quarterly frequency, we also construct a proxy indicator. Quarterly real GDP estimates are imputed using annual real GDP for the ECCU economies and quarterly real GDP data for the United States, on the basis of the close correlation of real GDP for the ECCU and the US.16 Quarterly models are estimated separately for agricultural, tourism, construction, manufacturing, and trade industries and the
15 Quarterly models include NPLs defined as the first difference of the sector-specific NPL-to-total loans ratio, sector-specific credit to private sector growth. Here preference was given to the alternative specification of NPLs, since the small size of some sectors introduces excessive volatility to NPLs when growth rates are applied.
16 In the absence of other economic indicators in quarterly frequency consistent across all countries in the sample, such as employment, imports of constructions materials, industrial production, etc, our constructed quarterly real GDP performs sufficiently well. Robustness checks show that models with the number of tourist arrivals in some cases may not serve as a good proxy of economic activity.
(continued…)
NPL Private credit FDI Real GDP Inflation
NPL 1Private credit 0.04 1FDI -0.08 0.10 1Real GDP -0.06 0.29 0.21 1Inflation -0.08 0.32 -0.09 0.05 1
Sources: IMF staff estimates and calculations.

22
personal loans sector. The models are based on 2005Q1-2015Q4 period and include the first difference of the NPL ratios by sector, credit growth by sector, real GDP growth, and CPI inflation as endogenous variables; real GDP growth of advanced economies and natural disasters dummy as exogenous variables. 17,18
B. Results
Panel VAR Impulse Response Functions suggest that a shock to NPL growth has implications for economic activity and the credit cycle (Figures 1 and 2).19 A deterioration in asset quality has a negative effect on economic performance as measured by real GDP growth, CPI inflation, and FDI growth, but the results of the aggregate model are statistically significant only for the latter. Complementary sector-specific models (Figure 3), however, suggest that lower NPLs in the agricultural and construction sectors may result in a significant effect on real GDP growth. The aggregate model also suggests that a deterioration in asset quality leads to a decline in credit, although again the response is not statistically significant. Quarterly models are used to supplement the analysis, with more granular estimates based on industry-specific data on NPLs and credit growth. The results suggest that deterioration in asset quality leads to a statistically significant decline in credit to the more productive sectors of the economy, such as tourism, agriculture, construction, and manufacturing industries, meanwhile this negative relationship is much weaker for personal loans and trade industry.
Macroeconomic performance also has a significant effect on asset quality. Stronger economic performance leads to a statistically significant decline in NPL growth, potentially through the higher employment and income gains (excluded from the analysis due to lack of labor market data). Thus, the baseline model suggests that an increase in 1 percentage point in real GDP growth, holding other factors constant, leads to a decline in NPL growth by about 1.8 percent. This result, however, appears to be driven largely by the personal and tourism industries, which broadly comprise the majority of NPLs (about 61 percent at end-2015).
Stronger economic activity also has a positive, albeit not statistically significant, effect on FDI and credit growth. There is a positive feedback loop between economic activity and FDI. Stronger economic activity leads to stronger FDI, although not statistically significant20, and, similarly, a boost to FDI also leads to a significant increase in GDP growth. In aggregate terms, an increase in credit would also provide a boost to economic activity, but on a smaller scale due to the smaller and not statistically significant coefficient. The effect is, however, statistically significant for the agricultural and construction industries. The persistent nature
17 The total of 263 quarterly observations.
18 Defined as first difference of NPL-to-total loans ratio.
19 While the baseline model includes growth rate of NPLs (results reported in Figure 1), alternative model uses specification of first difference of NPL-to-total loans ratio (Figure 2).
20 This relationship becomes significant, however, in a number of alternative model specifications with re-ordered variables.

23
of credit growth also implies that a shock to credit growth in the initial period lingers longer than in the case of other variables.
Panel VAR variance decomposition also suggests important implications of economic activity on NPL growth. Using variance decomposition of the panel VAR approach, we also assess the extent to which the forecast error variance of one variable is associated with exogenous shocks to other endogenous variables. The results indicate that over a 5-year horizon about 7 percent of NPLs is explained by economic performance variables, suggesting the importance of economic indicators to the banking sector health. Meanwhile, the effect of overall NPLs on economic performance is somewhat lower, as NPL growth explains about 1 percent of real GDP growth over the medium term. While the results of the complementary quarterly models vary by sector, the portion of real GDP growth explained by the NPL growth is estimated to be marginally higher (under 4 percent) for agricultural and construction sectors.21
21 This is consistent with the estimated significance of the Impulse Response Functions of real GDP growth due to a shock to NPLs in agricultural and construction sectors (Figure 3).

24
Figure 1. Panel VAR: Selected Impulse Response Functions1
Annual Frequency Model (NPL defined as annual percent changes)
Shock to NPL growth (year-on-year percent):
Response of GDP growth Response of Credit growth Response of FDI growth Response of CPI growth
Shock to GDP growth:
Response of FDI Response of Credit Response of NPLs Response of CPI
Shock to FDI growth
Response of GDP growth Response of Credit Response of NPLs Response of CPI
Shock to Private Credit growth
Response of GDP growth Response of FDI growth Response of NPLs Response of CPI inflation
1 Shocks are of one standard deviation. Errors are 10 percent generated by Monte-Carlo with 300 simulations. Red color signifies the presence of statistically significant effect. Source: IMF staff estimates and calculations.
-1.5
-1
-0.5
0
0.5
1
0 1 2 3 4 5 6 7 8 9 10
-0.4
-0.3
-0.2
-0.1
0
0.1
0.2
0.3
0.4
0.5
0 1 2 3 4 5 6 7 8 9 10
-0.8
-0.6
-0.4
-0.2
0
0.2
0.4
0.6
0.8
1
1.2
0 1 2 3 4 5 6 7 8 9 10
-0.4
-0.3
-0.2
-0.1
0
0.1
0.2
0.3
0.4
0.5
0 1 2 3 4 5 6 7 8 9 10
-0.5
0
0.5
1
1.5
2
0 1 2 3 4 5 6 7 8 9 10
-0.6
-0.4
-0.2
0
0.2
0.4
0.6
0.8
1
1.2
0 1 2 3 4 5 6 7 8 9 10 -6
-4
-2
0
2
4
6
0 1 2 3 4 5 6 7 8 9 10
-0.5
-0.4
-0.3
-0.2
-0.1
0
0.1
0.2
0.3
0 1 2 3 4 5 6 7 8 9 10
-0.4
-0.2
0
0.2
0.4
0.6
0.8
1
0 1 2 3 4 5 6 7 8 9 10 -10
-5
0
5
10
15
0 1 2 3 4 5 6 7 8 9 10 -6
-5
-4
-3
-2
-1
0
1
2
3
4
0 1 2 3 4 5 6 7 8 9 10
-0.2
-0.1
0
0.1
0.2
0.3
0.4
0.5
0.6
0.7
0 1 2 3 4 5 6 7 8 9 10
-1
-0.8
-0.6
-0.4
-0.2
0
0.2
0.4
0.6
0 1 2 3 4 5 6 7 8 9 10-25
-20
-15
-10
-5
0
5
10
0 1 2 3 4 5 6 7 8 9 10
-6
-4
-2
0
2
4
6
8
0 1 2 3 4 5 6 7 8 9 10-14
-12
-10
-8
-6
-4
-2
0
2
0 1 2 3 4 5 6 7 8 9 10

25
Figure 2. Panel VAR: Selected Impulse Response Functions1
Annual Frequency Model (NPL defined as first difference of NPL ratio)
Shock to NPL growth (year-on-year percent):
Response of GDP growth Response of Credit growth Response of FDI growth Response of CPI growth
Shock to GDP growth:
Response of FDI Response of Credit Response of NPLs Response of CPI
Shock to FDI growth
Response of GDP growth Response of Credit Response of NPLs Response of CPI
Shock to Private Credit growth
Response of GDP growth Response of FDI growth Response of NPLs Response of CPI inflation
1 Shocks are of one standard deviation. Errors are 10 percent generated by Monte-Carlo with 300 simulations. Red color signifies the presence of statistically significant effect. Source: IMF staff estimates and calculations.
-1.2
-1
-0.8
-0.6
-0.4
-0.2
0
0.2
0.4
0.6
0 1 2 3 4 5 6 7 8 9 10 -1.5
-1
-0.5
0
0.5
1
0 1 2 3 4 5 6 7 8 9 10 -30
-25
-20
-15
-10
-5
0
5
10
0 1 2 3 4 5 6 7 8 9 10
-0.5
-0.4
-0.3
-0.2
-0.1
0
0.1
0.2
0.3
0.4
0.5
0 1 2 3 4 5 6 7 8 9 10
-6
-4
-2
0
2
4
6
8
10
12
0 1 2 3 4 5 6 7 8 9 10-3
-2
-1
0
1
2
3
0 1 2 3 4 5 6 7 8 9 10
-1
-0.8
-0.6
-0.4
-0.2
0
0.2
0 1 2 3 4 5 6 7 8 9 10-0.5
-0.4
-0.3
-0.2
-0.1
0
0.1
0.2
0.3
0.4
0.5
0 1 2 3 4 5 6 7 8 9 10
-0.5
0
0.5
1
1.5
2
0 1 2 3 4 5 6 7 8 9 10 -1.5
-1
-0.5
0
0.5
1
1.5
2
0 1 2 3 4 5 6 7 8 9 10 -0.6
-0.5
-0.4
-0.3
-0.2
-0.1
0
0.1
0.2
0.3
0.4
0.5
0 1 2 3 4 5 6 7 8 9 10
-0.5
-0.4
-0.3
-0.2
-0.1
0
0.1
0.2
0.3
0.4
0 1 2 3 4 5 6 7 8 9 10
-0.6
-0.4
-0.2
0
0.2
0.4
0.6
0.8
1
0 1 2 3 4 5 6 7 8 9 10 -15
-10
-5
0
5
10
15
0 1 2 3 4 5 6 7 8 9 10 -1.2
-1
-0.8
-0.6
-0.4
-0.2
0
0.2
0.4
0 1 2 3 4 5 6 7 8 9 10
-1
-0.8
-0.6
-0.4
-0.2
0
0.2
0.4
0.6
0.8
1
0 1 2 3 4 5 6 7 8 9 10

26
Figure 3. Panel VAR: Selected Impulse Response Functions1
Quarterly Frequency Models: by Sector (NPL defined as first difference of NPL ratio)
Shock to NPL:
Response of credit growth Shock to NPL:
Response of GDP growth Shock to GDP:
Response to NPLs Tourism
Construction
Agriculture
Manufacturing
Source: IMF staff estimates and calculations. 1 Shocks are of one standard deviation. Errors are 10 percent generated by Monte-Carlo with 300 simulations. Red color signifies the presence of statistically significant effect.
-7
-6
-5
-4
-3
-2
-1
0
1
2
3
0 1 2 3 4 5 6 7 8 9 10-0.4
-0.3
-0.2
-0.1
0
0.1
0.2
0.3
0 1 2 3 4 5 6 7 8 9 10-0.9
-0.8
-0.7
-0.6
-0.5
-0.4
-0.3
-0.2
-0.1
0
0 1 2 3 4 5 6 7 8 9 10
-8
-7
-6
-5
-4
-3
-2
-1
0
1
0 1 2 3 4 5 6 7 8 9 10-0.7
-0.6
-0.5
-0.4
-0.3
-0.2
-0.1
0
0.1
0.2
0 1 2 3 4 5 6 7 8 9 10-0.8
-0.6
-0.4
-0.2
0
0.2
0.4
0.6
0.8
1
0 1 2 3 4 5 6 7 8 9 10
-12
-10
-8
-6
-4
-2
0
2
4
0 1 2 3 4 5 6 7 8 9 10-0.6
-0.5
-0.4
-0.3
-0.2
-0.1
0
0.1
0.2
0 1 2 3 4 5 6 7 8 9 10-1.5
-1
-0.5
0
0.5
1
1.5
2
2.5
3
0 1 2 3 4 5 6 7 8 9 10
-12
-10
-8
-6
-4
-2
0
2
4
6
8
10
0 1 2 3 4 5 6 7 8 9 10-0.6
-0.5
-0.4
-0.3
-0.2
-0.1
0
0.1
0.2
0.3
0.4
0 1 2 3 4 5 6 7 8 9 10-1.5
-1
-0.5
0
0.5
1
1.5
0 1 2 3 4 5 6 7 8 9 10
27
Figure 3. Panel VAR: Selected Impulse Response Functions (cont’d)1
Quarterly Frequency Models: by Sector (NPL defined as first difference of NPL ratio)
Shock to NPL: Response of credit growth
Shock to NPL: Response of GDP growth
Shock to GDP: Response to NPLs
Trade
Personal loans
Source: IMF staff estimates and calculations. 1 Shocks are of one standard deviation. Errors are 10 percent generated by Monte-Carlo with 300 simulations. Red color signifies the presence of statistically significant effect.
-1
-0.5
0
0.5
1
1.5
2
2.5
0 1 2 3 4 5 6 7 8 9 10-0.4
-0.3
-0.2
-0.1
0
0.1
0.2
0.3
0.4
0 1 2 3 4 5 6 7 8 9 10-0.4
-0.2
0
0.2
0.4
0.6
0.8
1
1.2
0 1 2 3 4 5 6 7 8 9 10
-0.8
-0.6
-0.4
-0.2
0
0.2
0.4
0 1 2 3 4 5 6 7 8 9 10-0.3
-0.2
-0.1
0
0.1
0.2
0.3
0 1 2 3 4 5 6 7 8 9 10-0.3
-0.25
-0.2
-0.15
-0.1
-0.05
0
0.05
0.1
0 1 2 3 4 5 6 7 8 9 10

28
VI. CONCLUSIONS
The deterioration in asset quality experienced in the ECCU over the last decade can be attributed to both macroeconomic conditions and bank-specific factors. For the small open economies of the ECCU, both domestic and global macroeconomic conditions directly impact banks’ asset quality. NPLs are also sensitive to bank level factors. In particular, more profitable banks and banks with lower exposure to the volatile construction and tourism sectors and household loans tend to have lower NPLs. There is also some evidence that foreign owned banks systematically have lower NPLs than domestic banks, suggesting that there are some important institutional differences across banks that affect their due diligence or risk management practices and/or NPL recovery strategies that have a meaningful impact on asset quality. These differences may also reflect the scale of banks’ operations. Domestic banks operate on a very small scale in their country of origin, while the foreign banks are primarily branches and subsidiaries of large Canadian banks with global operations. The larger scale of foreign banks’ operations may provide economies of scale for banks to conduct important risk management activities and contribute to improved asset quality. If this is the case, further consolidation of the domestic banking sector in the ECCU may support improved asset quality in the banking system. However, more detailed data on differences in institutional practices is needed to better understand whether and how the differences in the determinants of NPLs are driven by type of bank ownership.
The assessment of the feedback effects emphasizes the strength of macro financial feedback loops in the ECCU. The results indicate that a deterioration of asset quality leads to declining credit, with wide variations in the impact by sector. For the tourism, agriculture, manufacturing, and construction industries, a deterioration of asset quality leads to a significant and prolonged decline in credit growth. The results also suggest that an improvement in asset quality has the potential to boost real GDP growth in the ECCU, particularly through the agricultural and construction industries. In turn, real GDP growth also affects growth in NPLs as higher GDP growth likely through the associated lower unemployment and increase in disposable income, can significantly reduce loan delinquency rates, notably in personal and tourism sectors. However, the results also illustrate that FDI plays an important role in moderating the strength of macro-financial feedback loops in the ECCU. Indeed, the results highlight the importance of FDI financing for the region through its strong positive effect on economic growth, which is considerably stronger than that of domestic credit.
Strengthened asset quality will be important to reverse the negative macro-financial feedback loops in play in the ECCU and support sustained economic growth. A multi-pronged strategy could help to support strengthened asset quality in the region. As a priority, the ECAMC established by the region should be operational. The ECAMC could facilitate the rapid workout of bad assets, particularly from banks in the region that have already been resolved (including domestic banks in Antigua and Barbuda and Anguilla) and could also play a key role in cleaning up the balance sheets of the other banks in the region (by purchasing their NPLs) to reverse the negative impact NPLs are having on credit supply. To complement the role of the ECAMC, reforms should also continue to modernize foreclosure laws to support the resolution of NPLs. To support a strengthening of asset quality over the medium-term, efforts should continue to enhance supervision and regulation. The new regional legislative

29
framework for bank regulation, supervision and resolution should strengthen oversight, but this should be complemented with improvements in supervisory capacity to ensure the proper classification of loans, improve collateral valuation, and strengthen on-and off-site supervision. Efforts to strengthen asset quality and bank supervision should be complemented with a swift establishment of a regional credit bureau to support banks’ assessment of credit risks and support a revival of bank credit. Finally, the results indicate that stronger economic growth is imperative to an improvement in asset quality, suggesting that structural reforms to boost growth are an important and necessary complement to direct efforts to strengthen asset quality.
30
VII. APPENDIX
Table A1. Data and Sources
Variable descriptor Frequency Time coverage Unit Transformation Source
Non-performing loans Annual 1997-2015 Percent Year-on-year growth rate ECCBAnnual 1997-2015 Percent First difference of NPL ratio ECCB
Quarterly 2005Q1-2015Q4 Unit ECCBBy sector:
Tourism Quarterly 2005Q1-2015Q4 Percent Annual difference of NPL ratio ECCBAgriculture Quarterly 2005Q1-2015Q4 Percent Annual difference of NPL ratio ECCBConstruction Quarterly 2005Q1-2015Q4 Percent Annual difference of NPL ratio ECCBPersonal loans Quarterly 2005Q1-2015Q4 Percent Annual difference of NPL ratio ECCBManufacturing Quarterly 2005Q1-2015Q4 Percent Annual difference of NPL ratio ECCBTrade Quarterly 2005Q1-2015Q4 Percent Annual difference of NPL ratio ECCB
Credit to private sector Annual 1997-2015 Percent Year-on-year growth rate ECCBBy sector: Quarterly 2005Q1-2015Q4 Percent Year-on-year growth rate ECCB
Tourism Quarterly 2005Q1-2015Q4 Percent Year-on-year growth rate ECCBAgriculture Quarterly 2005Q1-2015Q4 Percent Year-on-year growth rate ECCBConstruction Quarterly 2005Q1-2015Q4 Percent Year-on-year growth rate ECCBPersonal loans Quarterly 2005Q1-2015Q4 Percent Year-on-year growth rate ECCBManufacturing Quarterly 2005Q1-2015Q4 Percent Year-on-year growth rate ECCBTrade Quarterly 2005Q1-2015Q4 Percent Year-on-year growth rate ECCBTotal Loans Quarterly 2005Q1-2015Q4 Unit ECCB
Return on Assets Quartelry 2005Q1-2015Q4 Percent ECCB
FDI inflows Annual 1997-2015 Percent Year-on-year growth rate ECCB; IMF, World Economic Outlook
Real GDP Annual 1997-2015 Percent Year-on-year growth rate ECCB; IMF, World Economic OutlookQuarterly
12005Q1-2015Q4 Percent Year-on-year growth rate ECCB; IMF, World Economic Outlook
CPI inflation Annual 1997-2015 Percent Year-on-year growth rate ECCB; IMF, World Economic OutlookQuarterly 2005Q1-2015Q4 Percent Year-on-year growth rate ECCB; IMF, World Economic Outlook
Advanced economies real GDP Annual 1997-2015 Percent Year-on-year growth rate IMF, World Economic OutlookQuarterly 2005Q1-2015Q4 Percent Year-on-year growth rate IMF, World Economic Outlook
US real GDP Quarterly 2005Q1-2015Q4 Percent Year-on-year growth rate IMF, World Economic Outlook
Tourism Growth Quarterly 2005Q1-2015Q4 Percent Year-on-year growth rate Caribbean Tourism Organization
Natural disasters dummy Annual 1997-2015 Unit Natural disaster occurrence =1 EM-DATForeign bank dummy Quarterly 2005Q1-2015Q4 Unit Foreign bank =1 ECCB1 Quarterly real GDP estimates are imputed using annual real GDP for the ECCU economies and quarterly real GDP data for the United States, given
the close correlation of real GDP for the ECCU and the US.

31
Table A2. Panel VAR: Descriptive Statistics
Standard No of
10th 50th 90th Average Deviation Observations
Non-performing loan, % of total loans 4.3 7.9 15.3 8.9 4.5 114
Antigua and Barbuda 5.7 10.4 14.3 10.4 3.3 19
Dominica 5.2 8.7 22.0 10.9 5.6 19
Grenada 2.9 5.8 13.8 6.7 3.6 19
Saint Lucia 6.1 11.3 18.2 11.8 4.8 19
St Kitts and Nevis 4.1 4.8 13.3 6.9 3.8 19
St Vincent and the Grenadines 3.9 5.6 9.4 6.4 2.2 19
Non-performing loan growth, percent -23.4 8.8 57.1 14.4 36.3 114
Antigua and Barbuda -45.9 17.7 65.3 18.0 53.0 19
Dominica -23.7 8.3 76.1 14.2 37.9 19
Grenada -35.2 10.4 76.3 10.7 32.3 19
Saint Lucia -15.0 8.1 51.5 13.8 24.6 19
St Kitts and Nevis -27.1 14.5 76.9 15.3 35.6 19
St Vincent and the Grenadines -11.5 8.4 68.6 14.7 32.8 19
Credit growth, percent -2.8 4.9 13.8 5.6 6.8 114
Antigua and Barbuda -5.2 5.0 17.3 4.9 8.7 19
Dominica -2.8 6.0 9.5 4.2 4.5 19
Grenada -5.1 4.6 17.1 6.3 7.4 19
Saint Lucia -6.7 6.2 22.9 6.7 9.1 19
St Kitts and Nevis -1.1 5.9 12.6 6.2 5.1 19
St Vincent and the Grenadines 1.0 3.5 13.8 5.2 4.6 19
FDI growth, percent -39.0 2.0 104.2 22.4 69.4 114
Antigua and Barbuda -51.7 9.1 152.5 30.3 73.9 19
Dominica -42.6 17.5 103.6 17.0 56.9 19
Grenada -41.1 -7.3 97.5 23.1 72.9 19
Saint Lucia -35.4 -0.3 199.0 33.2 107.1 19
St Kitts and Nevis -26.5 8.9 66.7 13.5 35.2 19
St Vincent and the Grenadines -39.0 1.7 116.8 17.1 56.3 19
Real GDP growth, percent -2.3 2.3 7.1 2.3 4.1 114
Antigua and Barbuda -8.5 3.4 7.2 2.4 5.5 19
Dominica -2.8 0.7 6.4 1.7 3.1 19
Grenada -4.0 3.4 11.8 3.2 5.2 19
Saint Lucia -1.7 0.5 8.2 1.5 3.3 19
St Kitts and Nevis -3.8 3.9 7.3 2.9 4.1 19
St Vincent and the Grenadines -2.0 2.1 6.1 2.3 2.7 19
Inflation, percent 0.0 2.0 4.8 2.2 2.2 114
Antigua and Barbuda -0.2 1.9 3.5 1.9 1.4 19
Dominica 0.0 1.4 3.2 1.6 1.6 19
Grenada -0.8 2.1 4.3 2.0 2.1 19
Saint Lucia -0.3 2.8 5.3 2.5 1.9 19
St Kitts and Nevis 0.7 2.2 8.5 3.1 2.8 19
St Vincent and the Grenadines 0.1 1.0 7.0 2.0 2.7 19
Sources: ECCB, National Authorities, and IMF staff estimates and calculations.
Percentiles
Annual Data Model: 1997-2015(In percent)

32
Table A3. Panel VAR: Johansen Fisher
Panel Cointegration Test
Sector type/ Test type
No
inte
rcep
t
No
tren
d in
CE
Inte
rcep
t
No
tren
d in
CE
No
inte
rcep
t
No
tren
d in
CE
Inte
rcep
t
Tre
nd in
CE
Inte
rcep
t
Tre
nd in
CE
TraceMax-eigenvalue 3 3
Note: 120 observations for annual data for overall specification; 480 observations for quarterly data for sector specifications. Figures indicated the selected nmber of cointegration relations at the 5% significance level.
NPL growth, Credit growth, FDI growth, Real GDP growth, Inflation
3 2 3 3 3
Assumptions on Cointegrating Test Specification
2 2 2
No trend in data Linear trend in dataQuadratic trend in data

33
References: Abrigo M., Love I., (2015). Estimation of Panel Vector Autoregression in Stata: a Pachage of Programs. Beck, R., Jakubik, P., Piloiu, A. (2015). Key Determinants of Non-Performing Loans: New Evidence from a Global Sample. Belgrave, A.; Guy, K.; Jackman, M. (2012). Industry Specific Shocks and Non-Performing Loans in Barbados. The Review of Finance and Banking. Volume 04, Issue 2, p.123-133. Espinoza, R., & Prasad, A. (2010, October). Nonperforming Loans in the GCC Banking System and their Macroeconomic Effects. International Monetary Fund .
Holtz-Eakin, D. W. Newey, and H.S. Rosen. 1988. "Estimating vector auto-regressions with panel data." Econometrica 56: 1371-95. International Monetary Fund. (2016). Eastern Caribbean Currency Union: Staff Report for the 2016 Common Policies Discussion. International Monetary Fund .
Klein, N. (2013). Non-performing Loans in CESEE: Determinants and Impact on Macroeconomic Performance. IMF Working Paper , 01-27.
Louzis, D. P., Vouldis, A. T., & Metaxas, V. L. (2011, October 13). Macroeconomic and bank-specific determinants of non-performing loans in Greece: A comparative study of mortgage, business and consumer loan portfolios. Journal of Banking and Finance, 01-16.
Love, I., & Ariss, R. T. (2013). Macro-Financial Linkages in Egypt: A Panel Analysis of Economic Shocks and Loan Portfolio Quality. IMF Working Paper, 01-40.
Makri, V., Tsagkanos, A., & Bellas, A. (2014). Determinants of Non-Performing Loans: The Case of Eurozone. (2), pp. 193-206.
Nkusu, M. (2011). Non-performing Loans and Macrofinancial Vulnerabilities in Advanced Economies. IMF WP/11/161.
Skarica, B. (2014). Determinants of Non-Performing Loans in Central and Eastern European Countries. Financial Theory and Practice, 38(1), pp. 37-59.
Sorge, M. (2004). Stress-testing Financial Systems: An Overview of Current Methodologies . BIS Working Papers , 01-41.
Tan, T. B. (2012). Determinants of Credit Growth and Interest Margins in the Philipines and Asia. IMF Working Paper , 01-25.