non-polar climate impacts - cgd.ucar.edu
TRANSCRIPT

Less surface sea ice melt in the CESM2 improves Arctic sea ice simulation with minimal 1
non-polar climate impacts 2 3
4
Jennifer E. Kay1,2, Patricia DeRepentigny1,3, Marika M. Holland4, David A. Bailey4, Alice K. 5 DuVivier4, Ed Blanchard-Wrigglesworth5, Clara Deser4, Alexandra Jahn1,3, Hansi Singh6, Madison 6
M. Smith5, Melinda A. Webster7, Jim Edwards4, Sun-Seon Lee8,9, Keith B. Rodgers8,9, and Nan 7
Rosenbloom4 8 9 1Department of Atmospheric and Oceanic Sciences, University of Colorado, Boulder, CO 10 2Cooperative Institute for Research in Environmental Science, University of Colorado, Boulder, 11 CO 12 3Institute of Arctic and Alpine Research, University of Colorado, Boulder, CO 13 4National Center for Atmospheric Research, Boulder, CO 14 5University of Washington, Seattle, WA 15 6University of Victoria, British Columbia, Canada 16 7University of Alaska Fairbanks, AK 17 8Center for Climate Physics, Institute for Basic Science, Busan, South Korea 18 9Pusan National University, Busan, South Korea 19 20 Corresponding author: Jennifer E. Kay ([email protected]) 21 Submitted to Journal of Advances in Modeling Earth Systems 22
June 29, 2021 23 24 Publication Units: 6478 words (~13 PU, each PU is 500 words), 15 Figures. Total PU = 28. 25
26
Key Points (limit 140 characters each): 27
• Decreasing surface melt decreases late-summer Arctic sea ice cover biases and delays 28
transition to an ice-free Arctic Ocean 29
• Internal variability limits value of sea ice trends and sea ice sensitivity as metrics to 30
constrain model performance 31
• Increasing sea ice thickness and area has negligible impacts on non-polar climate and 32
climate change 33

Abstract (Limit 250 words, 249 now) 34
35 This study isolates the influence of sea ice mean state on pre-industrial climate and transient 36
1850-2100 climate change within a fully coupled global model: The Community Earth System 37
Model version 2 (CESM2). The CESM2 sea ice model is modified to increase surface albedo, 38 reduce surface sea ice melt, and increase Arctic sea ice thickness and late summer cover. 39
Importantly, increased Arctic sea ice in the modified model reduces a well-known present-day 40
late-summer ice cover bias. Of interest to coupled model development, this bias reduction is 41 realized without degrading the global model simulation including top-of-atmosphere energy 42
imbalance, surface temperature, surface precipitation, and major modes of climate variability. The 43
influence of sea ice mean state on transient 1850-2100 climate change is compared within a large 44 initial condition ensemble framework. Despite similar global warming, the modified model with 45 thicker Arctic sea ice than CESM2 has a delayed and more realistic transition to a seasonally ice 46 free Arctic Ocean. Differences in transient climate change between the modified model and 47 CESM2 are challenging to detect due to large internally generated climate variability. In particular, 48
two common sea ice benchmarks - sea ice sensitivity and sea ice trends - are of limited value for 49 contrasting model performance. More broadly, these results show the importance of a reasonable 50 initial Arctic sea ice state when simulating the transition to an ice-free Arctic Ocean in a warming 51
world. Additionally, this work highlights the need for and value of large initial condition ensembles 52 for credible model-to-model and observation-model comparisons. 53 54 55

Plain Language Summary (200 word limit, 199 now) 56
57 Satellite observations available from 1979 to present show dramatic Arctic sea ice loss. As a 58
result, projecting when the Arctic Ocean may become ice free and the resulting impacts is of 59
broad interest to those living in the Arctic and beyond. Climate models are the main tool for making 60 such future projections. Yet, projecting sea ice loss is hard because it is affected by multiple 61
factors that are often impossible to disentangle including physical processes, unpredictable 62
climate variability, and differences in climate drivers. Unique to this work, we analyze the influence 63 of the initial amount of sea ice while also controlling for all other confounding factors such as the 64
amount of global warming and unpredictable climate variability. Our work demonstrates that under 65
similar global warming, the initial amount of Arctic sea ice affects the timing of an ice-free Arctic 66 Ocean. Specifically, simulations with more sea ice initially transition to an ice-free Arctic Ocean 67 later. Notably, the initial amount of sea ice has little influence on 20-year Arctic sea ice trends. 68 We also found initial sea ice amounts and the timing towards an ice-free Arctic have negligible 69 influence on warming, precipitation, and sea level pressure outside of the polar regions. 70

1. Motivation and Study Goals 71
Satellite-observed Arctic Ocean sea ice cover decreases over the last few decades 72 are a visible manifestation of human-caused climate change. Earth system models cannot 73
reproduce this observed ice loss with natural forcing alone (e.g., Kirchmeier-Young et al. 2017, 74
Kay et al. 2011). While models can reproduce the sign of observed multi-decadal Arctic sea ice 75
area trends, these same models exhibit differing Arctic sea ice loss rates and timing (Swart et al. 76 2015, SIMIP Community 2020). Why do Arctic sea ice loss rates differ between model 77
simulations? Given similar global warming, two factors are important to consider. First, mean state 78
matters: models with thicker Arctic sea ice tend to exhibit less ice area loss but more ice volume 79 loss than models with thinner sea ice (e.g., Massonnet et al. 2018, Holland et al. 2010, Bitz 2008). 80
Second, internally generated climate variability influences differences in Arctic sea ice loss timing 81 and trends (e.g., SIMIP Community 2020, Jahn et al. 2016, Swart et al. 2015, Notz 2015, 82 Wettstein and Deser 2014, Kay et al. 2011). In fact, recent work emphasizes that internal 83
variability dominates over emissions scenario in affecting projected sea ice loss over the 84 upcoming 2-3 decades, including the timing of the first ice-free Arctic Ocean in late summer (e.g., 85 Bonan et al., 2021, DeRepentigny et al. 2020, Jahn 2018, Sigmond et al. 2018). 86
Sea ice mean state influences transient sea ice response to climate forcing. Indeed, 87 mean sea ice thickness has well-known foundational influences on vertical sea ice 88
thermodynamics (Bitz and Roe 2004, Holland et al. 2006). The two dominant feedbacks internal 89
to sea ice – the positive sea ice albedo feedback and the negative ice-thickness growth feedback 90 – strengthen when sea ice thins. Sea ice loss in models with a wide range of complexities show 91 the importance of sea ice mean thickness to thermodynamic sea ice growth and loss. In addition, 92 mean sea ice thickness affects sea ice variability and predictability. When sea ice thins, ice area 93 variability increases, ice thickness variability decreases, and predictor relationships change in 94
location, nature, and magnitude (e.g., Holland et al. 2019, Mioduszewski et al. 2018, Swart et al. 95
2015, Holland and Stroeve 2011, Blanchard Wrigglesworth et al. 2011, Kay et al. 2011). 96 While the importance of sea ice mean state is uncontroversial, the potential to 97
constrain the mean state and reduce projection uncertainty remains unclear. Recent work 98
by Massonnet et al. (2018) used regression to quantify the relationship between Arctic sea ice 99 mean state and transient loss rates in a multi-model ensemble (Coupled Model Intercomparison 100 Project version 5 (CMIP5), Taylor et al. 2012). While the relationships between mean state and 101
linear changes in March sea ice volume and September sea ice area were weak, they were 102 statistically significant. The study arrived at two important conclusions. First, given the importance 103 of mean state and in particular sea ice thickness mean state, models with a biased mean sea ice 104

thickness should be questioned and potentially not used for future projections. Second, it is 105
currently not possible to observationally constrain the sea ice thickness mean state due to the 106 lack of long-term and reliable observations. This second conclusion is especially striking, is 107
consistent with a recent community analysis that questioned the accuracy of sea ice thickness 108
observations (e.g., SIMIP Community 2020), and leaves many open questions: 1) How reliable is 109 reliable enough? 2) How long of an observational record is needed? 3) Does tuning to observed 110
sea ice extent/area help constrain sea ice thickness? Model tuning is necessary (e.g., Mauritsen 111
et al. 2012), and best accomplished when constrained by available observations, especially when 112 the mean state influences transient response as is the case for sea ice. 113
Even if the sea ice mean state can be observationally constrained, internally 114
generated climate variability obscures the influence of the mean state on the transient sea 115 ice response. Having many realizations that show the same response increases confidence that 116 a signal results from a sea ice thickness difference and not from internally generated climate 117 variability. As a result, large initial-condition ensembles are needed to quantify the influence of 118 mean sea ice state on sea ice projections. While such ensembles are becoming more standard 119
practice and more broadly available with CMIP-class models (e.g., Deser et al. 2020), sensitivity 120 tests using large ensembles as a control are rare. In particular, a targeted experiment that isolates 121 the influence of sea ice mean state on climate change and variability in a CMIP-class model with 122
a large ensemble has not been done. 123 In this study, we build on previous work by isolating the influence of the sea ice 124
mean state on climate. We focus on two research questions: 125 1) Does pre-industrial sea ice mean state influence the rate and timing of transient 126
anthropogenically forced sea ice change? In particular, does thicker Arctic sea ice in 127 the pre-industrial mean state lead to slower sea ice loss and a later transition to 128 seasonally ice-free conditions in transient projections for the 21st century? 129
2) What is the impact of pre-industrial sea ice mean state on key global climate variables 130
(surface temperature, precipitation, and sea level pressure)? Specifically, can we 131
detect the influence of sea ice mean state on pre-industrial climate and 1850-2100 132
transient climate change and variability in both polar and non-polar regions? 133
To answer our research questions, we modify the sea ice model within an earth 134 system model to increase surface albedo, reduce surface melt, and increase the mean 135
state sea ice. We then quantify the influence of the sea ice mean state differences on mean and 136
transient climate change using a large initial condition ensemble as a control. Working within this 137 numerical simulation framework, we can isolate differences in transient projections that arise from 138

sea ice mean state alone. While we present results from both poles, we focus more on the Arctic 139
where the parameter changes have a larger impact and reduce a model bias. We find that with 140 thicker sea ice, the transition to an ice-free Arctic Ocean is delayed. In addition, the impacts of 141
sea ice tuning on non-polar climate are small. While our results rely on one model, our analysis 142
provides guidance for future modeling development efforts, especially those that hope to optimize 143 their simulation of transient Arctic sea ice loss. 144
145
2. Methods 146 2.1 Model simulations and comparison strategies 147
We use a well-documented state-of-the-art global climate model: the Community 148
Earth System Model version 2 (CESM2) with the Community Atmosphere Model version 6 149 (CAM6) (Danabasoglu et al. 2020). CESM2-CAM6, hereafter shortened to simply CESM2, is an 150 attractive model to use for two reasons. First, comprehensive simulations exist for CESM2 as a 151 part of the Coupled Model Intercomparison Project version 6 (CMIP6) (Eyring et al. 2016) and a 152 recently released large initial-condition ensemble, hereafter referred to as the CESM2-LE 153
(Rodgers et al. 2021). Second, CESM2 has a mean state Arctic sea ice bias. When compared to 154 present-day observations, CESM2 has insufficient late summer Arctic sea ice cover, a bias that 155 has been attributed to the sea ice being too thin (Danabasoglu et al. 2020 Figure 17g, DuVivier 156
et al. 2020). The consequences of this CESM2 thin Arctic sea ice bias for transient sea ice change 157 have been documented in DeRepentigny et al. (2020). For example, the 11 CESM2 CMIP6 158 transient historical simulations have ice-free late summer conditions in the Arctic as early as 2010, 159 which is inconsistent with satellite observations even when accounting for internal variability. 160
Inspired to remedy the CESM2 thin Arctic sea ice bias and assess its impact on the 161 global climate system, we created CESM2-lessmelt. CESM2-lessmelt is identical to CESM2 162 except for two parameter modifications made within the thermodynamics of the sea ice model. 163
The sea ice model in CESM2 (CICE 5.1.2; Hunke et al. 2015) uses a multiple-scattering Delta-164
Eddington radiative transfer parameterization which relies on the specification of inherent optical 165
properties (Briegleb and Light 2007). These optical properties can be adjusted to change the 166
albedo of snow-covered sea ice. In CESM2-lessmelt, we changed the r_snw parameter such that 167
the dry snow grain radius decreases from 187.5 µm to 125 µm, thereby increasing the albedo of 168
snow on sea ice. In addition, we changed the dt_mlt parameter such that the melt onset 169 temperature increases by 0.5 °C from -1.5 °C to -1.0 °C. This melt onset temperature determines 170 when the snow grain radius starts to grow from a dry snow value to a melting snow value. Both 171
CESM2-lessmelt parameter changes were implemented to increase snow albedo, reduce sea ice 172

melt, and increase the mean state sea ice thickness. Both parameter changes were made globally 173
and thus affect sea ice in both hemispheres. Finally, both parameter changes are within the 174 observational uncertainty provided by in situ observations from Surface Heat Budget of the Arctic 175
Ocean (SHEBA). 176
In this work, we compare simulations with constant pre-industrial control climate 177 conditions. For CESM2, we use the multi-century CMIP6 1850 pre-industrial control run. For 178
CESM2-lessmelt, we ran a 550-year-long CESM2-lessmelt 1850 pre-industrial control run. The 179
CESM2-lessmelt control was branched from year 881 of the CESM2 CMIP6 control. As a sanity 180 check, we assessed global metrics of energy conservation and climate stability in the CESM2-181
lessmelt control and compared it to the CESM2 control during overlapping years. The global mean 182
surface temperature is 0.16 K lower in CESM2-lessmelt (288.18 K) than in CESM2 (288.34 K). 183 The top-of-model energy imbalance in both models is small: -0.02 Wm-2 for CESM2-lessmelt and 184 0.07 Wm-2 for CESM2. Both models exhibit negligible drift in their global mean surface 185 temperature and top-of-model energy imbalance. Thus, both CESM2 model versions meet basic 186 energy conservation and stability criteria for global coupled modeling science. 187
In addition to pre-industrial control comparisons, we also compare simulations of 188 1850-2100 transient climate change under the same CMIP6 forcing. For CESM2, we use the 189 first 50 ensemble members of the CESM2-LE. As described in Rodgers et al. (2021), members 190
1-50 share the same transient CMIP6 forcing: historical (1850-2014) and the SSP3-7.0 future 191 scenario (2015-2100) (O’Neil et al. 2016). For CESM2-lessmelt, we ran a 4-member mini 192 ensemble using the same historical and SSP3-7.0 CMIP6 forcing as CESM2-LE members 1-50. 193 The first CESM2-lessmelt ensemble member started at year 1181 of the CESM2-lessmelt 1850 194
pre-industrial control run and was run from 1850 to 2100. Three additional CESM2-lessmelt 195 ensemble members were run from 1920 to 2100 with initial conditions from the first CESM2-196 lessmelt ensemble member perturbed by round-off (10-14 K) differences in air temperature. 197
As all transient ensemble members analyzed in this work share the same forcing, 198
we assume each ensemble member is an equally likely estimate of the transient climate 199
response. This “equally likely” assumption is justified in the Supporting Information (Text S1, 200
Figures S1-S5). This assumption enables us to statistically quantify differences between CESM2-201
LE and CESM2-lessmelt. Given the differences in ensemble size, we use bootstrapping to 202 statistically assess when the 4 CESM2-lessmelt ensemble members are distinct from the first 50 203
members of the CESM2-LE. Bootstrapping, or randomly resampling to generate statistics, 204
requires no distribution assumptions. 205

Finally, it is important to note a feature of all transient model simulations analyzed 206
here. Namely, the CMIP6 historical forcing includes a stark increase in the inter-annual variability 207 of biomass burning emissions during the satellite era of wildfire monitoring 1997-2014 (Fasullo et 208
al. 2021, DeRepentigny et al. 2021). This discontinuity leads to excessive surface warming in the 209
northern hemisphere extratropics (Fasullo et al. 2021). It also contributes to 1997-2010 Arctic sea 210 ice loss followed by a 2010-2025 Arctic sea ice recovery (DeRepentigny et al. 2021). While 211
several CMIP6 models show impacts from this discontinuity, the CESM2 has a particularly 212
pronounced response. In this work, we use this discontinuity as an opportunity to assess the 213 influence of sea ice mean state on the sea ice response to a short-term radiative forcing. 214
215
3. Results 216 3.1. Pre-industrial sea ice in CESM2 and CESM2-lessmelt 217
Comparison of pre-industrial sea ice volume and cover monthly mean values show 218 CESM2-lessmelt has more sea ice than CESM2 in both hemispheres (Figure 1). In the Arctic, 219 sea ice volume in CESM2-lessmelt exceeds that in CESM2 during all months (Figure 1a). In 220
contrast, Arctic sea ice cover differences have a distinct seasonal cycle with large late summer 221 differences and small winter differences (Figure 1b). In the Antarctic, CESM2-lessmelt has larger 222 sea ice cover and volume than CESM2 in all months (Figure 1c,d). Monthly mean volume 223
differences between CESM2 and CESM2-lessmelt are larger in the Arctic (30% greater in 224 CESM2-lessmelt) than in the Antarctic (8% greater in CESM2-lessmelt). 225
Spatially, the largest sea ice cover differences occur at the sea ice edge where/when 226 the sea ice can expand/contract without influence of land barriers and ocean circulation. 227
At the late summer seasonal minimum, the CESM2-lessmelt sea ice edge expands equatorward 228 at the sea ice margin in both hemispheres (Figure 2). Yet, this late summer expansion in CESM2-229 lessmelt is not zonally uniform. In the Arctic, the largest late summer ice concentration increases 230
in CESM2-lessmelt occur North of Russia in the East Siberian Sea (Figure 2b). In contrast, only 231
modest late summer sea ice expansion happens in the North Atlantic. In the Antarctic, the largest 232
magnitude late summer sea ice concentration expansion equatorward occurs off the coast east 233
of the Weddell Sea (Figure 2d). Changes in late-summer Antarctic sea ice concentration are 234
otherwise small, likely due to the lack of sea ice at the seasonal minimum. At the seasonal 235 maximum in late winter, Arctic concentrations differences are small due to the land barriers and 236
the ocean heat convergence that controls the sea ice edge (Figure 3a-b; Bitz et al. 2005). In the 237
Antarctic, the late winter sea ice edge has a zonally non-uniform response with some regions 238 exhibiting sea ice concentration increases and others exhibiting sea ice concentration decreases 239

(Figure 3c-d). In particular, there is less sea ice cover in CESM2-lessmelt than in CESM2 in the 240
Ross Sea. Non-zonally asymmetric sea ice differences demonstrate the importance of both 241 thermodynamic and dynamic responses to the sea ice parameter changes made in CESM2-242
lessmelt. 243
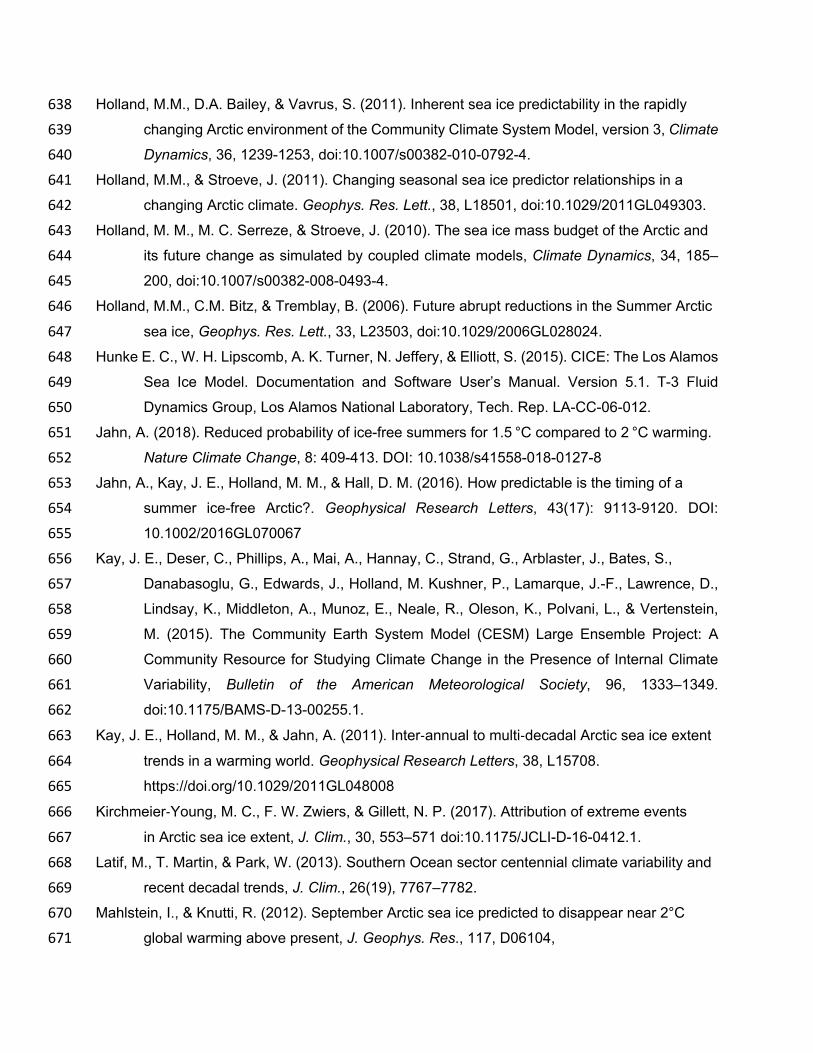
Sea ice thickness comparisons are also of interest, especially in the Arctic where 244 thicker ice in late winter can lead to less late summer sea ice loss. Unlike the concentration 245
differences that manifested at the sea ice edge, sea ice thickness differences at the late winter 246
seasonal maximum occur throughout the sea ice pack (Figure 4). Late-winter sea ice thicknesses 247 are at least 0.5 m greater in CESM2-lessmelt than in CESM2 throughout the central Arctic basin 248
(Figure 4b). Antarctic sea ice thickness differences are much smaller, generally less than 0.25 249
meters (Figure 4d). The largest differences in the Antarctic occur off the west side of the Antarctic 250 Peninsula in the Bellingshausen Sea. 251
To quantify processes underlying the mean state differences between the two 252 CESM2 model variants, we next compare their sea ice mass tendencies. In addition to 253 analyzing the total sea ice mass tendency, we also decompose this total tendency into 254
contributions from dynamic and thermodynamic processes. Dynamic mass tendencies result from 255 advection of ice into or out of a grid cell. Thermodynamic mass tendencies result from the sum of 256 basal ice growth, ice growth in supercooled open water, transformation of snow to sea ice, surface 257
melting, lateral melting, basal melting and evaporation/sublimation. See DuVivier et al. (2020), 258 Singh et al (2021), and Bailey (2021) for more information about these diagnostics including their 259 application to evaluate CESM2 sea ice. Consistent with a balanced mean state and negligible 260 model drift, the annual mean tendency terms differences are small (not shown). Yet, substantial 261
differences in the sea ice mass tendency terms occur during both the growth season and the melt 262 season in both hemispheres in response to the parameter changes made in CESM2-lessmelt. 263
Arctic sea ice mass tendency diagnostics show CESM2 and CESM2-lessmelt 264
differences result from both thermodynamics and dynamics (Figure 5). During the melt 265
season, CESM2-lessmelt has less Arctic thermodynamic sea ice mass loss than CESM2. This 266
thermodynamic sea ice mass loss difference is consistent with a higher snow albedo in CESM2-267
lessmelt than in CESM2. CESM2-lessmelt also has less thermodynamic Arctic sea ice mass gain 268
than CESM2 during the growth season due to the negative ice-thickness growth feedback (Bitz 269 and Roe, 2004). These opposing seasonal influences on thermodynamic tendency terms are 270
consistent with thicker Arctic sea ice in CESM2-lessmelt than in CESM2. Dynamical sea ice 271
tendency terms dominate at the sea ice edge and during the growth season. With its thicker sea 272 ice, CESM2-lessmelt has more ice export out of and more ice transport within the Arctic basin 273

than CESM2. When more ice is moved into a region where sea ice can melt, thermodynamic 274
mass tendencies and dynamic mass tendencies compensate. 275 We next evaluate sea ice mass tendencies for CESM2 and CESM2-lessmelt in the 276
Antarctic (Figure 6). Positive dynamic mass tendencies increase sea ice away from the Antarctic 277
coast in all seasons. This dynamically driven sea ice mass increases result from wind-driven 278 transport of sea ice away from the Antarctic coast. During the growth season, thermodynamically-279
driven sea ice mass gains occur near the coast, which in turn increases dynamically-driven sea 280
ice mass gains away from the coast. When compared to CESM2, CESM2-lessmelt has more 281 dynamical mass gain associated with this wind-driven sea ice advection in all seasons. During 282
the melt season, sea ice mass loss due to thermodynamics is less in CESM2-lessmelt than in 283
CESM2. Yet, the growth season in the Antarctic differs from that in the Arctic. Unlike in the Arctic, 284 the Antarctic has little multi-year ice and thus no negative ice-thickness growth feedback. Also 285 unlike the Arctic, the Antarctic gains mass through snow-ice formation. 286 287 3.2. Influence of sea ice tuning on pre-industrial global climate 288
Overall, CESM2-lessmelt and CESM2 have statistically significant differences in 289 surface air temperature, precipitation, and sea level pressure at both poles (Figure 7). In 290 contrast, impacts on non-polar climate are small and not statistically significant. Where CESM2-291
lessmelt has more sea ice than CESM2, the Arctic and Antarctic surface are both cooler in 292 CESM2-lessmelt than in CESM2, especially in non-summer seasons. Demonstrating the 293 importance of sea ice to polar surface temperatures, Ross Sea air temperatures increased in 294 CESM2-lessmelt when compared to CESM2, consistent with sea ice concentration and thickness 295
decreases from CESM2-lessmelt to CESM2 in this region (Figure 3d, Figure 4d). Generally 296 speaking, precipitation differences between CESM2 and CESM2-lessmelt followed surface 297 temperature differences. The relatively cooler CESM2-lessmelt atmosphere converges less 298
moisture and has less precipitation, especially in Fall in the Arctic. Despite this precipitation 299
reduction, CESM2-lessmelt has 10% more snow on Arctic sea ice in spring than CESM2, which 300
is in better agreement with observations (Webster et al., 2021). Overall, polar sea level pressure 301
differences are generally small and not statistically significant. One notable exception are 302
statistically significant sea level pressure differences between CESM2 and CESM2-lessmelt 303 during Arctic Fall, including the well-known atmospheric circulation response to boundary layer 304
thermal forcing (e.g., Deser et al. 2010). Here, boundary layer cooling in CESM2-lessmelt leads 305
to a local high SLP response in autumn (baroclinic vertical structure). 306

In addition to mean climate state, we also assessed climate variability differences 307
arising from the different sea ice mean states in CESM2 and CESM2-lessmelt. In brief, pre-308 industrial climate variability differences between the multi-century CESM2 and CESM2-lessmelt 309
pre-industrial control runs are small and not statistically significant. Major modes of climate 310
variability, such as those plotted in the Climate Variability Diagnostics Package (Phillips et al 311 2020), are unchanged between CESM2 and CESM2-lessmelt pre-industrial control runs. 312
Similarly, differences in inter-annual seasonal surface temperature, sea level pressure, and 313
precipitation standard deviations are small and not statistically significant (Figure S6). 314 315
3.3. Transient (1850-2100) sea ice evolution in CESM2 and CESM2-lessmelt 316
Present-day (1979-2014) monthly hemispheric mean differences (Figure 8) resemble 317 corresponding pre-industrial control differences (Figure 1). In the Arctic, CESM2-lessmelt has 318 more present-day sea ice volume than CESM2 in every month (Figure 8a). Moreover, CESM2-319 lessmelt also has more present-day Arctic sea ice cover than CESM2 in all months, with the 320 largest differences during the melt season and especially in late summer (Figure 8b-c). Overall, 321
the Arctic sea ice mean state is closer to observations in CESM2-lessmelt than in CESM2. Of 322 particular note, additional present-day late summer Arctic sea ice cover brings CESM2-lessmelt 323 closer to observations than CESM2. While present-day hemispheric multi-decadal Arctic sea ice 324
volume observations are not available (Massonnet et al. 2018), reductions in late-summer sea ice 325 cover biases are consistent with CESM2-lessmelt having more realistic sea ice volume than 326 CESM2. Like in the Arctic, present-day Antarctic sea ice differences between CESM2 and 327 CESM2-lessmelt are also qualitatively similar to the pre-industrial control (Figure S7). But unlike 328
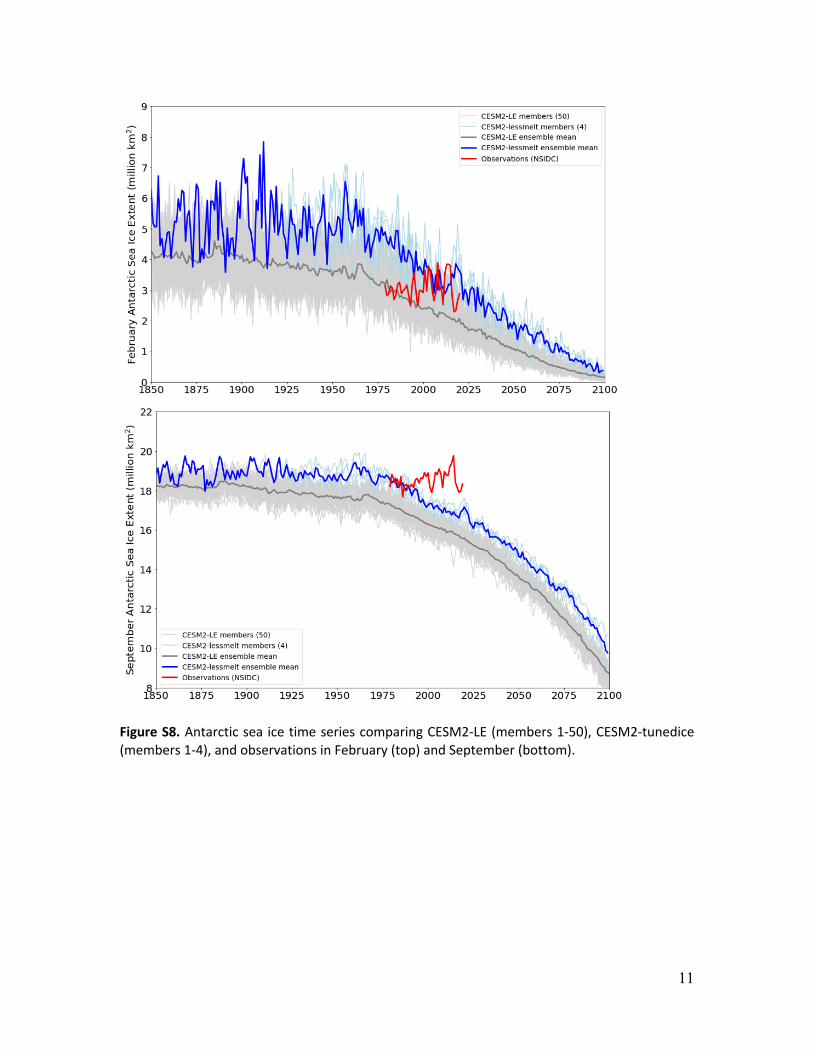
in the Arctic, both CESM2 variants have substantial Antarctic mean state biases without 329 consistent bias reduction from CESM2 to CESM2-lessmelt. Given similar Antarctic sea ice biases, 330 relatively modest Antarctic mean state sea ice changes, and the inability of CESM2 and CESM2-331
tuned ice to reproduce observed Antarctic sea trends (Figure S8), we focus on the Arctic for the 332
remainder of the transient sea ice comparisons. 333
Arctic maps reveal that the sea ice in CESM2 and CESM2-lessmelt evolves 334
differently from the present-day into the 21st century (Figure 9). While both CESM2 and 335
CESM2-lessmelt have their greatest present-day (1979-2014) late winter sea ice thicknesses and 336 late summer sea ice concentrations north of Greenland and the Canadian Archipelago, CESM2-337
lessmelt has more sea ice throughout much of the Arctic Ocean than CESM2 (Figure 9a-d). 338
Notably, September Arctic sea ice concentrations are substantially greater in CESM2-lessmelt 339 than in CESM2 (Figure 9c). Equally important, the present-day March sea ice is 0.5+ meters 340

thicker in CESM2-lessmelt than in CESM2 over most of the central Arctic Ocean (Figure 9d). By 341
2030-2049, Arctic sea ice differences between CESM2-lessmelt and CESM2 remain for late-342 summer September concentration but are small for late winter March thickness (Figure 9e-f). 343
Large 2030-2049 late summer ice cover differences occur because despite starting the melt 344
season with similar March sea ice thickness distributions, less melt occurs in CESM2-lessmelt 345 than in CESM2. This difference in 2030-2049 summer melt is consistent with higher albedo in 346
CESM2-lessmelt than in CESM2. By 2050-2069, CESM2 and CESM2-lessmelt have similar small 347
September sea ice concentrations (Figure 9g) . Consistent with a transition to a seasonally ice-348 free Arctic, March sea ice thicknesses are also similar in 2050-2069 over much of the Arctic Ocean 349
(Figure 9h). In fact, the only regions where 2050-2069 differences between CESM2-lessmelt and 350
CESM2 persist are along the coast of Northern Greenland and the far North Eastern portions of 351 the Canadian archipelago. 352
While ensemble means provide the most robust assessment of the differences in 353 CESM2 and CESM2-lessmelt, ensemble mean values are not physically realized quantities, 354 mute internal variability, and thus should not be compared as equals with observed 355
timeseries and trends. Instead, each individual CESM2-LE or CESM2-lessmelt ensemble 356 member’s time evolution should be treated as equally likely and the observations should be 357 treated as the single real world ensemble member. Consistent with time-averaged ensemble 358
mean comparisons (Figure 8), September Arctic sea ice extent in all four CESM2-lessmelt 359 ensemble members (Figure 10b) is a better match to 1979-2020 observations than any of the 50 360 CESM2-LE ensemble members (Figure 10a). Up until ice-free conditions are reached, CESM2-361 lessmelt ensemble members have more September sea ice extent than almost all of the CESM2-362
LE ensemble members. Unlike sea ice amount, 20-year linear trends in September Arctic sea ice 363 in CESM2-LE, CESM2-lessmelt, and observations largely overlap (Figure 10c). In other words, 364 CESM2-lessmelt and CESM2-LE trends are both consistent with observed trends. Due to 365
ensemble size differences, the spread in CESM2-lessmelt trends is smaller than the spread in 366
CESM2-LE trends. Thus, even though CESM2-lessmelt trends are more negative than observed 367
trends with end dates of 2001-2006, this may simply be the consequence of ensemble size 368
differences. As introduced in section 2.1 and in DeRepentigny et al. (2021), the individual 369
ensemble members show sea ice loss accelerates around the turn of the 21st century and then 370 the sea ice recovers in the early 21st century due to the prescribed biomass burning emissions in 371
CMIP6 forcing. 372
Continuing with the equally likely framework in mind, we next assess common 373 metrics used for sea ice model evaluation: sea ice sensitivity and the timing of a seasonally 374

ice-free Arctic (Figure 11). These metrics illustrate the challenge of large internally driven 375
variability for differentiating between CESM2-lessmelt and CESM2-LE and comparing them to 376 observations. For sea ice sensitivity per ton of cumulative anthropogenic CO2 emissions, both 377
the observations and the CESM2-lessmelt ensemble members lie almost entirely within the 378
spread of the first 50 CESM2-LE members (Figure 11a). In contrast, the sea ice sensitivity per 379 global mean warming appears larger in CESM2-lessmelt with three out of four ensemble 380
members outside of the spread of the CESM2-LE (Figure 11b). That said, the spread in CESM2-381
LE sea ice sensitivity values measured with respect to CO2 and global mean warming is large and 382 humbling. Assuming any individual ensemble member is equally likely, the large spread in sea 383
ice sensitivity metrics shows they are not strong observational constraints and provide limited 384
value as a model comparison metric, especially when ensemble size is small. 385 Internal variability also has a strong imprint on the timing of a first seasonally ice-386
free Arctic Ocean. Indeed, the CESM2-LE exhibits a 38 year spread in this metric with years 387 ranging from 2007 to 2045 (Figure 11c). While the spread in the CESM2-lessmelt first ice-free 388 Arctic year is small (2041 to 2057), the 4 CESM2-lessmelt first ice-free years barely overlap with 389
the 50 CESM2-LE first ice-free years. Bootstrapping the CESM2-LE ice-free dates shows the two 390 distributions are statistically different at the 95% confidence level. In other words, the thicker and 391 more extensive Arctic sea ice in CESM2-lessmelt delays the timing of an ice free Arctic when 392
compared to CESM2-LE. While the delay of the first ice-free Arctic is statistically significant, the 393 large internally generated variability still limits its predictability by decades. The spread in ice-free 394 years in the first 50 members of the CESM2-LE is made especially large and early by the 395 accelerated sea ice decline associated with the CMIP6 biomass burning emissions 396
(DeRepentigny et al. 2021). 397 We next use ensemble means to quantify forced response differences between 398
CESM-LE and CESM2-lessmelt (Figure 12). To make consistent forced response comparisons, 399
we bootstrap the 50 CESM2-LE members to generate statistics that are consistent with 400
ensembles with only four members. With these bootstrapped values, we can statistically assess 401
when CESM2-lessmelt and CESM2-LE differ while accounting for differences in ensemble size. 402
For example, if the CESM2-lessmelt ensemble mean lies outside of the 95% confidence limits of 403
sample statistics generated randomly by selecting 4 members of the CESM2-LE many times (here 404 1,000 times), the forced response differences are statistically significant. Comparing the 405
ensemble means consistent with four ensemble members, we find that CESM2-lessmelt has more 406
September sea ice extent (Figure 12a) and more March sea ice volume (Figure 12b). 407 Interestingly, twenty-year trends in September sea ice extent and March sea ice volume are 408

statistically indistinguishable in CESM2-lessmelt and CESM2-LE with the exception of three 409
periods (Figure 12c-d). The first exception is for the period with trend end dates ~2010 during 410 the biomass burning forcing discontinuity. During this time period, the CESM2-lessmelt has less 411
negative sea ice extent trends and more negative sea ice volume trends than the CESM2-LE. 412
This first exception is consistent with the thicker sea ice in CESM2-lessmelt being more resilient 413 to ice cover changes but more sensitive to ice volume changes due to a weaker thickness-ice 414
growth feedback. The second time period when there are trend differences occurs in the 2060s 415
and 2070s. This exception occurs because CESM2-lessmelt still has ice to lose while CESM2-LE 416 is ice-free already in September (Figure 11c). As a result, CESM2-lessmelt has more negative 417
September sea ice extent trends than CESM2-LE during the 2060s and 2070s. Similar trend 418
differences associated with timing differences to an ice-free Arctic are seen in October and 419 August, but shifted later in the 21st century (not shown). The last time period is for trend end dates 420 around 1970 when the volume trends in CESM2-lessmelt are larger than those in CESM2-LE. 421
We finish comparing the 1850-2100 transient sea ice evolution by contrasting 422 interannual sea ice variability in CESM2-lessmelt and CESM2. As was done for means, we 423
bootstrap the CESM2-LE to create variability estimates consistent with an ensemble with only 4 424 members. Consistent with previous work (Goosse et al. 2009, Mioduszewski et al. 2019), we find 425 Arctic sea ice cover variability strongly depends on the mean sea ice thickness in CESM2 and 426
CESM2-lessmelt (Figure S9). Overall, September sea ice extent interannual variability is smaller 427 in CESM2-lessmelt than in CESM2 until the middle of the 21st century. Smaller September sea 428 ice variability in CESM2-lessmelt is especially seen during the turn of the century forced sea ice 429 decline (20 year trends ending ~2010). After the 2040s, CESM2-lessmelt has more year-to-year 430
September sea ice extent variability than CESM2 because CESM2-lessmelt transitions to a 431 seasonally ice-free Arctic later than CESM2. 432 433
3.4. Influence of sea ice mean state on transient climate change 434
We next assess the impact of the differing CESM2 and CESM2-lessmelt 1850-2100 435
sea ice evolution on transient climate change more broadly. In the end, we focus on surface 436
warming for two reasons. First, climate impacts often scale with surface warming. As a result, 437
assessing where/when warming differences occur provides a foundation for assessing if the 438 CESM2 and CESM2-lessmelt sea ice evolution differences impact climate change and variability 439
more broadly. Second, we investigated other climate variables such as precipitation and sea level 440
pressure and found that differences in the transient climate response in CESM2 and CESM2-441 lessmelt were small and not statistically significant (e.g., Figure S10). One exception was smaller 442

21st century winter Arctic precipitation increases in CESM2-lessmelt than in CESM2. This 443
exception is consistent with Clausius–Clapeyron relation, namely a reduced water vapor increase 444 associated with less warming in CESM2-lessmelt than in CESM2. 445
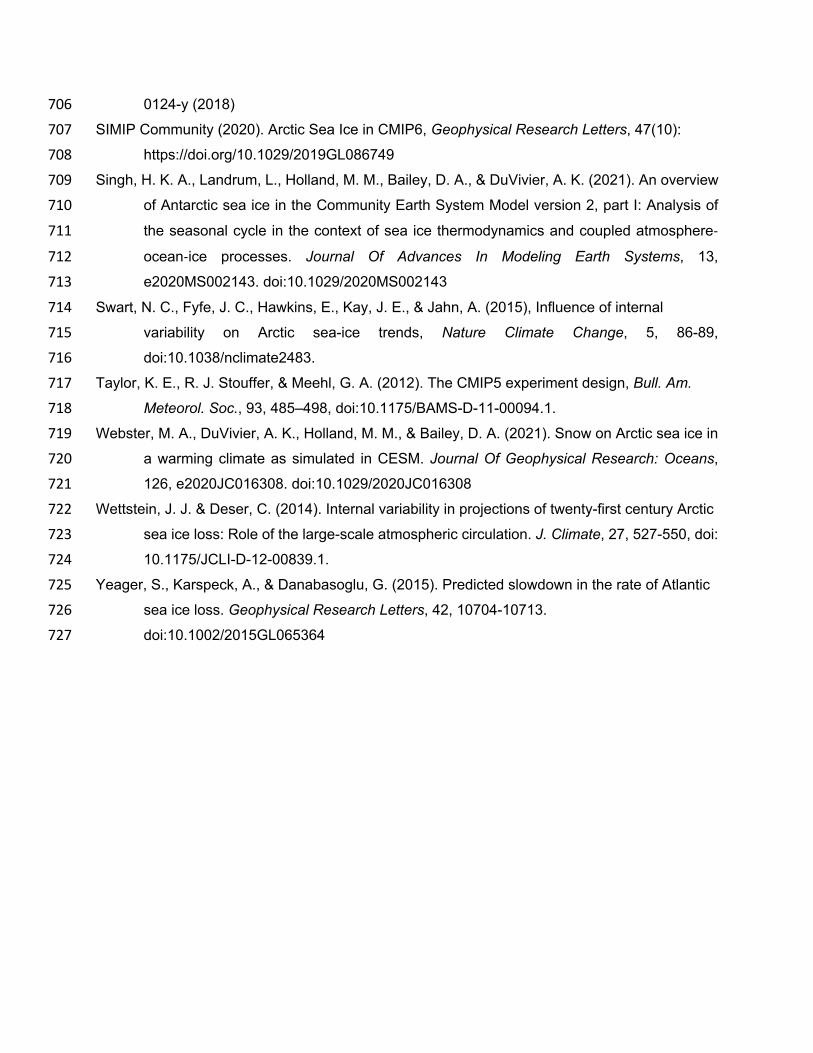
When plotted as anomalies, the 1850-2100 evolution of the global mean surface 446
temperature anomaly in CESM2 and CESM2-lessmelt are indistinguishable (Figure 13a). 447 Both CESM2 model variants are consistent with the observed global air surface temperature 448
anomaly evolution (Hansen et al. 2010). When plotted as absolute values, the global mean 449
surface temperature is lower in CESM2-lessmelt than CESM2 (Figure 13b). This absolute 450 temperature difference between the two CESM2 variants remains constant over the entire 1850-451
2100 period. Moreover, the spatial pattern of seasonal warming in CESM2-lessmelt and CESM2 452
is statistically indistinguishable aside from two notable exceptions in the Arctic (Figure 14). First, 453 CESM2-lessmelt warms more than CESM2 along the sea ice edge during Fall, particularly in the 454 Pacific sector. This larger warming occurs because CESM2-lessmelt has more sea ice to lose in 455 these regions than CESM2 (Figure 2b). Second, CESM2 warms more than CESM-lessmelt in 456 the central Arctic Ocean during winter. This difference arises because CESM2 has thinner sea 457
ice than CESM2-lessmelt. 458 While the total zonal mean warming over the period 1920-1939 to 2080-2099 is 459
remarkably similar in CESM2 and CESM2-lessmelt, when that warming happens differs 460
between the two model variants in the Arctic. Indeed, comparisons of zonal mean warming 461 rates in CESM2 and CESM2-lessmelt show differences in the Arctic warming rates in all seasons 462 except summer (Figure 15). In particular, CESM2 has large non-summer surface Arctic warming 463 rates earlier than CESM2-lessmelt. These larger early warming rates in CESM2 results from an 464
earlier transition towards an ice-free Arctic Ocean in CESM2 than in CESM2-lessmelt. 465 466 4. Summary and Discussion 467
This study assesses the influence of sea ice mean state on simulated climate 468
change and variability in a state-of-the-art global coupled climate model. Novel and new 469
here, a large 50-member large ensemble is leveraged as a control for assessing the new small 470
4-member ensemble with more mean state sea ice, especially in the Arctic. As large initial 471
condition ensembles are generally run after model releases, we address a question that is 472 unanswerable during model development: Do differences in the pre-industrial control sea ice 473
mean state alter the ensemble spread of realized transient climate change? Our results re-enforce 474
that a realistic Arctic mean state is critical to simulating a realistic transition to an ice-free Arctic 475 Ocean. Specifically, simulations with the same global warming but more Arctic sea ice in their 476

pre-industrial control have a later transition to a late summer ice-free Arctic over the 21st century. 477
These results demonstrate starting with a reasonable initial state is important for trusting model-478 projected timing towards an ice-free Arctic Ocean in a warming world. Important for climate 479
projections and model development more generally, the sea ice differences examined here had 480
negligible impacts outside the polar regions. 481 Interestingly, many commonly used metrics to benchmark sea ice simulations 482
provide limited value in this study. While ensemble means best emphasize differences 483
between model versions, ensemble mean values are not physically realized quantities, mute 484 internal variability, and thus were not compared as equals with observed timeseries and trends 485
(Kay et al. 2015, Deser et al. 2012). Assuming any individual ensemble member is equally likely, 486
many metrics struggle to differentiate between the thicker (CESM2-lessmelt) and thinner 487 (CESM2) sea ice model variants examined here. For example, this study reinforces previous work 488 showing a two decade uncertainty in the timing of an ice-free Arctic due to internally generated 489 variability (Jahn et al. 2016, Notz 2015). Here, we find an almost four decade uncertainty in the 490 timing of an ice-free Arctic in the first 50 members of the CESM2-LE due to the confluence of 491
CMIP6 biomass burning forcing and thin CESM2 Arctic sea ice. In addition, sea ice sensitivity 492 exhibits large spread in the first 50 CESM2-LE members and thus provides limited value as an 493 observational constraint or a robust model comparison metric to CESM2-lessmelt. Finally, linear 494
sea ice area trends were similar between CESM2 and CESM2-lessmelt ensemble members. The 495 fact that such commonly used metrics provide limited differentiation in this study is sobering and 496 merits emphasis. Internal variability is large and must be measured and accounted for when 497 comparing model ensemble size, as was done here. Of course, these findings are not entirely 498
surprising given similar global warming in CESM2 and CESM2-lessmelt. In other words, global 499 warming cannot be used as constraint on simulated sea ice trends or sensitivity in this study. In 500 fact, the mean state differences probed here were not large enough to cause Arctic sea ice trend 501
differences for the same amount of global warming. As a result, this work does not refute previous 502
work showing that global warming (e.g., Mahlstein and Knutti 2012, Roach et al. 2020) can 503
constrain sea ice change, and can help illustrate when models have the right Arctic sea ice trends 504
for the wrong reasons (e.g., Rosenblum and Eisenman 2017). In summary, the similarity between 505
CESM2 and CESM2-tuned found here provides further evidence that global warming exerts 506 strong controls on Arctic sea ice trends. 507
We end by discussing lessons learned for simulation of sea ice in a global coupled 508
climate modeling framework. We began this study by reducing sea ice surface melt in a pre-509 industrial control simulation in search of a stable model configuration with more Arctic Ocean sea 510

ice volume and late summer Arctic Ocean sea ice cover. The parameter modifications 511
implemented in CESM2-lessmelt were specifically targeted to reduce summer melt in the Arctic 512 where surface melt dominates. Unlike the Arctic, Antarctic sea ice melt is dominated by bottom 513
melt. Thus, we anticipated and found relatively small differences in the Antarctic sea ice mean 514
state as a result of our parameter modifications. After obtaining a stable multi-century control run, 515 we then ran transient 1850-2100 simulations with no additional changes. What emerged in the 516
transient simulations was influenced both by the mean state and by feedbacks in CESM2, and 517
was a surprise to us. Indeed, our success in obtaining more realistic transition to an ice-free Arctic 518 state with CESM2-tuned suggests that sea ice thickness and late summer cover are important 519
targets for sea ice in coupled model development. In contrast, attention to and tuning of Arctic 520
sea ice area alone is generally insufficient. That said, sea ice area expansion is important to 521 monitor and model development should focus on parameters and physics that lead to credible 522 sea ice area distributions. The North Atlantic is especially important to monitor as when sea ice 523 expands to completely cover the ocean there, it can shut down North Atlantic deep water 524 formation, and derail global coupled earth system model development as discussed in 525
Danabasoglu et al. (2021). 526 527 528
529 530 531 532
533 534 535
536
537
538
539
540 541
542
543 544

Acknowledgments and Data 545
546 J.E.K. was supported by National Science Foundation (NSF) CAREER 1554659. P. D. was 547
supported by the Natural Sciences and Engineering Council of Canada (NSERC), the Fond de 548
recherche du Québec – Nature et Technologies (FRQNT) and the Canadian Meteorological and 549 Oceanographic Society (CMOS) through Ph.D. scholarships and by NSF CAREER 1554659, and 550
NSF CAREER 1847398. M.M.H., D.A.B., A.D., C.D., J.E., and N.R. acknowledge support by the 551
National Center for Atmospheric Research (NCAR), which is a major facility sponsored by the 552 NSF under Cooperative Agreement 1852977. M. M. H. was additionally supported by NSF-OPP 553
1724748. A.J. was supported by NSF CAREER 1847398. M.M.S. was supported by NSF OPP-554
1724467 and OPP-172474. M.A.W. was provided by NASA's New (Early Career) Investigator 555 Program in Earth Science Award 80NSSC20K0658. S.-S..L. and K.B.R.. were supported by IBS-556 R028-D1. The CESM project and NCAR are supported primarily by NSF. Computing and data 557 storage resources for developing CESM2, CESM2-lessmelt, and CESM2-LE were provided by 558 the Computational and Information Systems Laboratory (CISL) at NCAR, including the Cheyenne 559
supercomputer (doi:10.5065/D6RX99HX). The CESM2-LE simulations were run on the IBS/ICCP 560 supercomputer “Aleph”, a 1.43 petaflop high-performance Cray XC50-LE Skylake computing 561 system with 18,20 processor cores, with 9.59 petabytes of disc storage, and 43 petabytes of tape 562
archive storage. CESM2-LE data are available here: 563 https://www.cesm.ucar.edu/projects/community-projects/LENS2/. The CESM2-lessmelt data are 564 available via Globus access to NCAR GLADE at: 565 /glade/campaign/cgd/ppc/cesm2_tuned_albedo. For more information on using Globus on NCAR 566
systems, please refer to https://www2.cisl.ucar.edu/resources/storage-and-file-systems/globus-567 file-transfers 568 569

References 570
Bailey, D. A., Holland, M. M., DuVivier, A. K., Hunke, E. C., & Turner, A. K. (2020). Impact of a 571 new sea ice thermodynamic formulation in the CESM2 sea ice component. Journal Of 572
Advances In Modeling Earth Systems, 12, e2020MS002154. doi:10.1029/2020MS002154 573
Bitz, C. M, Holland, M. M., Hunke, E. & Moritz, R. E. (2005). Maintenance of the sea-ice edge, J. 574 Climate, 18, 2903-2921. 575
Bitz, C. M. (2008). Some aspects of uncertainty in predicting sea ice thinning, in Arctic Sea Ice 576
Decline: observations, projections, mechanisms, and implications, AGU Geophysical 577 Monograph Series, vol, edited by E. deWeaver, C. M. Bitz, and B. Tremblay, pp. 63-76 , 578
American Geophysical Union. 579
Bitz, C. M. & Roe, G. H. (2004). A Mechanism for the High Rate of Sea-Ice Thinning in the Arctic 580 Ocean, J. Climate, 17, 3622--31 581
Blanchard-Wrigglesworth E., Bitz, C.M. & Holland, M.M. (2011). Influence of initial conditions and 582 climate forcing on predicting Arctic sea ice, Geophysical Research Letters, 38, L18503, 583 doi: 10.1029/2011GL048807 584
Bonan, D. B., Lehner, F. & Holland, M. (2021). Partitioning uncertainty in projections of Arctic sea 585 ice, Environmental Research Letters, DOI: 10.1088/1748-9326/abe0ec 586
Briegleb, B. P., & Light, B. (2007). A delta-Eddington multiple scattering parameterization for 587
solar radiation in the sea ice component of the Community Climate System Model. NCAR 588 Tech. Note TN-4721STR, 100 pp. 589
Danabasoglu, G., Lamarque, J.-F., Bachmeister, J., Bailey, D. A., DuVivier, A. K., Edwards, J., 590 Emmons, L. K., Fasullo, J., Garcia, R., Gettelman, A., Hannay, C., Holland, M. M., Large, 591
W. G., Lawrence, D. M., Lenaerts, J. T. M., Lindsay, K., Lipscomb, W. H., Mills, M. J., 592 Neale, R., Oleson, K. W., Otto-Bliesner, B., Phillips, A. S., Sacks, W., Tilmes, S., van 593 Kampenhout, L., Vertenstein, M., Bertini, A., Dennis, J., Deser, C., Fischer, C., Fox-594
Kemper, B., Kay, J. E., Kinnison, D., Kushner, P. J., Long, M. C., Mickelson, S., Moore, J. 595
K., Nienhouse, E., Polvani, L., Rasch, P. J., & Strand, W. G. (2020). The Community Earth 596
System Model version 2 (CESM2). Journal of Advances in Modeling Earth Systems, 12, 597
e2019MS001916. https://doi.org/10.1029/2019MS001916 598
DeRepentigny, P., Jahn., A., Holland, M. M., Fasullo, J., Lamarque, J.-F., Hannay, C., Mills, M. 599 J., Bailey, D. Tilmes, S., & Barrett, A. (2021). Enhanced early 21st century Arctic sea ice 600
loss due to CMIP6 biomass burning emissions, Nature Climate Change, under review, 601
Available here: https://bit.ly/3Ahkjj1 602 DeRepentigny, P., Jahn, A., Holland, M. M., & Smith, A. (2020). Arctic sea ice in the two 603

Community Earth System Model Version 2 (CESM2) configurations during the 20th and 604
21st centuries. Journal of Geophysical Research: Oceans, 125, e2020JC016133. 605 https://doi.org/10.1029/2020JC016133 606
Deser, C., Lehner, F., Rodgers, K.B. et al. (2020). Insights from Earth system model initial- 607
condition large ensembles and future prospects. Nat. Clim. Chang. 10, 277–286, 608 https://doi.org/10.1038/s41558-020-0731-2 609
Deser, C., R. Knutti, , S. Solomon, & Phillips, A. S. (2012). Communication of the role of 610
natural variability in future North American climate. Nat. Climate Change, 2, 775–779, 611 doi:10.1038/nclimate1562. 612
Deser, C., R. Tomas, M. Alexander, & Lawrence, D. (2010). The seasonal atmospheric 613
response to projected Arctic sea ice loss in the late 21st century. J. Climate, 23, 333-351, 614 10.1175/2009JCLI3053.1. 615
DuVivier, A., Holland, M., Kay, J. E., S. Tilmes, A. Gettelman, & Bailey, D. (2020), Arctic and 616 Antarctic sea ice state in the Community Earth System Model Version 2, Journal of 617 Geophysical Research—Oceans, http://dx.doi.org/10.1029/2019JC015934 618
Eyring, V., Bony, S., Meehl, G. A., Senior, C. A., Stevens, B., Stouffer, R. J., & Taylor, K. E. 619 (2016). Overview of the Coupled Model Intercomparison Project Phase 6 (CMIP6) 620 experimental design and organization, Geosci. Model Dev., 9, 1937–1958, 621
https://doi.org/10.5194/gmd-9-1937-2016. 622 Fasullo, J. T., Lamarque, J-F, Hannay, C., Rosenbloom, N., Tilmes, S., DeRepentigny, P., Jahn, 623
A., & Deser, C. (2021). Spurious Late Historical-Era Warming in CESM2 and Other CMIP6 624 Climate Simulations Driven by Prescribed Biomass Burning Emissions, Nature Climate 625
Change, under review, Available here: https://bit.ly/360yXNv 626 Fetterer, F., K. Knowles, W. N. Meier, M. Savoie, & Windnagel, A. K. (2017), Sea Ice Index, 627
Version 3. [1979-2020]. Boulder, Colorado USA. NSIDC: National Snow and Ice Data 628
Center. doi: https://doi.org/10.7265/N5K072F8. 629
Goosse, H., Arzel., O., Bitz, C. M., de Montety, A., & Vancoppenolle, M. (2009) Increased 630
variability of the Arctic summer ice extent in a warmer climate, Geophys. Res. Lett., 36, 631
L23702, https://doi.org/10.1029/2009GL040546, 2009 632
Hansen, J., et al. (2010). Global surface temperature change, Rev. Geophys., 48, RG4004, 633 doi:10.1029/2010RG000345 634
Holland, M.M., L. Landrum, D. Bailey, & Vavrus, S.J. (2019). Changing seasonal predictability 635
of Arctic summer sea ice area in a warming climate. J. Climate, doi:10.1175/JCLI-D-19-636 0034.1 637
Holland, M.M., D.A. Bailey, & Vavrus, S. (2011). Inherent sea ice predictability in the rapidly 638
changing Arctic environment of the Community Climate System Model, version 3, Climate 639 Dynamics, 36, 1239-1253, doi:10.1007/s00382-010-0792-4. 640
Holland, M.M., & Stroeve, J. (2011). Changing seasonal sea ice predictor relationships in a 641
changing Arctic climate. Geophys. Res. Lett., 38, L18501, doi:10.1029/2011GL049303. 642 Holland, M. M., M. C. Serreze, & Stroeve, J. (2010). The sea ice mass budget of the Arctic and 643
its future change as simulated by coupled climate models, Climate Dynamics, 34, 185–644
200, doi:10.1007/s00382-008-0493-4. 645 Holland, M.M., C.M. Bitz, & Tremblay, B. (2006). Future abrupt reductions in the Summer Arctic 646
sea ice, Geophys. Res. Lett., 33, L23503, doi:10.1029/2006GL028024. 647
Hunke E. C., W. H. Lipscomb, A. K. Turner, N. Jeffery, & Elliott, S. (2015). CICE: The Los Alamos 648 Sea Ice Model. Documentation and Software User’s Manual. Version 5.1. T-3 Fluid 649 Dynamics Group, Los Alamos National Laboratory, Tech. Rep. LA-CC-06-012. 650
Jahn, A. (2018). Reduced probability of ice-free summers for 1.5 °C compared to 2 °C warming. 651 Nature Climate Change, 8: 409-413. DOI: 10.1038/s41558-018-0127-8 652
Jahn, A., Kay, J. E., Holland, M. M., & Hall, D. M. (2016). How predictable is the timing of a 653 summer ice-free Arctic?. Geophysical Research Letters, 43(17): 9113-9120. DOI: 654 10.1002/2016GL070067 655
Kay, J. E., Deser, C., Phillips, A., Mai, A., Hannay, C., Strand, G., Arblaster, J., Bates, S., 656 Danabasoglu, G., Edwards, J., Holland, M. Kushner, P., Lamarque, J.-F., Lawrence, D., 657 Lindsay, K., Middleton, A., Munoz, E., Neale, R., Oleson, K., Polvani, L., & Vertenstein, 658 M. (2015). The Community Earth System Model (CESM) Large Ensemble Project: A 659
Community Resource for Studying Climate Change in the Presence of Internal Climate 660 Variability, Bulletin of the American Meteorological Society, 96, 1333–1349. 661 doi:10.1175/BAMS-D-13-00255.1. 662
Kay, J. E., Holland, M. M., & Jahn, A. (2011). Inter-annual to multi-decadal Arctic sea ice extent 663
trends in a warming world. Geophysical Research Letters, 38, L15708. 664
https://doi.org/10.1029/2011GL048008 665
Kirchmeier-Young, M. C., F. W. Zwiers, & Gillett, N. P. (2017). Attribution of extreme events 666
in Arctic sea ice extent, J. Clim., 30, 553–571 doi:10.1175/JCLI-D-16-0412.1. 667
Latif, M., T. Martin, & Park, W. (2013). Southern Ocean sector centennial climate variability and 668
recent decadal trends, J. Clim., 26(19), 7767–7782. 669 Mahlstein, I., & Knutti, R. (2012). September Arctic sea ice predicted to disappear near 2°C 670
global warming above present, J. Geophys. Res., 117, D06104, 671

doi:10.1029/2011JD016709. 672
Massonnet, F., Vancoppenolle, M., Goosse, H., Docquier, D., Fichefet, T., & Blanchard- 673
Wrigglesworth, E. (2018). Arctic sea-ice change tied to its mean state through 674
thermodynamic processes. Nature Climate Change, 8(7), 599–603. 675
https://doi.org/10.1038/s41558-018-0204-z 676
Mauritsen, T., Stevens, B., Roeckner, E., Crueger, T., Esch, M., Giorgetta, M., et al. (2012). 677
Tuning the climate of a global model. Journal of Advances in Modeling Earth Systems, 4, 678 M00A01. https://doi.org/10.1029/2012MS000154 679
Mioduszewski, J., S. Vavrus, M. Wang, M. Holland, & Landrum, L. (2019). Past and future 680
interannual variability in Arctic sea ice in coupled climate model. Cryosphere, 13, 113–681 124, https://doi.org/10.5194/tc-13-113-2019. 682
Notz, D. (2015). How well must climate models agree with observations? Philosophical 683 Transactions of the Royal Society A, 373(2052), 20140164. 684 https://doi.org/10.1098/rsta.2014.0164 685
O'Neill, B. C., Tebaldi, C., van Vuuren, D. P., Eyring, V., Friedlingstein, P., Hurtt, G., Knutti, R., 686 Kriegler, E., Lamarque, J.-F., Lowe, J., Meehl, G. A., Moss, R., Riahi, K., and Sanderson, 687
B. M. (2016). The Scenario Model Intercomparison Project (ScenarioMIP) for CMIP6, 688
Geosci. Model Dev., 9, 3461–3482, https://doi.org/10.5194/gmd-9-3461-2016. 689 Phillips, A. S., C. Deser, J Fasullo, D. P. Schneider & Simpson, I. R. (2020). Assessing Climate 690
Variability and Change in Model Large Ensembles: A User’s Guide to the “Climate 691
Variability Diagnostics Package for Large Ensembles”, doi:10.5065/h7c7-f961 692 Roach, L. A., Dörr, J., Holmes, C. R., Massonnet, F., Blockley, E. W., Notz, D., & Bitz, C. 693
M. (2020). Antarctic sea ice in CMIP6. Geophysical Research Letters, 47, 694 e2019GL086729. https://doi.org/10.1029/2019GL086729 695
Rodgers, K., Lee, S-S., Rosenbloom, N., Timmerman, A., Danabasoglu, G., Deser, C.., Edwards, 696 J., Kim, J-E., Simpson, I., Stein, K, Stuecker, M., F., Yamaguchi, R., Bodai, T., Chang, E-697 S., Huang, L., Kim, W. M., Lamarque, J.-F., Lombardozzi, D., Wieder, W. R., and S. G. 698
Yeager (2021), Ubiquity of human-induced changes in climate variability, submitted to 699 Earth System Dynamics, https://doi.org/10.31223/X5GP79, Preprint available here: 700 https://eartharxiv.org/repository/view/2444/ 701
Rosenblum, E. & Eisenman, I. (2017). Sea ice trends in climate models only accurate in runs 702
with biased global warming. Journal of Climate, 30(16), pp.6265-6278. 703 Sigmond, M., Fyfe, J. C. & N. C. Swart (2018). Ice-free Arctic projections under the Paris 704
Agreement, Nat. Clim. Change, https://doi.org/10.1038/s41558-018- 705
0124-y (2018) 706
SIMIP Community (2020). Arctic Sea Ice in CMIP6, Geophysical Research Letters, 47(10): 707 https://doi.org/10.1029/2019GL086749 708
Singh, H. K. A., Landrum, L., Holland, M. M., Bailey, D. A., & DuVivier, A. K. (2021). An overview 709
of Antarctic sea ice in the Community Earth System Model version 2, part I: Analysis of 710
the seasonal cycle in the context of sea ice thermodynamics and coupled atmosphere-711
ocean-ice processes. Journal Of Advances In Modeling Earth Systems, 13, 712
e2020MS002143. doi:10.1029/2020MS002143 713
Swart, N. C., Fyfe, J. C., Hawkins, E., Kay, J. E., & Jahn, A. (2015), Influence of internal 714
variability on Arctic sea-ice trends, Nature Climate Change, 5, 86-89, 715 doi:10.1038/nclimate2483. 716
Taylor, K. E., R. J. Stouffer, & Meehl, G. A. (2012). The CMIP5 experiment design, Bull. Am. 717 Meteorol. Soc., 93, 485–498, doi:10.1175/BAMS-D-11-00094.1. 718
Webster, M. A., DuVivier, A. K., Holland, M. M., & Bailey, D. A. (2021). Snow on Arctic sea ice in 719
a warming climate as simulated in CESM. Journal Of Geophysical Research: Oceans, 720 126, e2020JC016308. doi:10.1029/2020JC016308 721
Wettstein, J. J. & Deser, C. (2014). Internal variability in projections of twenty-first century Arctic 722 sea ice loss: Role of the large-scale atmospheric circulation. J. Climate, 27, 527-550, doi: 723 10.1175/JCLI-D-12-00839.1. 724
Yeager, S., Karspeck, A., & Danabasoglu, G. (2015). Predicted slowdown in the rate of Atlantic 725 sea ice loss. Geophysical Research Letters, 42, 10704-10713. 726 doi:10.1002/2015GL065364 727

Figure 1. Seasonal cycle in CESM2 and CESM2-lessmelt 1850 preindustrial control runs: a) Arctic sea ice volume, b) Arctic sea ice area and extent, c) Antarctic sea ice volume, d) Antarctic sea ice area and extent. Values are overlapping 200-year averages (years 911-1110 of the CESM2 CMIP6 1850 pre-industrial control run).
a.
b.
c.
d.

Figure 2. Late summer sea ice concentration in preindustrial control runs: a) September Arctic CESM2-lessmelt, b) Difference September Arctic (CESM2-lessmelt - CESM2), c) February Antarctic CESM2-lessmelt, d) Difference February Antarctic (CESM2-lessmelt - CESM2). Values are overlapping 200-year averages as in Figure 1. Note: Nonlinear color scale used to emphasize thin ice categories.
a. b.
c. d.

Figure 3. Late winter sea ice concentration in preindustrial control runs: a) CESM2-tuned ice March Arctic, b) Difference March Arctic, c) CESM2-lessmelt September Antarctic, d) Difference September Antarctic. Values are overlapping 200-year averages as in Figure 1. Note: Nonlinear color scale used to emphasize thin ice categories.
a. b.
c. d.
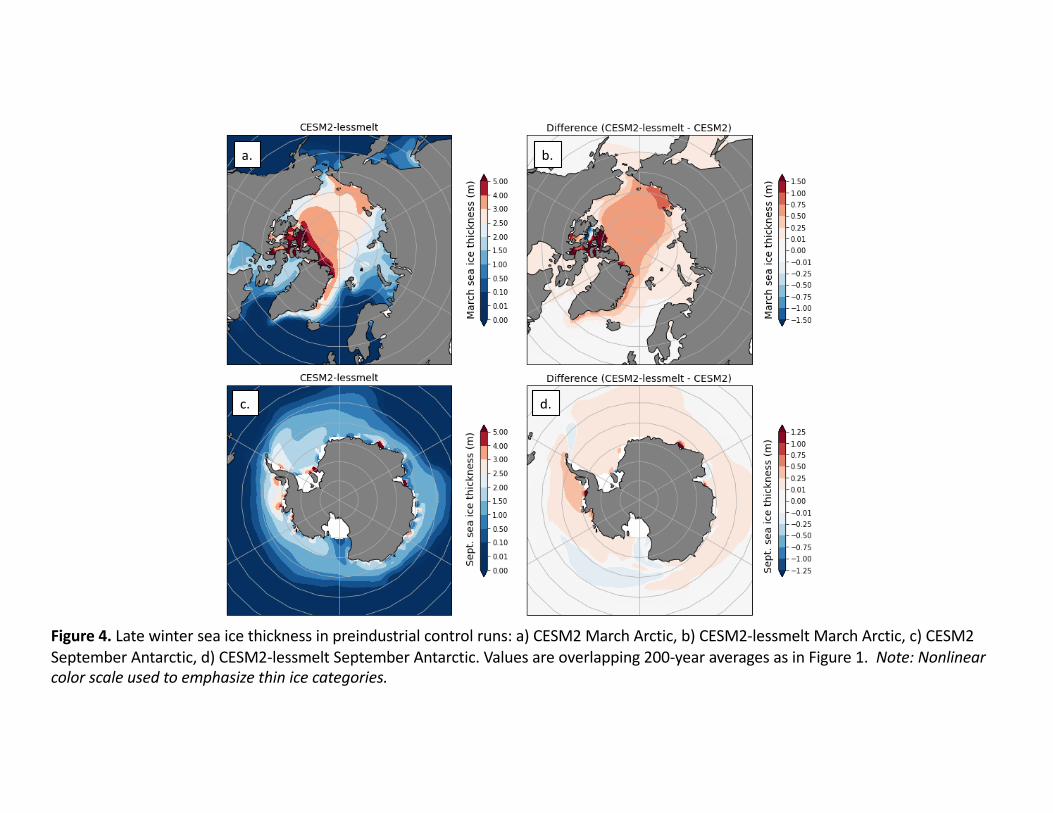
Figure 4. Late winter sea ice thickness in preindustrial control runs: a) CESM2 March Arctic, b) CESM2-lessmelt March Arctic, c) CESM2 September Antarctic, d) CESM2-lessmelt September Antarctic. Values are overlapping 200-year averages as in Figure 1. Note: Nonlinear color scale used to emphasize thin ice categories.
a. b.
c. d.

Figure 5. Arctic sea ice mass tendency terms for the melt season [AMJJAS] (left), and the growth season [ONDJFM] (right). For each season, the top row is tendency due to dynamics (sidmassdyn), the middle row is tendency due to thermodynamics (sidmassth), and the bottom row is their sum. All differences are CESM2-lessmelt minus CESM2. Values are overlapping 200-year averages as in Figure 1.

Figure 6. Antarctic sea ice mass tendency terms for the melt season [ONDJFM] (left), and the growth season [AMJJAS] (right). For each season, the top row is tendency due to dynamics (sidmassdyn), the middle row is tendency due to thermodynamics (sidmassth), and the bottom row is their sum. All differences are CESM2-lessmelt minus CESM2. Values are overlapping 200-year averages as in Figure 1.

Figure 7. Global maps of difference in CESM2-lessmelt minus CESM2 pre-industrial by season. Top row shows surface temperature (K), Middle row shows total precipitation amount (% difference). Bottom row shows sea level pressure (mb). Grey stippling shows regions that are not statistically different at the 95% confidence level using a 2-sided t-test. Values are overlapping 200-year averages as in Figure 1.

Figure 8. Present-day (1979-2014) ensemble mean seasonal cycle in CESM2-LE and CESM2-lessmelt: a) Arctic sea ice volume, b) Arctic sea ice extent, c) Arctic sea ice area. Observations are from NSIDC sea ice index with pole filling (Fetterer et al. 2017).
a. b.
c.

Figure 9. Ensemble mean Arctic sea ice maps: a) Present-day (1979-2014) CESM2-lessmelt September concentration, b) as in a) but for Marchthickness, c-d) as in a-b) but for the CESM2-lessmelt minus CESM2-LE difference, e-f) as in c-d) but for 2030-2049, g-h) as in c-d) but for 2050-2069
a.
b.
c.
d.
e.
f.
g.
h.

Figure 10. Arctic September sea ice extent transient evolution: a) CESM2-LE 1850-2100 timeseries, b) CESM2-lessmelt 1850-2100 timeseries, c) 20-year trends in CESM2-LE, CESM2-lessmelt, and observations with end years of 1999-2049. Observations are from NSIDC sea ice index (Fetterer et al. 2017) with area pole-filling.
a. b.
c.

Figure 11. Arctic sea ice comparison metrics: a) Sea ice sensitivity defined as change in September sea ice extent per ton of cumulative atmospheric carbon dioxide emissions (dSIE/dCO2), b) Sea ice sensitivity defined as change in September sea ice extent per degree global mean surface temperature (dSIE/dGMST), c) Year with first seasonally ice-free Arctic Ocean. Sea ice sensitivity calculations follow protocol and years (1979-2014) used for evaluation of CMIP6 models by the SIMIP Community (2020). Seasonally ice-free occurs when September sea ice extent first falls below 1 million sq. km.
c.a. b.
CESM2-LE
CESM2-lessmelt
CESM2-LE
CESM2-lessmelt

Figure 12. CESM2-LE and CESM2-lessmelt Arctic sea ice: a) September extent ensemble mean 1850-2100 timeseries, b) March volume ensemble mean 1850-2100 timeseries, c) September extent ensemble mean 20-year trends, d) March volume ensemble mean trends. Grey shading shows 95% confidence intervals on trends calculated by bootstrapping CESM2-LE ensemble means with 4 members 1,000 times.
b.
d.c.
a.
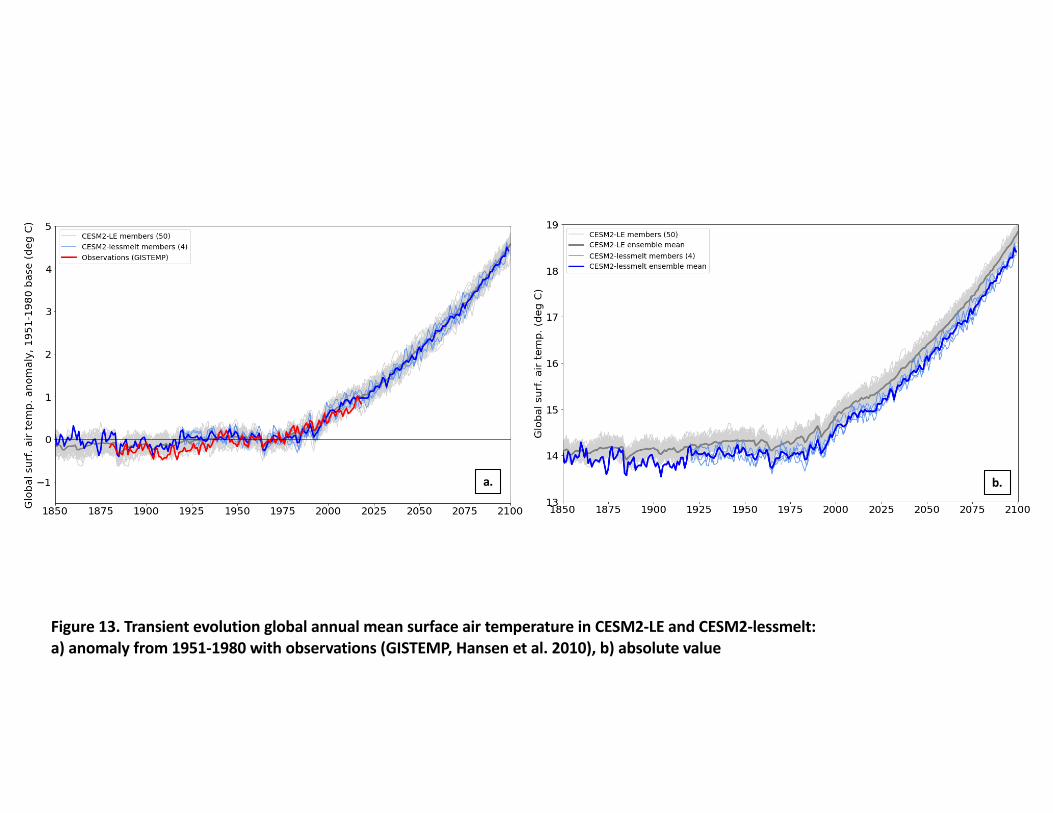
Figure 13. Transient evolution global annual mean surface air temperature in CESM2-LE and CESM2-lessmelt: a) anomaly from 1951-1980 with observations (GISTEMP, Hansen et al. 2010), b) absolute value
b.a.

Figure 14. Ensemble mean surface temperature increase (2080-2099 minus 1920-1939) by season. Top row shows CESM2-lessmelt. Bottom row shows difference (CESM2-lessmelt minus CESM2-LE). Stippling indicates where differences between CESM2-lessmelt and CESM2-LE ensemble means are *not* statistically significant.
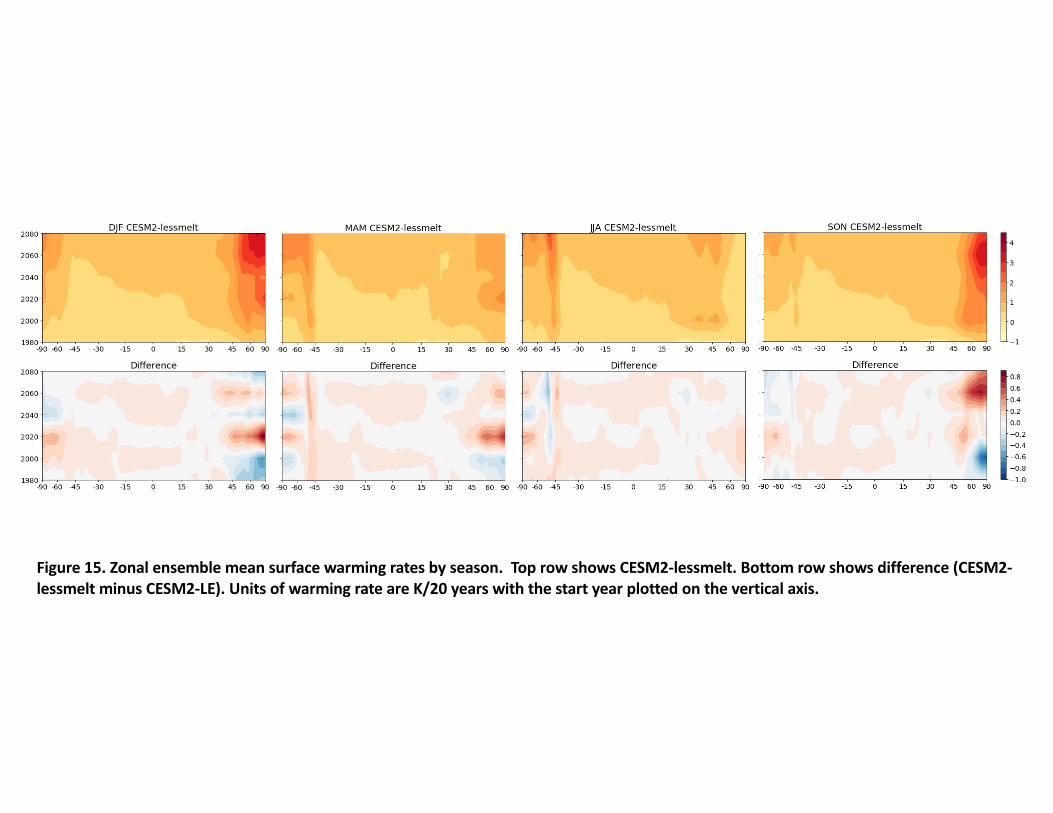
Figure 15. Zonal ensemble mean surface warming rates by season. Top row shows CESM2-lessmelt. Bottom row shows difference (CESM2-lessmelt minus CESM2-LE). Units of warming rate are K/20 years with the start year plotted on the vertical axis.

1
Journal of Advances in Modeling Earth Systems
Supporting Information for
Less surface sea ice melt in the CESM2 improves Arctic sea ice simulation with minimal non-polar climate impacts
Jennifer E. Kay1,2, Patricia DeRepentigny1,3, Marika M. Holland4, David A. Bailey4, Alice DuVivier4, Ed Blanchard-Wrigglesworth5, Clara Deser4, Alexandra Jahn1,3, Hansi Singh6, Madison M. Smith5, Melinda A. Webster7, Jim Edwards4, Sun-Seon Lee8,9, Keith B. Rodgers8,9, and Nan Rosenbloom4
1Department of Atmospheric and Oceanic Sciences, University of Colorado, Boulder, CO, 2Cooperative Institute for Research in Environmental Science, University of Colorado, Boulder, CO, 3Institute of Arctic and Alpine Research,
University of Colorado, Boulder, CO, 4National Center for Atmospheric Research, Boulder, CO, 5University of Washington, Seattle, WA 6University of Victoria, British Columbia, Canada 7University of Alaska Fairbanks, AK 8Center for Climate Physics, Institute for Basic Science, Busan, South Korea, 9Pusan National University, Busan, South Korea
Contents of this file
Text S1 Figures S1 to S10
Introduction
The supporting information for this paper includes justification for the “equal likely” assumption (Text S1, Figures S1-S5) and figures that are useful for reference but not essential for the main text (Figures S6-S10).

2
Text S1. Equally likely assumption and initial condition memory We make an “equally likely” assumption for all ensemble members analyzed in this work. In other words, we assume each ensemble member provides an equally likely estimate of transient climate evolution in the late 20th and 21st century with no memory of the initial condition. While atmospheric initial condition memory is limited to weeks, the timescale over which ocean initial conditions can influence climate is not well known. Indeed, memory associated with the ocean can persist on decadal and longer timescales (e.g., Yeager et al. 2015, Latif et al. 2013). Unlike the CESM2-tunedice ensemble members, the CESM2-LE ensemble members used in this study do not all share the same ocean initial condition. Thus, ocean initial condition memory may invalidate our “equally likely” assumption for the CESM2-LE. As described in Rodgers et al. (2021), CESM2-LE initial conditions were selected to generate spread in the ocean initial conditions. Members 1-10 and 91-100 (“macro”) were started every 10 years starting at year 1001 of the PI control and thus all have differing ocean initial conditions. In contrast, the rest of the members are split into mini ensembles of 20 members that share the same ocean initial conditions. The initial condition for each mini ensemble was selected to maximize differences in the Atlantic Meridional Overturning Circulation (AMOC) states: “micro1231” started at year 1231, “micro1251” started at year 1251, “micro1281” started at year 1281, and “micro1301” started at year 1301. Within each 20-member micro ensemble, the ensemble member initial conditions differ only in their atmospheric temperature at the round-off level. The first 50 members do not share late 20th century forcing with the last 50 members or with CESM2-tunedice. As a result, analysis in the main text only uses members 1-50 of CESM2-LE. That said, we use all CESM2-LE members here because their forcing is the same over the time period when initial condition memory is lost.
The four variables primarily analyzed in this work (global mean surface air temperature, Arctic mean surface air temperature, Arctic sea ice extent, and Arctic sea ice volume) differ in their ensemble spread and variability. Over the first month of the ensemble (January 1850), global and Arctic surface air temperatures rapidly diverge and visually retain little initial condition memory (Figure S1). In contrast, Arctic sea ice extent and volume remain visually similar for ensemble members with shared ocean initial conditions. Thus, Arctic sea ice volume and extent retain more memory of the ocean initial condition during the first month of the ensemble than surface air temperatures do. Consistent with previous work (Holland et al. 2011, Blanchard-Wrigglesworth et al. 2011), Arctic sea ice volume has more memory than Arctic sea ice extent. By January of year 15, Arctic sea ice differences related to ocean initial condition were harder to identify indicating substantial initial condition memory loss.
We next quantify initial condition memory loss for the four variables primarily analyzed in
this work. To do so, we compare pre-industrial control statistics calculated over time to transient statistics calculated across ensemble member in each mini CESM2-LE ensemble. To generate the pre-industrial control statistics, we calculate 95% confidence intervals from a distribution of sample means and standard deviations found by bootstrapping 10,000 times with N=10 from the CESM2 pre-industrial control (years 1000-1200). In other words, we randomly select 10 daily values from the CESM2 pre-industrial control run 10,000 times generating a distribution from which 95% confidence intervals are calculated. We assume initial condition memory is lost when statistics calculated using the spread across ensemble members lies within the pre-industrial distribution. This method requires us to assume forced climate change is small in the first decades
3
of the CESM2-LE, i.e., starting from 1850 onward. In addition to this first method, we also compare ensemble statistics from each micro to the ensemble statistics of macro using a t-test for the mean and an f-test for the variance. This second method requires us to assume that the variables are normally distributed and relies on comparing two relatively small (N=20) samples. As the results are similar for both methods, we only show results from the first method.
After 20 years, the CESM-LE has lost almost all initial condition memory for the four variables
we examined: global surface air temperature, Arctic surface air temperature, Arctic sea ice extent, and Arctic sea ice volume. The longest initial condition memory comes from the micro1301 ensemble, which has sea ice volume and winter sea ice extent that are statistically larger than the pre-industrial control (Figure S2, Figure S3). Arctic surface air temperatures and global air temperatures offer little evidence for persistent initial condition memory (Figure S4, Figure S5).
In summary, the equally likely assumption is appropriate in the late 20th and early 21 centuries. Thus, we compare the CESM2-LE members with the CESM2-tunedice members without considering ocean initial condition memory.

4
Figure S1. Daily values over the first month (left) and the first month of the 15th year (right) of the CESM2-LE for Arctic sea ice extent, Arctic sea ice volume, Global surface air temperature, Arctic surface air temperature. All 100 members of the CESM2-LE are shown.

5
Figure S2. Timeseries of Arctic sea ice volume ensemble mean (top) and standard deviation (bottom) over the first 20 years of the CESM2 large ensemble. Grey shading shows 95% probability of occurrence from bootstrapping the CESM2 pre-industrial control. For the ensemble mean, lines are only plotted when values are statistically different from the pre-industrial control run at the 95% confidence level. For the ensemble standard deviation, thick lines are plotted when values are statistically different from the pre-industrial control run at the 95% confidence level. All 100 members of the CESM2-LE are shown.

6
Figure S3. As in Figure S2, but for Arctic sea ice extent.

7
Figure S4. As in Figure S2, but for Arctic surface air temperature.

8
Figure S5. As in Figure S2, but for Global Surface Air Temperature (SAT).

9
Figure S6. Insignificant differences in variability by season in the 1850 pre-industrial control runs for CESM2 and CESM2-lessmelt: Surface Temperature (K, top row), total precipitation (mm/day, middle row), and sea level pressure (mb, bottom row). All CESM diagnostics for pre-industrial control are here: http://webext.cgd.ucar.edu/B1850cmip6/b.e21.B1850.f09_g17.CMIP6-piControl.001_branch2/, including climate indices in the Climate Variability Diagnostics Package (Phillips et al 2020).

10
Figure S7. Antarctic present-day (1979-2014) ensemble time mean seasonal cycle in CESM2-LE (members 1-50) and CESM2-tunedice (members 1-4): Sea ice volume (top), Sea ice extent (middle), Sea ice area (bottom). Observations are from NSIDC sea ice index (Fetterer et al. 2017).
11
Figure S8. Antarctic sea ice time series comparing CESM2-LE (members 1-50), CESM2-tunedice (members 1-4), and observations in February (top) and September (bottom).

12
Figure S9. Standard deviation in September sea ice extent in CESM2-LE (members 1-50) and CESM2-tunedice. Grey shading shows 95% confidence intervals on variability calculated by bootstrapping CESM2-LE with 4 members 1,000 times.
Figure S10. Difference (CESM2-tunedice minus CESM2-LE) in ensemble mean transient climate response (2080-2099 minus 1920-1939) by season: total precipitation (dPRECT, mm/day, top) and sea level pressure (dPSL, mb, bottom). Shading indicates difference is NOT statistically significant at the 95% level. The first 50 members of the CESM2-LE are plotted.