nonaqueous-phase-liquid dissolution in variable …fluidflowvisualization.sandia.gov/pdf_text/peer...
TRANSCRIPT
Nonaqueous-phase-liquid dissolution in variable-aperturefractures: Development of a depth-averaged computationalmodel with comparison to a physical experiment
Russell L. Detwiler1 and Harihar RajaramDepartment of Civil, Environmental, and Architectural Engineering, University of ColoradoBoulder, Colorado, USA
Robert J. GlassFlow Visualization and Processes Laboratory, Sandia National Laboratories, Albuquerque, New Mexico, USA
Abstract. Dissolution of nonaqueous-phase liquids (NAPLs) from variable-aperturefractures couples fluid flow, transport of the dissolved NAPL, interphase mass transfer,and the corresponding NAPL-water-interface movement. Each of these fundamentalprocesses is controlled by fracture-aperture variability and entrapped-NAPL geometry. Wedevelop a depth-averaged computational model of dissolution that incorporates thefundamental processes that control dissolution at spatial resolutions that include all scalesof variability within the flow field. Thus this model does not require empirical descriptionsof local mass transfer rates. Furthermore, the depth-averaged approach allows us tosimulate dissolution at scales that are larger than the scale of the largest entrapped NAPLblobs. We compare simulation results with an experiment in which we dissolved residualentrapped trichloroethylene (TCE) from a 15.4 � 30.3 cm, analog, variable-aperturefracture. We measured both fracture aperture and the TCE distribution within thefracture at high spatial resolution using light transmission techniques. Digital imagesacquired over the duration of the experiment recorded the evolution of the TCEdistribution within the fracture and are directly compared with the results of acomputational simulation. The evolution with time of the distribution of the entrappedTCE and the total TCE saturation are both predicted well by the dissolution model. Theseresults suggest that detailed parametric studies, employing the depth-averaged dissolutionmodel, can be used to develop a comprehensive understanding of NAPL dissolution interms of parameters characterizing aperture variability, phase structure, and hydrodynamicconditions.
1. Introduction
Nonaqueous-phase liquids (NAPLs) released to the subsur-face can dissolve into groundwater, creating a potential long-term contamination source. Predicting the magnitude and du-ration of contamination caused by an entrapped NAPL sourcerequires locating and quantifying the source and subsequentlyunderstanding the mechanisms that control dissolution rates.Predicting NAPL dissolution rates in porous and fracturedmedia requires a fundamental understanding of the morphol-ogy of the entrapped NAPL, fluid flow and dissolved NAPLtransport around blobs of entrapped NAPL, and mass transferacross NAPL-water interfaces. A number of researchers havestudied NAPL dissolution in porous media using column-scaleexperiments. These studies typically result in empirical expres-sions that relate a mass transfer coefficient (representing therate of NAPL dissolution at the scale of the experiment) tovariables such as the Peclet number (Pe � advective/diffusive
transport) and the NAPL saturation (SN) [e.g., Miller et al.,1990; Powers et al., 1992; Imhoff et al., 1994; Powers et al., 1994].Such efforts have led to significant insights into the factorscontrolling dissolution in the specific experimental systems anddemonstrate the influence of relevant parameters, such as Peand SN, on the empirical expressions. However, because theseexpressions cannot incorporate the details of the pore geom-etry and entrapped-NAPL structure, they do not lead to gen-eral relationships applicable over a wide range of porous me-dium properties.
Development of a general understanding of the dynamics ofNAPL dissolution requires pore-scale investigations that ex-plicitly include the role of pore geometry and entrapped-NAPL structure on small-scale hydrodynamics (i.e., flow, masstransport, and mass transfer). Such approaches may lead to aframework for predicting dissolution rates in arbitrary porousmedia, as a function of porous medium geometry and hydro-dynamic processes. Kennedy and Lennox [1997], Jia et al.[1999], and Dillard and Blunt [2000] have recently reportedsuch investigations. In a porous medium consisting of a singlelayer of glass beads, Kennedy and Lennox [1997] measured thedissolution of individual NAPL blobs in the form of spheresand pendular rings. They inferred mass transfer coefficients forindividual NAPL blobs, assuming zero concentrations in thesurrounding water and local equilibrium dissolution at the
1Now at Division of Geophysics and Global Security, LawrenceLivermore National Laboratory, Livermore, California, USA.
Copyright 2001 by the American Geophysical Union.
Paper number 2000WR000161.0043-1397/01/2000WR000161$09.00
WATER RESOURCES RESEARCH, VOL. 37, NO. 12, PAGES 3115–3129, DECEMBER 2001
3115

water-NAPL interface. They hypothesized that variability inthe measured dissolution rates for individual NAPL blobs wasdue to variability in the pore velocities around each blobcaused by differing pore geometries. Jia et al. [1999] conducteddissolution experiments in a two-dimensional pore networketched in glass and measured the concentration of dissolvedNAPL in the outflow from their experiment. This approachallowed them to directly observe the geometry of NAPL blobsover the entire network. Pore-network dissolution simulations,based on experimentally measured phase distributions, dem-onstrated the need to incorporate the influence of advectionon local mass transfer rates. By using an empirical expressionto calculate local mass transfer coefficients, they obtained goodagreement between simulations and experiments. Dillard andBlunt [2000] developed a three-dimensional pore-networkmodel of NAPL dissolution and compared their model predic-tions with the experimental results of Powers et al. [1992]. Toobtain reasonable agreement between the experimental resultsand simulations, they coupled a local equilibrium condition atthe NAPL-water interfaces with a simplified conceptual modelof diffusion into a corner [Zhou et al., 2000] to model masstransfer into the flowing water. The results of these previousstudies highlight the importance of either accurately simulatingthe velocity near the NAPL-water interfaces or choosing anappropriate empirical or conceptual model of local interphasemass transfer.
NAPL migration into fractured media has been reported[e.g., Schwartz et al., 1982; Mackay and Cherry, 1989]; however,relatively few studies have focused on the physical processescontrolling NAPL dissolution in fractures. As in porous media,NAPL dissolution in fractures will be controlled by flow andtransport around the entrapped NAPL, which is directly re-lated to the entrapped phase structure and pore geometry (orfracture aperture). Entrapped-NAPL blobs in fractures canexhibit a wider range of size and complexity than in porousmedia. Several researchers have demonstrated that for well-sorted sands, NAPL blobs are mostly “singlets” (i.e., they oc-cupy a single pore body) [e.g., Larson et al., 1981; Conrad et al.,1992]. Subsequent investigations observed that the range ofNAPL blob sizes increases with grain-size variability [Mayerand Miller, 1992; Powers et al., 1992] and Bond number (Bn �buoyancy/capillary forces) [Mayer and Miller, 1992]. In frac-tures, Bn depends not only on the difference in densities be-tween NAPL and water, but also on the orientation of thefracture plane. Thus, for a single NAPL-water pair, a widerange of entrapped phase structures is possible depending onthe fracture orientation. In a horizontal fracture (i.e., Bn �0), typical “lengths” of blobs may be 2–3 orders of magnitudelarger than the correlation scale (�) of the aperture field [e.g.,Glass et al., 1998, 2000]. Glass and Nicholl [1995] observed thatduring dissolution, locations of fast interface movement do notnecessarily coincide with locations of high mass transfer rates.The implication is that blob shrinkage is controlled by capillaryforces. Glass et al. [1998, 2000] demonstrated that the interfacemovements resulting from dissolution of a single blob of non-aqueous phase could be simulated using a modified invasionpercolation (MIP) algorithm. Thus, to effectively simulate theshrinkage of an individual NAPL blob, dissolution modelsshould couple mass transfer, across the entire NAPL-waterinterface, to capillary physics along the interface. Such a cou-pling has not been represented in previous pore-scale dissolu-tion models.
In this paper we present a computational model of en-
trapped NAPL dissolution in variable-aperture fractures thatexplicitly incorporates the small-scale geometry of individualNAPL blobs. The model couples depth-averaged models offlow, dissolved-NAPL transport, and interphase mass transferto determine mass transfer rates from each individual NAPLblob. The resulting interface movement is calculated using theMIP algorithm [Glass et al., 1998, 2000]. A direct comparisonof a computational simulation to a physical experiment dem-onstrated that the simulation predicted both the fracture-scalemass transfer rate and the evolution of NAPL distributionwithin the fracture very well. This is especially encouragingbecause the computational model explicitly incorporates thefundamental processes controlling dissolution and thus doesnot rely on empirical parameters to describe the interphasemass transfer process. These positive results suggest that thedepth-averaged approach can be used effectively to develop acomprehensive understanding of the role of different param-eters, such as phase structure, aperture variability, and Pe , onNAPL dissolution from variable-aperture fractures.
2. Model DevelopmentThe process of depth averaging the three-dimensional equa-
tions governing flow and transport in a variable-aperture frac-ture requires simplifying assumptions. To understand the im-plications of depth averaging for modeling dissolution, it isinstructive to first consider the three-dimensional descriptionof dissolution. Figure 1, a schematic of the flow field in avariable-aperture fracture occupied by residual entrappedNAPL, shows the three-dimensional void space in the fracture.A fully descriptive mathematical model of the dissolution ofthe entrapped NAPL from this void space will effectively cou-ple fluid flow, mass transport through the flowing phase, masstransfer from the entrapped phase into the flowing phase, and
Figure 1. (a) Plan view and (b) cross section of the three-dimensional flow field in a variable-aperture fracture contain-ing regions of entrapped nonaqueous-phase liquid (NAPL).
DETWILER ET AL.: NONAQUEOUS-PHASE-LIQUID DISSOLUTION3116

interface movement induced by the shrinking entrapped phase.Note that we assume that the solubility of water in NAPL isnegligible. In some fracture systems, interaction with the rockmatrix will also play a significant role in NAPL dissolution;however, we limit this investigation to fractures in an imper-meable, nonporous rock matrix.
This section summarizes the three-dimensional equationsdescribing fluid flow (section 2.1), mass transport (section 2.2),and mass transfer and interface movement (section 2.3), fol-lowed by presentation of a scaling argument for reducing theseequations to quasi steady state equations (section 2.4) and adiscussion of the implications of depth averaging (section 2.5).
2.1. Fluid Flow
Slow (i.e., low Reynolds number), three-dimensional, un-steady fluid flow through a variable-aperture fracture is de-scribed by the Stokes equations:
�u�t � ��p � ��2u (1a)
�u�t � ��p � ��2u (1b)
� � u � 0 (2a)
� � u � 0, (2b)
where (1a) and (2a) describe flow in the water and (1b) and(2b) describe flow within the entrapped-NAPL blobs. In (1a)and (2a), u, p , and � are the velocity vector, the dynamicpressure, and the viscosity, respectively; in (1b) and (2b) thecorresponding variables for the NAPL are denoted by a cir-cumflex. Assumptions inherent in this representation of theStokes equations are that both fluids are incompressible withconstant viscosities. The time-derivative terms in (1a) and (1b)result from interface movement as the NAPL blobs dissolve.Equations (1) and (2) describe flow both in the freely flowingaqueous phase and inside the entrapped nonaqueous phase;momentum transfer across the interface drives flow in theentrapped phase. The location of the NAPL-water interfaces(Sm(t), where m denotes the mth blob) at any time t , aredescribed by some function Fm(x, t) such that Fm(x, t) � 0on Sm(t) (Figure 1). Solving (1) and (2) requires the followingboundary conditions on the NAPL-water interfaces [e.g., Leal,1992, pp. 199–205]:
Continuity of velocity
u � u on Sm�t� . (3)
Kinematic condition on the interface
DFm�x , t�Dt �
1��Fm�
�Fm
�t � u � n �1
��Fm��Fm
�t � u � n
� 0 on Sm�t� , (4)
where n is the unit vector normal to the NAPL-water interface.This condition requires that in both fluids, the component ofthe fluid velocity normal to the interface is equal to the cor-responding velocity of the interface.
Dynamic stress conditions at the interface, including the nor-mal stress balance
� p � p� � ���� � �� � n� � n� � ��� � n� � 0 on Sm�t� . (5)
Tangential stress balance
��� � �� � n� � t l � ���� � t l � 0 on Sm�t� , (6)
where � is the shear stress tensor in each fluid at the interface,tl (l � 1, 2) are two orthogonal unit tangent vectors that arenormal to n, and � is the interfacial tension. The second termin (5) is the sum of the normal components of the differentialstress tensor. In the absence of fluid velocity (or for very lowfluid velocities, i.e., � � � � 0), equation (5) becomes theYoung-Laplace equation, which relates capillary pressure tothe interfacial tension and interfacial curvature (� � n). If � isconstant along the interface, the second term in (6) reduces tozero and (6) requires that the tangential components of theshear stress tensors on either side of the interface must beequal. Variations in � over the interface can result when mol-ecules adsorb to an interface at varying concentrations. Thiscan induce fluid flows near the interface that are commonlyreferred to as Marangoni convection [e.g., Leal, 1992]. In casesof extreme � gradients along NAPL-water interfaces, such asduring surfactant enhanced mobilization, the large reductionin � at the upstream end of each NAPL blob can cause blobsto mobilize in the direction opposite to the mean flow direction[Zhong et al., 2001] (hereinafter referred to as ZMG).
Boundary conditions for the fluid flow equations must alsobe specified on the domain boundaries. These are the no-slipcondition (u � 0 and u � 0) on the two fracture surfaces andsome problem-specific boundary conditions surrounding thedomain in the fracture plane.
2.2. Mass Transport
Three-dimensional, unsteady transport of the dissolved com-ponent of NAPL in the flowing water is described by thefamiliar advection-diffusion equation:
�c�t � � � �uc� � � � �DM � �c� , (7)
where DM is the molecular diffusion coefficient of NAPL dis-solved in water (assumed scalar) and c is the local aqueous-phase mass concentration of NAPL in water. The dissolvedNAPL concentration at the NAPL-water interfaces is assumedto be at the solubility limit (cs), resulting in constant concen-tration boundary conditions along each NAPL-water interface:
c � cs on Sm�t� . (8)
In addition to (8), problem-specific boundary conditions mustbe applied at the domain boundaries, including the upstreamconcentration of dissolved NAPL, co. Because we are assum-ing a single-component NAPL and neglecting dissolution ofwater in the NAPL, there is no need to describe transportwithin the entrapped NAPL.
2.3. Mass Transfer and Interface Movement
The boundary condition specified by (8) results in local massflux ( j) described by
j � DM�c � n on Sm�t� . (9)
The total rate of mass transfer from the mth NAPL blob ( Jm)at any time is then given by
3117DETWILER ET AL.: NONAQUEOUS-PHASE-LIQUID DISSOLUTION

Jm � �Sm
j da � �ddt �Vm� , (10)
where da is an elemental area of the interfacial surface (Sm),� is the density of the entrapped NAPL, and Vm is the volumeof the blob. As the volume of the blob decreases, the interfacebetween the two fluids must recede while satisfying (3), (4),(5), and (6).
The NAPL-water interface moves as mass is transferredfrom each NAPL blob to the flowing aqueous phase and mustsatisfy (5). If viscous forces are negligible compared with cap-illary forces, interface movement is completely controlled bycapillary forces. It is reasonable to expect that the ratio ofviscous forces to capillary forces (the capillary number, Ca)will be small in fractures with slow flow velocities and smallapertures [e.g., Glass et al., 1998, 2000]. Thus (5) simplifies to
Pc � ���� � n� , (11)
where Pc � p � p is the local capillary pressure and � � nrepresents the interfacial curvature.
2.4. Quasi Steady State Approximation
An intuitive expectation that the changes in geometry asso-ciated with dissolving NAPL blobs are much slower than therates of transport of the dissolved NAPL in the aqueous phasemotivates the development of a quasi steady state approxima-tion for flow and transport. In this section we present a rigor-ous derivation of the quasi steady state approximation follow-ing the procedure of Ortoleva et al. [1987]. The critical step inthis derivation is the introduction of a small parameter �(cs � co)/� , which, for trichloroethylene (TCE) dissolvinginto clean water (co � 0, cs � 1280 mg/L, and � � 1.465g/cm3), has a value of 8.7 � 10�4. It is evident from (10) thatthe rate of change of volume of an individual blob, Jm/� , scalesas (cs � co)/� , because Jm will scale with (cs � co). This, andthe expectation that blob volumes change relatively slowly,prompts the introduction of a new time variable:
T � t . (12)
Changes in the entrapped-phase geometry occur at timescalesof order t , and changes in the pressure and concentration fieldsoccur at timescales of order T . Equations (1), (4), (7), and (10)can be rewritten in terms of T and the dimensionless concen-tration, � (c � co)/(cs � co):
�u�T � ��p � ��2u (13)
��F ��F�T � u � n � 0 (14)
�
�T � � � �u� � Dm�2 (15)
d
dT �Vm� � �S
DM� � n da . (16)
If we now consider 3 0, both flow and transport can berepresented by a sequence of quasi steady state solutions cor-responding to the current entrapped-phase geometry. Addi-tionally, for each quasi steady state time step, the kinematicinterface condition (14) reduces to a condition of zero normal
velocity at the NAPL-water interface. Equations analogous to(13) and (14) can be written for the NAPL also. However, asdiscussed previously, because we have assumed that the solu-bility of water in NAPL is negligible and that the NAPL con-sists of a single component, there is no need to solve for flowand transport within the NAPL blobs.
2.5. Depth-Averaged Equations
The equations discussed in the previous sections fully de-scribe flow, transport, and dissolution in the two-phase systemshown in Figure 1. To allow numerical implementation ofthese equations at reasonably large scales (106–107 gridpoints), we depth average the three-dimensional equations,resulting in a set of two-dimensional equations that retain thecoupling between flow, transport, interfacial mass transfer, andinterface movement. Depth-averaged models have been usedwidely for both flow [e.g., Tsang and Witherspoon, 1981; Brown,1987; Gelhar, 1987] and transport [e.g., Gelhar, 1987; Moreno etal., 1988; Thompson, 1991] through variable-aperture frac-tures. In this section we describe the two-dimensional govern-ing equations that result from depth averaging and discuss theimplications of the implicit assumptions.
Averaging the three-dimensional quasi steady Stokes equa-tions (2a) and (13) across the fracture aperture results in � �(bv) � 0, where the depth-averaged velocity, v � b2g/12��h ,which when combined yield the well-known, two-dimensionalReynolds equation:
� � � b3g12�
�h� � 0, (17)
where h � p/(�g) is the local pressure head in a horizontalfracture and b is the local aperture. The assumptions requiredin developing (17) are that pressure is constant across thefracture aperture (i.e., �p/� z � 0) and that the aperture variesslowly in space. These conditions are met if b/� and �b/bare small, where b is the mean fracture aperture and � and�b are the correlation length and standard deviation of aper-ture variability, respectively [e.g., Zimmerman and Bodvarsson,1996; Nicholl et al., 1999]. Note that h is a potential functionfor velocity so that (17) essentially represents a two-dimensional inviscid flow, and for the flow geometry shown inFigure 1, the only boundary condition that can be meaningfullyimposed on the flowing phase at the fluid-fluid interfaces is
�h � n � 0. (18)
Thus, in addition to reducing the computational expense ofcalculating the flow field, the simplification to two dimensionsprecludes incorporating momentum transfer across the NAPL-water interfaces as described by (5) and (6).
Recent comparisons of flow experiments in measured aper-ture fields with numerical simulations based on the Reynoldsequation indicate that the Reynolds equation overestimatesflow in some variable-aperture fractures [Yeo et al., 1998; Ni-choll et al., 1999]. However, Adler and Thovert [1999] suggestthat these discrepancies may be small in many natural frac-tures. Similar comparisons in partially saturated fractures [Ni-choll et al., 2000] have demonstrated good agreement betweenexperimentally measured and simulated relative permeabilities(krw � partially saturated permeability/saturated permeabili-ty). This indicates that an entrapped nonaqueous phase doesnot contribute significantly to errors in fracture-scale flow es-timates.
DETWILER ET AL.: NONAQUEOUS-PHASE-LIQUID DISSOLUTION3118

Depth averaging (15) results in the quasi steady, two-dimensional equation for mass transport through a variable-aperture fracture:
� � �bvC� � � � �bDeff � �C� , (19)
where Deff is the effective dispersion tensor, C represents theaverage of the three-dimensional concentration (c) across thefracture aperture, and the depth-averaged boundary conditionon the NAPL-water interfaces is C � Cs. In general, Deff willbe different from Dm due to depth averaging (15). Velocityprofiles across the fracture aperture cause increased dispersionin the flow direction (Taylor dispersion), which must be cap-tured by an effective dispersion coefficient.
Though we are solving a two-dimensional approximation tothe governing equations, it is critical that the curvature of theinterface across the aperture be included in the formulation of(11) because it may contribute more to the pressure dropacross the interface than the in-plane curvature. In a fracture,� � n can be quantified in terms of the two principal radii ofcurvature, r1 and r2, as 1/r1 � 1/r2, where r1 is the radius ofcurvature across the aperture and r2 is the radius of curvaturein the plane of the fracture (Figures 2 and 3). Glass et al. [1998,2000] demonstrated that an MIP algorithm that includes bothr1 and r2 describes the interface recession during dissolution ofan individual blob. However, it must be coupled with the pre-viously described flow, transport, and mass transfer algorithmsto estimate the dissolution rate for individual blobs and simul-taneously model the dissolution of multiple blobs.
3. Computational AlgorithmOur depth-averaged computational model of NAPL disso-
lution is based on coupling the two-dimensional equations forflow, transport, and mass transfer with the MIP algorithm formodeling interface movement. In this section we describe thedetails of the computational dissolution algorithm, which con-sists of the following steps:
1. Locate each discrete NAPL blob and identify each witha unique integer.
2. Solve for the quasi steady state pressure field for thegiven phase distribution using the Reynolds equation (17) withthe appropriate boundary conditions (18).
3. Calculate local velocities using the pressure and aper-ture fields and solve for the quasi steady concentration fieldusing the depth-averaged transport equation (19) with equilib-rium boundary conditions (C � Cs) on NAPL-water inter-faces.
4. Calculate mass transfer rates from each discrete NAPLblob by numerically integrating local mass transfer ratesaround the perimeter of each blob.
5. Calculate the amount of mass removed from each blobduring the current time step.
6. Change the phase state (i.e., from NAPL to water) ofindividual grid blocks in each blob in the order specified by theMIP algorithm until the appropriate mass is removed for thecurrent time step.
7. Return to step 1 and iterate until all NAPL is removedfrom the fracture.
The computational model numerically approximates theflow field using a centered finite difference approximation of(17) and solves the resulting system of equations using anefficient algebraic multigrid algorithm (AMG) developed byRuge and Stuben [1987]. To solve for C in the fracture during
Figure 2. Schematic demonstrating critical angles for calcu-lating local corrections to interfacial area due to curvature(with radius r1) across the fracture aperture. Here � is thecontact angle and is the convergence/divergence angle of thefracture surfaces. The curvature described by r1 influencesboth the interfacial area and the local capillary pressures. Theactual interfacial length across the aperture is equal to�1bi�1/ 2.
Figure 3. Schematic demonstrating the in-plane radius ofcurvature (r2) and corrections to interfacial area (Figure 3a)due to misrepresentation of the curved interfaces by the finitedifference discretization. For interface geometries conformingto Figure 3b or 3c, the length of the highlighted grid-blockfaces are multiplied by �2 � �2/2 or �2/3, respectively.
3119DETWILER ET AL.: NONAQUEOUS-PHASE-LIQUID DISSOLUTION

each time step, the model discretizes (19) using an upstream-difference approximation to the advective term and a cen-tered-difference approximation to the diffusive term andsolves the resulting system of equations using the AMG algo-rithm. Note that in locations with steep concentration gradi-ents and high flow velocities (i.e., near NAPL-water interfac-es), this discretization scheme results in numerical dispersionin the local flow direction. Because the numerical dispersioncoefficient is proportional to v x , we use a grid-refinementstudy to evaluate the influence of numerical dispersion ondissolution simulations in section 5.
As discussed in section 2.5, implementation of (19) requiresa depth-averaged dispersion tensor, Deff. For fully developedTaylor dispersion in Poiseuille flow between parallel plates,Deff � Dm � V2b2/ 210Dm, where V is the depth-averagedvelocity vector. Detwiler et al. [2000] showed that the effectiveTaylor dispersion coefficient at large solute displacements in avariable-aperture fracture has a similar form, with V replacedby the mean solute velocity and b replaced by the mean aper-ture. However, depending on the scale of the grid blocks usedto discretize the flow domain, Taylor dispersion may not be-come fully developed within individual grid blocks, and thusthe appropriate value for Deff will fall between Dm andDm(1 � Pe2/ 210), where Pe � Vb/Dm (based on local gridblock values of V and b). We investigate the sensitivity of masstransfer rates to the value of Deff by simulating dissolutionusing these two extreme estimates of Deff in section 5.
For each quasi steady state time step, the code performsAMG cycles on the matrices resulting from the discretizationof the flow and transport equations until the 2-norm of theresidual vector falls below a problem-specific small value. Con-vergence of the solver is then checked by calculating flux bal-ance errors for water and NAPL. Water flux balance error iscalculated as (inflow � outflow)/outflow, and the NAPL fluxbalance error is calculated as (mass flux at outflow � total massflux from all NAPL blobs)/(mass flux at outflow). For thesimulation discussed in detail in section 5, the flux balanceerrors were less than 8.3 � 10�10 and 1.2 � 10�7 for water andNAPL, respectively, indicating excellent mass conservation.
By specifying a constant concentration boundary condition(C � Cs) along each NAPL-water interface, we simulate localequilibrium mass transfer. After solving the quasi steady statetransport equation (19) over the domain, the mass transfer ratefrom each NAPL blob must be calculated. The model calcu-lates the mass flux across each grid-block face that lies on aNAPL-water interface using the discrete expression corre-sponding to (9):
j int � ADM�Cs � Ci�/� x/ 2� , (20)
where j int is the mass flux across the local interface with area A ,Cs is the equilibrium concentration assigned to the interface,Ci is the computed concentration of the cell adjacent to theinterface, and x/ 2 is the distance between the center of celli and the interface. The total rate of mass transfer from eachNAPL blob is calculated by numerically integrating j int overthe entire interfacial area.
Using (20) to describe mass flux across NAPL-water inter-faces requires estimating the interfacial area, A . We estimateA as
A � � xbi�1/ 2, (21)
where bi�1/ 2 is the mean of the grid-block apertures on eitherside of the interface and � is a correction factor that accounts
for local interfacial curvature. Here � is the product of �1, acorrection factor for underestimation of the interface lengthacross the aperture (Figure 2), and �2, a correction factor foroverestimation of the interface length in the fracture plane(Figure 3).
Using the geometry described by Figure 2, �1 is given by
�1 ��/ 2 � � �
cos �� � �, (22)
where
� tan�1 � bi�1 � bi
2 x � . (23)
In (22), � is the water-NAPL-solid contact angle and is theangle of the fracture surface with respect to the fracture centerplane. The angle , given by (23), is a well-defined function ofthe aperture field. As long as the NAPL is the nonwetting fluid, will always be positive. Thus the limiting range of �1 is from1 (� � �/2 and � 0, resulting in a flat interface) to �/2 (� �0 and � 0, resulting in a semicircular interface). For othersystem-specific values of � and , �1 will modify the interfaciallength by a factor between 1 and �/2.
Imposing the finite difference grid onto the curved NAPL-water interfaces results in overestimations of the local interfa-cial length in the fracture plane. We define the correctionfactor for curvature in the fracture plane, �2, by assuming thatthe actual interface is more closely approximated by the ge-ometry shown in Figure 3b and 3c. On the basis of this geom-etry, �2 reduces the length of each of the highlighted interfacesin Figures 3b and 3c by a factor of �2/2 and �2/3, respectively.
The MIP algorithm calculates the global order in whichNAPL-filled grid blocks are replaced by water as each blobdissolves. For each MIP iteration, Pc is calculated for eachNAPL-filled grid block lying on an interface. The TCE-water-glass contact angle � is used, along with the local aperture, tocalculate r1, and � is used to determine a grid-independentlength of interface that is included in local calculations of r2.The values of Pc over the entire field are sorted, and the cellwith the lowest value is replaced by water. This process isrepeated until all NAPL has been replaced by water (for fullMIP implementation details, see Glass et al. [1998, 2000]). TheMIP algorithm yields a field in which each initially NAPL-filledcell is labeled with a unique integer that corresponds to theorder in which it becomes water-filled. Coupling this globaldissolution order with local mass transfer rates requires iden-tifying each discrete NAPL blob and converting the valuescorresponding to the global dissolution order to a local orderfor each individual blob. This process is repeated at the begin-ning of each time step to properly account for blobs that havesplit in the previous time step.
In each time step, for each NAPL blob, the dissolutionalgorithm removes an amount of mass equal to the local masstransfer rate multiplied by the time step duration. Individualcells are filled corresponding to the local invasion order untilthe required mass has been removed. Typically, the final gridblock to be filled will contain more mass than is needed tocomplete the time step, and thus the mass of NAPL in that gridblock is reduced, and it is the first grid block to be filled withwater during the next time step. Each flow and transport sim-ulation considers partially dissolved grid blocks to be NAPL-filled. Results of simulations using different values of t (dis-cussed in section 5) suggest that this simplification has anegligible influence on the results of dissolution simulations.
DETWILER ET AL.: NONAQUEOUS-PHASE-LIQUID DISSOLUTION3120
The duration of each quasi steady time step must be shortenough that entrapped-phase geometry does not change sig-nificantly from one time step to the next. We can verify thattime steps are sufficiently short by comparing simulations usingdifferent values of t . If t is adequately small, the differencesbetween these simulations will be insignificant. This is demon-strated for the simulations described in section 5.
4. A Physical ExperimentTo test the computational model, we conducted a physical
TCE-dissolution experiment in the transparent analog fracturefabricated by ZMG. We measure fracture aperture and TCEdistribution within the fracture at resolutions (0.0155 � 0.0155cm) that were much smaller than the correlation length (�) ofthe aperture variability (0.07–0.08 cm) using light transmissiontechniques. TCE-distribution measurements acquired duringthe experiment could then be directly compared with the sim-ulated evolution of TCE distribution under identical condi-tions (section 5).
4.1. Description of the Analog Fracture
ZMG fabricated the transparent analog fracture used in thecurrent investigation by placing two 15.4 � 30.3 cm pieces oftextured glass in contact and applying a confining pressure of138 kPa (for fabrication details, see ZMG). We applied no-fluxboundaries along the long edges of the fracture and flow man-ifolds along the short edges of the fracture. The inflow mani-fold provided uniformly distributed flow across the width of thefracture, while the outflow manifold consisted of four equallyspaced ports pressed up against the fracture edge, throughwhich equal flow was extracted at a constant rate. ZMG volu-metrically measured the mean aperture for this fracture to be0.010 cm. On the basis of their error analysis and the 0.1 g/Lmixture of FD&C Blue #1 (Warner Jenkinson) used in thecurrent investigation, the RMS error for individual aperturemeasurements was �2.2% of the mean aperture (for aperturemeasurement and error analysis methods, see Detwiler et al.[1999]).
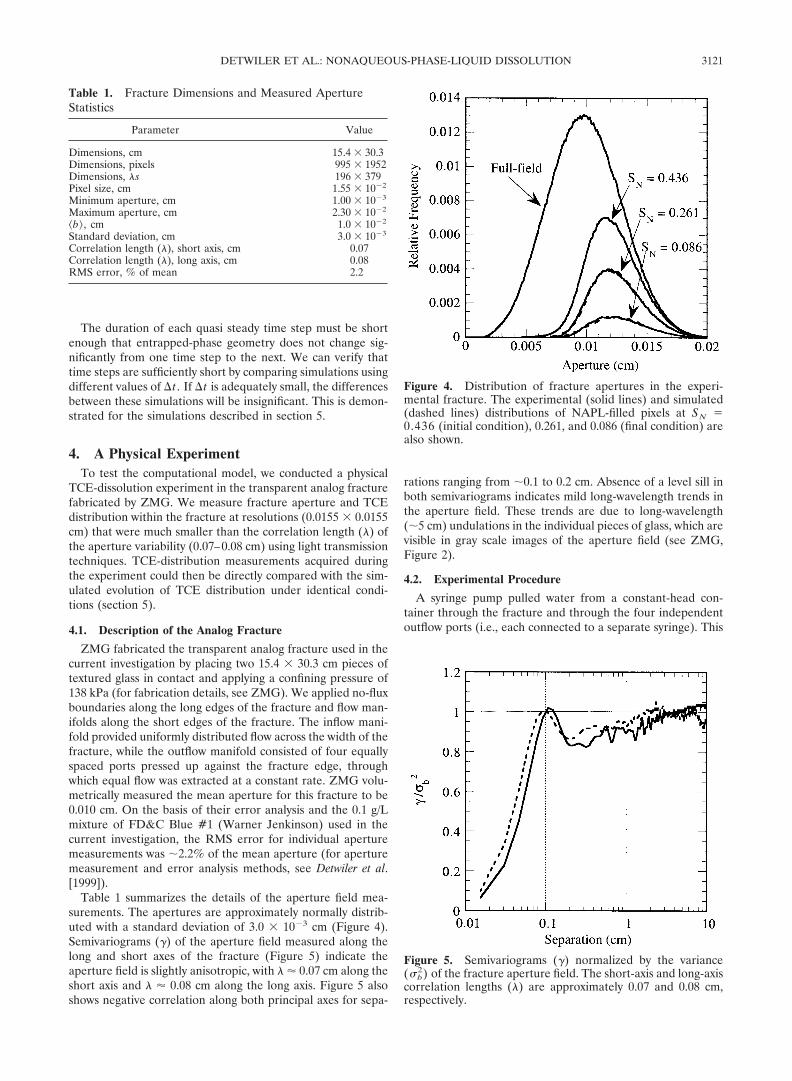
Table 1 summarizes the details of the aperture field mea-surements. The apertures are approximately normally distrib-uted with a standard deviation of 3.0 � 10�3 cm (Figure 4).Semivariograms (�) of the aperture field measured along thelong and short axes of the fracture (Figure 5) indicate theaperture field is slightly anisotropic, with � � 0.07 cm along theshort axis and � � 0.08 cm along the long axis. Figure 5 alsoshows negative correlation along both principal axes for sepa-
rations ranging from �0.1 to 0.2 cm. Absence of a level sill inboth semivariograms indicates mild long-wavelength trends inthe aperture field. These trends are due to long-wavelength(�5 cm) undulations in the individual pieces of glass, which arevisible in gray scale images of the aperture field (see ZMG,Figure 2).
4.2. Experimental Procedure
A syringe pump pulled water from a constant-head con-tainer through the fracture and through the four independentoutflow ports (i.e., each connected to a separate syringe). This
Table 1. Fracture Dimensions and Measured ApertureStatistics
Parameter Value
Dimensions, cm 15.4 � 30.3Dimensions, pixels 995 � 1952Dimensions, �s 196 � 379Pixel size, cm 1.55 � 10�2
Minimum aperture, cm 1.00 � 10�3
Maximum aperture, cm 2.30 � 10�2
b, cm 1.0 � 10�2
Standard deviation, cm 3.0 � 10�3
Correlation length (�), short axis, cm 0.07Correlation length (�), long axis, cm 0.08RMS error, % of mean 2.2
Figure 4. Distribution of fracture apertures in the experi-mental fracture. The experimental (solid lines) and simulated(dashed lines) distributions of NAPL-filled pixels at SN �0.436 (initial condition), 0.261, and 0.086 (final condition) arealso shown.
Figure 5. Semivariograms (�) normalized by the variance(�b
2) of the fracture aperture field. The short-axis and long-axiscorrelation lengths (�) are approximately 0.07 and 0.08 cm,respectively.
3121DETWILER ET AL.: NONAQUEOUS-PHASE-LIQUID DISSOLUTION
outflow configuration assured a relatively uniform initialNAPL distribution by eliminating phase blockage problems inthe outflow manifold. A marriotte bottle provided a constant-head boundary condition at the inflow and maintained a slightvacuum on the water in the reservoir. The vacuum reduced theconcentration of air dissolved in the water and prevented theformation of small air bubbles in the fracture and plumbing. Tomonitor flow rate, a balance recorded the mass of the marri-otte bottle at 7.5-min intervals over the duration of the exper-iment (240 hours). A straight line fitted to a plot of inflow massversus time gave a steady flow rate of (3.605 � 0.001) � 10�3
cm3/s. The temperature in the room remained at 22.5 � 0.5�Cover the duration of the experiment.
The TCE properties that are relevant to dissolution arepresented in Table 2. Because our ability to delineate the waterand TCE in the fracture depends on differential light absor-bance by the two fluids, we dyed the water with 0.25 g/L ofFD&C Blue #1. This is in contrast to previously reporteddissolution experiments involving NAPL visualization [e.g.,Powers et al., 1992; Imhoff et al., 1996; Kennedy and Lennox,1997; Jia et al., 1999; ZMG], where the NAPL was dyed withoil-red-o. Because oil-red-o is not water soluble, its concentra-tion in each NAPL blob increases as the blob shrinks due todissolution. These variable concentrations can lead to compli-cations in interpreting experimental data. Dyeing the watermay reduce both the solubility and DM of TCE in the aqueousphase; however, the effect should be both uniform (over theentire field) and constant (over the duration of the experi-ment).
Prior to initiating the experiment, we flushed the fracturewith sulfuric acid (18 M, 38 g/L Nochromix) followed by aclean water flush. This cleaning process minimized variabilityof the contact angle (�) between TCE (nonwetting fluid) andwater (wetting fluid) within the fracture. To initiate the exper-iment, we used the same experimental procedure as ZMG. Weinjected TCE into the water-saturated fracture at a flow rate of0.2 mL/min until TCE reached each of the four outflow portsand then reestablished water flow through the fracture at thesame flow rate. This flow rate was low enough to yield large,complex regions of residual entrapped NAPL and high enoughto allow measurable dissolution over a reasonable time frame.The flowing water mobilized some TCE, leaving behind resid-ual entrapped TCE at the initiation of the dissolution experi-ment (see ZMG, Figure 5, for representative TCE distribu-tions before and after the mobilization step).
After mobilization ceased (�4 hours), we began measuringthe evolution of TCE distribution within the fracture. Thecharge-coupled device (CCD) camera acquired sets of fiveimages of the entire flow field every 15 min for the duration ofthe experiment. Essentially no change in the phase structure
occurred over the 40-s interval required to take the five images,so averaging each set of five images resulted in reduced signalnoise and improved the accuracy of entrapped-TCE delinea-tion. We calculated the phase distribution in each averagedimage using an adaptive thresholding routine developed byNicholl and Glass [1994] and improved upon by Nicholl et al.[2000]. This process resulted in binarized images in whichpixels occupied by NAPL were assigned values of 1 and pixelsoccupied by flowing water were assigned values of 0. Thesebinarized images provide a record of the evolution of TCEdistribution within the fracture. Multiplying the binarized im-ages with the measured aperture field yields measurements ofSN for each field, as well as dissolution rates that can bedirectly compared to computational simulations. Curvature ofthe NAPL-water interfaces between the fracture surfacescauses some light reflection and refraction, which results insome uncertainty in the exact location of interfaces. Varyingthe parameters used for the thresholding routine providedestimates of the sensitivity of the binarized images to a rea-sonable range of input parameters. On the basis of this analysisfor the initial phase distribution field, the initial SN of 0.436has a possible range of �0.02. We expect the relative influenceof these errors to be greater for small TCE blobs; however, thesmallest blobs account for only a very small portion of the totalvolume of TCE.
4.3. Summary of Experimental Results
Figure 6 shows the TCE distribution in the fracture at theinitiation of the dissolution experiment. Flow through the frac-ture was from left to right, and the solid and open regionsrepresent entrapped TCE and water, respectively. A significantdifference between our experiments and those of ZMG wasthat we simply dissolved the TCE without the additional mo-bilization induced with a surfactant flood. Thus the entrappedTCE blobs in our experiment were considerably more complexand representative of residual entrapped-phase structures un-der natural flow and dissolution conditions. The medium-sizedcontinuous regions of water in the initial phase structure co-incide with regions of slightly smaller aperture relative to theentire field. These regions of smaller aperture are the likelycause for the trends observed in the semivariograms.
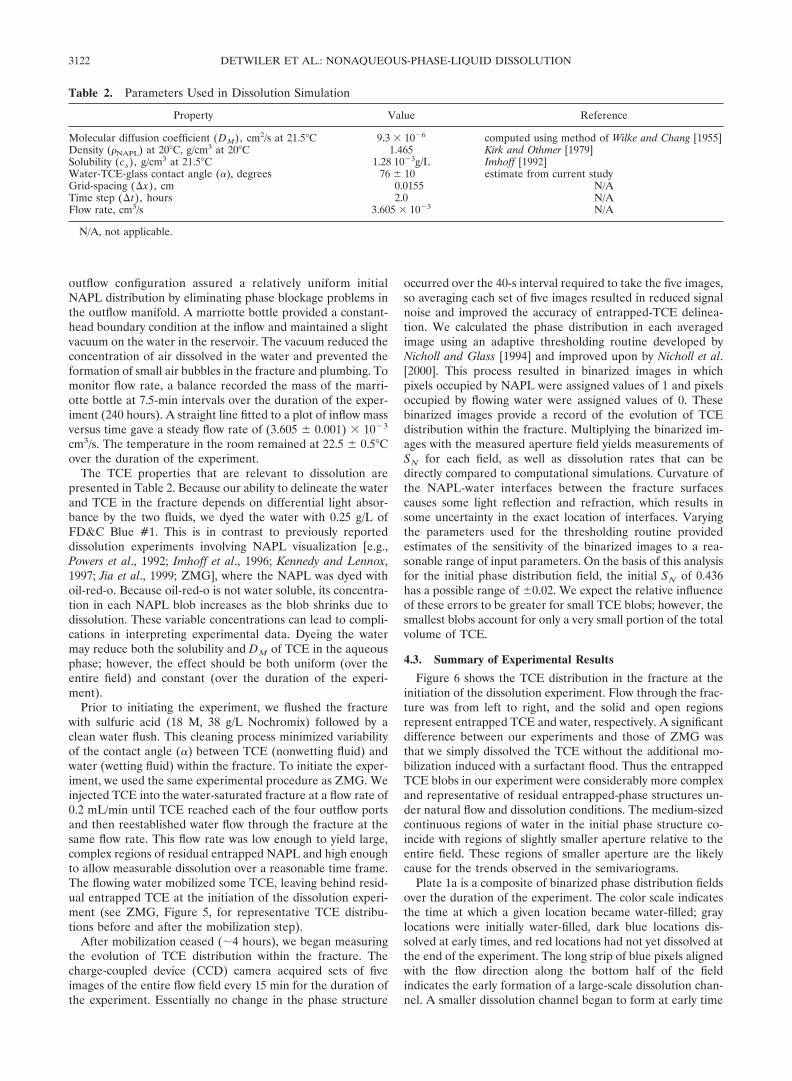
Plate 1a is a composite of binarized phase distribution fieldsover the duration of the experiment. The color scale indicatesthe time at which a given location became water-filled; graylocations were initially water-filled, dark blue locations dis-solved at early times, and red locations had not yet dissolved atthe end of the experiment. The long strip of blue pixels alignedwith the flow direction along the bottom half of the fieldindicates the early formation of a large-scale dissolution chan-nel. A smaller dissolution channel began to form at early time
Table 2. Parameters Used in Dissolution Simulation
Property Value Reference
Molecular diffusion coefficient (DM), cm2/s at 21.5�C 9.3 � 10�6 computed using method of Wilke and Chang [1955]Density (�NAPL) at 20�C, g/cm3 at 20�C 1.465 Kirk and Othmer [1979]Solubility (cs), g/cm3 at 21.5�C 1.28 10�3g/L Imhoff [1992]Water-TCE-glass contact angle (�), degrees 76 � 10 estimate from current studyGrid-spacing ( x), cm 0.0155 N/ATime step ( t), hours 2.0 N/AFlow rate, cm3/s 3.605 � 10�3 N/A
N/A, not applicable.
DETWILER ET AL.: NONAQUEOUS-PHASE-LIQUID DISSOLUTION3122

near the top of the field as well, but its growth slowed when themain dissolution channel became well connected to three ofthe four outflow ports.
Some mobilization of TCE occurred during the experimentas small, localized movements of TCE that caused only redis-tribution within individual TCE blobs. These small movementsare seen as discontinuities in the color scheme and are largelyconcentrated in the large red region at the upper right-handside of the fracture (Plate 1a). These movements were likelydue to small pressure changes when the syringe pump wasemptied (�12-hour intervals) and periodic bubbling throughthe tube to the atmosphere in the marriotte bottle. However,the interplay of capillary forces within blobs as they shrinkcould also have created the redistribution. One would expectsuch capillary effects to be more important in large blobs, and,indeed, this is where the redistribution occurred.
5. Comparison of Dissolution Simulation toExperiment
To test the computational algorithm described in section 3,we simulated TCE dissolution in the measured aperture fieldusing the experimentally measured initial TCE distribution asthe initial condition. The properties of TCE and other param-eters used in the simulation are summarized in Table 2. Thegrid-block size used in the simulation was 0.0155 cm (same asthe pixel size used for experimental measurements of apertureand phase structure), which resulted in a 995 � 1952 grid. Therelevant boundary conditions for the flow simulations wereconstant flux (equal to the experimentally measured flow rate)at each of the four outflow ports, constant pressure along theinflow edge, and no flux along the long edges of the fracture.For the transport simulations the boundary conditions wereC � 0 at the inflow boundary, no flux across the long edges ofthe fracture, and �C/� x � 0 at the outflow ports. For the MIP
simulations of phase structure evolution, we used � � 76 de-grees and � � 0.07 cm, which yielded reasonable agreementbetween simulated and experimentally observed blob shrink-age. The chosen value for � corresponds reasonably well withvisual observations of receding TCE-water-glass contact an-gles. The dissolution simulation terminated at a value of SN �0.086, which corresponds to the last experimental measure-ment.
Plate 1b shows the phase structure evolution during thedissolution simulation corresponding to the experimental com-posite image (Plate 1a). Comparing Plates 1a and 1b demon-strates that the simulation closely reproduces the large-scaleevolution of the phase structure over the entire field. Discrep-ancies between Plates 1a and 1b are mostly concentrated nearthe lower edge of the fracture, with relatively minor localdiscrepancies at other locations. These results demonstrate theability of the dissolution model, which couples mass transferand interface movement, to track the evolution of the en-trapped-TCE structure at the scale of the fracture. Plates 1cand 1d show the dissolution order in a single blob for theexperiment and simulation, respectively, and Plate 1e showsthe simulated dissolution of the same blob using a standardinvasion percolation (SIP) model (i.e., calculation of the inter-face curvature excludes the contribution of in-plane curva-ture). The MIP simulation more closely represents the generalbehavior of the shrinking blob than the SIP simulation. Mostnotably, as the blob breaks up, the experiment and the MIPalgorithm both produce daughter blobs that connect severalregions of large aperture through regions of smaller aperture.Because the SIP algorithm will always fill the smallest aperturealong an interface first, it results in smaller and disconnectedblobs as the original blob dissolves and breaks up.
Plate 2 shows simulated concentration fields at three differ-ent TCE saturations (SN � 0.436, 0.261, and 0.086). Severalfeatures observed in these concentration fields highlight the
Figure 6. TCE distribution in the 15.4 � 30.3 cm fracture prior to initiation of the dissolution experimentand simulation. Solid areas represent entrapped TCE, and open areas represent water flowing from left toright.
3123DETWILER ET AL.: NONAQUEOUS-PHASE-LIQUID DISSOLUTION

influence of small-scale hydrodynamics on dissolution, as sug-gested earlier by Glass and Nicholl [1995]. (1) Plate 2a dem-onstrates the channeling of clean water entering the fracture,which is influenced by the structure of the entrapped phasewithin the fracture. Such channeling eventually leads to pro-nounced dissolution channels (Plate 2c) along which TCE dis-solves rapidly, while leaving behind substantial mass outside ofthese channels. (2) Examination of Plates 1a and 1b revealsthat dense clusters and large, tortuous TCE blobs dissolve at aslower rate than smaller blobs. The concentration fields inPlate 2 demonstrate that flow is largely diverted around theselarge blobs and significant mass transfer occurs only from asmall portion of their perimeter. (3) Regions of high masstransfer (i.e., large aqueous-phase-TCE concentration gradi-ents) do not necessarily coincide with locations of rapid inter-face movement. Examining the evolution in time of the TCEphase in the boxed region of Plates 2b and 2c clarifies thispoint. The concentration gradients surrounding this blob arehighest at the upstream end (see Plate 2b). However, compar-ing Plates 2b and 2c, it is evident that the TCE has withdrawnfrom the downstream portion of the boxed region, while theupstream end shows little change in the TCE-phase occupancy.As the blob volume reduces due to dissolution, the remainingTCE continues to recede into the upstream end, where localapertures are larger. This vividly illustrates the importance ofcoupling mass transfer and capillary physics for simulatingdissolution of an entrapped phase in variable-aperture frac-tures.
Histograms of TCE-filled apertures in Figure 4 for SN �0.436, 0.261, and 0.086 show excellent agreement betweenthe experiment and the simulation. Because TCE is the non-wetting fluid, the initial (SN � 0.436) median TCE-filledaperture is �15% larger than the median of the entire field. AsTCE dissolves, it more frequently leaves the smaller apertures,causing the distribution to become slightly skewed toward thelarger apertures. Figure 7 shows cumulative saturation distri-bution of TCE-blob volumes for the experiment and simula-tion for SN � 0.436, 0.261, and 0.086. Owing to the previ-
ously mentioned difficulties with detecting small NAPL blobswith the experimental system, we removed all NAPL blobs thatwere less than 1 � 10�5 cm3 from the simulated and experi-mental fields. This cutoff volume corresponds to blobs thatoccupied less than about five pixels; removing these blobs fromeach field resulted in less than a 0.1% reduction in total mass.Note that the measured blob volumes for this experimentrange over more than 3 orders of magnitude, in contrast toblob volume measurements in a homogeneous porous media[Mayer and Miller, 1992], which ranged over �2 orders ofmagnitude. As with previous measurements in porous media,the experimentally measured blob-volume distributions are ap-proximately lognormally distributed at each saturation. Themost significant change in the distributions is that as SN de-creases, the number of large blobs also decreases. The exper-iment and simulation exhibit good agreement over the range ofSN and over the range of blob volumes.
Considering the dissolution behavior at the scale of thefracture, Figure 8 shows the experimental and simulated timevariation of total TCE saturation (SN) normalized with respectto the initial value (SNi � 0.436). The simulation accuratelyreproduces the time variation of the NAPL saturation over theduration of the experiment (SN � 0.436–0.086), despite thelocal, small-scale discrepancies mentioned previously. It is alsointeresting to note that for both the experiment and the sim-ulation, the decay of SN with time can be modeled well by anexponential
SN/SNi � exp ��Kt�Cs � C�/�� , (24)
where K is a bulk mass transfer coefficient and C is somefracture-scale average concentration (e.g., influent concentra-tion, Co). Fitting (24) to a plot of the evolution of SN with time(Figure 8) yields estimates of K � (6.49 � 0.02) � 10�3
hour�1 and (6.64 � 0.02) � 10�3 hour�1 for the experimentand simulation, respectively. The fact that a single parameterdescribes the dissolution rate in this fracture, despite the sig-nificant fingering of the entrapped TCE structure caused bydissolution, is a feature that merits further study. A modified
Figure 7. Cumulative saturation distribution of the TCE-blob volumes for the experiment (solid lines) and the simula-tion (dashed lines) at SN � 0.436, 0.261, and 0.086.
Figure 8. TCE saturation (SN) normalized by the initial sat-uration (SNi) plotted against time for the experiment andsimulation.
DETWILER ET AL.: NONAQUEOUS-PHASE-LIQUID DISSOLUTION3124
dissolution simulation that utilized an open manifold (i.e., uni-form head) boundary condition at the outflow confirmed thatthe dissolution fingering observed in the experiment was not anartifact of the outflow port configuration but a result of thecomplex initial TCE geometry and the feedback between dis-solution and local permeabilities that has been observed tocause dissolution fingering in porous media [Imhoff et al.,1996]. The only significant deviation between the modified
simulation and the experiment occurred after the main disso-lution channel became well connected to the outflow manifold,at which time the experimental configuration caused the maindissolution channel to broaden at the outflow end of the frac-ture. The ability of a simple mass transfer model (24) to de-scribe the evolution of SN during the experiment is encourag-ing in the context of developing effective mass transfercoefficients for entrapped NAPL dissolution in variable-
Plate 1. Composite images of TCE distribution with time for the (a) experiment and (b) simulation; flowthrough the fracture was from left to right. Evolution of a single TCE blob (located approximately one fifthof the fracture from the left-hand side and midway between the top and bottom) from (c) the experiment, (d)the MIP-based simulation, and (e) a standard invasion-percolation-based simulation (i.e., Pc calculated usingonly r1).
3125DETWILER ET AL.: NONAQUEOUS-PHASE-LIQUID DISSOLUTION

Plate 2. Concentration fields from the dissolution simulation for (a) SN � 0.436 (initial saturation), (b)SN � 0.261, and (c) SN � 0.086. Removal of TCE from the boxed region in Plates 2b and 2c illustrates theimportance of coupling mass transfer and capillary physics for simulating dissolution of an entrapped phasein variable-aperture fractures; mass transfer rates are highest in the left-hand portion of the boxed region, yetcapillary forces cause TCE to recede more quickly from the right-hand portion of the boxed region.
DETWILER ET AL.: NONAQUEOUS-PHASE-LIQUID DISSOLUTION3126

aperture fractures. However, the results of the modified sim-ulation suggest that as dissolution fingers become hydraulicallywell connected to the outflow end of the fracture, bypassing offlow past significant portions of the fracture may cause disso-lution rates to slow and (24) to break down.
We emphasize that our simulation used only measured phys-ical parameters and no empirical relationships. It is useful thento consider the sensitivity of dissolution simulations to errors inestimates of the physical parameters, including the moleculardiffusion coefficient of TCE dissolved in water (Dm), density(�), and contact angle (�). In addition, the robustness of thecomputational algorithm must be confirmed, in particular, thesensitivity of simulations to values of Deff, x , and t . Sensi-tivity studies for Dm and � (and any other factor which canmodify the interface area A in equation (21)) revealed that anincrease in Dm or A is accompanied by a decrease in thecomputed concentration gradient (�C � n) at the interface,such that a 10% increase in Dm or A leads to only a 1.3%increase in the mass transfer rate at an interface. Thus errorsin estimates of Dm or other properties controlling A will onlyresult in relatively small deviations in simulated mass transferrates. However, mass transfer rates are directly proportional tothe TCE density �. Fortunately, it is easier to obtain accuratemeasurements of � than either Dm or A , so errors in � shouldnot be a source of significant errors in simulated mass transferrates.
To test the sensitivity of our simulation to the value of Deff,we replaced Deff � Dm (used in the previously discussedsimulations) with Deff � Dm(1 � Pe2/ 210) and repeated thedissolution simulation. It should be noted that the size of a gridblock (0.0155 cm) is close to the mean aperture (0.010 cm).Thus the use of the asymptotic Taylor dispersion coefficient,which requires a distance of 0.4Peb to develop, will signifi-cantly overestimate the actual magnitude of Taylor dispersioneffects. We are using this large value to test the sensitivity ofour simulation results. Development of a consistent represen-tation for the grid-block-scale effective Taylor dispersion co-efficient is a problem that merits further study. In the initialTCE distribution field, values of Pe ranged from 0 to 331,which results in local values of Deff ranging from Dm to525Dm. Despite this wide range of local dispersion coeffi-cients, simulated dissolution rates are not substantially differ-ent from those obtained using Deff � Dm (Figure 9). Theconcentration fields shown in Plate 2 are helpful in under-standing this somewhat surprising result. Concentration gradi-ents in the flow direction are uniformly small, and thus, despitethe large values of Deff, the dispersion in the flow direction isinsignificant. Conversely, transverse dispersion, which controlsmass transfer rates at NAPL-water interfaces, is unaffected bythe alternative form for Deff. These results suggest that usingDeff � Dm is reasonable in this depth-averaged model ofdissolution.
We also examined the influence of numerical dispersion onthe simulated dissolution rate. As we discussed in section 3, theupwind finite difference scheme used to discretize the advec-tive term in (19) is susceptible to numerical dispersion in re-gions of high grid-Pe (v x/ 2Dm) and steep concentrationgradients. Because the numerical dispersion coefficient is pro-portional to � x , we expect that it will have less of an influenceon mass transfer rates than using Deff � Dm(1 � Pe2/ 210).To evaluate the influence of numerical dispersion on the dis-solution simulation, we refined the grid (i.e., reduced the grid-Pe) by a factor of 2 and repeated the simulation using identical
parameters. We reduced the size of the coarse-grid domain to795 � 1952 by removing a strip of 100 grid blocks along theno-flux edges of the domain; this slight reduction in size wasnecessary for the refined-grid simulation (1590 � 3904) to runefficiently on the Sun Enterprise 250 (2 Gb RAM) workstationused for these simulations. Despite the fact that there are localregions of high grid-Pe in the coarse-grid field, the fine-gridsimulation demonstrated excellent agreement with the coarse-grid simulation on the same domain (Figure 9). We thus con-clude that our fracture-scale estimates of dissolution rates arenot biased by numerical dispersion.
Finally, we examined the influence of t on the simulationby increasing t by a factor of 2 to t � 4 hours. Figure 9compares plots of SN against time for t � 2 and 4 hours andsuggests that t � 2 hours was an adequately short time stepfor this fracture, initial TCE distribution, and flow rate. Theseresults also suggest that our approach for tracking mass inNAPL blobs that are smaller than one grid block (described insection 3) does not have a significant influence on our results.
6. Concluding RemarksWe have presented a depth-averaged computational model
for simulating dissolution of an entrapped NAPL in variable-aperture fractures that couples flow, dissolved NAPL trans-port, and interphase mass transfer with the capillary-definedinterface movement. Flow is modeled using the Reynoldsequation, and transport of the dissolved NAPL is modeled
Figure 9. TCE saturation (SN) normalized by the initial sat-uration (SNi) plotted against time for simulations using differ-ent values of t and x . The simulation compared with theexperiment in Figure 8 used values of to � 2 hours and xo � 0.0155 cm. The close agreement between the originalsimulations and simulations with t � 2 to and x � xo/ 2demonstrates that the values of t and x used in the originalsimulation are adequately small. Also shown is a simulationwith the local effective dispersion coefficient (Deff) repre-sented by the Taylor dispersion coefficient between parallelplates rather than Dm used in the other simulations. Thoughwe expect this to be a significant overestimation of Deff, theplot is in close agreement with the other simulations.
3127DETWILER ET AL.: NONAQUEOUS-PHASE-LIQUID DISSOLUTION

using the corresponding depth-averaged solute transport equa-tion; both of these models assume an impermeable rock ma-trix. By directly solving for the depth-averaged velocity fieldaround each entrapped NAPL blob, and assuming that thedissolved NAPL is at equilibrium at NAPL-water interfaces,the model does not require empirical relationships to describelocal mass transfer rates. We have shown that a quasi steadystate approximation is appropriate in the case of a NAPL forwhich the solubility limit in water is very small compared withits density. On the basis of this approximation, a sequence ofquasi steady flow and concentration fields corresponding to theevolving NAPL phase structure can be used to compute dis-solution rates. Because entrapped NAPL blobs may have in-plane dimensions that are many times the aperture correlationlength, it is critical to incorporate capillary physics into thecomputation of the interface movements that modify the flowfield as the phase structure evolves. We are unaware of anyprevious model formulations that establish such a coupling.This depth-averaged model offers a computationally tractableframework for developing constitutive relationships betweenmass transfer rates and parameters characterizing the NAPLphase structure, aperture variability, and the mean flow rates.Such constitutive relationships may then be used to representsingle fractures within large-scale network models.
To test the computational model, we compared a dissolutionsimulation based on the depth-averaged model with a TCEdissolution experiment in an analog fracture. Using light trans-mission techniques, we measured the fracture aperture and theevolution of the TCE distribution over the 240-hour durationof the experiment. The high resolution of these measurements(0.0155 � 0.0155 cm) resulted in approximately five measure-ments per correlation length over the entire 15.4 � 30.3 cmflow field. The resulting 995 � 1952 computational grid corre-sponded with the measured fields; to our knowledge, these arethe first computations of entrapped-phase dissolution in gridswith O(106) nodes. The results of the computational simula-tion agreed closely with the experiment, suggesting that despitea number of simplifications implicit in depth averaging thethree-dimensional governing equations, this model can be usedas a tool for developing a general understanding of the processof dissolution from single variable-aperture fractures.
The excellent agreement between simulation and experi-ment is in part due to the careful design of the experiment toavoid some of the known limitations of the depth-averagedapproach. It is important to consider these limitations in anyattempt to use this model as a predictive tool. The validity ofthe Reynolds equation depends on the values of b/� and�b/b . Zimmerman and Bodvarsson [1996] suggested that theeffective transmissivity of a rough-walled fracture is adequatelyquantified using the Reynolds equation, if the value of b/� issmaller than about 0.05. In our experimental fracture, b/� is0.12 and �b/b � 0.3; in a fracture with similar values ofthese parameters, Nicholl et al. [1999] observed that the Reyn-olds equation overestimates the effective transmissivity byabout 32%. However, in our simulation, we minimized localerrors in the simulated flow field by specifying the experimen-tally measured constant flux through the fracture. In addition,the depth-averaged approximation of the transport equationused here does not incorporate the influence of Taylor disper-sion. Our sensitivity analysis demonstrated that using localvalues of Deff that overestimate the influence of Taylor disper-sion does not result in significant changes in dissolution rates.However, developing a theoretical expression for local values
of Deff to be used in depth-averaged transport simulators is anarea that merits further study.
An important motivation for developing constitutive rela-tions for the dissolution process arises from the need to rep-resent the effective behavior of variable-aperture fractures inlarge-scale discrete fracture network models. In these large-scale models it is infeasible to represent detailed aperturevariability within single fractures. Our experimental and sim-ulation results indicate an exponential decay in the NAPLsaturation (SN) with time, suggesting the validity of the simplelinear mass transfer model (24) for describing fracture-scalebehavior. It is especially surprising that the fracture-scale masstransfer coefficient is essentially constant during the dissolu-tion process, despite the significant changes in the entrappedNAPL phase structure. This is a feature that merits furtherstudy. The fracture-scale mass transfer coefficient is presum-ably related to Pe , the initial entrapped phase structure (whichis in turn influenced by the combination of capillary, gravity,and viscous forces with invasion history), and other parameterscharacterizing aperture variability. Detailed parametric studiescovering a wide range of conditions will further clarify thenature of this relationship. Such parametric studies will bevaluable in leading to meaningful representations of singlefractures in large-scale fracture network models. The depth-averaged model presented here can also be extended to incor-porate matrix diffusion and other mechanisms of exchange ofwater and solute between fractures and the adjacent rock ma-trix, leading ultimately to physically consistent models ofNAPL dissolution in fractured rock masses.
Acknowledgments. This work was supported by the U.S. Depart-ment of Energy’s Basic Energy Sciences Geoscience Research Pro-gram under contracts DE-FG03-96ER14590 (University of Coloradoat Boulder) and DE-AC04-94AL85000 (Sandia National Laborato-ries). Experiments were conducted at the Flow Visualization and Pro-cesses Laboratory at Sandia National Laboratories. We thank Al Val-occhi and an anonymous reviewer for their constructive reviews of themanuscript.
ReferencesAdler, P. M., and J.-F. Thovert, Fractures and Fracture Networks, Klu-
wer Acad., Norwell, Mass., 1999.Brown, S. R., Fluid flow through rock joints: The effect of surface
roughness, J. Geophys. Res., 92(B2), 1337–1347, 1987.Conrad, S. H., J. L. Wilson, W. R. Mason, and W. J. Peplinski, Visu-
alization of residual organic liquid trapped in aquifers, Water Resour.Res., 28, 467–478, 1992.
Detwiler, R. L., S. E. Pringle, and R. J. Glass, Measurement of fractureaperture fields using transmitted light: An evaluation of measure-ment errors and their influence on simulations of flow and transportthrough a single fracture, Water Resour. Res., 35, 2605–2617, 1999.
Detwiler, R. L., H. Rajaram, and R. J. Glass, Solute transport invariable-aperture fractures: An investigation of the relative impor-tance of Taylor dispersion and macrodispersion, Water Resour. Res.,36, 1611–1625, 2000.
Dillard, L. A., and M. J. Blunt, Development of a pore networksimulation model to study nonaqueous phase liquid dissolution,Water Resour. Res., 36, 439–454, 2000.
Gelhar, L. W., Application of stochastic models to solute transport infractured rocks, report, Swed. Nucl. Fuel and Waste Manage. Co.,Stockholm, Sweden, 1987.
Glass, R. J., and M. J. Nicholl, Quantitative visualization of entrappedphase dissolution in a horizontal flowing fracture, Geophys. Res.Lett., 22, 1413–1416, 1995.
Glass, R. J., M. J. Nicholl, and L. Yarrington, A modified invasionpercolation model for low-capillary number immiscible displace-ments in horizontal rough-walled fractures: Influence of local in-plane curvature, Water Resour. Res., 34, 3215–3234, 1998.
DETWILER ET AL.: NONAQUEOUS-PHASE-LIQUID DISSOLUTION3128

Glass, R. J., M. J. Nicholl, and L. Yarrington, Correction to “A mod-ified invasion percolation model for low-capillary number immisci-ble displacements in horizontal rough-walled fractures: Influence oflocal in-plane curvature,” Water Resour. Res., 36, 1991, 2000.
Imhoff, P. T., Dissolution of a nonaqueous phase liquid in saturatedporous media, Ph.D. dissertation, Princeton Univ., Princeton, N. J.,1992.
Imhoff, P. T., P. R. Jaffe, and G. F. Pinder, An experimental study ofcomplete dissolution of a nonaqueous phase liquid in saturatedporous media, Water Resour. Res., 30, 307–320, 1994.
Imhoff, P. T., G. P. Thyrum, and C. T. Miller, Dissolution fingeringduring the solubilization of nonaqueous phase liquids in saturatedporous media, 2, Experimental observations, Water Resour. Res., 32,1929–1942, 1996.
Jia, C., K. Shing, and Y. C. Yortsos, Visualization and simulation ofnon-aqueous phase liquids solubilization in pore networks, J. Con-tam. Hydrol., 35, 363–387, 1999.
Kennedy, C. A., and W. C. Lennox, A pore-scale investigation of masstransport from dissolving DNAPL droplets, J. Contam. Hydrol., 24,221–246, 1997.
Kirk, T. E., and D. F. Othmer, Encyclopedia of Chemical Technology,3rd ed., vol. 5, Wiley-Interscience, New York, 1979.
Larson, R. G., L. E. Scriven, and H. T. Davis, Percolation theory of twophase flow in porous media, Chem. Eng. Sci., 36, 57–73, 1981.
Leal, L. G., Laminar Flow and Convective Transport Processes: ScalingPrinciples and Asymptotic Analysis, Butterworth-Heinemann,Woburn, Mass., 1992.
Mackay, D. M., and J. A. Cherry, Groundwater contamination: Pump-and-treat remediation, Environ. Sci. Technol., 23, 630–636, 1989.
Mayer, A. S., and C. T. Miller, The influence of porous mediumcharacteristics and measurement scale on pore-scale distributions ofresidual nonaqueous-phase liquids, J. Contam. Hydrol., 11, 189–213,1992.
Miller, C. T., M. M. Poirier-McNeill, and A. S. Mayer, Dissolution oftrapped nonaqueous phase liquids: Mass transfer characteristics,Water Resour. Res., 26, 2783–2796, 1990.
Moreno, L., Y. W. Tsang, C. F. Tsang, F. V. Hale, and I. Neretnieks,Flow and tracer transport in a single fracture: A stochastic modeland its relation to some field observations, Water Resour. Res., 24,2033–2048, 1988.
Nicholl, M. J., and R. J. Glass, Wetting phase permeability in a par-tially saturated horizontal fracture, paper presented at the FifthAnnual International Conference on High Level Radioactive WasteManagement, Am. Nucl. Soc., Las Vegas, Nev., May 22–26, 1994.
Nicholl, M. J., H. Rajaram, R. J. Glass, and R. L. Detwiler, Saturatedflow in a single fracture: Evaluation of the Reynolds equation inmeasured aperture fields, Water Resour. Res., 35, 3361–3373, 1999.
Nicholl, M. J., H. Rajaram, and R. J. Glass, Factors controlling satiatedrelative permeability in a partially saturated horizontal fracture,Geophys. Res. Lett., 27, 393–396, 2000.
Ortoleva, P., E. Merino, C. Moore, and J. Chadam, Geochemical selforganization, 1, Reaction-transport feedbacks and modeling ap-proach, Am. J. Sci., 287, 979–1007, 1987.
Powers, S. E., L. M. Abriola, and W. J. Weber, An experimentalinvestigation of nonaqueous phase liquid dissolution in saturatedsubsurface systems: Steady state mass transfer rates, Water Resour.Res., 28, 2691–2705, 1992.
Powers, S. E., L. M. Abriola, and W. J. Weber, An experimentalinvestigation of nonaqueous phase liquid dissolution in saturatedsubsurface systems: Transient mass transfer rates, Water Resour.Res., 30, 321–332, 1994.
Ruge, J. W., and K. Stuben, Algebraic multigrid, in Multigrid Methods,edited by S. F. McCormick, pp. 73–130, Soc. for Ind. and Appl.Math., Philadelphia, Pa., 1987.
Schwartz, F. W., J. A. Cherry, and J. R. Roberts, A case study of achemical spill: Polychlorinated biphenyls (PCBs), 2, Hydrogeologi-cal conditions and contaminant migration, Water Resour. Res., 18,535–545, 1982.
Thompson, M. E., Numerical simulation of solute transport in roughfractures, J. Geophys. Res., 96(B3), 4157–4166, 1991.
Tsang, Y. W., and P. A. Witherspoon, Hydromechanical behavior of adeformable rock fracture, J. Geophys. Res., 86(B10), 9287–9298,1981.
Wilke, C. R., and P. Chang, Correlation of diffusion coefficients indilute solutions, AIChE J., 1, 264–270, 1955.
Yeo, I. W., M. H. DeFreitas, and R. W. Zimmerman, Effect of sheardisplacement on the aperture and permeability of a rock fracture,Int. J. Rock Mech. Min. Sci., 35, 1051–1070, 1998.
Zhong, L., A. Mayer, and R. J. Glass, Visualization of surfactant-enhanced nonaqueous phase liquid mobilization and solubilizationin a two-dimensional micromodel, Water Resour. Res., 37, 523–537,2001.
Zhou, D., L. A. Dillard, and M. J. Blunt, A physically based model ofdissolution of nonaqueous phase liquids in the saturated zone,Transp. Porous Media, 39, 227–255, 2000.
Zimmerman, R. W., and G. S. Bodvarsson, Hydraulic conductivity ofrock fractures, Transp. Porous Media, 23, 1–30, 1996.
R. L. Detwiler, Lawrence Livermore National Laboratory, P.O. Box808, L-206, Livermore, CA 94551, USA. ([email protected])
R. J. Glass, Flow Visualization and Processes Laboratory, SandiaNational Laboratories, Albuquerque, NM 87123, USA. ([email protected])
H. Rajaram, Department of Civil, Environmental, and ArchitecturalEngineering, University of Colorado, Boulder, CO 80309-0428, USA.([email protected])
(Received December 22, 2000; revised July 13, 2001;accepted August 7, 2001.)
3129DETWILER ET AL.: NONAQUEOUS-PHASE-LIQUID DISSOLUTION

3130