noninterferometric quantitative phase imaging with soft x rays
TRANSCRIPT
1732 J. Opt. Soc. Am. A/Vol. 17, No. 10 /October 2000 Allman et al.
Noninterferometric quantitative phase imagingwith soft x rays
Brendan E. Allman, Phillip J. McMahon, Justine B. Tiller, Keith A. Nugent, David Paganin,and Anton Barty
School of Physics, University of Melbourne, Victoria 3010, Australia
Ian McNulty, Sean P. Frigo, Yuxin Wang, and Cornelia C. Retsch
Advanced Photon Source, Argonne National Laboratory, 9700 South Cass Avenue, Argonne, Illinois 60439
Received January 3, 2000; revised manuscript received June 6, 2000; accepted June 9, 2000
We demonstrate quantitative noninterferometric x-ray phase–amplitude measurement. We present resultsfrom two experimental geometries. The first geometry uses x rays diverging from a point source to producehigh-resolution holograms of submicrometer-sized objects. The measured phase of the projected image agreeswith the geometrically determined phase to within 67%. The second geometry uses a direct imaging micro-scope setup that allows the formation of a magnified image with a zone-plate lens. Here a direct measure ofthe object phase is made and agrees with that of the magnified object to better than 610%. In both cases theaccuracy of the phase is limited by the pixel resolution. © 2000 Optical Society of America[S0740-3232(00)01710-5]
OCIS codes: 100.0100, 100.5070, 070.0070, 090.0090, 110.7440, 120.5050, 180.7460.
1. INTRODUCTIONX rays were discovered serendipitously, and their greatpenetrating power was confirmed by an image of the in-ternal structure of a hand.1 X-ray imaging has been thesubject of intense development ever since. Until re-cently, the principal contrast mechanism was the absorp-tion of the radiation. In medical applications, this leadsto the ability to observe the projected density distributionin the object. In soft x-ray microscopy, the differentialabsorption contrast between oxygen and carbon is ob-served if radiation in the so-called water window is used.2
Soft x-ray microscopy with use of absorption contrastsubjects the object to massive doses of radiation, leadingto possible structural changes. There has therefore beenconsiderable interest in the development of phase-contrast soft x-ray microscopy3 that utilizes the x-rayphase contrast between elements in regions of relativelylow absorption.4,5 This work was of interest in both im-aging microscopy6 and soft x-ray holography.7 Moreover,it can be readily observed that, away from absorptionedges, the phase-contrast mechanism becomes increas-ingly dominant as the photon energy, E, increases (ab-sorption contrast scales approximately as E23, whilephase contrast scales as E21). For very energetic x rays,objects may show negligible absorption contrast whileshowing substantial phase contrast.8
The importance of phase-contrast mechanisms hasbeen accentuated by the development of third-generationx-ray sources. These devices, which can produce copiousquantities of coherent x rays by virtue of their very highbrilliance,9 have permitted phase-contrast imaging to be-come an extremely simple and standard imagingtechnique.10–14 Phase-contrast tomography has also be-come possible.15,16 The ideas developed in the synchro-
0740-3232/2000/101732-12$15.00 ©
tron community have now been shown to have a role inhigh-brilliance laboratory sources.12 Although thesesources have a much lower brilliance than a synchrotronsource, phase effects in the object can still lead to en-hanced contrast and the observation of, for example, softtissue features.
For these reasons, phase determination remains an ac-tive field of study. Early x-ray phase imaging took itslead from scanning transmission electron microscopy andutilized quadrant detectors for phase analysis.17,18
Quadrant detectors have since been used in scanningtransmission x-ray microscopy,19 and a similar techniquehas been used in light microscopy.20 A major advantageof this method is its spatial resolution, which is governedby the focal spot size of the scanning apparatus. The dis-advantage is the time required to acquire a high-resolution image. Alternatively, whole image detection,for example with Shack–Hartmann arrays,21 is instru-mentally complex and provides only limited spatial phaseresolution. Whole-image phase analysis in x-ray micros-copy was also considered by use of Wigner deconvolutiontechniques. This is very computationally intensive, as itrequires four-dimensional data sets.22 Multiple defocusmethods, a procedure related to that used here, have alsobeen developed.23,24 Various other iterative algorithmshave appeared that successively approximate the phasethrough the development of propagated intensity betweenspatially separated planes.25–27 The appeal of themethod presented in the present work is that it directly(noniteratively) retrieves spatially accurate, quantitativephase by means of a computationally efficient algorithmand uses standard x-ray microscopy techniques. More-over, existing techniques frequently intermix phase withabsorption contrast. In this paper we explore the ability
2000 Optical Society of America

Allman et al. Vol. 17, No. 10 /October 2000 /J. Opt. Soc. Am. A 1733
to measure phase quantitatively and separate it out fromthe absorption contrast in the sample. The deterministicphase-retrieval technique of this paper uses the transportof intensity approach,28,29 which has been usedelsewhere,30 though a flexible solution procedure is amore recent development.31 This work is an extension ofour earlier experimental8 and theoretical32 work in whichthe absorption had to be minimized for phase recovery.
We begin in Section 2 with a brief review of our theo-retical approach. In Section 3 we go on to describe ourexperimental arrangement. We consider two experimen-tal configurations. The first one that we describe is a ho-lographic setup in which our test objects are illuminatedfrom a diverging point source, the focus of a zone plate.These results are presented in Section 4. An alternativearrangement that will permit phase information to be ob-tained is that of an imaging microscope.33 We presentresults from this configuration in Section 5. In Section 6we draw together our results and conclude the paper.
2. THEORETICAL BASIS FOR THE PHASERECOVERYThe flow of optical energy must obey the continuity equa-tion for energy conservation to be obeyed. For a time-invariant, statically stationary coherent wave the conti-nuity equation has the form,
¹ • @I~r!¹f~r!# 5 0, (1)
where I(r) is the probability density and f(r) is thephase of the x radiation. With an appropriately definedphase,31 Eq. (1) is also valid for partially coherent radia-tion. It can be shown that, under most conditions, thisequation may be uniquely solved for the phase, given aknowledge of the three-dimensional intensity. In otherwords, the intensity and phase are coupled in a uniquemanner, and knowledge of one determines the other. Aconcrete example of this is the action of a perfectly trans-mitting lens. The lens changes the phase of the incidentwave, but not its amplitude, with the consequent changein intensity distribution as the light is focused upon fur-ther propagation. The direction of propagation is per-pendicular to the wave (phase) front.
In the case of an x-ray synchrotron beam, the directionof propagation of the radiation is at only a small angle tothe average beam direction. That is, it satisfies theparaxial approximation.34 In this case, Eq. (1) may berewritten in the form of the so-called transport of inten-sity equation (TIE),28,29
k]I~r!
]z5 2¹' • @I~r!¹'f~r!#, (2)
for a wave AI(r) exp@if(r)#, with irradiance I(r) andphase f(r). Here, r 5 r' 1 z, where z is the longitudi-nal optic axis and r' (5x 1 y) is the plane normal to theoptic axis, so that the gradient operator ¹' acts in theplane of r' , k is the wave number, and ]I(r)/]z is the lon-gitudinal intensity derivative. In the paraxial case, if theintensity and its longitudinal derivative are known over a
plane, the phase of the wave in that plane can be foundwithout recourse to interferometry.
Although we have assumed paraxial propagation in ob-taining Eq. (2), we note that it also holds for a sphericalincident wave under a suitable scaling of variables.35
The noninterferometric, propagation-based phase-retrieval procedure with the TIE has already been suc-cessfully applied to visible light,33 x rays,8 andelectrons.36 Our previous work in the x-ray regime as-sumed that the absorption was negligible. In this paperwe extend this work to a range of new geometries and toobjects that display substantial absorption.
In particular, we consider two distinct arrangements.The first we term holographic geometry, wherein soft xrays diverge from a diffraction-limited zone-plate focus.The diverging radiation is then used to imagemicrometer-sized objects with high magnification. Thesecond geometry uses a zone-plate lens to form a magni-fied image of the object from which the phase and ampli-tude are retrieved in what we term imaging geometry.In each case, the accuracy of the phase retrieved is deter-mined by the accuracy to which the experimental dimen-sions are known.
Before describing in detail the experiments and the re-sults, we describe the beam line used in these experi-ments.
3. SOFT X-RAY BEAM LINEThe experimental results presented in this paper were ob-tained at Sector 2 Insertion Device Branch Beamline(known as 2-ID-B) at the Advanced Photon Source,Argonne National Laboratory. The beamline forms partof the Synchrotron Radiation Instrumentation—Collaborative Access Team (known as SRI-CAT) and isoperated as a zone-plate microfocus source devoted tohigh-resolution imaging, coherent scattering, and inter-ference studies with soft x rays.37
The undulator source provides a coherent flux1010–1012 photons/s/0.1% BW) of x rays in the rangeof 0.5–7.0 keV. A series of slits, multilayer mirrors, anda spherical grating monochromator selects a collimated,monochromatic (102 –104 E/dE), 1.5 mm2 3 0.5 mm2
(FWHM) beam of x rays in the range 0.5–4.0 keV and di-rects them onto a zone plate some 60 m downstream fromthe undulator source.
With 1.8-keV x rays, the 90-mm diameter, 110-nm-thickNi zone plate with an outer zone width of 45 nm results ina 2.5% efficient first-order focal beam waist of 60 nm atthe microprobe focus approximately 6 mm from the zoneplate.
In the work described here, we use this beam line forthe two separate configurations. One uses the zone plateto produce a sharp pointlike source of light, and the sec-ond uses the zone plate as an objective lens in a simplesingle-lens microscope.
4. HOLOGRAPHIC MICROSCOPYA. Experimental SetupIn the first experiment the zone-plate focus is simply usedas a 60-nm real point source of x rays. The geometry is
1734 J. Opt. Soc. Am. A/Vol. 17, No. 10 /October 2000 Allman et al.
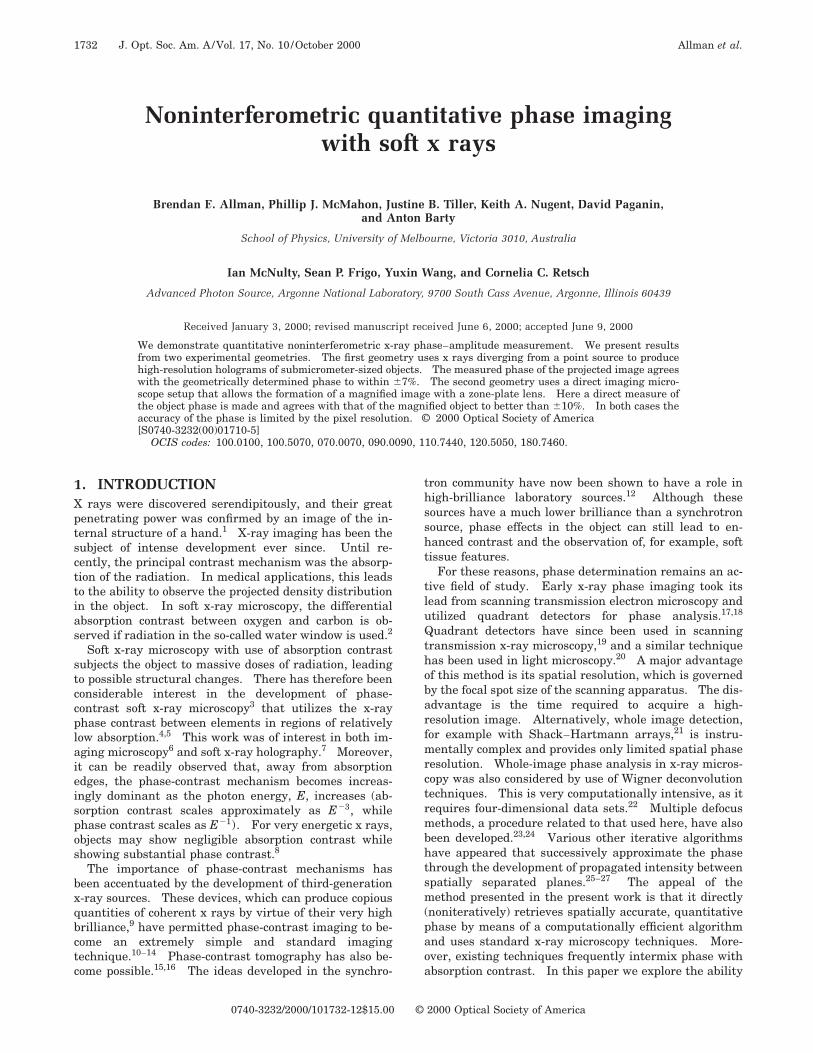
that of Gabor in-line holography,38 but with point-sourceillumination and is shown in Fig. 1. This geometry re-tains the aberration-free imaging system (not requiringobjective lenses) of in-line holography, but in a magnify-ing mode. We term this projection-imaging-geometry ho-lographic microscopy.39
In the experiment, a collimated beam of 1.83 keV(0.682 nm) x rays is focused by the zone plate to a point5.978 mm downstream of the zone plate. A 5-mm order-sorting aperture is placed within a few hundred microme-ters of the focal spot to collect the first-order flux and re-
Fig. 1. Schematic of the point-source-projection, holographic ge-ometry, noninterferometric phase-imaging experiment. Thezone plate forms a first-order focus approximately 6 mm down-stream. A 5-mm order-sorting aperture placed just before the fo-cus masks other focal orders. The focus acts as a real pointsource and illuminates the sample placed less than 2 mm away.The projected image is detected by the CCD 530 mm furtherdownstream. Images in closely spaced planes are taken bytranslating the CCD along the beam axis.
move that of higher focal orders, as well as to cut down onthe direct (zeroth-order) incident beam flux.
The sample, mounted on a rotation stage and a series oftranslation stages, is centered in the beam 1–2 mm down-stream from the zone-plate focus. X rays diverge fromthe focus, through the sample, and enter an evacuatedbeam path (to minimize beam absorption); then they aredetected by a soft x-ray CCD camera a further 500 mmdownstream of the sample.
The CCD is thinned and backside-illuminated, with1024 3 1024 pixels, each of which is 24 mm square.The focus-CCD to focus-sample distance ratio allows pro-jection magnifications of up to 5003 and spatial resolu-tion down to 50 nm. The CCD sits on a translation stageoriented longitudinally along the propagation axis, andmoving the camera permits the acquisition of intensityimages in three closely spaced planes.
In the experiment, intensity images were taken at5-mm intervals in a range of up to 40 mm so that the in-tensity difference could be optimized over a range of sepa-rations. The middle (in-focus) image of the set of threeprojected images represents the intensity distributionI0(r) for which the phase is being sought. The intensitydifference between the outer bracketing pair of (defo-cused) images is used to approximate the intensity de-rivative, ]I(r)/]z. Numerical inversion of the TIE [Eq.(2)] then provides the required phase.
The flux in the zeroth-order beam is four orders of mag-nitude times greater than the first-order focused beam se-lected by the order-sorting aperture, and so a ‘‘finger’’
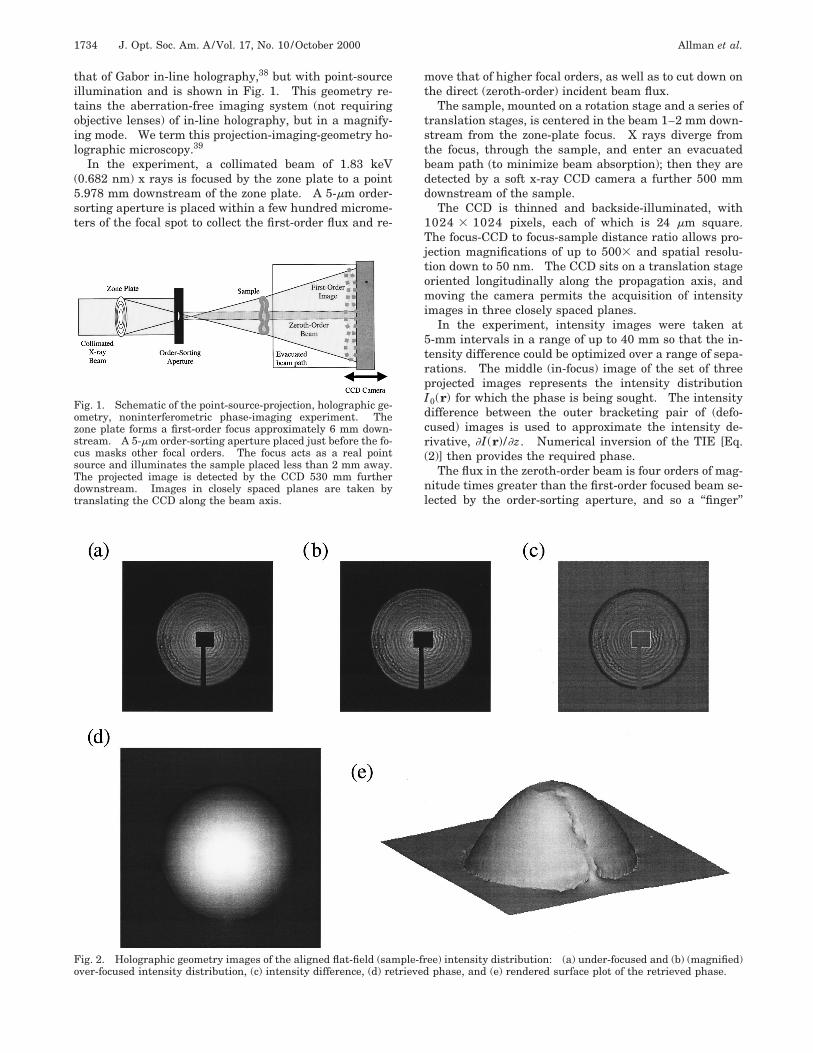
Fig. 2. Holographic geometry images of the aligned flat-field (sample-free) intensity distribution: (a) under-focused and (b) (magnified)over-focused intensity distribution, (c) intensity difference, (d) retrieved phase, and (e) rendered surface plot of the retrieved phase.

Allman et al. Vol. 17, No. 10 /October 2000 /J. Opt. Soc. Am. A 1735
beam stop at the CCD is used to mask the direct beam in-tensity. Even with the beam stop, the intensity of thezeroth-order beam is still sufficiently high at the beamstop edges to cause ‘‘blooming’’ (overflow of charge intoneighboring wells) on the CCD array. This overflow hasspurious effects on the intensity distribution and henceon the intensity derivative and ultimately on the re-trieved phase and so is later further masked in software.Another reason for masking the direct beam in software isthat the direct and the first-order beams expand at differ-ent rates. Consequently, the direct beam adds intensityto proportionally smaller areas of the first-order distribu-tion as the propagation distance increases and wouldtherefore represent a conflicting flow of optical energy tothe expanding first-order beam. An example of the zone-plate defocused intensity distribution is shown in Fig.2(a). The ‘‘finger’’ beam stop is seen entering the circulardistribution from the bottom, and the rectangular maskadded in software to remove the zeroth order and inten-sity blooming is seen at the center of the distribution.
B. Experimental ResultsThe wave-front incident on the sample will clearly con-tain some residual phase distortions from the experimen-tal apparatus. To examine these effects, it is importantthat we characterize the incident beam. As a test of ourapproach, we retrieved the phase of a nominally sphericalwave front. To do this, we take advantage of the factthat the incident beam will be essentially spherical inform, with a radius of curvature determined by the geom-
etry of the experiment. Figures 2(a) and 2(b) show a pairof 512 3 512-pixel projected intensity distributions atdistances of 510 and 550 mm from the point source. Ow-ing to the spherical wave front, they are different sizes atthe CCD, a difference made obvious by the dark border tothe intensity difference [Fig. 2(c)].
With the TIE, a spherical phase front was retrieved[Figs. 2(d) and 2(e)]. The recovered phase excursionacross the spherical distribution is 1.60 3 105 rad. Geo-metrically, the expected phase excursion is 1.53 6 0.063 105 rad; the 4% error is due to uncertainties in lengthmeasurements and lateral misalignment between the twoimages used for the intensity difference. A circular
Fig. 3. Profile through the spherical phase distribution (points),with circular fit (solid curve).
Fig. 4. Holographic geometry images of the scaled and aligned flat-field (sample-free) intensity distribution: (a) (scaled) under-focusedand (b) over-focused intensity distribution, (c) intensity difference, (d) retrieved phase, and (e) rendered surface plot of the retrievedphase.

1736 J. Opt. Soc. Am. A/Vol. 17, No. 10 /October 2000 Allman et al.
Fig. 5. Holographic geometry images of the scaled and misaligned flat-field (sample-free) intensity distribution: (a) (vertically shifted)under-focused and (b) over-focused intensity distribution, (c) intensity difference, (d) retrieved phase, and (e) rendered surface plot of theretrieved phase.
fit to a profile through this phase front is shown in Fig. 3,indicating excellent sphericity of the correct magnitudeand thus quantitative phase recovery.
Scaling the two images to the same size with imageprocessing software is equivalent to the use of collimatedillumination (as in previous experiments8,33,36) and conse-quently removes the wave-front sphericity from the recov-ered phase signal. An example of this process is seen inFig. 4. Figure 4(a) is Fig. 2(a) scaled to the size of Fig.2(b) [in this case, Fig. 4(b)]. This leaves the beam stop asthe most notable feature of the intensity derivative [Fig.4(c)]. The retrieved phase distribution is relatively flat,as seen in Figs. 4(d) and 4(e). The rendered surface ofFig. 4(e) has been plotted to the same scale as that of Fig.2(e).
Besides the spherical phase front that is due to expan-sion, there is phase (wave-front) tilt that reflects a trans-verse motion of the wave field. Therefore any misalign-ment between the outer image pair, due, say, to lateralmotion of the CCD when translated longitudinally, is re-trieved as a tilt in the phase image. As an example, theconsequence of a lateral misalignment is shown in Fig. 5.In this case Fig. 5(a) has been deliberately shifted up by10 pixels (240 mm) from Fig. 2(b) [5 Fig. 5(b)], which givesa shadowed effect to the intensity derivative [Fig. 5(c)].The resultant tilt added to the phase is shown in Figs.5(d) and 5(e). Again, the rendered surface of Fig. 5(e) isplotted on the same scale as Fig. 2(e) for comparison.
From these sample-free images, the obvious first stepin performing the phase retrieval involves optimizing the
scaling and alignment of the three images (in software) toremove spherical and tilt phase artifacts from the desiredphase effects of the sample. Next, to limit the effects ofthe zeroth-order intensity (as discussed above), it ismasked out in software. The additional air path for thelonger propagation distances leads to extra absorption,independent of the sample; so to ensure conservation offlux, the three images are normalized to the same inte-grated flux. The appropriate (also normalized) flat-fieldintensity distribution (a sample-free image taken withthe same experimental conditions) is then divided, orequivalently subtracted in the case of intensities withsmall fluctuations, from each of the bracketing images.This step removes any phase structure of the illuminatingbeam itself. Finally, we emphasize that the solution toEq. (2) does not require that the sample be nonabsorbing.As an alternative to aligning all three projected intensityimages with the inherent scaling and alignment errors,the intensity distribution in the central plane is approxi-mated as the average of the two bracketing images. Thisis advantageous for weak phase objects, for which align-ment phase effects can dominate the sample phase ef-fects.
The experimental optimization of the phase-retrievalprocedure is sample dependent, as it depends moststrongly on the phase gradient in the sample. The sys-tematic phase errors introduced by incorrect scaling andalignment may be determined geometrically, and the sta-tistical accuracy is determined by count rates. There-fore, in the absence of knowledge about the object, the
Allman et al. Vol. 17, No. 10 /October 2000 /J. Opt. Soc. Am. A 1737
data are best collected over a range of separations and ex-posure times. This is the approach used in this work.
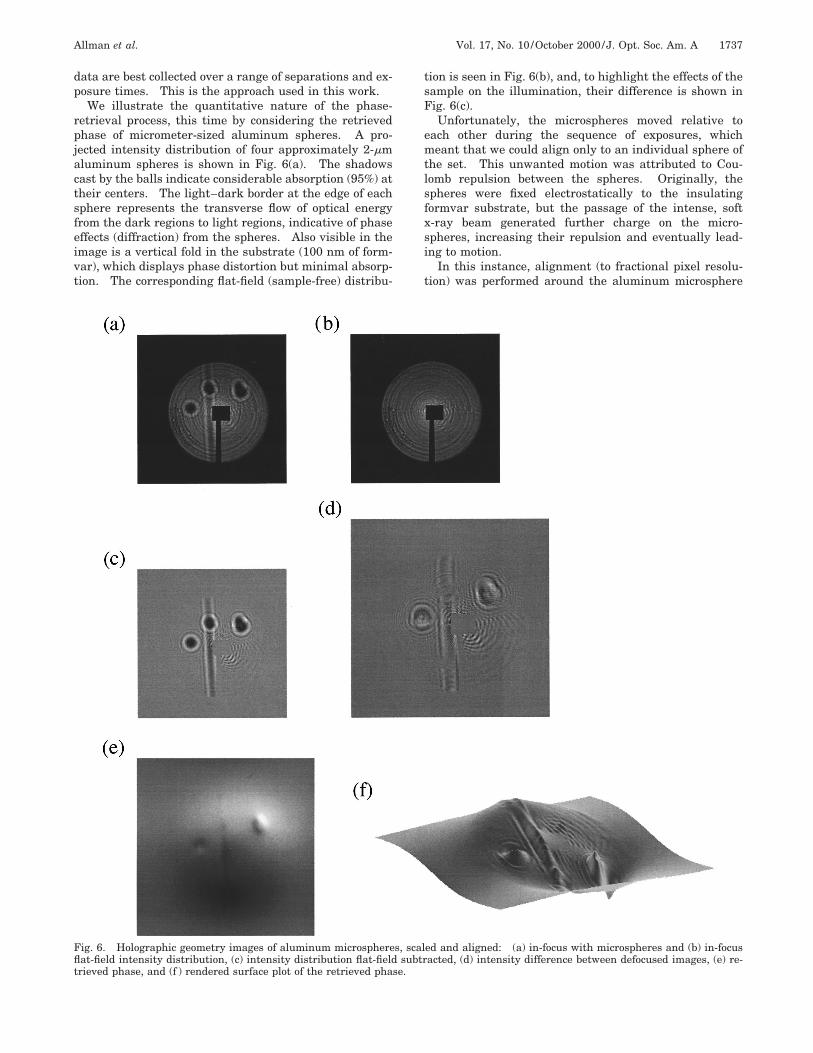
We illustrate the quantitative nature of the phase-retrieval process, this time by considering the retrievedphase of micrometer-sized aluminum spheres. A pro-jected intensity distribution of four approximately 2-mmaluminum spheres is shown in Fig. 6(a). The shadowscast by the balls indicate considerable absorption (95%) attheir centers. The light–dark border at the edge of eachsphere represents the transverse flow of optical energyfrom the dark regions to light regions, indicative of phaseeffects (diffraction) from the spheres. Also visible in theimage is a vertical fold in the substrate (100 nm of form-var), which displays phase distortion but minimal absorp-tion. The corresponding flat-field (sample-free) distribu-
tion is seen in Fig. 6(b), and, to highlight the effects of thesample on the illumination, their difference is shown inFig. 6(c).
Unfortunately, the microspheres moved relative toeach other during the sequence of exposures, whichmeant that we could align only to an individual sphere ofthe set. This unwanted motion was attributed to Cou-lomb repulsion between the spheres. Originally, thespheres were fixed electrostatically to the insulatingformvar substrate, but the passage of the intense, softx-ray beam generated further charge on the micro-spheres, increasing their repulsion and eventually lead-ing to motion.
In this instance, alignment (to fractional pixel resolu-tion) was performed around the aluminum microsphere
Fig. 6. Holographic geometry images of aluminum microspheres, scaled and aligned: (a) in-focus with microspheres and (b) in-focusflat-field intensity distribution, (c) intensity distribution flat-field subtracted, (d) intensity difference between defocused images, (e) re-trieved phase, and (f ) rendered surface plot of the retrieved phase.
1738 J. Opt. Soc. Am. A/Vol. 17, No. 10 /October 2000 Allman et al.
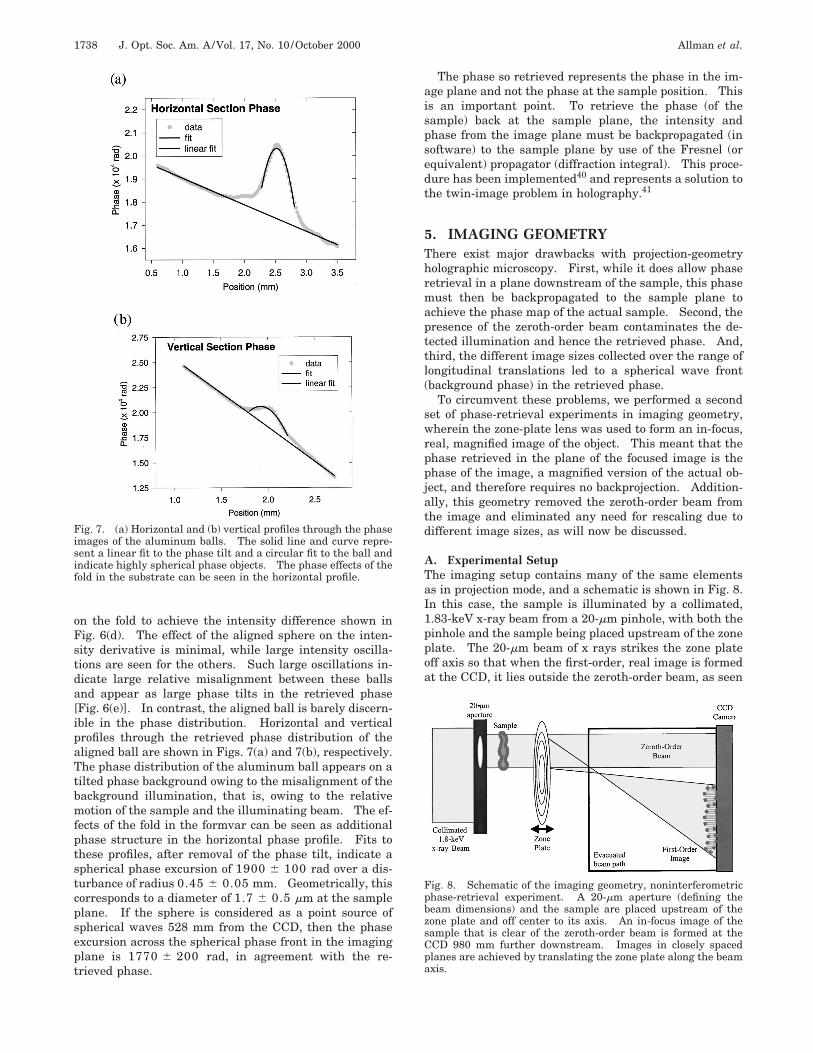
on the fold to achieve the intensity difference shown inFig. 6(d). The effect of the aligned sphere on the inten-sity derivative is minimal, while large intensity oscilla-tions are seen for the others. Such large oscillations in-dicate large relative misalignment between these ballsand appear as large phase tilts in the retrieved phase[Fig. 6(e)]. In contrast, the aligned ball is barely discern-ible in the phase distribution. Horizontal and verticalprofiles through the retrieved phase distribution of thealigned ball are shown in Figs. 7(a) and 7(b), respectively.The phase distribution of the aluminum ball appears on atilted phase background owing to the misalignment of thebackground illumination, that is, owing to the relativemotion of the sample and the illuminating beam. The ef-fects of the fold in the formvar can be seen as additionalphase structure in the horizontal phase profile. Fits tothese profiles, after removal of the phase tilt, indicate aspherical phase excursion of 1900 6 100 rad over a dis-turbance of radius 0.45 6 0.05 mm. Geometrically, thiscorresponds to a diameter of 1.7 6 0.5 mm at the sampleplane. If the sphere is considered as a point source ofspherical waves 528 mm from the CCD, then the phaseexcursion across the spherical phase front in the imagingplane is 1770 6 200 rad, in agreement with the re-trieved phase.
Fig. 7. (a) Horizontal and (b) vertical profiles through the phaseimages of the aluminum balls. The solid line and curve repre-sent a linear fit to the phase tilt and a circular fit to the ball andindicate highly spherical phase objects. The phase effects of thefold in the substrate can be seen in the horizontal profile.
The phase so retrieved represents the phase in the im-age plane and not the phase at the sample position. Thisis an important point. To retrieve the phase (of thesample) back at the sample plane, the intensity andphase from the image plane must be backpropagated (insoftware) to the sample plane by use of the Fresnel (orequivalent) propagator (diffraction integral). This proce-dure has been implemented40 and represents a solution tothe twin-image problem in holography.41
5. IMAGING GEOMETRYThere exist major drawbacks with projection-geometryholographic microscopy. First, while it does allow phaseretrieval in a plane downstream of the sample, this phasemust then be backpropagated to the sample plane toachieve the phase map of the actual sample. Second, thepresence of the zeroth-order beam contaminates the de-tected illumination and hence the retrieved phase. And,third, the different image sizes collected over the range oflongitudinal translations led to a spherical wave front(background phase) in the retrieved phase.
To circumvent these problems, we performed a secondset of phase-retrieval experiments in imaging geometry,wherein the zone-plate lens was used to form an in-focus,real, magnified image of the object. This meant that thephase retrieved in the plane of the focused image is thephase of the image, a magnified version of the actual ob-ject, and therefore requires no backprojection. Addition-ally, this geometry removed the zeroth-order beam fromthe image and eliminated any need for rescaling due todifferent image sizes, as will now be discussed.
A. Experimental SetupThe imaging setup contains many of the same elementsas in projection mode, and a schematic is shown in Fig. 8.In this case, the sample is illuminated by a collimated,1.83-keV x-ray beam from a 20-mm pinhole, with both thepinhole and the sample being placed upstream of the zoneplate. The 20-mm beam of x rays strikes the zone plateoff axis so that when the first-order, real image is formedat the CCD, it lies outside the zeroth-order beam, as seen
Fig. 8. Schematic of the imaging geometry, noninterferometricphase-retrieval experiment. A 20-mm aperture (defining thebeam dimensions) and the sample are placed upstream of thezone plate and off center to its axis. An in-focus image of thesample that is clear of the zeroth-order beam is formed at theCCD 980 mm further downstream. Images in closely spacedplanes are achieved by translating the zone plate along the beamaxis.

Allman et al. Vol. 17, No. 10 /October 2000 /J. Opt. Soc. Am. A 1739
Fig. 9. Flat-field intensity distribution in imaging geometry. (a) The in-focus first-order image is seen to be well clear of the zeroth-order direct beam. (b) A logarithmic scale image is displayed that shows the central zeroth-order beam and beam stop, the in-focus 11and out-of-focus 12 orders (upper left), and the out-of-focus 21 and 22 orders (lower right).
in Fig. 8. The lateral offset of the image is less than 1%of the propagation distance. Under these paraxial condi-tions, image aberrations are minimal.
An image of the first-order illuminating beam, free ofany zeroth-order contamination and beam stop, is shownin Fig. 9(a). The most notable feature of the image is thediffraction rings of the aperture, indicating good coher-ence properties from the synchrotron source and condi-tioning optics. The circular arcs that appear in the im-ages are artifacts of the zone-plate structure. In fact, thelarger, logarithmic-scale image shown in Fig. 9(b) dis-plays the central zeroth-order beam, beam stop, andhigher-order beams. The in-focus 11 and out-of-focus12 order images are to the upper left, and the out-of-focus21 and 22 order images are to the lower right of the im-age. To maximize magnification, the CCD (with a longerevacuated path) is now placed further downstream (980mm) from the zone plate. Placing the sample just out-side the (upstream) focal length of the zone plate forms amagnified real image on the 256 3 256-pixel CCD.When the single-lens formula was applied to this geom-etry, magnifications of 1643 were possible. We note,given the CCD pixel size, that this limited the resolutionof the system to 146 nm, which is somewhat less than theresolution of the zone plate.
In this geometry, the three closely spaced images wereachieved by translations of the zone plate along the beam(optic) axis. It is important to note that translating thezone plate left the alignment of the sample and beam-defining aperture fixed. Once again for experimental op-timization of the intensity difference, the zone plate wastranslated in steps of 50–100 mm over a range of 0.5–2mm, with a longitudinal translation stage. These small
intervals meant that there was only a 0.2% change in sizeof the imaged intensity at the CCD. This effectivelyeliminated any spherical background phase contamina-tion. However, translating the zone plate also inadvert-ently shifted it transverse to the beam axis, thereby intro-ducing a phase tilt to the circular arcs of the zone platewithin the illuminated region, even though the boundaryto the region and sample remained fixed with respect toeach other.
B. Experimental ResultsAs a standard phase object for calibration purposes, the2-mm aluminum spheres were imaged first. The images(over-focused, in-focus, and under-focused) in the threeclosely spaced planes are shown in Figs. 10(a), 10(b), and10(c), respectively. The same analysis procedure is fol-lowed as before, whereby the images are aligned and theeffects of the illuminating intensity are removed (sample-free image subtracted) in calculating the intensity differ-ence of the outer pair [Fig. 10(d)]. The retrieved phase isgiven in Figs. 10(e) and 10(f ). Removal of the back-ground phase with a high-pass filter qualitatively im-proves the prominence of the microspheres, as seen inFig. 10(g) [plotted to the same scale as Fig. 10(f )].
The size of the aluminum sphere shadow (85% absorp-tion) in Fig. 10(b) in the image plane is 360 6 24 mm,corresponding to 2.2 6 0.1-mm objects. At 1.83-keVx-ray energy, a thickness of 4.574 mm of aluminum is re-quired to achieve a 2p-phase shift. Accordingly, the alu-minum microspheres should have a phase excursion of3.0 6 0.2 rad. The retrieved phase, after being scaledby the longitudinal magnification mL (5mT
2, transversemagnification squared), has an excursion of 3.1 6 0.5

1740 J. Opt. Soc. Am. A/Vol. 17, No. 10 /October 2000 Allman et al.
Fig. 10. Imaging geometry phase retrieval. (a) Under-focus, (b) in-focus, and (c) over-focus intensity images for the aluminum micro-spheres sample. (d) The intensity difference is used to retrieve (e) the phase and (f ) rendered view. (g) A high-pass filter highlights thespheres while removing the low-frequency background signal.
rad, in excellent quantitative agreement with the knownresult. A vertical profile through the retrieved phase dis-tribution of the middle microsphere of the three is shownin Fig. 11. The phase distribution of the sphere again ap-pears on a tilted phase background owing to the misalign-ment of the illuminating beam. A circular fit to the pro-file, after removal of the phase tilt, indicates a sphericalphase distribution, as expected.
Examples of phase retrieved from other samples, in asimilar manner, were a curved section of a polycarbonateoptical fiber and a length of spider web silk, shown in theimage series of Figs. 12 and 13, respectively. In eachcase, the sequence of images displayed is the three closelyspaced intensity images, the intensity difference, the re-trieved phase, and the rendered phase, labeled (a)through (f ), respectively. The optical fiber is ;20% ab-sorbing and has been cropped to remove as much beam-
Fig. 11. Vertical profile through the phase image of the middlealuminum sphere of the three. The solid line and curve repre-sent a linear fit to the phase tilt and a circular fit to the sphereand indicate a highly spherical phase object.

Allman et al. Vol. 17, No. 10 /October 2000 /J. Opt. Soc. Am. A 1741
Fig. 12. (a) Under-focus, (b) in-focus, and (c) over-focus intensityimages for a length of polycarbonate optical fiber that has beenfolded back on itself. (d) The intensity difference is used to re-trieve (e) the phase. (f ) The rendered view gives the best visualimpression of the large phase excursion from the projectionthrough the fiber overlaying itself.
phase artifact as possible. Approximating the (undoped)polycarbonate fiber by a carbon cylinder of the same di-ameter (3.70 6 0.15 mm), we expect a phase excursion of4.95 6 0.20 rad. The phase retrieved for the optical fi-ber is 4.4 6 0.6 rad. The length of spider web silk is1.76 6 0.15 mm in diameter, and, again approximatingthis as a carbon cylinder, its phase excursion is2.35 6 0.20 rad. The retrieved phase is 2.5 6 0.4 rad,again in excellent agreement.
6. DISCUSSION AND CONCLUSIONIn this paper we have described quantitative x-rayphase–amplitude imaging with two different geometries:holographic microscopy and imaging microscopy. Thefirst of these showed, in principal, better resolution andwill be of most utility where imaging geometries are notpossible, such as with hard x radiation. However, thisapproach is able to recover the phase and amplitude onlyin the plane of observation; a true image of the object it-self will be more difficult and will require the develop-ment of robust numerical wave-propagation procedures.This is the subject of ongoing work. The second geometryused an imaging microscope and is rather better suited todirect imaging problems. However, the resolution willnot always be as high as is possible with the projectionapproach.
Both of the experimental configurations used hereshowed excellent quantitative agreement between the re-trieved and the actual (estimated) phase excursion of thesamples tested. Many of the measurements presentedhere are simply not possible with alternative approaches.For example, phase measurements are conventionallyperformed with interferometry. However, it is difficult tomake very-high-resolution phase measurements at thesewavelengths, particularly if the phase shifts are varyingvery rapidly over short-distance scales such as was thecase, for example, with the spherical wave.
In summary, we have shown that propagation-based,noninterferometric phase retrieval allows the simulta-neous collection of x-ray intensity and phase information.We have used two geometries to provide sample magnifi-cations in the range of 150–500 times, achieving quanti-tative intensity and phase images with resolution nearthe 50-nm diffraction limit of the zone-plate lens used. Itis hoped therefore that the techniques demonstrated herewill find utility in a range of applications in materials sci-ence and biology.
ACKNOWLEDGMENTSThis work was performed with support from the Austra-lian Research Council Large Grant, Fellowship and Post-graduate Award schemes, and ASRP 98/99 Proposals

1742 J. Opt. Soc. Am. A/Vol. 17, No. 10 /October 2000 Allman et al.
Fig. 13. (a) Under-focus, (b) in-focus, and (c) over-focus intensityimages for a spider silk sample. (d) The intensity difference isused to retrieve (e) the phase and (f ) the rendered view.
SRI-20 and SRI-32. We are grateful to E. Anderson forproviding the zone-plate lenses. This work was sup-ported by the U.S. Department of Energy, Basic EnergySciences, Office of Energy Research, under contract W-31-109-ENG-38.
Brendan E. Allman can be reached at the addresson the title page, by telephone at 61-3-83447403, or byfax at 61-3-93474783, or by e-mail at [email protected].
REFERENCES1. W. C. Rontgen, ‘‘On a new kind of rays,’’ Nature 53, 274–
276 (1896).2. B. X. Yang, J. Kirz, and T. K. Sham, ‘‘Oxygen K-edge ex-
tended x-ray-absorption fine-structure studies of moleculescontaining oxygen and carbon atoms,’’ Phys. Rev. A 36,4298–4310 (1987); J. Kirz, C. Jacobsen, and M. Howells,‘‘Soft x-ray microscopes and their biological applications,’’Q. Rev. Biophys. 28, 33–130 (1995).
3. G. Schmahl, D. Rudolf, and P. Guttmann, ‘‘Phase contrastx-ray microscopy experiments at the BESSY storage ring,’’in X-Ray Microscopy II, D. Sayre, M. Howells, J. Kirz, andH. Rarback, eds., Vol. 56 of Springer Series in Optical Sci-
ence (Springer-Verlag, Berlin, 1988), pp. 228–232; G.Schmahl, D. Rudolph, G. Schneider, P. Guttman, and B.Niemann, ‘‘Phase contrast x-ray microscopy studies,’’ Optik(Stuttgart), 97, 181–182 (1994).
4. J. E. Trebes, S. B. Brown, E. M. Campbell, D. L. Matthews,D. G. Nilson, G. F. Stone, and D. A. Whelan, ‘‘Demonstra-tion of x-ray holography with an x-ray laser,’’ Science 238,517–519 (1987); J. E. Trebes, K. A. Nugent, S. Mrowka, R.A. London, T. W. Barbee, M. R. Carter, J. A. Koch, B. J.MacGowan, D. L. Matthews, L. B. DaSilva, G. F. Stone, andM. D. Feit, ‘‘Measurement of the spatial coherence of a soft-x-ray laser,’’ Phys. Rev. Lett. 68, 588–591 (1992); K. A.Nugent and J. E. Trebes, ‘‘Coherence measurement tech-nique for short-wavelength light source,’’ Rev. Sci. Instrum.63, 2146–2151 (1992).
5. K. A. Nugent, ‘‘Signal to noise ratio in soft x-ray hologra-phy,’’ J. Mod. Opt. 38, 553 (1991).
6. G. Schmahl, P. Guttmann, G. Schneider, B. Niemann, C.David, T. Wilhein, J. Thieme, and D. Rudolph, ‘‘Phase con-trast studies of hydrated specimens with the x-ray micro-scope at BESSY,’’ in X-Ray Microscopy IV, A. Erko and V.Aristov, eds. (Bogorodski Pechatnik, Chernogolovka, Mos-cow Region, 1994), pp. 196–206.
7. C. Jacobsen, M. Howells, J. Kirz, and S. Rothman, ‘‘X-rayholographic microscopy using photoresist,’’ J. Opt. Soc. Am.A 7, 1847–1861 (1990).
8. K. A. Nugent, T. E. Gureyev, D. Cookson, D. Paganin, and
Allman et al. Vol. 17, No. 10 /October 2000 /J. Opt. Soc. Am. A 1743
Z. Barnea, ‘‘Quantitative phase imaging using hard x-rays,’’Phys. Rev. Lett. 77, 2961–2964 (1996).
9. See, for example, Advanced Photon Source, http://aps.anl.gov; European Synchrotron Radiation Facility,http://www.esrf.fr; Super Photon Ring, http://www.spring8.or.jp.
10. E. Forster, K. Goetz, and P. Zaumseil, ‘‘Double crystal dif-fractometry for the characterization of targets for laser-fusion experiments,’’ Krist. Tech. 15, 937–945 (1980).
11. T. J. Davis, T. E. Gureyev, D. Gao, A. W. Stevenson, and S.W. Wilkins, ‘‘X-ray image contrast from a simple phase ob-ject,’’ Phys. Rev. Lett. 74, 3173–3176 (1995); T. J. Davis, D.Gao, T. E. Gureyev, A. W. Stevenson, and S. W. Wilkins,‘‘Phase-contrast imaging of weakly absorbing materials us-ing hard x-rays,’’ Nature 373, 595–598 (1995).
12. S. W. Wilkins, T. E. Gureyev, D. Gao, A. Pogany, and A. W.Stevenson, ‘‘Phase-contrast imaging using polychromatichard x-rays,’’ Nature 384, 335–338 (1996).
13. A. Snigirev, I. Snigireva, V. Kohn, S. Kuznetsov, and I.Schelokov, ‘‘On the possibilities of x-ray phase contrast mi-croimaging by coherent high-energy synchrotron radia-tion,’’ Rev. Sci. Instrum. 66, 5486–5492 (1995).
14. P. Cloetens, R. Barrett, J. Baruchel, J.-P. Guigay, and M.Schlenker, ‘‘Phase objects in synchrotron radiation hardx-ray imaging,’’ J. Phys. D 29, 133–146 (1996).
15. A. Momose, T. Takeda, and Y. Itai, ‘‘Phase-contrast x-raycomputed tomography for observing biological specimensand organic materials,’’ Rev. Sci. Instrum. 66, 1434–1436(1995); A. Momose, T. Takeda, Y. Itai, and K. Hirano,‘‘Phase-contrast x-ray microtomography: application tohuman cancerous tissues,’’ in X-Ray Microscopy and Spec-tromicroscopy, J. Thieme, G. Schmahl, D. Rudolph, and E.Umbach, eds. (Springer-Verlag, Berlin, 1998), pp. II-207–II-211.
16. P. Cloetens, M. Pateyron-Salome, J.-Y. Buffiere, G. Peix, J.Baruchel, F. Peyrin, and M. Schlenker, ‘‘Observation of mi-crostructure and damage in materials by phase sensitiveradiography and tomography,’’ J. Appl. Phys. 81, 5878–5886 (1997).
17. H. Rose, ‘‘Nonstandard imaging methods in electron mi-croscopy,’’ Ultramicroscopy 2, 251–267 (1977).
18. E. M. Waddel and J. N. Chapman, ‘‘Linear imaging ofstrong phase objects using asymmetrical detectors inSTEM,’’ Optik (Stuttgart) 54, 83–96 (1979).
19. G. R. Morrison, A. R. Hare, and R. E. Burge, ‘‘Transmissionmicroscopy with soft x-rays,’’ in Proceedings of the Instituteof Physics Electron Microscopy and Analysis Group Confer-ence (Institute of Physics, Bristol, UK, 1987), pp. 333–336.
20. T. Wilson, A. R. Carlini, and C. J. R. Sheppard, ‘‘Phasecontrast microscopy by nearly full illumination,’’ Optik(Stuttgart) 70, 166–169 (1985).
21. R. G. Lane and M. Tallon, ‘‘Wave-front reconstruction usinga Shack–Hartmann sensor,’’ Appl. Opt. 31, 6902–6908(1992).
22. H. N. Chapman, ‘‘Phase-retrieval x-ray microscopy byWigner-distribution deconvolution,’’ Ultramicroscopy 66,153–172 (1996).
23. P. Schiske, ‘‘Image processing using additional statisticalinformation about the object,’’ in Image Processing andComputer-Aided Design in Electron Optics, P. W. Hawkes,ed. (Academic, New York, 1973), p. 82.
24. W. Coene, G. Janssen, M. Op de Beeck, and D. Van Dyck,‘‘Phase retrieval through focus variation for ultra-resolution in field-emission transmission electron micros-copy,’’ Phys. Rev. Lett. 69, 3743–3746 (1992).
25. F. Roddier and C. Roddier, ‘‘Wave-front reconstruction us-ing iterative Fourier transforms,’’ Appl. Opt. 30, 1325–1327(1991).
26. V. Yu Ivanov, V. P. Sivokon, and M. A. Vorontsov, ‘‘Phaseretrieval from a set of intensity measurements,’’ J. Opt. Soc.Am. A 9, 1515–1524 (1992).
27. P. Cloetens, W. Ludwig, J. Baruchel, D. Van Dyck, J. VanLanduyt, J. P. Guigay, and M. Schlenker, ‘‘Holotomogra-phy: quantitative phase tomography with micrometerresolution using hard synchrotron radiation x-rays,’’ Appl.Phys. Lett. 75, 2912–2914 (1999).
28. M. R. Teague, ‘‘Deterministic phase retrieval: a Green’sfunction solution,’’ J. Opt. Soc. Am. 73, 1434–1441 (1983).
29. T. E. Gureyev, A. Roberts, and K. A. Nugent, ‘‘Partially co-herent fields, the transport of intensity equation, and phaseuniqueness,’’ J. Opt. Soc. Am. A 12, 1942–1946 (1995).
30. K. Ichikawa, A. W. Lohmann, and M. Takeda, ‘‘Phase re-trieval based on the irradiance transport equation and theFourier transform method: experiments,’’ Appl. Opt. 27,3433–3436 (1988).
31. D. Paganin and K. A. Nugent, ‘‘Noninterferometric phaseimaging with partially coherent light,’’ Phys. Rev. Lett. 80,2586–2589 (1998).
32. T. E. Gureyev and K. A. Nugent, ‘‘Phase retrieval with thetransport-of-intensity equation. II. Orthogonal series so-lution for nonuniform illumination,’’ J. Opt. Soc. Am. A 13,1670–1682 (1996); T. E. Gureyev and K. A. Nugent, ‘‘Rapidquantitative phase imaging using the transport of intensityequation,’’ Opt. Commun. 133, 339–346 (1997).
33. A. Barty, K. A. Nugent, D. Paganin, and A. Roberts, ‘‘Quan-titative optical phase microscopy,’’ Opt. Lett. 23, 817–819(1998).
34. See, for example, M. Born and E. Wolf, Principles of Optics,corrected 6th ed. (Cambridge U. Press, Cambridge, UK,1998), pp. 193–194.
35. A. Pogany, D. Gao, and S. W. Wilkins, ‘‘Contrast and reso-lution in imaging with a microfocus x-ray source,’’ Rev. Sci.Instrum. 68, 2774–2782 (1997).
36. S. Bajt, A. Barty, K. A. Nugent, M. McCartney, M. Wall,and D. Paganin, ‘‘Quantitative phase-sensitive imaging in atransmission electron microscope,’’ Ultramicroscopy 83,67–73 (2000).
37. I. McNulty, A. Khounsary, Y. P. Feng, Y. Qian, J. Barraza,C. Benson, and D. Shu, ‘‘A beamline for 1-4 keV microscopyand coherence experiments at the Advanced PhotonSource,’’ Rev. Sci. Instrum. 67, 3372 (1996).
38. D. Gabor, ‘‘A new microscopic principle,’’ Nature (London)161, 777–778 (1948).
39. C. Jacobsen, M. Howells, J. Kirz, and S. Rothman, ‘‘X-rayholographic microscopy using photoresist,’’ J. Opt. Soc. Am.A 7, 1847–1861 (1990).
40. J. B. Tiller, A. Barty, D. Paganin, and K. A. Nugent, ‘‘Theholographic twin image problem: a deterministic phase so-lution,’’ Opt. Commun. (to be published).
41. See, for example, M. Born and E. Wolf, Principles of Optics,corrected 6th ed. (Cambridge U. Press, Cambridge, UK,1998), pp. 455–458.