nonlinear effects of environmental regulation on
TRANSCRIPT

Research ArticleNonlinear Effects of Environmental Regulation onEnvironmental Pollution
Yuncai Liu 12 Nengsheng Luo1 and ShushengWu3
1School of Economics and Trade Hunan University Fenglin Road 410079 Changsha Hunan China2College of Economics amp Trade Hunan University of Technology Taishan Road 412007 Zhuzhou Hunan China3State Grid Hunan Electric Power Company Limited Economic amp Technical Research InstituteXinshao Dong Road 410004 Changsha Hunan China
Correspondence should be addressed to Yuncai Liu 3329935076qqcom
Received 25 January 2019 Revised 7 March 2019 Accepted 10 March 2019 Published 27 March 2019
Academic Editor Alicia Cordero
Copyright copy 2019 Yuncai Liu et al This is an open access article distributed under the Creative Commons Attribution Licensewhich permits unrestricted use distribution and reproduction in any medium provided the original work is properly cited
This paper classifies environmental regulation into two types and constructs a theoretical framework to explore the influences of fee-based environmental regulation and invest-based environmental regulation on environmental pollution It then establishes somedynamic spatial autoregressive nonlinear econometric models to test the theoretical hypothesis based on 30-area panel data from2004 to 2016The results illustrate that inverted ldquoUrdquo shape curve relationship exists between fee-based environmental regulation andenvironmental pollution while a ldquoUrdquo shape curve relationship between invest-based environmental regulation and environmentalpollution exists In addition the findings suggest that improving the proportion of secondary industry can directly promote theenvironmental quality while effectively control of foreign direct investment and fiscal decentralization is also indispensable Thusthe government should make targeted research about the optimal intensity of fee-based environmental regulation and invest-basedenvironmental regulation and make targeted enterprise policy for the environmental pollution reduce which contains promotingthe energy revolution and strengthening the depth and strength of opening-up step by step
1 Introduction
The economic growth in the process of industrializationis accompanied by the rapid consumption of productionfactors and the massive emission of pollutants which meansthe environmental quality is inevitably eroded by pollutantseven if considering the natural purification and recyclingeffect of the ecological environment Since the reform andopening up this phenomenon has become more prominentThe main reason is industrial development without givingpriority to environmental governance In order to get ridof poverty Chinese government has gradually lowered theentry threshold of foreign-funded industries and used largeamount of foreign capital while the backward productiontechnology and the lack of infrastructure construction leadto the establishment of a simple and rough manufacturingsystem which are mainly concentrated in the southeastcoast inland provincial capital cities and subprovincial citiesFinally the extensive factor-oriented economic development
model is obtained which is difficult to be adjusted in themedium and long term and can result in the coexistence ofeconomic development and environmental deterioration
In order to achieve a win-win posture of economicdevelopment and environmental protection the governmenthas implemented environmental regulations on pollutingenterprises However the core is whether the improvement ofenvironmental quality is really promoted by environmentalregulation Then a lot of researches is conducted on thespecific impact of environmental regulation on environmen-tal pollution or productivity that are conducted by scholarsand related institutions (Christainsen and Haveman 1981Porter 1991 Porter and van der Linde 1995 Jaffe and Palmer1997 Alpay et al 2002 Gray and Shadbegian 2003 Telleand Larsson 2007 Frondel et al 2007 Lanoie et al 2011Iraldo et al 2011 Zhang et al 2011 Greenstone et al 2012Amber et al 2013 Rassier and Earnhart 2015 Wang andShen 2016 Li and Wu 2017 Galinato and Chouinard 2018)[1ndash17] While there are significant differences in the above
HindawiDiscrete Dynamics in Nature and SocietyVolume 2019 Article ID 6065396 10 pageshttpsdoiorg10115520196065396
2 Discrete Dynamics in Nature and Society
research results it was found that numerous researches arefasten on the following two aspects One is the classificationand definition of environmental regulation and the otheris research method that contains econometric model gamemodel and regression measurement
In this article we endeavor to provide an unambigu-ous understanding of nonlinear linkages between environ-mental regulation and environmental pollution by dividingthe environmental regulation into fee-based environmentalregulation and invest-based environmental regulation forsolving the following questions Is there an inverted ldquoUrdquorelationship between fee-based environmental regulation andenvironmental pollution Is there a ldquoUrdquo shape curve char-acteristic between invest-based environmental regulationand environmental pollution Will environmental pollutionhave spatial autoregressive effect The remainder of thisarticle is organized as follows Section 2 stands for theliterature review Section 3 presents the theoretical analysisand research hypothesis Section 4 represents method anddata Section 5 denotes empirical analysis And Section 6shows the conclusions and policy recommendations
2 Literature Review
The Porter Hypothesis is that appropriate environmentalregulation can encourage enterprises to carry out moreinnovation activities and these innovations will increase theproductivity of enterprises so as to offset by the cost of envi-ronmental protection Then we can use the above theoreticalbasis for analyzing the impact of environmental regulation onenvironmental pollution While applying Porter Hypothesisto analyze the effect of environmental regulation on envi-ronmental pollution the existence of compensation effectand the scale effect caused by technological progress shouldbe further studied Three distinct research statements aboutthe effect of environmental regulation on environmentalpollution are shown as follows
Some scholars believe that the environmental regulationwill aggravate the operating cost and reduce the capitalcapacity of enterprises to a greater extent which is notconducive to the improvement of environmental quality(Kneller and Manderson 2012 Rubashkina et al 2015 Liet al 2018) [18ndash20] Lanoie (2011) explored the relationshipbetween environmental policy stringency on the businessperformance and found that the innovation cannot offsetthe cost from governmental regulation [9] Rubashkina etal (2015) investigated the ldquoweakrdquo and ldquostrongrdquo versions ofPorter Hypothesis focusing on the manufacturing sectors of17 European countries between 1997 and 2009 and foundno evidence in favor of the ldquostrongrdquo Porter Hypothesisas productivity appears to be unaffected by the degree ofpollution control and abatement efforts [19] Li et al (2018)explored the impact of environmental regulation on theefficiency of technological innovation and its temporal andspatial evolution with a combined data envelopment analysismodel and found that there is no influence [20]
Some scholars believe that compensation effect can beachieved which can support porter hypothesis Then the
environmental quality can be greatly improved througheffective environmental regulation (Berman and Bui 2001Yang et al 2012 Franco and Marin 2013 Peuckert 2014Yang et al 2018) [21ndash25] Zhang et al (2011) proposed therelationship between productivity measured by MalmquistLuenberger index and environmental regulation and foundmore stringent enforcement of environmental regulation canhelp to promote the productivity [11] Franco and Marin(2013) support the above conclusions by using energy taxesstrength to proxy environmental regulation stringency inmanufacturing [23] Yang et al (2018) suggested that localgovernment may use environmental regulations to achieveeconomic objectives [25]
Other scholars believe that there is nonlinear transfor-mation between environmental regulation and environmen-tal pollution (Sanchez-Vargas et al 2013 Yin et al 2015Chakraborty and Chatterjee 2017 Xie et al 2017) [26ndash29]Sanchez-Vargas et al (2013) found that the nonlinear effectsof manufacturing productivity and environmental regulationare reflected in the size of the enterprise [26] Wang andShen (2016) showed an inverted ldquoUrdquo relationship with threethresholds between Chinarsquos environmental regulation andenvironmental productivity based on data envelopment anal-ysis model [15] Xie et al (2017) found both command-and-control and market-based environmental regulation havenonlinear shape curve with green productivity [29] Li andWu (2017) took the spatial spillover effect into spatial Durbineconometric model to explore the relationship betweenenvironmental and productivity and found environmentalregulation can improve the environmental quality by ldquorace tothe toprdquo in parts cities while deteriorating the environmentalpollution by ldquorace to the bottomrdquo in the other cities [16]
The existing research has important reference and guid-ing significance for clarifying the correlation between envi-ronmental regulation and environmental pollution but fewscholars analyze environmental regulation from the per-spective of environmental regulation funds such as fee-based environmental regulation and invest-based environ-mental regulation As a consequence this paper will establishdynamic spatial autoregressive model of 30-area panel datafrom 2004 to 2016 to explore the relationship between fee-based environmental regulation or invest-based environmen-tal regulation and environmental pollution
3 Theoretical Analysis andResearch Hypothesis
31 e Classification of Environmental Regulation Accord-ing to the instructions of the Chinese Ministry of Ecologyand Environment environmental regulation is to supply rulesand regulations restraint system mechanism and measuresto meet high quality environment of residents and societyA number of researches have been established by differentmethod (Chintrakarn 2008 Hafstead and Williams 2018)or setting different types of environmental regulation whichmainly contains command-and-control environmental reg-ulation market-based environmental regulation informalenvironmental regulation (Li and Ramanathan 2018 Peng et
Discrete Dynamics in Nature and Society 3
al 2018 Zhao et al 2018) or local and civil environmentalregulation (Li and Wu 2017) [16 30ndash34] While few scholarshave divided environmental regulation based on perspectiveof funds use which is obtained or spent from environmentalregulation then environmental regulation can be divided intofee-based environmental regulation and investment-basedenvironmental regulation referring to Yuan and Liu (2013)[35] Fee-based environmental regulation mainly representsthe regulatory expenses which include forfeiture incomeadministrative expenses and tax revenue And invest-basedenvironmental regulation focus primarily on environmentalimprovement investment expenses including technologyinvestment infrastructure construction cultivation of talentsexpenditure and so on
32 e Nonlinear Effect of Environmental Regulation onEnvironmental Pollution The government formulates pun-ishment standard of pollution by referring to the regionalenvironmental capacity pollutant discharge residentsrsquo andsociety health needs and international industry standardThe penalty proceeds shall be used as environmental gov-ernance funds to compensate for environmental losses Theexpenditure of fee-based environmental regulation would beundertaken by the polluters which will increase enterprisecost directly In response to the governmentrsquos environmentalpenalty polluting enterprises do not actively purchase effi-cient production equipment introduce advanced clean tech-nologies or recruit experienced managerial and technicalpersonnel The main reason is that they need to assess thedifference between the intensity of fee-based environmentalregulation and the enterprise costs for measures neededto reduce environmental pollution If the intensity of fee-based environmental regulation is higher than the enterprisecosts which will be used to reduce environmental pollutionpolluters would be happily to invest more enterprise internalinvestment to reduce their pollution At the same time basedon enterprise heterogeneity and information asymmetry theintensity of fee-based environmental regulation may bemorelikely lower than the enterprise costs companies tend to paypollution fines rather than halt production At this situationthe quality of local environment will not be improved or evenworsen Based on the above analysis the following hypothesisis proposed
Hypothesis 1 There are inverted ldquoUrdquo shape relationshipsbetween fee-based environmental regulation and environ-mental pollution After a certain threshold is exceededincreasing intensity of fee-based environmental regulationcan improve environmental quality
The above fee-based environmental regulation is from aregulatory perspective without any government or societysupport measures which determine that it does not makesense when the sunrise industry enterprise or some particu-larly important state-owned enterprises have strong desire toincrease enterprise green productivity without effective cap-ital or market information Then the invest-based environ-mental regulation is coming which will effectively solve thelack of funds or information to help the enterprise to improve
their technical level and cultivate professional and technicalpersonnel for reducing pollutant emissions per unit of outputThe specific methods of invest-based environmental regula-tion mainly contain special financial subsidies provide dis-count interest loans reduce corporate tax burden establishcarbon trading market cultivate environmental managementtalents define the enterprise pollutant discharge propertyrights and so on Because the invest-based environmentalregulation cannot add the enterprise cost companies willbe glad to receive the government support measures Whatneeds to be emphasized is an optimum intensity of invest-based environmental regulation If the intensity of invest-based environmental regulation is higher than the enterprisecosts that will be used to enhance environmental quality theextra fund will be used to expand production scale At thissituation invest-based environmental regulation not onlyimproves green productivity but also expands productionscale which will not be helpful to reduce pollution forldquopollutant aggregate effectrdquo because increased productivityand scale of production which greatly increases the numberof products will likely increase the total amount of pollutantemissions Therefore the following hypothesis is proposed
Hypothesis 2 There are ldquoUrdquo shaped curves between theinvest-based environmental regulation and environmentalpollution Before a certain threshold is exceeded increas-ing intensity of invest-based environmental regulation candecrease environmental pollution
4 Method and Data
41 Econometric Model Taking the different volatility ofeconomic development into consideration static economet-ric model has been established as equations (1) and (2)Moreover it has been optimized as dynamic econometricmodel as equations (3) and (4) that contain the hystericcharacteristic of environmental pollution
119871119899119875119874119871119894119905 = 1205720 + 1205721119871119899119864119873119865119894119905 + 12057221198711198991198641198731198652119894119905 + 120576119894119905 (1)
119871119899119875119874119871119894119905 = 1205730 + 1205731119871119899119864119873119868119894119905 + 12057321198711198991198641198731198682119894119905 + 120576119894119905 (2)
119871119899119875119874119871119894119905 = 1205720 + 120572119871119899119875119874119871119894119905minus1 + 1205721119871119899119864119873119865119894119905
+ 12057221198711198991198641198731198652119894119905 + 120576119894119905
(3)
119871119899119875119874119871119894119905 = 1205730 + 120573119871119899119875119874119871119894119905minus1 + 1205731119871119899119864119873119868119894119905
+ 12057321198711198991198641198731198682119894119905 + 120576119894119905
(4)
where i is the province t is the year 119875119874119871119894119905 is environ-mental pollution of year t in province i119875119874119871119894119905minus1 is the hystericcharacteristic of environmental pollution of year t in provincei 119864119873119865119894119905 is fee-based environmental regulation of year t inprovince i 1198641198731198652119894119905 is the quadratic of 119864119873119865119894119905 119864119873119868119894119905 is invest-based environmental regulation of year t in province i 1198641198731198682119894119905is the quadratic of 119864119873119868119894119905 120572119894 and 120573119894 are the parameter to beestimated
As we all know environmental pollution has strongspatial correlation On one hand pollutant can move from
4 Discrete Dynamics in Nature and Society
one place to adjacent area or other nonadjacent placesthrough air flow river flow and industrial transportationwhich can aggravate environmental pollution of the aboveareas where pollutants are transferred On the other handenvironmental governance has a certain demonstration effecton neighboring areas or areas of equal political nature Theimportant is that the demonstration effect will be furtherenhanced by the competition of political promotion cham-pionship in China The above analysis means that the spatialeffect of environmental pollution should be considered intoequations (3) and (4) Then spatial measurement models areconstructed as follows
119871119899119875119874119871119894119905 = 1205720 + 120588119882119871119899119875119874119871119894119905 + 1205721119871119899119864119873119865119894119905
+ 12057221198711198991198641198731198652119894119905 + 1205723119871119899119875119874119871119894119905minus1 + 120576119894119905
(5)
119871119899119875119874119871119894119905 = 1205730 + 120588119882119871119899119875119874119871119894119905 + 1205731119871119899119864119873119868119894119905
+ 12057321198711198991198641198731198682119894119905 + 1205733119871119899119875119874119871119894119905minus1 + 120576119894119905
(6)
In order to control the impact of other factors on envi-ronmental pollution referring to research of some scholars(Wang et al 2018 Que et al 2018 Sapkota and Bastola2017 Sghari and Hammami 2016) industrial structurefiscal decentralization foreign direct investment and localeconomic development are included in the measurementmodel as control variables [36ndash39] Adjusted econometricmodels based on equations (5) and (6) have been establishedas follows
119871119899119875119874119871119894119905 = 1205720 + 120588119882119871119899119875119874119871119894119905 + 1205721119871119899119864119873119865119894119905
+ 12057221198711198991198641198731198652119894119905 + 1205723119871119899119875119874119871119894119905minus1
+ 1205724119871119899119878119879119877119894119905 + 1205725119871119899119865119868119873119894119905+ 1205726119871119899119865119863119868119894119905 + 1205727119871119899119877119866119863119875119894119905+120576119894119905
(7)
119871119899119875119874119871119894119905 = 1205730 + 120588119882119871119899119875119874119871119894119905 + 1205731119871119899119864119873119868119894119905
+ 12057321198711198991198641198731198682119894119905 + 1205733119871119899119875119874119871119894119905minus1
+ 1205734119871119899119878119879119877119894119905 + 1205725119871119899119865119868119873119894119905+ 1205736119871119899119865119863119868119894119905 + 1205737119871119899119877119866119863119875119894119905 + 120576119894119905
(8)
where W stands for spatial weight matrix which canreflect the spatial correlation characteristic of environmen-tal pollution Second-order adjacency weight matrix andgeographical distance weight matrix are been used in thispaper for both of them can effectively denote the logisticrelationship of environmental pollution between differentareas In terms of regression method econometric model (7)and (8) may be underlying the endogenous problems whilethe generalized method of moments (GMM) (Bond 2002
Windmeijer 2005) can be valid in solving the above question[40 41]
42 Variables Settings and Data Sources
421 Environmental Pollution In order to fully reflect thetrue level of environmental pollution in various regionswater pollution air pollution and noise pollution are allincluded The weighted sum of annual per capita emissionsof various pollutants is used to represent the level of regionalenvironmental pollution (Liu and Wen 2007 Zhou andChen 2016) [42 43] Firstly the unit monetary quantitylevel of eliminating all kinds of environmental pollutionhas been adopted as the intensity of environmental pollu-tion due to the dimensional differences in contaminantsSecondly combining with pollutant discharge the regionalenvironmental pollution level can be obtained bymultiplyingand weighting In addition unit monetary quantity level ofeliminating noise pollution is measured by the one percentof GDP carbon dioxide sulfur dioxide and tobacco dustrepresent air pollutants and water pollutants are expressedin terms of per capita chemical oxygen demand for consid-ering the consistency of statistical caliber and availability ofdata
422 Independent Variables (1) Core independent variableenvironmental regulation Based on the above definitionreferring to Yuan and Liu (2013) fee-based environmen-tal regulation is measured by pollution charges levied bythe government invest-based environmental regulation ismeasured by the total amount of pollution control invest-ment and its decomposition [35] The decomposition itemsinclude urban environmental infrastructure constructioninvestment industrial pollution source management andconstruction of the ldquothree-simultaneityrdquo environmental pro-tection investment (2) Control variables The industrialstructure adopts proportion of secondary industrial outputon regional GDP to express Foreign direct investment usesproportion of the actual amount of foreign capital on regionalGDP Fiscal decentralization is measured from the self-sufficiency rate of local government fiscal revenue and self-determination rate of local government fiscal expenditureEconomic development level adopts the per capita GDPafter the adjustment of the GDP provincial price index (3)According to data availability panel data period is set from2004 to 2016 All the data are from China statistical yearbookChina financial yearbook and China environmental yearbookThe descriptive statistical results of all variables are given inTable 1
5 Empirical Analysis
51 Spatial Autocorrelation Test of Environmental PollutionAsmentioned above environmental pollution has significantspatial agglomeration effect which needs to be verifiedthrough hypothesis test Then Moranrsquos I index can be usedto test the spatial heterogeneity or agglomeration of environ-mental pollution And themathematical definition ofMoranrsquos
Discrete Dynamics in Nature and Society 5
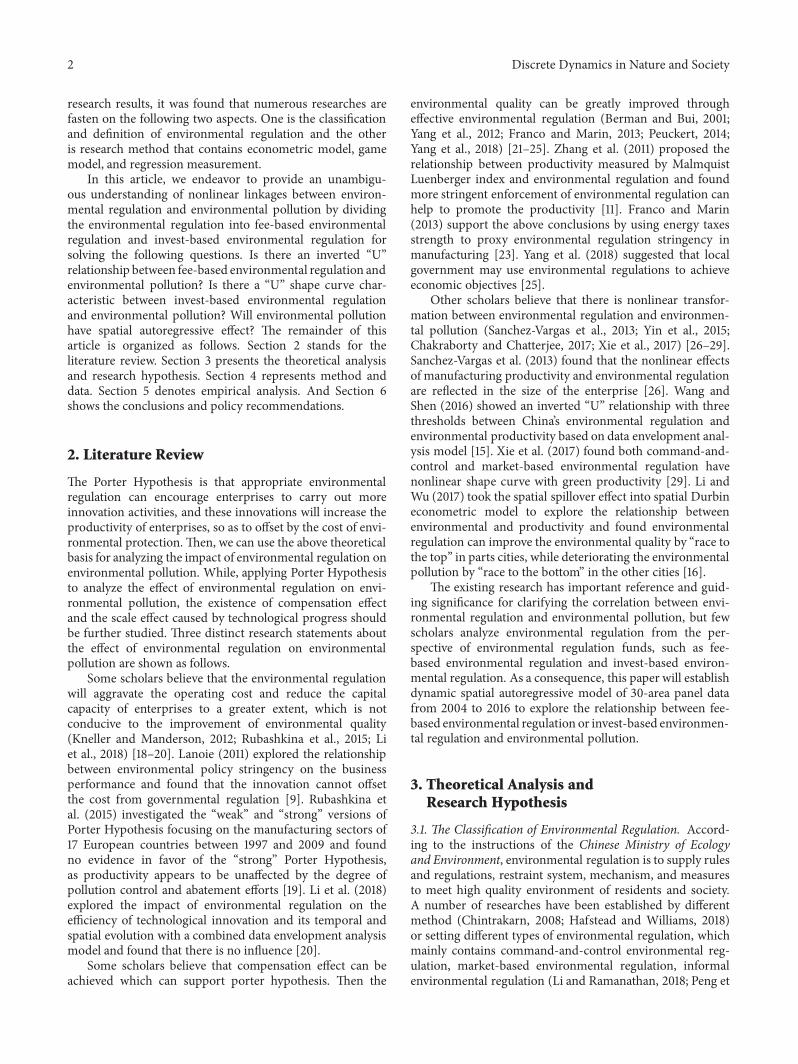
Table 1 Descriptive statistics for 390 observations
Variable Abbreviation Unit Mean Standard deviation Minimum MaximumEnvironmental pollution (Environmentalpollution is structural variable with nodimension) POL
5248 0423 4308 6329
Fee-based environmental regulationENF Ten thousand yuan
55902000 48075000 1562000 287343000
Investment environmental regulationENI Ten thousand yuan
165166 167403 5300 1416200
Urban environmental infrastructureconstruction investment ENIA Tenthousand yuan
99874 119004 1200 1262700
Industrial pollution source managementENIB Ten thousand yuan
18105 17113 0200 141600
Construction of ldquothree simultaneityrdquoenvironmental protection investmentENIC Ten thousand yuan
47184 53219 1400 399500
Industrial structure STR 48025 7676 21300 61500Foreign direct investment FDI 2496 1923 0068 8191Fiscal decentralization (Fiscaldecentralization is also structural variablewith no dimension) FIN
0453 0066 0358 0642
Economic development level RGDP Tenthousand yuan
2327 1469 0407 7442
I is as follows
1198721199001199031198861198991015840119904 119868 =sum119894 sum119895 119908119894119895 (119884119894 minus 119884) (119884119895 minus 119884)1198782sum119894sum119895 119908119894119895
(9)
1198782 =sum119894 (119884119894 minus 119884)119873 119884 =sum119894 119884119894119873
(10)
where subscripts i and j stand for the provinces i and j and119884119894 and 119884119895 denote the intensity of environmental pollution 119884represents the average of environmental pollution and 1198782 isthe variance of environmental pollution N is the number ofprovincesThe static value of environmental pollution rangesfrom -1 to 1 If it is greater than zero there is positive spatialcorrelation If it is smaller than zero there is negative spatialcorrelation The larger the absolute value of Moranrsquos I ofenvironmental pollution the higher the spatial correlationFigure 1 shows theMoranrsquos I index of environmental pollutionevery year from 2004 to 2016 based on the second-orderadjacency weight matrix and geographical distance weightmatrix Results show that all theMoranrsquos I indexes are positiveand significant at 10 significance level which indicates thatenvironmental pollution has significant spatial dependence
52 Exploring the Relationship between Fee-Based Environ-mental Regulation and Environmental Pollution Table 2shows the estimation results of dynamic spatial autoregressivemodel which explore the relationship between fee-basedenvironmental regulation and environmental pollution Aspresented in the table M1 and M2 represent regressionresults of the differential GMM and system GMM methodbased on the traditional dynamic econometric model and
M3 and M4 stand for the regression results of second-order adjacency and geographical distance method based onspatial econometric model Moreover the regression resultsin traditional dynamic measurement model (M1 M2) andspatial econometric model (M3 M4) are coincident in thesign of coefficient The test in Table 2 denotes that the spatialcorrelation coefficient is positive and significant at 5 signif-icance level (t=226 199) in M3 andM4 which indicates thatenvironmental pollution has significantly positive externali-ties consistent with the above measured Moranrsquos I indices AllL-likehood values are greater (7440021 7520418) indicatingthe spatial models are reasonable and better than M1 andM4 The Sargan test results show that there is no over-identification of tool variable
As for coefficients the regression results of LnPOL119905minus1are both positive and significant at 1 significance level Onone hand the above results show that there is a significanttransmission effect of environmental pollution which meansthe situation level of environmental pollution in the earlystage will enhance the severity of next stage of the samearea On the other hand if the environmental pollutionof the early stage is dramatically reduced it means theintensity of environmental pollution in next stage will givebetter expectations of improving environment for marketenterprise and consumer
In terms of core explanatory variable LnENF is highlypositive in all models while LnENF2 is significantly negativeindicating an inverted ldquoUrdquo relationship between fee-basedenvironmental regulation and environmental pollution illus-trating a threshold regulation strength exists From the reg-ulatory process the fee-based environmental regulation candirectly increase the enterprise environmental governance
6 Discrete Dynamics in Nature and Society
0
005
01
015
02
025
03
2004 2005 2006 2007 2008 2009 2010 2011 2012 2013 2014 2015 2016
Moranrsquos I statistic of second-order adjacencyMoranrsquos I statistic of geographical distance
Figure 1 Moranrsquos I index of environmental pollution
Table 2 Fee-based environmental regulation and regression results of environmental pollution measurement
Method Traditional dynamic measurement model Spatial econometric modelVariable D-GMM(M1) S-GMM(M2) Second-order adjacency (M3) Geographical distance (M4)
LnPOLt-1 00301lowastlowastlowast 00154lowastlowastlowast 01058lowastlowastlowast 01158lowastlowastlowast
(78812) (66509) (118802) (136522)
LnENF 00311lowastlowast 00401lowastlowast 00504lowastlowast 00471lowastlowastlowast
(20422) (22698) (20433) (42823)
LnENF2 -00075lowastlowast -00090lowastlowast -00175lowastlowast -00170lowastlowast
(-22209) (-21809) (-22240) (-21881)
LnSTR -00282lowastlowast -00154lowast -00202lowast -00104lowastlowast
(-22112) (-17846) (-18778) (-19880)
LnFDI -00003 -00045lowastlowast 00013 00045lowast
(-01064) (-21022) (11056) (19009)
LnFIN 00626lowastlowastlowast 00428lowastlowast 00526lowastlowast 00405lowastlowast
(33311) (21832) (23360) (21860)
LnRGDP 00186lowastlowastlowast 00132 00116lowastlowastlowast 00262lowastlowast
(26901) (06554) (28907) (20243)
CONS 14462lowastlowastlowast 20371lowastlowastlowast 44001lowastlowastlowast 60801lowastlowastlowast
(36304) (83354) (37709) (52034)
120588 00882lowastlowast 00963lowastlowast
(22620) (19922)L-likehood 7440021 7520418Adj-R2 06520 06678 07478 07953Sargan 00878 00982 01107 00985Note lowast lowast lowast lowastlowast and lowast respectively represent passing hypothesis tests with significance levels of 1 5 and 10
costWhile enterprise will make an assessment of the amountof environmental compensation according to the pollutionpolluted by themselves this paper shows the value assessmentis equal to the enterprise costs for measures needed to reduceenvironmental pollution In other way the enterprise costsfor measures needed to reduce environmental pollution arethe threshold Due to information asymmetry and deviationof measurement methods the intensity of fee-based envi-ronmental regulation will fluctuate around the threshold Ifthe former is less than the latter the enterprise tends topay fines to continue production for obtaining more excess
profit while if not the results will be quite different At thissituation the enterprise will purchase advanced equipmentand introduce technology and managerial talent instead ofpaying for fine
As for control variables the coefficient of LnSTR is neg-ative both significant at 10 significance level which meansmoderately enlarging the proportion of second industry shareof GDPwill not increase environmental pollutionThe resultshave largely benefited from a series of national strategieswhich mainly contain ldquoSustainable Developmentrdquo ldquoEnergyConservation and Emissions Reductionrdquo and ldquoBeauty China
Discrete Dynamics in Nature and Society 7
and Ecological CivilizationrdquoThe coefficient of variable LnFDIis negative in model M1 and M2 and positive in modelM3 and M4 The main reason is that the effect of foreigndirect investment on environmental pollution concurrently istechnology effect scale effect and structure effect indicatingthat the overall effect is uncertain All coefficients of variableLnFIN are highly significantly positive indicating that if thedegree of fiscal decentralization increases 1 the level ofenvironmental pollution will deteriorate 00626 0042800526 and 00405 correspondingly The main reasonis that fiscal decentralization provides the government agreat degree of fiscal autonomy which promotes abnormalproject approval without strict third-party evaluation andprocess system supervision Finally the above behavior willresult in low efficiency of resource allocation and is notconducive to formation of green economy developmentmodel
53 Exploring the Relationship between Invest-Based Envi-ronmental Regulation and Environmental Pollution Table 3denotes the regression results of dynamic spatial autore-gressive model for the relationship between invest-basedenvironmental regulation and environmental pollution basedon second-order adjacency weight matrix and geographi-cal distance weight matrix The core explanatory variablescontain invest-based environmental regulation and theirdecomposition which are ENIA ENIB and ENIC As shownin the table M5 and M6 are empirical of ENI M7 and M8are empirical of ENIA M9 and M10 are empirical of ENIBand M11 and M12 are empirical of ENIC On the wholeboth of the spatial coefficients are positive and significantat 5 significance level The L-likehood shows the spatialeconometric models are valid The Sargan test indicates theinstrumental variables are appropriate In addition Adj-R2 means explanatory variables can effectively analyze 75fluctuations of environmental pollution
The coefficient of variables LnENI LnENIA LnENIBand LnENIC are highly significantly negative while LnENI2LnENIA2 LnENIB2 LnENIC2 are both positive and bothof them except in M9 and M10 are significant at 10significance level The above results indicate a ldquoUrdquo shapecurve between ENI ENIA ENIB ENIC and environmentalpollution which means an optimal invest-based regulationintensity exists Because the invest-based environmentalregulation can reduce corporate environmental governancespent by different fiscal and monetary policies companieswill use government subsidies to boost green productivityand reduce pollutant emissions per unit of output It does notmake sense when the intensity of invest-based environmentalregulation is bigger than the enterprise costs for measuresneeded to reduce the environmental pollution The mainreason is the surplus government subsidies are used to expandproduction instead of continue promoting green technologywhich will probably result in the expansion of total pollutantemission Then the quality of environment will be worsethan before The important result of the above analysis tellsus the study of invest-based environmental regulation andits decomposition threshold should be strengthened As forother control variables the coefficients of LnSTR LnFDI and
LnFIN are harmonious and consistent with Table 3 whichindicates that the model is reasonable and the regressionresults are effective
6 Conclusions and Policy Recommendations
61 Conclusions By controlling industry structure foreigndirect investment and fiscal decentralization the paperestablishes a spatial autoregressive model to analyze therelationship between environmental regulation and environ-mental pollution in Chinarsquos 30 provinces municipalitiesand autonomous region during 2004 to 2016 Following theclassification of government and scholar the environmentalregulation is divided into fee-based environmental regulationand invest-based environmental regulation After empiricalanalysis an inverted ldquoUrdquo shape relationship between fee-based environmental regulation and environmental pollutionis found while a ldquoUrdquo shape curve characteristic betweeninvest-based environmental regulation and environmentalpollution is found Furthermore development of industrystructure and foreign direct investment can improve theenvironment quality while fiscal decentralization will worsenthe environmental pollution Based on the above mainconclusions the following relevant policy implications aresuggested to reduce environmental pollution
62 Policy Recommendations (1) The inverted ldquoUrdquo rela-tionship between fee-based environmental regulation andenvironmental pollution indicates that the above regulatoryshould be enhanced only if intensity of fee-based envi-ronmental regulation crosses the threshold value which isequal to the enterprise costs for measures needed to reduceenvironmental pollution The above conclusion tells us thatgovernmental regulation is useful but the precondition isto set reasonable regulation intensity This is consistent withthe study of Porters hypothesis about the compensationeffect (Porter and van der Linde 1995) and the top-to-top competition effect (Li and Wu 2017) [3 16] Firstlygovernment agencies should regularly adopt pollution dataof polluting enterprises to measure the degree of environ-mental pollution and the capacity of environmental carryingcapacity in the region According to professional theories andindustry standards the dynamic amount of compensationmoney for environmental governance is measured Secondlyformulating reasonable fee-based environmental regulationstrengthened by analyzing enterprise business benefit andbearing capacity However it does not mean the end of reg-ulation the government agencies should be timely attentiveto enterprise dynamics The government tries to achieve awin-win situation which can promote enterprises to increaseinvestment in environmental governance without affectingenterprises production in the game
(2) The ldquoUrdquo shape curve between invest-based envi-ronmental regulation and environmental pollution suggeststhat the government should not blindly intervene to helpenterprises by different preferential policies Onone hand thefunction of optimal resource allocation is left to the marketOn the other hand appropriate intervention can avoid
8 Discrete Dynamics in Nature and Society
Table3Invest-
basedenvironm
entalregulationandregressio
nresults
ofenvironm
entalp
ollutio
nmeasurement
ENI
ENIA
ENIB
ENIC
Metho
dSecond
-order
adjacency
Geographical
dista
nce
Second
-order
adjacency
Geographical
dista
nce
Second
-order
adjacency
Geographical
dista
nce
Second
-order
adjacency
Geographical
dista
nce
Varia
ble
M5
M6
M7
M8
M9
M10
M11
M12
LnPO
Lt-1
009
02lowastlowastlowast
00929lowastlowastlowast
00913lowastlowastlowast
01032lowastlowastlowast
00857lowastlowastlowast
08416lowastlowastlowast
009
07lowastlowastlowast
00967lowastlowastlowast
LnEN
I-00264lowastlowastlowast
-00165lowastlowastlowast
LnEN
I2000
76lowastlowast
000
66lowastlowast
LnEN
IA-00195lowastlowastlowast
-00208lowastlowastlowast
LnEN
IA2
00022lowastlowast
00034lowastlowast
LnEN
IB-00158lowastlowastlowast
-00098lowastlowastlowast
LnEN
IB2
000
16000
16Ln
ENIC
-00438lowastlowast
-00419lowastlowast
LnEN
IC2
00126lowast
00114lowastlowast
LnST
R-013
64lowastlowastlowast
-01136lowastlowastlowast
-0200
8lowast-01103lowast
-00772lowast
-00572lowast
-00535lowastlowastlowast
-00637lowastlowastlowast
LnFD
I-0004
6-00055
-00053lowast
-00054lowast
-00053lowast
-00052lowast
-00057
-00057
LnFIN
004
55lowastlowastlowast
004
19lowastlowastlowast
00359lowastlowast
00339lowastlowast
00371lowastlowastlowast
004
08lowastlowastlowast
00398lowastlowast
00158lowastlowast
LnRG
DP
-00213lowastlowast
-00376lowastlowast
-00062
-00062
-00725
-010
25-010
42-00954
CONS
42832
32832
-0264
8lowastlowastlowast
-04102lowastlowastlowast
113054lowastlowastlowast
1410
04lowastlowastlowast
-02573lowastlowast
-02859lowastlowast
12058802878lowastlowast
03596lowastlowast
04028lowastlowast
03096lowastlowast
02122lowastlowastlowast
02596lowastlowastlowast
03088lowastlowast
03096lowastlowast
L-lik
ehoo
d7144170
7020528
7348050
7522871
7000021
6992
487
7485521
7592
318
Adj-R
208474
07653
08418
08953
07928
07953
07778
07953
Sargan
009
0701385
0110
700984
01007
0118
501114
009
96Notelowastlowastlowastlowastlowastandlowastrespectiv
elyrepresentp
assin
ghypo
thesistests
with
significance
levelsof
15and
10
Discrete Dynamics in Nature and Society 9
deteriorating environmental quality results from enterpriseexcessive competition The above results coincide with thenonlinear effect from the perspective of investment whichis significantly different from previous scholars research(Sanchez-Vargas et al 2013 Yin et al 2015) [26 27] Thelatter tells us the government should enhance research ofthe optimal intensity of invest-based environmental regula-tion in different areas In addition the invest-based envi-ronmental regulation and fee-based environmental regula-tion should be coordinated cross-application Moreover onthe priority of two regulatory measures fee-based envi-ronmental regulation is recommended And it should bethe normal as the recently environmental tax imposed inChina
(3) Relationships between other control and environ-mental pollution illustrates that continuous optimization ofindustrial structure reasonable control of the scope of foreigndirect investment and adjustment of fiscal decentralizationin various regions are of great help to improve environmentalquality Firstly industrial production should focus on the useof clean energy and reduce the proportion of fossil energyuse at the same time Secondly the government should lowerthe threshold of foreign direct investment in an orderly waybut only if it provides efficient green production technologyThirdly local governments should strengthen the study ofoptimal fiscal decentralization Then the government triesits best to increase the transfer of environmental governanceto capital spent for improving environmental quality byoptimization and adjustment of economic structure andstrengthening targeted supervision of fiscal revenues andexpenditures
Data Availability
(1) The environmental pollution data used to support thefinding of this study have been deposited in the CNKI (ChinaNational Knowledge Infrastructure) repository and the DOIof reference paper are 103969jissn1674-8131201604011 and1013516jcnkiwes200711010 In addition the data of car-bon dioxide sulfur dioxide tobacco dust chemical oxygendemand and noise pollution used to measure environmentalpollution for supporting the findings of this study may bereleased upon application to the Chinarsquos National Bureau ofStatistics (2)The environmental regulation data used to sup-port the finding of this study have beendeposited in theCNKI(China National Knowledge Infrastructure) repository andthe DOI of reference paper is 1019361jer201301004 Inaddition the data of pollution charges levied by the gov-ernment urban environmental infrastructure constructioninvestment and industrial pollution source managementconstruction of the ldquothree-simultaneityrdquo environmental pro-tection investment used to measure environmental pollutionfor supporting the findings of this study may be releasedupon application to the Chinarsquos National Bureau of Statistics(3) The data of secondary industrial output GDP actualamount of foreign capital local government fiscal revenueand local government fiscal expenditure used to measurecontrol variables for supporting the finding of this study may
be released upon application to the Chinarsquos National Bureauof Statistics
Conflicts of Interest
The authors declare that they have no conflicts of interest
Acknowledgments
We would like to thank the Program for National SocialScience Foundation (17ZDA081) and the Program for HunanNatural Science Foundation (2015JJ2048) for their support
References
[1] G B Christainsen and R H Haveman ldquoThe contribution ofenvironmental regulations to the slowdown in productivitygrowthrdquo Journal of Environmental Economics andManagementvol 8 no 4 pp 381ndash390 1981
[2] E M Porter ldquoAmericarsquos green strategyrdquo in Business and theEnvironment A Reader vol 33 1991
[3] M E Porter and C Van Der Linde ldquoToward a new conceptionof the environment-competitiveness relationshiprdquo Journal ofEconomic Perspectives (JEP) vol 9 no 4 pp 97ndash118 1995
[4] A B Jaffe and K Palmer ldquoEnvironmental regulation andinnovation a panel data studyrdquo Review of Economics andStatistics vol 79 no 4 pp 610ndash619 1997
[5] E Alpay S Buccola and J Kerkvliet ldquoProductivity growth andenvironmental regulation in Mexican and US food manufac-turingrdquoAmerican Journal of Agricultural Economics vol 84 no4 pp 887ndash901 2002
[6] W B Gray and R J Shadbegian ldquoPlant vintage technology andenvironmental regulationrdquo Journal of Environmental Economicsand Management vol 46 no 3 pp 384ndash402 2003
[7] K Telle and J Larsson ldquoDo environmental regulations hamperproductivity growth How accounting for improvements ofplantsrsquo environmental performance can change the conclusionrdquoEcological Economics vol 61 no 2-3 pp 438ndash445 2007
[8] M Frondel J Horbach and K Rennings ldquoEnd-of-pipe orcleaner production An empirical comparison of environ-mental innovation decisions across OECD countriesrdquo BusinessStrategy and the Environment vol 16 no 8 pp 571ndash584 2007
[9] P Lanoie J Laurent-Lucchetti N Johnstone and S AmbecldquoEnvironmental policy innovation and performance newinsights on the porter hypothesisrdquo Journal of Economics ampManagement Strategy vol 20 no 3 pp 803ndash842 2011
[10] F Iraldo F Testa M Melis and M Frey ldquoA Literature reviewon the links between environmental regulation and competi-tivenessrdquo Environmental Policy and Governance vol 21 no 3pp 210ndash222 2011
[11] C Zhang H Liu H T A Bressers and K S Buchanan ldquoPro-ductivity growth and environmental regulations - accountingfor undesirable outputs analysis of Chinarsquos thirty provincialregions using the Malmquist-Luenberger indexrdquo EcologicalEconomics vol 70 no 12 pp 2369ndash2379 2011
[12] M Greenstone J List and C Syverson ldquoThe effects of environ-mental regulation on the competitiveness of US manufactur-ingrdquo NBERWorking Paper w18392 2012
10 Discrete Dynamics in Nature and Society
[13] S Ambec M A Cohen S Elgie and P Lanoie ldquoThe porterhypothesis at 20 Can environmental regulation enhance inno-vation and competitivenessrdquo Review of Environmental Eco-nomics and Policy vol 7 no 1 pp 2ndash22 2013
[14] DG Rassier andD Earnhart ldquoEffects of environmental regula-tion on actual and expected profitabilityrdquo Ecological Economicsvol 112 pp 129ndash140 2015
[15] Y Wang and N Shen ldquoEnvironmental regulation and envi-ronmental productivity the case of Chinardquo Renewable ampSustainable Energy Reviews vol 62 pp 758ndash766 2016
[16] B Li and S Wu ldquoEffects of local and civil environmentalregulation on green total factor productivity in China a spatialDurbin econometric analysisrdquo Journal of Cleaner Productionvol 153 pp 342ndash353 2017
[17] G I Galinato and H H Chouinard ldquoStrategic interactionand institutional quality determinants of environmental regula-tionsrdquo Resource and Energy Economics vol 53 pp 114ndash132 2018
[18] R Kneller and E Manderson ldquoEnvironmental regulations andinnovation activity in UK manufacturing industriesrdquo Resourceand Energy Economics vol 34 no 2 pp 211ndash235 2012
[19] Y Rubashkina M Galeotti and E Verdolini ldquoEnvironmentalregulation and competitiveness empirical evidence on thePorter Hypothesis from European manufacturing sectorsrdquoEnergy Policy vol 83 pp 288ndash300 2015
[20] H Li J Zhang CWang YWang and V Coffey ldquoAn evaluationof the impact of environmental regulation on the efficiency oftechnology innovation using the combined DEA model a casestudy of Xirsquoan Chinardquo Sustainable Cities and Society vol 42 pp355ndash369 2018
[21] B Eli and L T M Bui ldquoEnvironmental regulation and produc-tivity evidence from oil refineriesrdquo Review of Economics andStatistics vol 83 no 3 pp 498ndash510 2001
[22] H C Yang H Y Tseng and P C Chen ldquoEnvironmental regu-lations induced RD and productivity evidence from Taiwansmanufacturing industriesrdquo Resource and Energy Economics vol34 no 4 pp 514ndash532 2012
[23] C Franco and G Marin ldquoThe effect of within-sector upstreamand downstream energy taxed on innovation and productivityrdquoFEEMWorking Paper 2013
[24] J Peuckert ldquoWhat shapes the impact of environmental regu-lation on competitiveness Evidence from Executive OpinionSurveysrdquo Environmental Innovation and Societal Transitionsvol 10 pp 77ndash94 2014
[25] J Yang H Guo B Liu R Shi B Zhang and W Ye ldquoEnvi-ronmental regulation and the Pollution Haven Hypothesis doenvironmental regulationmeasures matterrdquo Journal of CleanerProduction vol 202 pp 993ndash1000 2018
[26] A Sanchez-Vargas R Mansilla-Sanchez and A Aguilar-IbarraldquoAn empirical analysis of the nonlinear relationship betweenenvironmental regulation and manufacturing productivityrdquoJournal of Applied Economics vol 16 no 2 pp 357ndash372 2013
[27] J Yin M Zheng and J Chen ldquoThe effects of environmentalregulation and technical progress on CO2 Kuznets curve anevidence from Chinardquo Energy Policy vol 77 pp 97ndash108 2015
[28] P Chakraborty and C Chatterjee ldquoDoes environmental reg-ulation indirectly induce upstream innovation New evidencefrom Indiardquo Research Policy vol 46 no 5 pp 939ndash955 2017
[29] R-H Xie Y-J Yuan and J-J Huang ldquoDifferent types of envi-ronmental regulations and heterogeneous influence on ldquogreenrdquoproductivity evidence from Chinardquo Ecological Economics vol132 pp 104ndash112 2017
[30] P Chintrakarn ldquoEnvironmental regulation and US statesrsquotechnical inefficiencyrdquo Economics Letters vol 100 no 3 pp363ndash365 2008
[31] M A C Hafstead and R C Williams ldquoUnemployment andenvironmental regulation in general equilibriumrdquo Journal ofPublic Economics vol 160 pp 50ndash65 2018
[32] R Li and R Ramanathan ldquoExploring the relationships betweendifferent types of environmental regulations and environmentalperformance evidence from Chinardquo Journal of Cleaner Produc-tion vol 196 pp 1329ndash1340 2018
[33] B Peng Y Tu E Elahi and G Wei ldquoExtended ProducerResponsibility and corporate performance effects of envi-ronmental regulation and environmental strategyrdquo Journal ofEnvironmental Management vol 218 pp 181ndash189 2018
[34] X Zhao Y Fan M Fang et al ldquoDo environmental regulationsundermine energy firm performance An empirical analysisfrom Chinas stock marketrdquo Energy Research amp Social Sciencevol 40 pp 220ndash231 2018
[35] Y Yuan and L Liu ldquoEnvironmental regulation and economicgrowth mdash a study based on the classification of economicregulationrdquo Economic Review no 1 pp 27ndash33 2017 (Chinese)
[36] Z Wang H Jia T Xu and C Xu ldquoManufacturing industrialstructure and pollutant emission an empirical study of ChinardquoJournal of Cleaner Production vol 197 pp 462ndash471 2018
[37] W Que Y Zhang S Liu and C Yang ldquoThe spatial effectof fiscal decentralization and factor market segmentation onenvironmental pollutionrdquo Journal of Cleaner Production vol184 pp 402ndash413 2018
[38] P Sapkota and U Bastola ldquoForeign direct investment incomeand environmental pollution in developing countries paneldata analysis of Latin Americardquo Energy Economics vol 64 pp206ndash212 2017
[39] M B A Sghari and S Hammami ldquoEnergy pollution andeconomic development in Tunisiardquo Energy Reports vol 2 pp35ndash39 2016
[40] S R Bond ldquoDynamic panel data models a guide to micro datamethods and practicerdquo Portuguese Economic Journal vol 1 no2 pp 141ndash162 2002
[41] F Windmeijer ldquoA finite sample correction for the variance oflinear efficient two-stepGMMestimatorsrdquo Journal of Economet-rics vol 126 no 1 pp 25ndash51 2005
[42] Y Liu and H Wen ldquoFDI environmental pollution loss andhuman capital under economic growthrdquo World EconomicResearch no 11 pp 48ndash55 2007 (Chinese)
[43] J Zhou and Y Chen ldquoEffects of fiscal decentralization andurbanization on regional environmental pollutionrdquo WesternBBS no 7 pp 92ndash100 2016 (Chinese)
Hindawiwwwhindawicom Volume 2018
MathematicsJournal of
Hindawiwwwhindawicom Volume 2018
Mathematical Problems in Engineering
Applied MathematicsJournal of
Hindawiwwwhindawicom Volume 2018
Probability and StatisticsHindawiwwwhindawicom Volume 2018
Journal of
Hindawiwwwhindawicom Volume 2018
Mathematical PhysicsAdvances in
Complex AnalysisJournal of
Hindawiwwwhindawicom Volume 2018
OptimizationJournal of
Hindawiwwwhindawicom Volume 2018
Hindawiwwwhindawicom Volume 2018
Engineering Mathematics
International Journal of
Hindawiwwwhindawicom Volume 2018
Operations ResearchAdvances in
Journal of
Hindawiwwwhindawicom Volume 2018
Function SpacesAbstract and Applied AnalysisHindawiwwwhindawicom Volume 2018
International Journal of Mathematics and Mathematical Sciences
Hindawiwwwhindawicom Volume 2018
Hindawi Publishing Corporation httpwwwhindawicom Volume 2013Hindawiwwwhindawicom
The Scientific World Journal
Volume 2018
Hindawiwwwhindawicom Volume 2018Volume 2018
Numerical AnalysisNumerical AnalysisNumerical AnalysisNumerical AnalysisNumerical AnalysisNumerical AnalysisNumerical AnalysisNumerical AnalysisNumerical AnalysisNumerical AnalysisNumerical AnalysisNumerical AnalysisAdvances inAdvances in Discrete Dynamics in
Nature and SocietyHindawiwwwhindawicom Volume 2018
Hindawiwwwhindawicom
Dierential EquationsInternational Journal of
Volume 2018
Hindawiwwwhindawicom Volume 2018
Decision SciencesAdvances in
Hindawiwwwhindawicom Volume 2018
AnalysisInternational Journal of
Hindawiwwwhindawicom Volume 2018
Stochastic AnalysisInternational Journal of
Submit your manuscripts atwwwhindawicom
2 Discrete Dynamics in Nature and Society
research results it was found that numerous researches arefasten on the following two aspects One is the classificationand definition of environmental regulation and the otheris research method that contains econometric model gamemodel and regression measurement
In this article we endeavor to provide an unambigu-ous understanding of nonlinear linkages between environ-mental regulation and environmental pollution by dividingthe environmental regulation into fee-based environmentalregulation and invest-based environmental regulation forsolving the following questions Is there an inverted ldquoUrdquorelationship between fee-based environmental regulation andenvironmental pollution Is there a ldquoUrdquo shape curve char-acteristic between invest-based environmental regulationand environmental pollution Will environmental pollutionhave spatial autoregressive effect The remainder of thisarticle is organized as follows Section 2 stands for theliterature review Section 3 presents the theoretical analysisand research hypothesis Section 4 represents method anddata Section 5 denotes empirical analysis And Section 6shows the conclusions and policy recommendations
2 Literature Review
The Porter Hypothesis is that appropriate environmentalregulation can encourage enterprises to carry out moreinnovation activities and these innovations will increase theproductivity of enterprises so as to offset by the cost of envi-ronmental protection Then we can use the above theoreticalbasis for analyzing the impact of environmental regulation onenvironmental pollution While applying Porter Hypothesisto analyze the effect of environmental regulation on envi-ronmental pollution the existence of compensation effectand the scale effect caused by technological progress shouldbe further studied Three distinct research statements aboutthe effect of environmental regulation on environmentalpollution are shown as follows
Some scholars believe that the environmental regulationwill aggravate the operating cost and reduce the capitalcapacity of enterprises to a greater extent which is notconducive to the improvement of environmental quality(Kneller and Manderson 2012 Rubashkina et al 2015 Liet al 2018) [18ndash20] Lanoie (2011) explored the relationshipbetween environmental policy stringency on the businessperformance and found that the innovation cannot offsetthe cost from governmental regulation [9] Rubashkina etal (2015) investigated the ldquoweakrdquo and ldquostrongrdquo versions ofPorter Hypothesis focusing on the manufacturing sectors of17 European countries between 1997 and 2009 and foundno evidence in favor of the ldquostrongrdquo Porter Hypothesisas productivity appears to be unaffected by the degree ofpollution control and abatement efforts [19] Li et al (2018)explored the impact of environmental regulation on theefficiency of technological innovation and its temporal andspatial evolution with a combined data envelopment analysismodel and found that there is no influence [20]
Some scholars believe that compensation effect can beachieved which can support porter hypothesis Then the
environmental quality can be greatly improved througheffective environmental regulation (Berman and Bui 2001Yang et al 2012 Franco and Marin 2013 Peuckert 2014Yang et al 2018) [21ndash25] Zhang et al (2011) proposed therelationship between productivity measured by MalmquistLuenberger index and environmental regulation and foundmore stringent enforcement of environmental regulation canhelp to promote the productivity [11] Franco and Marin(2013) support the above conclusions by using energy taxesstrength to proxy environmental regulation stringency inmanufacturing [23] Yang et al (2018) suggested that localgovernment may use environmental regulations to achieveeconomic objectives [25]
Other scholars believe that there is nonlinear transfor-mation between environmental regulation and environmen-tal pollution (Sanchez-Vargas et al 2013 Yin et al 2015Chakraborty and Chatterjee 2017 Xie et al 2017) [26ndash29]Sanchez-Vargas et al (2013) found that the nonlinear effectsof manufacturing productivity and environmental regulationare reflected in the size of the enterprise [26] Wang andShen (2016) showed an inverted ldquoUrdquo relationship with threethresholds between Chinarsquos environmental regulation andenvironmental productivity based on data envelopment anal-ysis model [15] Xie et al (2017) found both command-and-control and market-based environmental regulation havenonlinear shape curve with green productivity [29] Li andWu (2017) took the spatial spillover effect into spatial Durbineconometric model to explore the relationship betweenenvironmental and productivity and found environmentalregulation can improve the environmental quality by ldquorace tothe toprdquo in parts cities while deteriorating the environmentalpollution by ldquorace to the bottomrdquo in the other cities [16]
The existing research has important reference and guid-ing significance for clarifying the correlation between envi-ronmental regulation and environmental pollution but fewscholars analyze environmental regulation from the per-spective of environmental regulation funds such as fee-based environmental regulation and invest-based environ-mental regulation As a consequence this paper will establishdynamic spatial autoregressive model of 30-area panel datafrom 2004 to 2016 to explore the relationship between fee-based environmental regulation or invest-based environmen-tal regulation and environmental pollution
3 Theoretical Analysis andResearch Hypothesis
31 e Classification of Environmental Regulation Accord-ing to the instructions of the Chinese Ministry of Ecologyand Environment environmental regulation is to supply rulesand regulations restraint system mechanism and measuresto meet high quality environment of residents and societyA number of researches have been established by differentmethod (Chintrakarn 2008 Hafstead and Williams 2018)or setting different types of environmental regulation whichmainly contains command-and-control environmental reg-ulation market-based environmental regulation informalenvironmental regulation (Li and Ramanathan 2018 Peng et
Discrete Dynamics in Nature and Society 3
al 2018 Zhao et al 2018) or local and civil environmentalregulation (Li and Wu 2017) [16 30ndash34] While few scholarshave divided environmental regulation based on perspectiveof funds use which is obtained or spent from environmentalregulation then environmental regulation can be divided intofee-based environmental regulation and investment-basedenvironmental regulation referring to Yuan and Liu (2013)[35] Fee-based environmental regulation mainly representsthe regulatory expenses which include forfeiture incomeadministrative expenses and tax revenue And invest-basedenvironmental regulation focus primarily on environmentalimprovement investment expenses including technologyinvestment infrastructure construction cultivation of talentsexpenditure and so on
32 e Nonlinear Effect of Environmental Regulation onEnvironmental Pollution The government formulates pun-ishment standard of pollution by referring to the regionalenvironmental capacity pollutant discharge residentsrsquo andsociety health needs and international industry standardThe penalty proceeds shall be used as environmental gov-ernance funds to compensate for environmental losses Theexpenditure of fee-based environmental regulation would beundertaken by the polluters which will increase enterprisecost directly In response to the governmentrsquos environmentalpenalty polluting enterprises do not actively purchase effi-cient production equipment introduce advanced clean tech-nologies or recruit experienced managerial and technicalpersonnel The main reason is that they need to assess thedifference between the intensity of fee-based environmentalregulation and the enterprise costs for measures neededto reduce environmental pollution If the intensity of fee-based environmental regulation is higher than the enterprisecosts which will be used to reduce environmental pollutionpolluters would be happily to invest more enterprise internalinvestment to reduce their pollution At the same time basedon enterprise heterogeneity and information asymmetry theintensity of fee-based environmental regulation may bemorelikely lower than the enterprise costs companies tend to paypollution fines rather than halt production At this situationthe quality of local environment will not be improved or evenworsen Based on the above analysis the following hypothesisis proposed
Hypothesis 1 There are inverted ldquoUrdquo shape relationshipsbetween fee-based environmental regulation and environ-mental pollution After a certain threshold is exceededincreasing intensity of fee-based environmental regulationcan improve environmental quality
The above fee-based environmental regulation is from aregulatory perspective without any government or societysupport measures which determine that it does not makesense when the sunrise industry enterprise or some particu-larly important state-owned enterprises have strong desire toincrease enterprise green productivity without effective cap-ital or market information Then the invest-based environ-mental regulation is coming which will effectively solve thelack of funds or information to help the enterprise to improve
their technical level and cultivate professional and technicalpersonnel for reducing pollutant emissions per unit of outputThe specific methods of invest-based environmental regula-tion mainly contain special financial subsidies provide dis-count interest loans reduce corporate tax burden establishcarbon trading market cultivate environmental managementtalents define the enterprise pollutant discharge propertyrights and so on Because the invest-based environmentalregulation cannot add the enterprise cost companies willbe glad to receive the government support measures Whatneeds to be emphasized is an optimum intensity of invest-based environmental regulation If the intensity of invest-based environmental regulation is higher than the enterprisecosts that will be used to enhance environmental quality theextra fund will be used to expand production scale At thissituation invest-based environmental regulation not onlyimproves green productivity but also expands productionscale which will not be helpful to reduce pollution forldquopollutant aggregate effectrdquo because increased productivityand scale of production which greatly increases the numberof products will likely increase the total amount of pollutantemissions Therefore the following hypothesis is proposed
Hypothesis 2 There are ldquoUrdquo shaped curves between theinvest-based environmental regulation and environmentalpollution Before a certain threshold is exceeded increas-ing intensity of invest-based environmental regulation candecrease environmental pollution
4 Method and Data
41 Econometric Model Taking the different volatility ofeconomic development into consideration static economet-ric model has been established as equations (1) and (2)Moreover it has been optimized as dynamic econometricmodel as equations (3) and (4) that contain the hystericcharacteristic of environmental pollution
119871119899119875119874119871119894119905 = 1205720 + 1205721119871119899119864119873119865119894119905 + 12057221198711198991198641198731198652119894119905 + 120576119894119905 (1)
119871119899119875119874119871119894119905 = 1205730 + 1205731119871119899119864119873119868119894119905 + 12057321198711198991198641198731198682119894119905 + 120576119894119905 (2)
119871119899119875119874119871119894119905 = 1205720 + 120572119871119899119875119874119871119894119905minus1 + 1205721119871119899119864119873119865119894119905
+ 12057221198711198991198641198731198652119894119905 + 120576119894119905
(3)
119871119899119875119874119871119894119905 = 1205730 + 120573119871119899119875119874119871119894119905minus1 + 1205731119871119899119864119873119868119894119905
+ 12057321198711198991198641198731198682119894119905 + 120576119894119905
(4)
where i is the province t is the year 119875119874119871119894119905 is environ-mental pollution of year t in province i119875119874119871119894119905minus1 is the hystericcharacteristic of environmental pollution of year t in provincei 119864119873119865119894119905 is fee-based environmental regulation of year t inprovince i 1198641198731198652119894119905 is the quadratic of 119864119873119865119894119905 119864119873119868119894119905 is invest-based environmental regulation of year t in province i 1198641198731198682119894119905is the quadratic of 119864119873119868119894119905 120572119894 and 120573119894 are the parameter to beestimated
As we all know environmental pollution has strongspatial correlation On one hand pollutant can move from
4 Discrete Dynamics in Nature and Society
one place to adjacent area or other nonadjacent placesthrough air flow river flow and industrial transportationwhich can aggravate environmental pollution of the aboveareas where pollutants are transferred On the other handenvironmental governance has a certain demonstration effecton neighboring areas or areas of equal political nature Theimportant is that the demonstration effect will be furtherenhanced by the competition of political promotion cham-pionship in China The above analysis means that the spatialeffect of environmental pollution should be considered intoequations (3) and (4) Then spatial measurement models areconstructed as follows
119871119899119875119874119871119894119905 = 1205720 + 120588119882119871119899119875119874119871119894119905 + 1205721119871119899119864119873119865119894119905
+ 12057221198711198991198641198731198652119894119905 + 1205723119871119899119875119874119871119894119905minus1 + 120576119894119905
(5)
119871119899119875119874119871119894119905 = 1205730 + 120588119882119871119899119875119874119871119894119905 + 1205731119871119899119864119873119868119894119905
+ 12057321198711198991198641198731198682119894119905 + 1205733119871119899119875119874119871119894119905minus1 + 120576119894119905
(6)
In order to control the impact of other factors on envi-ronmental pollution referring to research of some scholars(Wang et al 2018 Que et al 2018 Sapkota and Bastola2017 Sghari and Hammami 2016) industrial structurefiscal decentralization foreign direct investment and localeconomic development are included in the measurementmodel as control variables [36ndash39] Adjusted econometricmodels based on equations (5) and (6) have been establishedas follows
119871119899119875119874119871119894119905 = 1205720 + 120588119882119871119899119875119874119871119894119905 + 1205721119871119899119864119873119865119894119905
+ 12057221198711198991198641198731198652119894119905 + 1205723119871119899119875119874119871119894119905minus1
+ 1205724119871119899119878119879119877119894119905 + 1205725119871119899119865119868119873119894119905+ 1205726119871119899119865119863119868119894119905 + 1205727119871119899119877119866119863119875119894119905+120576119894119905
(7)
119871119899119875119874119871119894119905 = 1205730 + 120588119882119871119899119875119874119871119894119905 + 1205731119871119899119864119873119868119894119905
+ 12057321198711198991198641198731198682119894119905 + 1205733119871119899119875119874119871119894119905minus1
+ 1205734119871119899119878119879119877119894119905 + 1205725119871119899119865119868119873119894119905+ 1205736119871119899119865119863119868119894119905 + 1205737119871119899119877119866119863119875119894119905 + 120576119894119905
(8)
where W stands for spatial weight matrix which canreflect the spatial correlation characteristic of environmen-tal pollution Second-order adjacency weight matrix andgeographical distance weight matrix are been used in thispaper for both of them can effectively denote the logisticrelationship of environmental pollution between differentareas In terms of regression method econometric model (7)and (8) may be underlying the endogenous problems whilethe generalized method of moments (GMM) (Bond 2002
Windmeijer 2005) can be valid in solving the above question[40 41]
42 Variables Settings and Data Sources
421 Environmental Pollution In order to fully reflect thetrue level of environmental pollution in various regionswater pollution air pollution and noise pollution are allincluded The weighted sum of annual per capita emissionsof various pollutants is used to represent the level of regionalenvironmental pollution (Liu and Wen 2007 Zhou andChen 2016) [42 43] Firstly the unit monetary quantitylevel of eliminating all kinds of environmental pollutionhas been adopted as the intensity of environmental pollu-tion due to the dimensional differences in contaminantsSecondly combining with pollutant discharge the regionalenvironmental pollution level can be obtained bymultiplyingand weighting In addition unit monetary quantity level ofeliminating noise pollution is measured by the one percentof GDP carbon dioxide sulfur dioxide and tobacco dustrepresent air pollutants and water pollutants are expressedin terms of per capita chemical oxygen demand for consid-ering the consistency of statistical caliber and availability ofdata
422 Independent Variables (1) Core independent variableenvironmental regulation Based on the above definitionreferring to Yuan and Liu (2013) fee-based environmen-tal regulation is measured by pollution charges levied bythe government invest-based environmental regulation ismeasured by the total amount of pollution control invest-ment and its decomposition [35] The decomposition itemsinclude urban environmental infrastructure constructioninvestment industrial pollution source management andconstruction of the ldquothree-simultaneityrdquo environmental pro-tection investment (2) Control variables The industrialstructure adopts proportion of secondary industrial outputon regional GDP to express Foreign direct investment usesproportion of the actual amount of foreign capital on regionalGDP Fiscal decentralization is measured from the self-sufficiency rate of local government fiscal revenue and self-determination rate of local government fiscal expenditureEconomic development level adopts the per capita GDPafter the adjustment of the GDP provincial price index (3)According to data availability panel data period is set from2004 to 2016 All the data are from China statistical yearbookChina financial yearbook and China environmental yearbookThe descriptive statistical results of all variables are given inTable 1
5 Empirical Analysis
51 Spatial Autocorrelation Test of Environmental PollutionAsmentioned above environmental pollution has significantspatial agglomeration effect which needs to be verifiedthrough hypothesis test Then Moranrsquos I index can be usedto test the spatial heterogeneity or agglomeration of environ-mental pollution And themathematical definition ofMoranrsquos
Discrete Dynamics in Nature and Society 5
Table 1 Descriptive statistics for 390 observations
Variable Abbreviation Unit Mean Standard deviation Minimum MaximumEnvironmental pollution (Environmentalpollution is structural variable with nodimension) POL
5248 0423 4308 6329
Fee-based environmental regulationENF Ten thousand yuan
55902000 48075000 1562000 287343000
Investment environmental regulationENI Ten thousand yuan
165166 167403 5300 1416200
Urban environmental infrastructureconstruction investment ENIA Tenthousand yuan
99874 119004 1200 1262700
Industrial pollution source managementENIB Ten thousand yuan
18105 17113 0200 141600
Construction of ldquothree simultaneityrdquoenvironmental protection investmentENIC Ten thousand yuan
47184 53219 1400 399500
Industrial structure STR 48025 7676 21300 61500Foreign direct investment FDI 2496 1923 0068 8191Fiscal decentralization (Fiscaldecentralization is also structural variablewith no dimension) FIN
0453 0066 0358 0642
Economic development level RGDP Tenthousand yuan
2327 1469 0407 7442
I is as follows
1198721199001199031198861198991015840119904 119868 =sum119894 sum119895 119908119894119895 (119884119894 minus 119884) (119884119895 minus 119884)1198782sum119894sum119895 119908119894119895
(9)
1198782 =sum119894 (119884119894 minus 119884)119873 119884 =sum119894 119884119894119873
(10)
where subscripts i and j stand for the provinces i and j and119884119894 and 119884119895 denote the intensity of environmental pollution 119884represents the average of environmental pollution and 1198782 isthe variance of environmental pollution N is the number ofprovincesThe static value of environmental pollution rangesfrom -1 to 1 If it is greater than zero there is positive spatialcorrelation If it is smaller than zero there is negative spatialcorrelation The larger the absolute value of Moranrsquos I ofenvironmental pollution the higher the spatial correlationFigure 1 shows theMoranrsquos I index of environmental pollutionevery year from 2004 to 2016 based on the second-orderadjacency weight matrix and geographical distance weightmatrix Results show that all theMoranrsquos I indexes are positiveand significant at 10 significance level which indicates thatenvironmental pollution has significant spatial dependence
52 Exploring the Relationship between Fee-Based Environ-mental Regulation and Environmental Pollution Table 2shows the estimation results of dynamic spatial autoregressivemodel which explore the relationship between fee-basedenvironmental regulation and environmental pollution Aspresented in the table M1 and M2 represent regressionresults of the differential GMM and system GMM methodbased on the traditional dynamic econometric model and
M3 and M4 stand for the regression results of second-order adjacency and geographical distance method based onspatial econometric model Moreover the regression resultsin traditional dynamic measurement model (M1 M2) andspatial econometric model (M3 M4) are coincident in thesign of coefficient The test in Table 2 denotes that the spatialcorrelation coefficient is positive and significant at 5 signif-icance level (t=226 199) in M3 andM4 which indicates thatenvironmental pollution has significantly positive externali-ties consistent with the above measured Moranrsquos I indices AllL-likehood values are greater (7440021 7520418) indicatingthe spatial models are reasonable and better than M1 andM4 The Sargan test results show that there is no over-identification of tool variable
As for coefficients the regression results of LnPOL119905minus1are both positive and significant at 1 significance level Onone hand the above results show that there is a significanttransmission effect of environmental pollution which meansthe situation level of environmental pollution in the earlystage will enhance the severity of next stage of the samearea On the other hand if the environmental pollutionof the early stage is dramatically reduced it means theintensity of environmental pollution in next stage will givebetter expectations of improving environment for marketenterprise and consumer
In terms of core explanatory variable LnENF is highlypositive in all models while LnENF2 is significantly negativeindicating an inverted ldquoUrdquo relationship between fee-basedenvironmental regulation and environmental pollution illus-trating a threshold regulation strength exists From the reg-ulatory process the fee-based environmental regulation candirectly increase the enterprise environmental governance
6 Discrete Dynamics in Nature and Society
0
005
01
015
02
025
03
2004 2005 2006 2007 2008 2009 2010 2011 2012 2013 2014 2015 2016
Moranrsquos I statistic of second-order adjacencyMoranrsquos I statistic of geographical distance
Figure 1 Moranrsquos I index of environmental pollution
Table 2 Fee-based environmental regulation and regression results of environmental pollution measurement
Method Traditional dynamic measurement model Spatial econometric modelVariable D-GMM(M1) S-GMM(M2) Second-order adjacency (M3) Geographical distance (M4)
LnPOLt-1 00301lowastlowastlowast 00154lowastlowastlowast 01058lowastlowastlowast 01158lowastlowastlowast
(78812) (66509) (118802) (136522)
LnENF 00311lowastlowast 00401lowastlowast 00504lowastlowast 00471lowastlowastlowast
(20422) (22698) (20433) (42823)
LnENF2 -00075lowastlowast -00090lowastlowast -00175lowastlowast -00170lowastlowast
(-22209) (-21809) (-22240) (-21881)
LnSTR -00282lowastlowast -00154lowast -00202lowast -00104lowastlowast
(-22112) (-17846) (-18778) (-19880)
LnFDI -00003 -00045lowastlowast 00013 00045lowast
(-01064) (-21022) (11056) (19009)
LnFIN 00626lowastlowastlowast 00428lowastlowast 00526lowastlowast 00405lowastlowast
(33311) (21832) (23360) (21860)
LnRGDP 00186lowastlowastlowast 00132 00116lowastlowastlowast 00262lowastlowast
(26901) (06554) (28907) (20243)
CONS 14462lowastlowastlowast 20371lowastlowastlowast 44001lowastlowastlowast 60801lowastlowastlowast
(36304) (83354) (37709) (52034)
120588 00882lowastlowast 00963lowastlowast
(22620) (19922)L-likehood 7440021 7520418Adj-R2 06520 06678 07478 07953Sargan 00878 00982 01107 00985Note lowast lowast lowast lowastlowast and lowast respectively represent passing hypothesis tests with significance levels of 1 5 and 10
costWhile enterprise will make an assessment of the amountof environmental compensation according to the pollutionpolluted by themselves this paper shows the value assessmentis equal to the enterprise costs for measures needed to reduceenvironmental pollution In other way the enterprise costsfor measures needed to reduce environmental pollution arethe threshold Due to information asymmetry and deviationof measurement methods the intensity of fee-based envi-ronmental regulation will fluctuate around the threshold Ifthe former is less than the latter the enterprise tends topay fines to continue production for obtaining more excess
profit while if not the results will be quite different At thissituation the enterprise will purchase advanced equipmentand introduce technology and managerial talent instead ofpaying for fine
As for control variables the coefficient of LnSTR is neg-ative both significant at 10 significance level which meansmoderately enlarging the proportion of second industry shareof GDPwill not increase environmental pollutionThe resultshave largely benefited from a series of national strategieswhich mainly contain ldquoSustainable Developmentrdquo ldquoEnergyConservation and Emissions Reductionrdquo and ldquoBeauty China
Discrete Dynamics in Nature and Society 7
and Ecological CivilizationrdquoThe coefficient of variable LnFDIis negative in model M1 and M2 and positive in modelM3 and M4 The main reason is that the effect of foreigndirect investment on environmental pollution concurrently istechnology effect scale effect and structure effect indicatingthat the overall effect is uncertain All coefficients of variableLnFIN are highly significantly positive indicating that if thedegree of fiscal decentralization increases 1 the level ofenvironmental pollution will deteriorate 00626 0042800526 and 00405 correspondingly The main reasonis that fiscal decentralization provides the government agreat degree of fiscal autonomy which promotes abnormalproject approval without strict third-party evaluation andprocess system supervision Finally the above behavior willresult in low efficiency of resource allocation and is notconducive to formation of green economy developmentmodel
53 Exploring the Relationship between Invest-Based Envi-ronmental Regulation and Environmental Pollution Table 3denotes the regression results of dynamic spatial autore-gressive model for the relationship between invest-basedenvironmental regulation and environmental pollution basedon second-order adjacency weight matrix and geographi-cal distance weight matrix The core explanatory variablescontain invest-based environmental regulation and theirdecomposition which are ENIA ENIB and ENIC As shownin the table M5 and M6 are empirical of ENI M7 and M8are empirical of ENIA M9 and M10 are empirical of ENIBand M11 and M12 are empirical of ENIC On the wholeboth of the spatial coefficients are positive and significantat 5 significance level The L-likehood shows the spatialeconometric models are valid The Sargan test indicates theinstrumental variables are appropriate In addition Adj-R2 means explanatory variables can effectively analyze 75fluctuations of environmental pollution
The coefficient of variables LnENI LnENIA LnENIBand LnENIC are highly significantly negative while LnENI2LnENIA2 LnENIB2 LnENIC2 are both positive and bothof them except in M9 and M10 are significant at 10significance level The above results indicate a ldquoUrdquo shapecurve between ENI ENIA ENIB ENIC and environmentalpollution which means an optimal invest-based regulationintensity exists Because the invest-based environmentalregulation can reduce corporate environmental governancespent by different fiscal and monetary policies companieswill use government subsidies to boost green productivityand reduce pollutant emissions per unit of output It does notmake sense when the intensity of invest-based environmentalregulation is bigger than the enterprise costs for measuresneeded to reduce the environmental pollution The mainreason is the surplus government subsidies are used to expandproduction instead of continue promoting green technologywhich will probably result in the expansion of total pollutantemission Then the quality of environment will be worsethan before The important result of the above analysis tellsus the study of invest-based environmental regulation andits decomposition threshold should be strengthened As forother control variables the coefficients of LnSTR LnFDI and
LnFIN are harmonious and consistent with Table 3 whichindicates that the model is reasonable and the regressionresults are effective
6 Conclusions and Policy Recommendations
61 Conclusions By controlling industry structure foreigndirect investment and fiscal decentralization the paperestablishes a spatial autoregressive model to analyze therelationship between environmental regulation and environ-mental pollution in Chinarsquos 30 provinces municipalitiesand autonomous region during 2004 to 2016 Following theclassification of government and scholar the environmentalregulation is divided into fee-based environmental regulationand invest-based environmental regulation After empiricalanalysis an inverted ldquoUrdquo shape relationship between fee-based environmental regulation and environmental pollutionis found while a ldquoUrdquo shape curve characteristic betweeninvest-based environmental regulation and environmentalpollution is found Furthermore development of industrystructure and foreign direct investment can improve theenvironment quality while fiscal decentralization will worsenthe environmental pollution Based on the above mainconclusions the following relevant policy implications aresuggested to reduce environmental pollution
62 Policy Recommendations (1) The inverted ldquoUrdquo rela-tionship between fee-based environmental regulation andenvironmental pollution indicates that the above regulatoryshould be enhanced only if intensity of fee-based envi-ronmental regulation crosses the threshold value which isequal to the enterprise costs for measures needed to reduceenvironmental pollution The above conclusion tells us thatgovernmental regulation is useful but the precondition isto set reasonable regulation intensity This is consistent withthe study of Porters hypothesis about the compensationeffect (Porter and van der Linde 1995) and the top-to-top competition effect (Li and Wu 2017) [3 16] Firstlygovernment agencies should regularly adopt pollution dataof polluting enterprises to measure the degree of environ-mental pollution and the capacity of environmental carryingcapacity in the region According to professional theories andindustry standards the dynamic amount of compensationmoney for environmental governance is measured Secondlyformulating reasonable fee-based environmental regulationstrengthened by analyzing enterprise business benefit andbearing capacity However it does not mean the end of reg-ulation the government agencies should be timely attentiveto enterprise dynamics The government tries to achieve awin-win situation which can promote enterprises to increaseinvestment in environmental governance without affectingenterprises production in the game
(2) The ldquoUrdquo shape curve between invest-based envi-ronmental regulation and environmental pollution suggeststhat the government should not blindly intervene to helpenterprises by different preferential policies Onone hand thefunction of optimal resource allocation is left to the marketOn the other hand appropriate intervention can avoid
8 Discrete Dynamics in Nature and Society
Table3Invest-
basedenvironm
entalregulationandregressio
nresults
ofenvironm
entalp
ollutio
nmeasurement
ENI
ENIA
ENIB
ENIC
Metho
dSecond
-order
adjacency
Geographical
dista
nce
Second
-order
adjacency
Geographical
dista
nce
Second
-order
adjacency
Geographical
dista
nce
Second
-order
adjacency
Geographical
dista
nce
Varia
ble
M5
M6
M7
M8
M9
M10
M11
M12
LnPO
Lt-1
009
02lowastlowastlowast
00929lowastlowastlowast
00913lowastlowastlowast
01032lowastlowastlowast
00857lowastlowastlowast
08416lowastlowastlowast
009
07lowastlowastlowast
00967lowastlowastlowast
LnEN
I-00264lowastlowastlowast
-00165lowastlowastlowast
LnEN
I2000
76lowastlowast
000
66lowastlowast
LnEN
IA-00195lowastlowastlowast
-00208lowastlowastlowast
LnEN
IA2
00022lowastlowast
00034lowastlowast
LnEN
IB-00158lowastlowastlowast
-00098lowastlowastlowast
LnEN
IB2
000
16000
16Ln
ENIC
-00438lowastlowast
-00419lowastlowast
LnEN
IC2
00126lowast
00114lowastlowast
LnST
R-013
64lowastlowastlowast
-01136lowastlowastlowast
-0200
8lowast-01103lowast
-00772lowast
-00572lowast
-00535lowastlowastlowast
-00637lowastlowastlowast
LnFD
I-0004
6-00055
-00053lowast
-00054lowast
-00053lowast
-00052lowast
-00057
-00057
LnFIN
004
55lowastlowastlowast
004
19lowastlowastlowast
00359lowastlowast
00339lowastlowast
00371lowastlowastlowast
004
08lowastlowastlowast
00398lowastlowast
00158lowastlowast
LnRG
DP
-00213lowastlowast
-00376lowastlowast
-00062
-00062
-00725
-010
25-010
42-00954
CONS
42832
32832
-0264
8lowastlowastlowast
-04102lowastlowastlowast
113054lowastlowastlowast
1410
04lowastlowastlowast
-02573lowastlowast
-02859lowastlowast
12058802878lowastlowast
03596lowastlowast
04028lowastlowast
03096lowastlowast
02122lowastlowastlowast
02596lowastlowastlowast
03088lowastlowast
03096lowastlowast
L-lik
ehoo
d7144170
7020528
7348050
7522871
7000021
6992
487
7485521
7592
318
Adj-R
208474
07653
08418
08953
07928
07953
07778
07953
Sargan
009
0701385
0110
700984
01007
0118
501114
009
96Notelowastlowastlowastlowastlowastandlowastrespectiv
elyrepresentp
assin
ghypo
thesistests
with
significance
levelsof
15and
10
Discrete Dynamics in Nature and Society 9
deteriorating environmental quality results from enterpriseexcessive competition The above results coincide with thenonlinear effect from the perspective of investment whichis significantly different from previous scholars research(Sanchez-Vargas et al 2013 Yin et al 2015) [26 27] Thelatter tells us the government should enhance research ofthe optimal intensity of invest-based environmental regula-tion in different areas In addition the invest-based envi-ronmental regulation and fee-based environmental regula-tion should be coordinated cross-application Moreover onthe priority of two regulatory measures fee-based envi-ronmental regulation is recommended And it should bethe normal as the recently environmental tax imposed inChina
(3) Relationships between other control and environ-mental pollution illustrates that continuous optimization ofindustrial structure reasonable control of the scope of foreigndirect investment and adjustment of fiscal decentralizationin various regions are of great help to improve environmentalquality Firstly industrial production should focus on the useof clean energy and reduce the proportion of fossil energyuse at the same time Secondly the government should lowerthe threshold of foreign direct investment in an orderly waybut only if it provides efficient green production technologyThirdly local governments should strengthen the study ofoptimal fiscal decentralization Then the government triesits best to increase the transfer of environmental governanceto capital spent for improving environmental quality byoptimization and adjustment of economic structure andstrengthening targeted supervision of fiscal revenues andexpenditures
Data Availability
(1) The environmental pollution data used to support thefinding of this study have been deposited in the CNKI (ChinaNational Knowledge Infrastructure) repository and the DOIof reference paper are 103969jissn1674-8131201604011 and1013516jcnkiwes200711010 In addition the data of car-bon dioxide sulfur dioxide tobacco dust chemical oxygendemand and noise pollution used to measure environmentalpollution for supporting the findings of this study may bereleased upon application to the Chinarsquos National Bureau ofStatistics (2)The environmental regulation data used to sup-port the finding of this study have beendeposited in theCNKI(China National Knowledge Infrastructure) repository andthe DOI of reference paper is 1019361jer201301004 Inaddition the data of pollution charges levied by the gov-ernment urban environmental infrastructure constructioninvestment and industrial pollution source managementconstruction of the ldquothree-simultaneityrdquo environmental pro-tection investment used to measure environmental pollutionfor supporting the findings of this study may be releasedupon application to the Chinarsquos National Bureau of Statistics(3) The data of secondary industrial output GDP actualamount of foreign capital local government fiscal revenueand local government fiscal expenditure used to measurecontrol variables for supporting the finding of this study may
be released upon application to the Chinarsquos National Bureauof Statistics
Conflicts of Interest
The authors declare that they have no conflicts of interest
Acknowledgments
We would like to thank the Program for National SocialScience Foundation (17ZDA081) and the Program for HunanNatural Science Foundation (2015JJ2048) for their support
References
[1] G B Christainsen and R H Haveman ldquoThe contribution ofenvironmental regulations to the slowdown in productivitygrowthrdquo Journal of Environmental Economics andManagementvol 8 no 4 pp 381ndash390 1981
[2] E M Porter ldquoAmericarsquos green strategyrdquo in Business and theEnvironment A Reader vol 33 1991
[3] M E Porter and C Van Der Linde ldquoToward a new conceptionof the environment-competitiveness relationshiprdquo Journal ofEconomic Perspectives (JEP) vol 9 no 4 pp 97ndash118 1995
[4] A B Jaffe and K Palmer ldquoEnvironmental regulation andinnovation a panel data studyrdquo Review of Economics andStatistics vol 79 no 4 pp 610ndash619 1997
[5] E Alpay S Buccola and J Kerkvliet ldquoProductivity growth andenvironmental regulation in Mexican and US food manufac-turingrdquoAmerican Journal of Agricultural Economics vol 84 no4 pp 887ndash901 2002
[6] W B Gray and R J Shadbegian ldquoPlant vintage technology andenvironmental regulationrdquo Journal of Environmental Economicsand Management vol 46 no 3 pp 384ndash402 2003
[7] K Telle and J Larsson ldquoDo environmental regulations hamperproductivity growth How accounting for improvements ofplantsrsquo environmental performance can change the conclusionrdquoEcological Economics vol 61 no 2-3 pp 438ndash445 2007
[8] M Frondel J Horbach and K Rennings ldquoEnd-of-pipe orcleaner production An empirical comparison of environ-mental innovation decisions across OECD countriesrdquo BusinessStrategy and the Environment vol 16 no 8 pp 571ndash584 2007
[9] P Lanoie J Laurent-Lucchetti N Johnstone and S AmbecldquoEnvironmental policy innovation and performance newinsights on the porter hypothesisrdquo Journal of Economics ampManagement Strategy vol 20 no 3 pp 803ndash842 2011
[10] F Iraldo F Testa M Melis and M Frey ldquoA Literature reviewon the links between environmental regulation and competi-tivenessrdquo Environmental Policy and Governance vol 21 no 3pp 210ndash222 2011
[11] C Zhang H Liu H T A Bressers and K S Buchanan ldquoPro-ductivity growth and environmental regulations - accountingfor undesirable outputs analysis of Chinarsquos thirty provincialregions using the Malmquist-Luenberger indexrdquo EcologicalEconomics vol 70 no 12 pp 2369ndash2379 2011
[12] M Greenstone J List and C Syverson ldquoThe effects of environ-mental regulation on the competitiveness of US manufactur-ingrdquo NBERWorking Paper w18392 2012
10 Discrete Dynamics in Nature and Society
[13] S Ambec M A Cohen S Elgie and P Lanoie ldquoThe porterhypothesis at 20 Can environmental regulation enhance inno-vation and competitivenessrdquo Review of Environmental Eco-nomics and Policy vol 7 no 1 pp 2ndash22 2013
[14] DG Rassier andD Earnhart ldquoEffects of environmental regula-tion on actual and expected profitabilityrdquo Ecological Economicsvol 112 pp 129ndash140 2015
[15] Y Wang and N Shen ldquoEnvironmental regulation and envi-ronmental productivity the case of Chinardquo Renewable ampSustainable Energy Reviews vol 62 pp 758ndash766 2016
[16] B Li and S Wu ldquoEffects of local and civil environmentalregulation on green total factor productivity in China a spatialDurbin econometric analysisrdquo Journal of Cleaner Productionvol 153 pp 342ndash353 2017
[17] G I Galinato and H H Chouinard ldquoStrategic interactionand institutional quality determinants of environmental regula-tionsrdquo Resource and Energy Economics vol 53 pp 114ndash132 2018
[18] R Kneller and E Manderson ldquoEnvironmental regulations andinnovation activity in UK manufacturing industriesrdquo Resourceand Energy Economics vol 34 no 2 pp 211ndash235 2012
[19] Y Rubashkina M Galeotti and E Verdolini ldquoEnvironmentalregulation and competitiveness empirical evidence on thePorter Hypothesis from European manufacturing sectorsrdquoEnergy Policy vol 83 pp 288ndash300 2015
[20] H Li J Zhang CWang YWang and V Coffey ldquoAn evaluationof the impact of environmental regulation on the efficiency oftechnology innovation using the combined DEA model a casestudy of Xirsquoan Chinardquo Sustainable Cities and Society vol 42 pp355ndash369 2018
[21] B Eli and L T M Bui ldquoEnvironmental regulation and produc-tivity evidence from oil refineriesrdquo Review of Economics andStatistics vol 83 no 3 pp 498ndash510 2001
[22] H C Yang H Y Tseng and P C Chen ldquoEnvironmental regu-lations induced RD and productivity evidence from Taiwansmanufacturing industriesrdquo Resource and Energy Economics vol34 no 4 pp 514ndash532 2012
[23] C Franco and G Marin ldquoThe effect of within-sector upstreamand downstream energy taxed on innovation and productivityrdquoFEEMWorking Paper 2013
[24] J Peuckert ldquoWhat shapes the impact of environmental regu-lation on competitiveness Evidence from Executive OpinionSurveysrdquo Environmental Innovation and Societal Transitionsvol 10 pp 77ndash94 2014
[25] J Yang H Guo B Liu R Shi B Zhang and W Ye ldquoEnvi-ronmental regulation and the Pollution Haven Hypothesis doenvironmental regulationmeasures matterrdquo Journal of CleanerProduction vol 202 pp 993ndash1000 2018
[26] A Sanchez-Vargas R Mansilla-Sanchez and A Aguilar-IbarraldquoAn empirical analysis of the nonlinear relationship betweenenvironmental regulation and manufacturing productivityrdquoJournal of Applied Economics vol 16 no 2 pp 357ndash372 2013
[27] J Yin M Zheng and J Chen ldquoThe effects of environmentalregulation and technical progress on CO2 Kuznets curve anevidence from Chinardquo Energy Policy vol 77 pp 97ndash108 2015
[28] P Chakraborty and C Chatterjee ldquoDoes environmental reg-ulation indirectly induce upstream innovation New evidencefrom Indiardquo Research Policy vol 46 no 5 pp 939ndash955 2017
[29] R-H Xie Y-J Yuan and J-J Huang ldquoDifferent types of envi-ronmental regulations and heterogeneous influence on ldquogreenrdquoproductivity evidence from Chinardquo Ecological Economics vol132 pp 104ndash112 2017
[30] P Chintrakarn ldquoEnvironmental regulation and US statesrsquotechnical inefficiencyrdquo Economics Letters vol 100 no 3 pp363ndash365 2008
[31] M A C Hafstead and R C Williams ldquoUnemployment andenvironmental regulation in general equilibriumrdquo Journal ofPublic Economics vol 160 pp 50ndash65 2018
[32] R Li and R Ramanathan ldquoExploring the relationships betweendifferent types of environmental regulations and environmentalperformance evidence from Chinardquo Journal of Cleaner Produc-tion vol 196 pp 1329ndash1340 2018
[33] B Peng Y Tu E Elahi and G Wei ldquoExtended ProducerResponsibility and corporate performance effects of envi-ronmental regulation and environmental strategyrdquo Journal ofEnvironmental Management vol 218 pp 181ndash189 2018
[34] X Zhao Y Fan M Fang et al ldquoDo environmental regulationsundermine energy firm performance An empirical analysisfrom Chinas stock marketrdquo Energy Research amp Social Sciencevol 40 pp 220ndash231 2018
[35] Y Yuan and L Liu ldquoEnvironmental regulation and economicgrowth mdash a study based on the classification of economicregulationrdquo Economic Review no 1 pp 27ndash33 2017 (Chinese)
[36] Z Wang H Jia T Xu and C Xu ldquoManufacturing industrialstructure and pollutant emission an empirical study of ChinardquoJournal of Cleaner Production vol 197 pp 462ndash471 2018
[37] W Que Y Zhang S Liu and C Yang ldquoThe spatial effectof fiscal decentralization and factor market segmentation onenvironmental pollutionrdquo Journal of Cleaner Production vol184 pp 402ndash413 2018
[38] P Sapkota and U Bastola ldquoForeign direct investment incomeand environmental pollution in developing countries paneldata analysis of Latin Americardquo Energy Economics vol 64 pp206ndash212 2017
[39] M B A Sghari and S Hammami ldquoEnergy pollution andeconomic development in Tunisiardquo Energy Reports vol 2 pp35ndash39 2016
[40] S R Bond ldquoDynamic panel data models a guide to micro datamethods and practicerdquo Portuguese Economic Journal vol 1 no2 pp 141ndash162 2002
[41] F Windmeijer ldquoA finite sample correction for the variance oflinear efficient two-stepGMMestimatorsrdquo Journal of Economet-rics vol 126 no 1 pp 25ndash51 2005
[42] Y Liu and H Wen ldquoFDI environmental pollution loss andhuman capital under economic growthrdquo World EconomicResearch no 11 pp 48ndash55 2007 (Chinese)
[43] J Zhou and Y Chen ldquoEffects of fiscal decentralization andurbanization on regional environmental pollutionrdquo WesternBBS no 7 pp 92ndash100 2016 (Chinese)
Hindawiwwwhindawicom Volume 2018
MathematicsJournal of
Hindawiwwwhindawicom Volume 2018
Mathematical Problems in Engineering
Applied MathematicsJournal of
Hindawiwwwhindawicom Volume 2018
Probability and StatisticsHindawiwwwhindawicom Volume 2018
Journal of
Hindawiwwwhindawicom Volume 2018
Mathematical PhysicsAdvances in
Complex AnalysisJournal of
Hindawiwwwhindawicom Volume 2018
OptimizationJournal of
Hindawiwwwhindawicom Volume 2018
Hindawiwwwhindawicom Volume 2018
Engineering Mathematics
International Journal of
Hindawiwwwhindawicom Volume 2018
Operations ResearchAdvances in
Journal of
Hindawiwwwhindawicom Volume 2018
Function SpacesAbstract and Applied AnalysisHindawiwwwhindawicom Volume 2018
International Journal of Mathematics and Mathematical Sciences
Hindawiwwwhindawicom Volume 2018
Hindawi Publishing Corporation httpwwwhindawicom Volume 2013Hindawiwwwhindawicom
The Scientific World Journal
Volume 2018
Hindawiwwwhindawicom Volume 2018Volume 2018
Numerical AnalysisNumerical AnalysisNumerical AnalysisNumerical AnalysisNumerical AnalysisNumerical AnalysisNumerical AnalysisNumerical AnalysisNumerical AnalysisNumerical AnalysisNumerical AnalysisNumerical AnalysisAdvances inAdvances in Discrete Dynamics in
Nature and SocietyHindawiwwwhindawicom Volume 2018
Hindawiwwwhindawicom
Dierential EquationsInternational Journal of
Volume 2018
Hindawiwwwhindawicom Volume 2018
Decision SciencesAdvances in
Hindawiwwwhindawicom Volume 2018
AnalysisInternational Journal of
Hindawiwwwhindawicom Volume 2018
Stochastic AnalysisInternational Journal of
Submit your manuscripts atwwwhindawicom
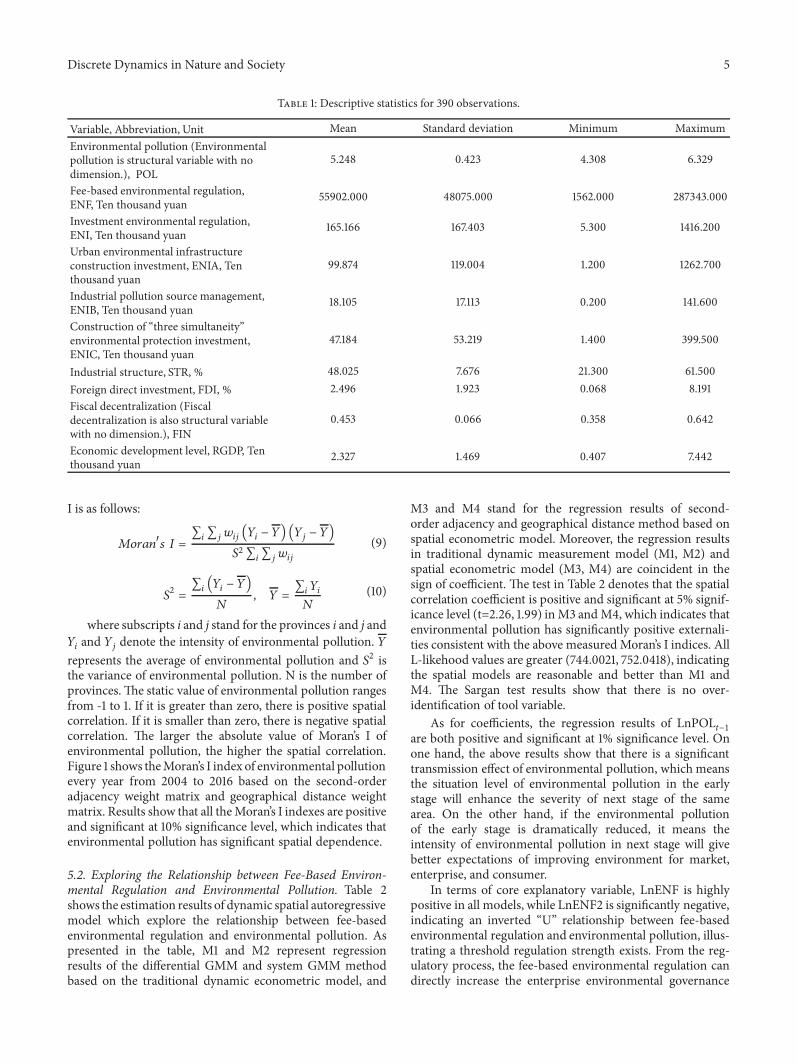

Hindawiwwwhindawicom Volume 2018
MathematicsJournal of
Hindawiwwwhindawicom Volume 2018
Mathematical Problems in Engineering
Applied MathematicsJournal of
Hindawiwwwhindawicom Volume 2018
Probability and StatisticsHindawiwwwhindawicom Volume 2018
Journal of
Hindawiwwwhindawicom Volume 2018
Mathematical PhysicsAdvances in
Complex AnalysisJournal of
Hindawiwwwhindawicom Volume 2018
OptimizationJournal of
Hindawiwwwhindawicom Volume 2018
Hindawiwwwhindawicom Volume 2018
Engineering Mathematics
International Journal of
Hindawiwwwhindawicom Volume 2018
Operations ResearchAdvances in
Journal of
Hindawiwwwhindawicom Volume 2018
Function SpacesAbstract and Applied AnalysisHindawiwwwhindawicom Volume 2018
International Journal of Mathematics and Mathematical Sciences
Hindawiwwwhindawicom Volume 2018
Hindawi Publishing Corporation httpwwwhindawicom Volume 2013Hindawiwwwhindawicom
The Scientific World Journal
Volume 2018
Hindawiwwwhindawicom Volume 2018Volume 2018
Numerical AnalysisNumerical AnalysisNumerical AnalysisNumerical AnalysisNumerical AnalysisNumerical AnalysisNumerical AnalysisNumerical AnalysisNumerical AnalysisNumerical AnalysisNumerical AnalysisNumerical AnalysisAdvances inAdvances in Discrete Dynamics in
Nature and SocietyHindawiwwwhindawicom Volume 2018
Hindawiwwwhindawicom
Dierential EquationsInternational Journal of
Volume 2018
Hindawiwwwhindawicom Volume 2018
Decision SciencesAdvances in
Hindawiwwwhindawicom Volume 2018
AnalysisInternational Journal of
Hindawiwwwhindawicom Volume 2018
Stochastic AnalysisInternational Journal of
Submit your manuscripts atwwwhindawicom