nonlinear feature extraction for objective classification of...
TRANSCRIPT
Seediscussions,stats,andauthorprofilesforthispublicationat:https://www.researchgate.net/publication/281260308
Nonlinearfeatureextractionforobjective
classificationofcomplexauditorybrainstem
responsestodiotic...
ArticleinAuris,nasus,larynx·August2015
DOI:10.1016/j.anl.2015.06.003·Source:PubMed
CITATIONS
2
READS
143
7authors,including:
Someoftheauthorsofthispublicationarealsoworkingontheserelatedprojects:
ModelinginlearningViewproject
ControltheThree-LinkMusculoskeletalArmViewproject
AmirSalarJafarpisheh
UniversityofSocialWelfareandRehabilitatio…
12PUBLICATIONS12CITATIONS
SEEPROFILE
AmirHomayounJafari
TehranUniversityofMedicalSciences
56PUBLICATIONS288CITATIONS
SEEPROFILE
MohammadjavadAbolhassani
TehranUniversityofMedicalSciences
35PUBLICATIONS141CITATIONS
SEEPROFILE
AkramPourbakht
IranUniversityofMedicalSciences
53PUBLICATIONS253CITATIONS
SEEPROFILE
AllcontentfollowingthispagewasuploadedbyAmirSalarJafarpishehon29September2015.
Theuserhasrequestedenhancementofthedownloadedfile.

Nonlinear feature extraction for objective classification of complexauditory brainstem responses to diotic perceptually criticalconsonant-vowel syllables
Amir Salar Jafarpisheh a, Amir Homayoun Jafari a,b,*, Mohammadjavad Abolhassani a,Mohammad Farhadi c, Hamed Sadjedi d, Akram Pourbakht e,f, Zahra Shirzhiyan a
aMedical Physics and Biomedical Engineering Department, School of Medicine, Tehran University of Medical Sciences, Tehran, IranbResearch Center for Biomedical Technologies & Robotics (RCBTR), Tehran University of Medical Sciences, Tehran, IrancClinical Nanomedicine Laboratory, ENT – Head & Neck Research Center, Hazrate Rasoul Akram Hospital, Iran University of Medical Sciences, Tehran, IrandDepartment of Engineering, Shahed University, Tehran, IraneDepartment of Audiology, Rehabilitation Research Center, School of Rehabilitation Sciences, Iran University of Medical Sciences, Tehran, IranfRehabilitation Research Center, Iran University of Medical Sciences, Tehran, Iran
1. Introduction
Animal studies have shown that auditory perceptional proces-
sing is distributed along the auditory system neurons [1,2]. A
number of electrophysiological studies have recorded the complex
auditory brainstem response (cABR) elicited by brief acoustic
stimuli but most of them used temporal and frequency domain
features like latency, amplitude, area and slope for transient peaks
and magnitude of frequency following response, fundamental
frequency, first formant amplitude and inter-response correlations
that are linear approaches for representing differences between
recorded responses [1–4]. Finding an insight about brainstem
encoding of perceptually critical consonant-vowel stimuli was done
through the extraction of important linear features of cABR and its
relation to different acoustic stimuli containing /ba/, /da/, /ga/ [1,5].
Auris Nasus Larynx xxx (2015) xxx–xxx
A R T I C L E I N F O
Article history:
Received 29 January 2015
Accepted 10 June 2015
Available online xxx
Keywords:
Complex auditory brainstem response
(cABR)
Nonlinear analysis
RQA
Feature extraction
Recurrence time
A B S T R A C T
Objective: To examine if nonlinear feature extraction method yields appropriate results in complex
brainstem response classification of three different consonant vowels diotically presented in normal
Persian speaking adults.
Methods: Speech-evoked auditory brainstem responses were obtained in 27 normal hearing young
adults by using G.tec EEG recording system. 170 ms synthetic consonant-vowel stimuli /ba/, /da/, /ga/
were presented binaurally and the recurrence quantification analysis was performed on the responses.
The recurrence time of second type was proposed as a suitable feature. ANOVA was also used for testing
the significance of extracted feature. Post-comparison statistical method was used for showing which
means are significantly different from each other.
Results: Dimension embedding and state space reconstruction were helpful for visualizing nonlinearity
in auditory system. The proposed feature was successful in the objective classification of responses in
window time 20.1–35.3 ms, which belonged to formant transition period of stimuli. Also the p value
behavior of recurrence time of second type feature as a discriminant feature was close to the nature of
the response that includes transient and sustained parts. On the other hand, the /ba/ and /ga/
classification period was wider than the others.
Conclusion: The extracted feature shown in this paper is helpful for the objective of distinguishing
individuals with auditory processing disorders in the structurally similar voices. On the other hand,
differing nonlinear feature is meaningful in a special region of response, equal to formant transition
period, and this feature is related to the state space changes of brainstem response. It can be assumed
that more information is within this region of signal and it is a sign of processing role of brainstem. The
state changes of system are dependent on input stimuli, so the existence of top down feedback from
cortex to brainstem forces the system to act differently.
� 2015 Published by Elsevier Ireland Ltd.
* Corresponding author at: School of Medicine, Tehran University of Medical
Sciences, Poursina Street, Tehran, Iran. Tel.: +98 2166466383.
E-mail address: [email protected] (A.H. Jafari).
G Model
ANL-1992; No. of Pages 8
Please cite this article in press as: Jafarpisheh AS, et al. Nonlinear feature extraction for objective classification of complex auditory
brainstem responses to diotic perceptually critical consonant-vowel syllables. Auris Nasus Larynx (2015), http://dx.doi.org/10.1016/
j.anl.2015.06.003
Contents lists available at ScienceDirect
Auris Nasus Larynx
jo u rn al h om epag e: ww w.els evier .c o m/lo cat e/anl
http://dx.doi.org/10.1016/j.anl.2015.06.003
0385-8146/� 2015 Published by Elsevier Ireland Ltd.
In the clinical applications, an objective tool for automatic
classification of cABR signals can assist auditory professionals for
better diagnosis of auditory possessing disabilities. It can be used
for hearing aid fitting or cochlear implant adjustments. There are
some sorts of auditory disorders that may have normal ABR or
cABR in time domain linear analysis, but the use of a novel
approach for the reconstruction of real signal dimension can be a
tool for representing these problems. In cochlear implanted
persons, this can yield to an adjustment protocol based on what
a normal person really hears and what changes in his/her
brainstem signal are expected. However, there is limited under-
standing of the neural responses evoked by various speech sounds
[6].
In addition to the contribution of activity in the ascending
auditory system to the speech ABR, top-down influences from
higher neural centers have been shown to affect the responses. For
example, auditory training and experience with a tonal language
have been found to enhance responses at F0 [6,7].
Recent studies have shown that children with language
based learning problems have abnormal encoding of speech at
the brainstem level. Researchers tried to find an appropriate
linear feature for objective classification of normal and abnor-
mal cABR data [8]. The source filter model of speech processing
showed selective deficiency in the neural encoding of acoustic
features associated with the filter characteristics of speech for
these subjects [5]. However, linear analysis provides poor
information about system real dynamic and its transitions.
Therefore, the use of nonlinear analysis may help overcome this
limitation.
Using nonlinear methods with applicability to short and noisy
data with the aim of representing non-evident changes in
physiological behavior of human body system are novel
approaches in neurosciences [9]. Detection of weak transition
in signal dynamics was done using recurrence time statistics and
especially for transitions with very low energy [10]. Recurrence
quantification analysis (RQA) is a tool for the representation of
similarities and dissimilarities of signals that cannot easily be
seen in time domain data. This analysis is based on dimension
reconstruction according to Takens’ theory. According to this
theory, by considering a time series that is sampled from system
behavior in one observable dimension, the reconstruction of a
scope about multidimensional behavior is possible.
The base of the field of nonlinear dynamics is the representa-
tion of trajectories in their phase space [11]. Recurrence plots are
new methods based on the nonlinear analysis that have been
developed in the last decade. Recurrence plot (RP) represents the
times at which states in a phase space recur. It enables us to
investigate the m-dimensional phase space trajectory through a
two dimensional representation of its recurrence [11]. Most of
the RP related methods are based on quantifying nearest
neighbors in phase space. It has been shown that two types of
recurrence points exist: true and sojourn. Therefore two types of
the recurrence time can be defined T1 and T2 respectively
[10,12]. The use of the sojourn point’s concept and its relating
recurrence times increased the hope for detecting system’s state
transition points.
A novel study has shown that the Fuzzy nonlinear model can
represent input–output behavior of brainstem in generating cABR
to /da/ [13]. Therefore, this can be acceptable to find nonlinear
features that can be used for cABR signal classification.
In this paper, we try to use RQA nonlinear method for
representing differences between cABR elicited by three different
perceptually critical diotic stimuli /ba/, /da/ and /ga/. Exploring this
feature can be a tool for the objective classification of these
responses and a proof for the hypothesis of processing the role of
brainstem.
2. Material and methods
2.1. Participants
Twenty-seven volunteer students from Tehran University of
Medical Sciences (13 women and 14 men), aged from 22 to
29 years (mean � SD = 24.34 � 1.95), participated in this study. None
of the subjects had a history of auditory, learning or neurologic
problems. All students were monolingual Persian speakers by self-
report and pure tone hearing thresholds for both ears were equal to or
better than 20 dB HL for octave frequencies 250–8000 Hz. Subjects
gave written consent to participate intensively in the study. All
procedures were approved by the deputy of research review board
and ethics community of Tehran University of Medical Sciences.
2.2. Stimuli
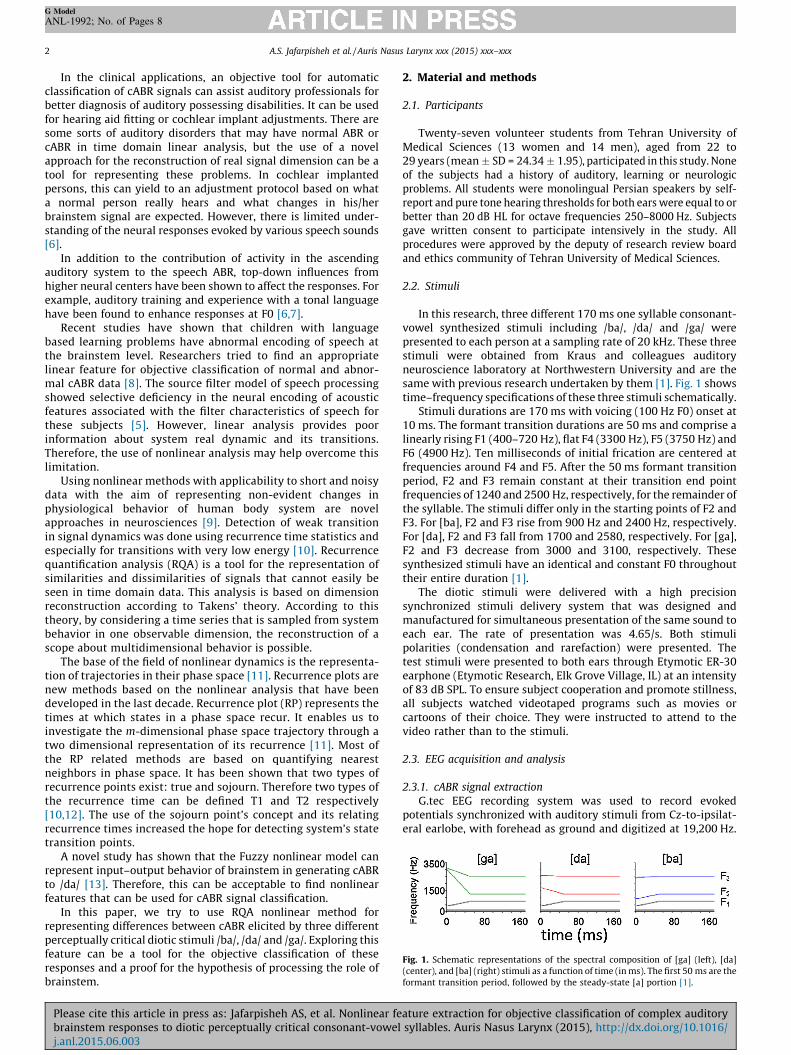
In this research, three different 170 ms one syllable consonant-
vowel synthesized stimuli including /ba/, /da/ and /ga/ were
presented to each person at a sampling rate of 20 kHz. These three
stimuli were obtained from Kraus and colleagues auditory
neuroscience laboratory at Northwestern University and are the
same with previous research undertaken by them [1]. Fig. 1 shows
time–frequency specifications of these three stimuli schematically.
Stimuli durations are 170 ms with voicing (100 Hz F0) onset at
10 ms. The formant transition durations are 50 ms and comprise a
linearly rising F1 (400–720 Hz), flat F4 (3300 Hz), F5 (3750 Hz) and
F6 (4900 Hz). Ten milliseconds of initial frication are centered at
frequencies around F4 and F5. After the 50 ms formant transition
period, F2 and F3 remain constant at their transition end point
frequencies of 1240 and 2500 Hz, respectively, for the remainder of
the syllable. The stimuli differ only in the starting points of F2 and
F3. For [ba], F2 and F3 rise from 900 Hz and 2400 Hz, respectively.
For [da], F2 and F3 fall from 1700 and 2580, respectively. For [ga],
F2 and F3 decrease from 3000 and 3100, respectively. These
synthesized stimuli have an identical and constant F0 throughout
their entire duration [1].
The diotic stimuli were delivered with a high precision
synchronized stimuli delivery system that was designed and
manufactured for simultaneous presentation of the same sound to
each ear. The rate of presentation was 4.65/s. Both stimuli
polarities (condensation and rarefaction) were presented. The
test stimuli were presented to both ears through Etymotic ER-30
earphone (Etymotic Research, Elk Grove Village, IL) at an intensity
of 83 dB SPL. To ensure subject cooperation and promote stillness,
all subjects watched videotaped programs such as movies or
cartoons of their choice. They were instructed to attend to the
video rather than to the stimuli.
2.3. EEG acquisition and analysis
2.3.1. cABR signal extraction
G.tec EEG recording system was used to record evoked
potentials synchronized with auditory stimuli from Cz-to-ipsilat-
eral earlobe, with forehead as ground and digitized at 19,200 Hz.
Fig. 1. Schematic representations of the spectral composition of [ga] (left), [da]
(center), and [ba] (right) stimuli as a function of time (in ms). The first 50 ms are the
formant transition period, followed by the steady-state [a] portion [1].
A.S. Jafarpisheh et al. / Auris Nasus Larynx xxx (2015) xxx–xxx2
G Model
ANL-1992; No. of Pages 8
Please cite this article in press as: Jafarpisheh AS, et al. Nonlinear feature extraction for objective classification of complex auditory
brainstem responses to diotic perceptually critical consonant-vowel syllables. Auris Nasus Larynx (2015), http://dx.doi.org/10.1016/
j.anl.2015.06.003

EEG was processed offline to create averages for each stimulus
condition. Each response was band pass filtered from 70 to 2000 Hz
to isolate the brainstem response frequencies. To compensate filter
phase distortions filtfilt tool was used for Zero-phase forward and
reverse digital IIR filtering.
The EEG was then divided into 215 ms epochs (15 ms pre-
stimulus and 30 ms post-stimulus according to setting in stimuli
delivery system). An artifact criterion of �35 mV was applied to
reject epochs that contained myogenic artifacts. For each stimulus,
the processed epochs were separately averaged (according to
polarity) and then added together in order to isolate the neural
response from that of the cochlear microphonic [1]. The final average
waveform for each stimulus contained 4000 sweeps per subject that
is cABR signal. This signal was stored for all subjects for three different
stimuli as a scalar time series {x(i), i = 1, 2, . . .} for further analysis.
2.3.2. Calculating dimension embedding lag
Before implementing RQA algorithm, it is necessary to calculate
the dimension reconstruction lag and then the minimum
embedding dimension of signal.
The first zero crossing of autocorrelation function is a suitable
selection for embedding lag. We find this parameter for all three
stimuli and all subjects and then the average of these findings
was set as embedding lag for all situations. As we find in this study,
the selection of lag is not very critical in embedding results
[11]. Therefore, we chose the average lag and can compare and
discuss the results of different stimuli. Embedding lag estimation
was also performed with mutual information minima method
without any significant difference between the results.
2.3.3. Calculating minimum embedding dimension
The solution to find minimum reconstruction dimension is
False nearest neighbors (FNN) that is proposed by Kennel et al.
[14]. This method finds nearest neighbor for each point in any
dimension and then seeks to see if these points are near in one
higher dimension or not. When the algorithm finds the correct
embedding dimension, the ratio of False nearest neighbor
algorithm goes toward zero.
We used CRP toolbox developed by Marwan for calculating FNN
in this project [15]. According to the results of lag calculation part
of this paper, the delay was set to 39 and using MAX norm and
maximum dimension equal to 10 and neglecting of existence of
FNN below 0.01% for all the cABRs, FNN algorithm was run.
2.3.4. Generating recurrence plots and RQA
A recurrence is a time the trajectory returns to a location it has
visited before. The recurrence plot depicts the collection of pairs of
times at which the trajectory is at the same place. Recurrence plots
exhibit characteristic large and small scale patterns that are caused
by fundamental dynamic behavior, e.g. short diagonals lines reveal
similar local evolution of different parts of the trajectory, while
horizontal and vertical black lines appear when a state does not
change for some time [9]. After state space reconstruction, we
performed Recurrence quantification analysis (RQA) with finding
points that are near in the reconstructed state space of cABR using
Marwan’s CRP toolbox [15]. Using this algorithm does not need any
assumption about system stationary [16]. We set the dimension
equal to 5 and embedding lag equal to 39 according to the findings
in this paper. We first construct vectors of the form Xi = [x(i),
x(i + L), . . ., x(i + (m � 1)L)], where m is the embedding dimension
and L the delay time. {Xi, i = 1, 2, . . ., N} then represents certain
trajectory in a m-dimensional space. The threshold value for
finding neighbors corresponds to 10% of the maximum phase space
diameter and is calculated for each cABR data separately.
Normalized cABR data were used and the distance between
individual points in the matrix corresponding to a state of the
system at a given time was calculated using the option maximum
norm fixed recurrence rate that means the number of neighbors in
the neighborhood is constant. The sliding window had 420 samples
(21.87 ms) and moved with 42 sample (2.18 ms) steps. After the
visual inspection of recurrence plots to get an insight about system
behavior for each stimulus, RQA was performed in each window to
get output parameters of this algorithm for all conditions and
stored per subjects for further analysis.
T2 which is the recurrence time of second type was calculated.
It is able to detect very weak transitions with high accuracy, both in
clean and noisy environments [9,10].
For getting better insight about T2’s definition, we arbitrarily
chose a reference point X0 on the reconstructed trajectory, and
considered recurrences to its neighborhood of radius r: Br(X0) = {X:
jjX � X0jj < r}. Then we defined the recurrence points of the 2nd
type as the set of points comprised of the first trajectory point
getting inside the neighborhood from outside [12]. The trajectory
may stay inside the neighborhood for a while, thus generating a
sequence of points. These are called sojourn points [10]. Fig. 2
shows a graphical representation of sojourn (open circles) and 2nd
type (solid circles) in a neighborhood. It is clear that there will be
more such points when the size of the neighborhood gets larger as
well as when the trajectory is sampled more densely. Sojourn
points form vertical and horizontal lines, and thus square textures,
in recurrence plots. The summation of the recurrence points of the
second kind and the sojourn points is called the recurrence points
of the first kind and so points to a different parameter [10]. The
time between successive 2nd type recurrence points is called
recurrence time of 2nd type (T2).
Normal distribution of T2 was tested with Kolmogorov–
Smirnov goodness-of-fit hypothesis test in each window across
the subjects. Using Matlab version 2014, statistical analysis was
done. For normal distributed indexes, the mean value of calculated
indexes for each window in 3 groups was compared using ANOVA
method and p value less than 0.05 was considered statistically
significant.
3. Results
3.1. cABR signal extraction
The cABR signal in response to three stimuli for all subjects was
extracted and the grand average of these signals calculated and
shown in Fig. 3. According to this figure cABR overall morphology
in response to consonant and vowel parts of stimulus and its
repeatability can be confirmed in comparison to pervious works.
Fig. 2. A schematic showing recurrence points of the second type (solid circles) and
the sojourn points (open circles) in Br(X0) [10].
A.S. Jafarpisheh et al. / Auris Nasus Larynx xxx (2015) xxx–xxx 3
G Model
ANL-1992; No. of Pages 8
Please cite this article in press as: Jafarpisheh AS, et al. Nonlinear feature extraction for objective classification of complex auditory
brainstem responses to diotic perceptually critical consonant-vowel syllables. Auris Nasus Larynx (2015), http://dx.doi.org/10.1016/
j.anl.2015.06.003

3.2. Calculating dimension embedding lag
By running the autocorrelation algorithm we find the first
minimum as described above. Fig. 4 shows the output of the above
method that is computed for the grand average of response to /ba/
stimulus as an example. In this figure, the suitable lag should be
selected equal to 42.
The results of iterating this algorithm for all situations are
represented in Table 1.
The average for all the mentioned states in Table 1 is 38.64, so
we set embedding lag to 39 samples that is equal to 2 ms.
3.3. Calculating minimum embedding dimension
After running the FNN algorithm, as was described previously,
the minimum dimension for embedding cABR of each subject in
each condition was calculated.
As you can see in Fig. 5, one instance of this calculation is
plotted for /ba/ grand average response. In this figure, the
horizontal axis is dimension and vertical axis is the FNN
algorithm output in percent and the proper dimension will be
4. The histogram of calculated dimensions was plotted for each
stimulus and its results can be seen in Table 2. In this table the
percentage of each dimension was calculated in the above
manner. It seems that suitable dimension for all future
calculations in this paper can be 5.
Fig. 3. cABR grand average to three 170 ms stimuli including /ba/, /da/, /ga/.
Fig. 4. The output of autocorrelation function for grand average signal in response of /ba/.
Table 1
Mean and SD for embedding lag calculation of cABR to /ba/, /da/, /ga/ in all subjects.
Mean Standard deviation
/ba/ 37.30 7.45
/da/ 38.22 6.56
/ga/ 40.40 5.98
A.S. Jafarpisheh et al. / Auris Nasus Larynx xxx (2015) xxx–xxx4
G Model
ANL-1992; No. of Pages 8
Please cite this article in press as: Jafarpisheh AS, et al. Nonlinear feature extraction for objective classification of complex auditory
brainstem responses to diotic perceptually critical consonant-vowel syllables. Auris Nasus Larynx (2015), http://dx.doi.org/10.1016/
j.anl.2015.06.003

3.4. Generating recurrence plots and RQA
Recurrence plot generation and RQA were performed for all
subjects and each stimulus. T2 indexes were calculated as
mentioned above. Fig. 6 shows a sample of this calculation for
grand average response to /ba/.
For better representation of T2 indexes and their overall
behavior across stimuli, the average of each index was calculated
and plotted for all three stimuli. Fig. 7 shows recurrence time of
2nd type of cABR for three stimuli.
3.5. Statistical analysis
Kolmogorov–Smirnov method was used to approve T2 index
coming from normal distribution. Fig. 8 shows recurrence time of
2nd type index p value for each cABR window. There were two
successive windows that with post-ANOVA multiple comparison
yield three response groups and can be separated automatically
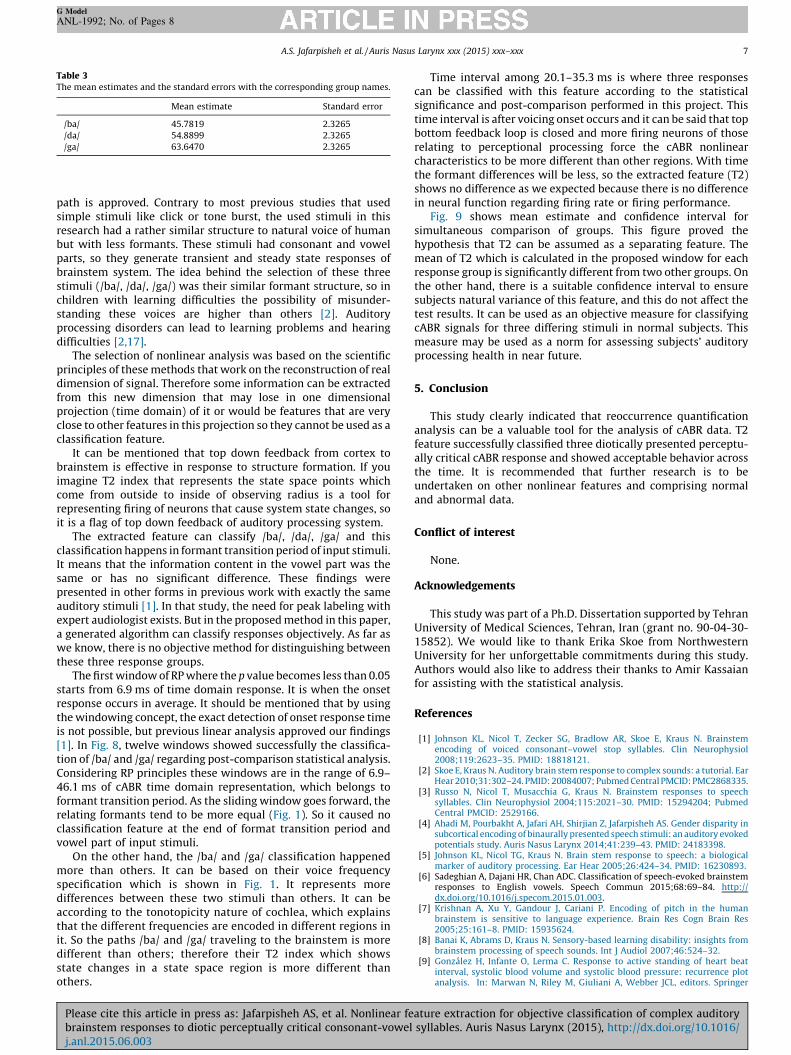
according to this feature. Fig. 9 displays multiple comparison
method results for one of these two windows. Table 3 shows the
Fig. 5. FNN output in response to grand average cABR to /ba/.
Table 2
The percentage of calculated dimension for each stimulus.
4 5 6
/ba/ 33.33 59.26 7.41
/da/ 0 100 0
/ga/ 7.41 74.07 18.52
Fig. 6. cABR grand average time domain representation (top) and its recurrence plot generated for relating signal (bottom). (a) Response to /ba/, (b) response to /ga/, and (c)
response to /da/.
A.S. Jafarpisheh et al. / Auris Nasus Larynx xxx (2015) xxx–xxx 5
G Model
ANL-1992; No. of Pages 8
Please cite this article in press as: Jafarpisheh AS, et al. Nonlinear feature extraction for objective classification of complex auditory
brainstem responses to diotic perceptually critical consonant-vowel syllables. Auris Nasus Larynx (2015), http://dx.doi.org/10.1016/
j.anl.2015.06.003
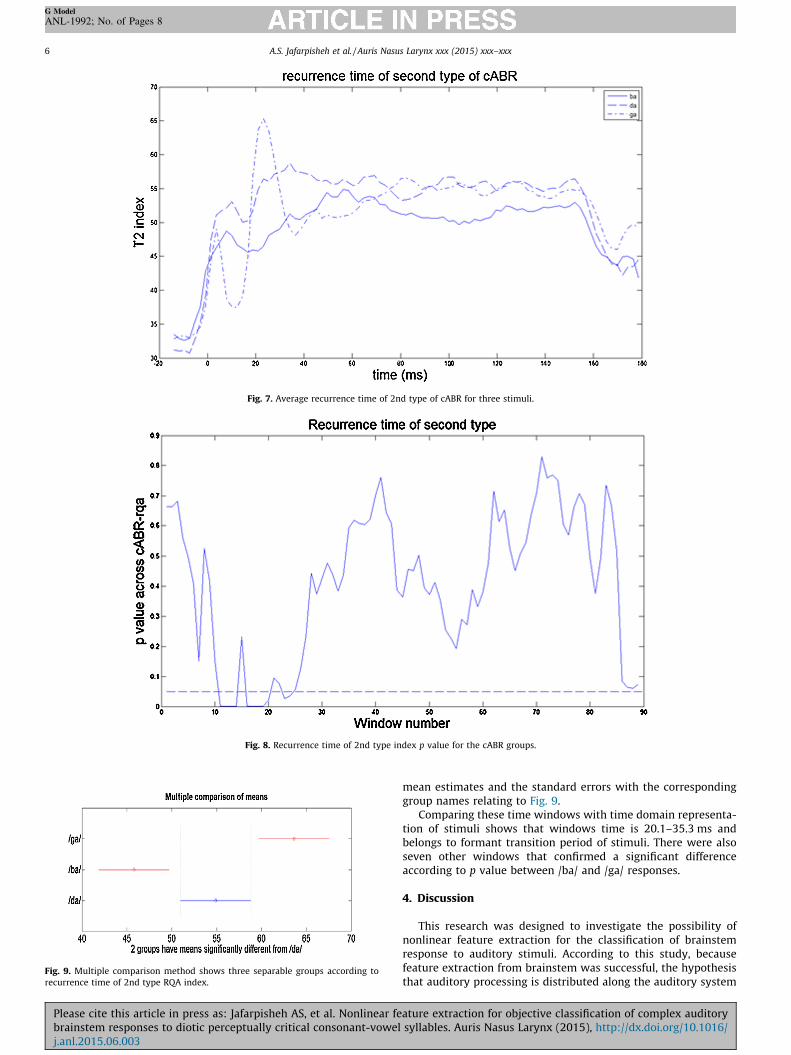
mean estimates and the standard errors with the corresponding
group names relating to Fig. 9.
Comparing these time windows with time domain representa-
tion of stimuli shows that windows time is 20.1–35.3 ms and
belongs to formant transition period of stimuli. There were also
seven other windows that confirmed a significant difference
according to p value between /ba/ and /ga/ responses.
4. Discussion
This research was designed to investigate the possibility of
nonlinear feature extraction for the classification of brainstem
response to auditory stimuli. According to this study, because
feature extraction from brainstem was successful, the hypothesis
that auditory processing is distributed along the auditory system
Fig. 7. Average recurrence time of 2nd type of cABR for three stimuli.
Fig. 8. Recurrence time of 2nd type index p value for the cABR groups.
Fig. 9. Multiple comparison method shows three separable groups according to
recurrence time of 2nd type RQA index.
A.S. Jafarpisheh et al. / Auris Nasus Larynx xxx (2015) xxx–xxx6
G Model
ANL-1992; No. of Pages 8
Please cite this article in press as: Jafarpisheh AS, et al. Nonlinear feature extraction for objective classification of complex auditory
brainstem responses to diotic perceptually critical consonant-vowel syllables. Auris Nasus Larynx (2015), http://dx.doi.org/10.1016/
j.anl.2015.06.003
path is approved. Contrary to most previous studies that used
simple stimuli like click or tone burst, the used stimuli in this
research had a rather similar structure to natural voice of human
but with less formants. These stimuli had consonant and vowel
parts, so they generate transient and steady state responses of
brainstem system. The idea behind the selection of these three
stimuli (/ba/, /da/, /ga/) was their similar formant structure, so in
children with learning difficulties the possibility of misunder-
standing these voices are higher than others [2]. Auditory
processing disorders can lead to learning problems and hearing
difficulties [2,17].
The selection of nonlinear analysis was based on the scientific
principles of these methods that work on the reconstruction of real
dimension of signal. Therefore some information can be extracted
from this new dimension that may lose in one dimensional
projection (time domain) of it or would be features that are very
close to other features in this projection so they cannot be used as a
classification feature.
It can be mentioned that top down feedback from cortex to
brainstem is effective in response to structure formation. If you
imagine T2 index that represents the state space points which
come from outside to inside of observing radius is a tool for
representing firing of neurons that cause system state changes, so
it is a flag of top down feedback of auditory processing system.
The extracted feature can classify /ba/, /da/, /ga/ and this
classification happens in formant transition period of input stimuli.
It means that the information content in the vowel part was the
same or has no significant difference. These findings were
presented in other forms in previous work with exactly the same
auditory stimuli [1]. In that study, the need for peak labeling with
expert audiologist exists. But in the proposed method in this paper,
a generated algorithm can classify responses objectively. As far as
we know, there is no objective method for distinguishing between
these three response groups.
The first window of RP where the p value becomes less than 0.05
starts from 6.9 ms of time domain response. It is when the onset
response occurs in average. It should be mentioned that by using
the windowing concept, the exact detection of onset response time
is not possible, but previous linear analysis approved our findings
[1]. In Fig. 8, twelve windows showed successfully the classifica-
tion of /ba/ and /ga/ regarding post-comparison statistical analysis.
Considering RP principles these windows are in the range of 6.9–
46.1 ms of cABR time domain representation, which belongs to
formant transition period. As the sliding window goes forward, the
relating formants tend to be more equal (Fig. 1). So it caused no
classification feature at the end of format transition period and
vowel part of input stimuli.
On the other hand, the /ba/ and /ga/ classification happened
more than others. It can be based on their voice frequency
specification which is shown in Fig. 1. It represents more
differences between these two stimuli than others. It can be
according to the tonotopicity nature of cochlea, which explains
that the different frequencies are encoded in different regions in
it. So the paths /ba/ and /ga/ traveling to the brainstem is more
different than others; therefore their T2 index which shows
state changes in a state space region is more different than
others.
Time interval among 20.1–35.3 ms is where three responses
can be classified with this feature according to the statistical
significance and post-comparison performed in this project. This
time interval is after voicing onset occurs and it can be said that top
bottom feedback loop is closed and more firing neurons of those
relating to perceptional processing force the cABR nonlinear
characteristics to be more different than other regions. With time
the formant differences will be less, so the extracted feature (T2)
shows no difference as we expected because there is no difference
in neural function regarding firing rate or firing performance.
Fig. 9 shows mean estimate and confidence interval for
simultaneous comparison of groups. This figure proved the
hypothesis that T2 can be assumed as a separating feature. The
mean of T2 which is calculated in the proposed window for each
response group is significantly different from two other groups. On
the other hand, there is a suitable confidence interval to ensure
subjects natural variance of this feature, and this do not affect the
test results. It can be used as an objective measure for classifying
cABR signals for three differing stimuli in normal subjects. This
measure may be used as a norm for assessing subjects’ auditory
processing health in near future.
5. Conclusion
This study clearly indicated that reoccurrence quantification
analysis can be a valuable tool for the analysis of cABR data. T2
feature successfully classified three diotically presented perceptu-
ally critical cABR response and showed acceptable behavior across
the time. It is recommended that further research is to be
undertaken on other nonlinear features and comprising normal
and abnormal data.
Conflict of interest
None.
Acknowledgements
This study was part of a Ph.D. Dissertation supported by Tehran
University of Medical Sciences, Tehran, Iran (grant no. 90-04-30-
15852). We would like to thank Erika Skoe from Northwestern
University for her unforgettable commitments during this study.
Authors would also like to address their thanks to Amir Kassaian
for assisting with the statistical analysis.
References
[1] Johnson KL, Nicol T, Zecker SG, Bradlow AR, Skoe E, Kraus N. Brainstemencoding of voiced consonant–vowel stop syllables. Clin Neurophysiol2008;119:2623–35. PMID: 18818121.
[2] Skoe E, Kraus N. Auditory brain stem response to complex sounds: a tutorial. EarHear 2010;31:302–24. PMID: 20084007; Pubmed Central PMCID: PMC2868335.
[3] Russo N, Nicol T, Musacchia G, Kraus N. Brainstem responses to speechsyllables. Clin Neurophysiol 2004;115:2021–30. PMID: 15294204; PubmedCentral PMCID: 2529166.
[4] Ahadi M, Pourbakht A, Jafari AH, Shirjian Z, Jafarpisheh AS. Gender disparity insubcortical encoding of binaurally presented speech stimuli: an auditory evokedpotentials study. Auris Nasus Larynx 2014;41:239–43. PMID: 24183398.
[5] Johnson KL, Nicol TG, Kraus N. Brain stem response to speech: a biologicalmarker of auditory processing. Ear Hear 2005;26:424–34. PMID: 16230893.
[6] Sadeghian A, Dajani HR, Chan ADC. Classification of speech-evoked brainstemresponses to English vowels. Speech Commun 2015;68:69–84. http://dx.doi.org/10.1016/j.specom.2015.01.003.
[7] Krishnan A, Xu Y, Gandour J, Cariani P. Encoding of pitch in the humanbrainstem is sensitive to language experience. Brain Res Cogn Brain Res2005;25:161–8. PMID: 15935624.
[8] Banai K, Abrams D, Kraus N. Sensory-based learning disability: insights frombrainstem processing of speech sounds. Int J Audiol 2007;46:524–32.
[9] Gonzalez H, Infante O, Lerma C. Response to active standing of heart beatinterval, systolic blood volume and systolic blood pressure: recurrence plotanalysis. In: Marwan N, Riley M, Giuliani A, Webber JCL, editors. Springer
Table 3
The mean estimates and the standard errors with the corresponding group names.
Mean estimate Standard error
/ba/ 45.7819 2.3265
/da/ 54.8899 2.3265
/ga/ 63.6470 2.3265
A.S. Jafarpisheh et al. / Auris Nasus Larynx xxx (2015) xxx–xxx 7
G Model
ANL-1992; No. of Pages 8
Please cite this article in press as: Jafarpisheh AS, et al. Nonlinear feature extraction for objective classification of complex auditory
brainstem responses to diotic perceptually critical consonant-vowel syllables. Auris Nasus Larynx (2015), http://dx.doi.org/10.1016/
j.anl.2015.06.003

Proceedings in Mathematics & Statistics, vol. 103. Springer InternationalPublishing; 2014. p. 109–23.
[10] Gao J, Cao Y, Gu L, Harris J, Principe J. Detection of weak transitions in signaldynamics using recurrence time statistics. Phys Lett A 2003;317:64–72.
[11] Marwan N, Webber Jr CL. Mathematical and computational foundations of recur-rence quantifications. Recurrence quantification analysis. Springer; 2015. p. 3–43.
[12] Gao JB. Recurrence time statistics for chaotic systems and their applications.Phys Rev Lett 1999;83:3178–81.
[13] Jafarpisheh AS, Jafari AH, Shirzhiyan Z, Ahadi M, Pourbakht A. A novel ap-proach for extracting important cues in complex auditory brainstem responseto /da/ using fuzzy model. Front Biomed Technol 2014;1:200–10.
[14] Kennel MB, Brown R, Abarbanel HD. Determining embedding dimension forphase-space reconstruction using a geometrical construction. Phys Rev A: GenPhys 1992;45:3403.
[15] Marwan N. Cross Recurrence Plot toolbox for Matlab, version 5.17 (r28.16);2013, Available from: http://tocsy.pik-potsdam.de/CRPtoolbox/index.html.
[16] Marwan N, Carmen Romano M, Thiel M, Kurths J. Recurrence plots for theanalysis of complex systems. Phys Rep 2007;438:237–329.
[17] Kumar P, Singh NK. BioMARK as electrophysiological tool for assessing chil-dren at risk for (central) auditory processing disorders without readingdeficits. Hear Res 2015;324:54–8.
A.S. Jafarpisheh et al. / Auris Nasus Larynx xxx (2015) xxx–xxx8
G Model
ANL-1992; No. of Pages 8
Please cite this article in press as: Jafarpisheh AS, et al. Nonlinear feature extraction for objective classification of complex auditory
brainstem responses to diotic perceptually critical consonant-vowel syllables. Auris Nasus Larynx (2015), http://dx.doi.org/10.1016/
j.anl.2015.06.003View publication statsView publication stats