nonlinear models and experimental investigation of …thescipub.com/pdf/ajassp.2008.248.262.pdfam....
TRANSCRIPT

American Journal of Applied Sciences 5 (3): 248-262, 2008 ISSN 1546-9239 © 2008 Science Publications
Corresponding Author: A.A. Maghsoudi, Assistant Prof, Department of Civil Engineering, University of Kerman, Kerman, Iran. Fax: +983413220054
248
Nonlinear Models and Experimental Investigation of
Lifetime History of HSC Flexural Beams
K. Masti, A.A. Maghsoudi and R. Rahgozar Department of Civil Engineering, University of Kerman, Kerman, Iran
Abstract: The nature of fracture in high strength concrete is brittle and therefore, the investigation behavior of flexural high strength concrete (HSC) members is important.�This paper describes the deflection, strain and energy ductility and the lifetime history of experimental and theoretical analysis of six caste reinforced HSC beams with different percentage of � and ��. The beams were loaded incrementally by a two point loads and the vertical deflection and concrete strain were measured at mid span, at 20cm from mid span and under load point up to failure. Based on the experimental results, load-deflection, load-strain and energy observed diagrams of each beam for mentioned sections plotted. In the theoretically phase, a 3-D model i.e., ANSYS nonlinear software was used and the load-deflection, load-strain and energy observed diagrams were also plotted and the comparison of experimental and theoretical results for lifetime history of HSC beams is performed. The obtained results by two methods are indicated that a reasonably good agreement is achieved Keywords: Load-displacement and strain, Energy observed, Experimental, ANSYS
INTRODUCTION
The implementation of nonlinear material laws in finite element analysis codes is generally tackled by software development industry in one of two ways. In the first instance the material behavior is programmed independently of the elements to which it may be specified. Using this approach the choice of element for a particular physical system is not limited and best practice modeling techniques can be used in identifying an appropriate element type to which any, of a range, of nonlinear material properties are assigned. This is the most versatile approach and does not limit the analyst to specific element type in configuring the problem of interest. Notwithstanding this however certain software developers provide specific specialized nonlinear material capabilities only with dedicated element types. The main obstacle to finite element analysis of reinforced concrete structures is the difficulty in characterizing the material properties. Much effort has been spent in search of a realistic model predict the behavior of reinforced concrete structures. Due mainly to the complexity of the composite nature of material, proper modeling of such structures is a challenging task. Despite the great advances achieved in the fields
of plasticity, damage theory and fracture mechanics, among others, an unique and complete constitutive model for reinforced concrete is still lacking[1]. Analysis of reinforced concrete (RC) structures using ANSYS nonlinear concrete model has been investigated and reported [1]. They reported results of some analysis performed using the RC model of general-purpose finite element code ANSYS are presented and discussed. The differences observed in the response of the same RC beam as some variations are made in a material model that is always the same are emphasized. The consequences of small changes in modeling are discussed and it is shown that satisfactory results may be obtained from relatively simple and limited models. The nonlinear models of reinforced and post-tensioned concrete beams adapted by ANSYS were discussed and reported by Fanning[2]. In this paper, appropriate numerical modeling strategies were recommended and comparisons with experimental load-deflection responses are discussed for ordinary RC beams and post-tensioned concrete T-beams. He concluded that, In terms of finite element models to predict the strength of existing beams the assignment of appropriate material properties is critical. It was found that for a known compressive strength of concrete, which can be measured from extracted cores, existing rules of thumb for the Young’s modulus and concrete tensile strength
SC
I-PU
BLIC
ATIO
NS Author M
anuscript
Am. J. Applied Sci., 5 (3): 248-262, 2008
249
are adequate for inclusion in the numerical models. In relation to the reinforcement, the actual yield strength in tension is likely to be greater than the nominal design strength and the ultimate load of the beam will thus be underestimating. In relation to post-tensioned beams the situation is complicated further by the inevitable loss in post-tensioning forces that will occurred after construction and during the lifetime of the structure and these losses should be accounted for in an assessment model of a post-tensioned system. The use of high strength concrete (HSC) is known for about 20 years. Nowadays, HSC has been more and more used in civil engineering. A full report on HSC from both concrete technology and structural point of view is presented in [3]. The results of load-deflection at mid span, 20cm from mid span and under load point tests, and also the load-strain at these sections on HSC reinforced beams reported by [4] were used to asses the suitability of the reinforce concrete model implemented in ANSYS in predicting the lifetime history response of reinforced HSC beams. However, no report was observed for load-strain material ANSYS modeling of reinforced HSC beams. only recently researchers have attempted to simulate the behavior of ordinary and high strength concrete strengthened with fiber reinforced polymer (FRP) composite using finite element method[5]. When the strength of concrete gets higher, some of its characteristics and engineering properties become different from those of normal-strength concrete[6, 10]. These differences in material properties may have important consequences in terms of the structural behavior and design of HSC members. The design provisions contained in the major building codes are, in reality, based on tests conducted on normal-strength concrete (NSC). While designing a structure using HSC, the designer particularly in the Southeast Asian region usually ignores the enhanced properties of concrete and possible changes in the overall response of the structure because of lack of adequate code guidance [11].
NUMERICAL STUDY FOR MATERIAL PROPERTIES MODELING
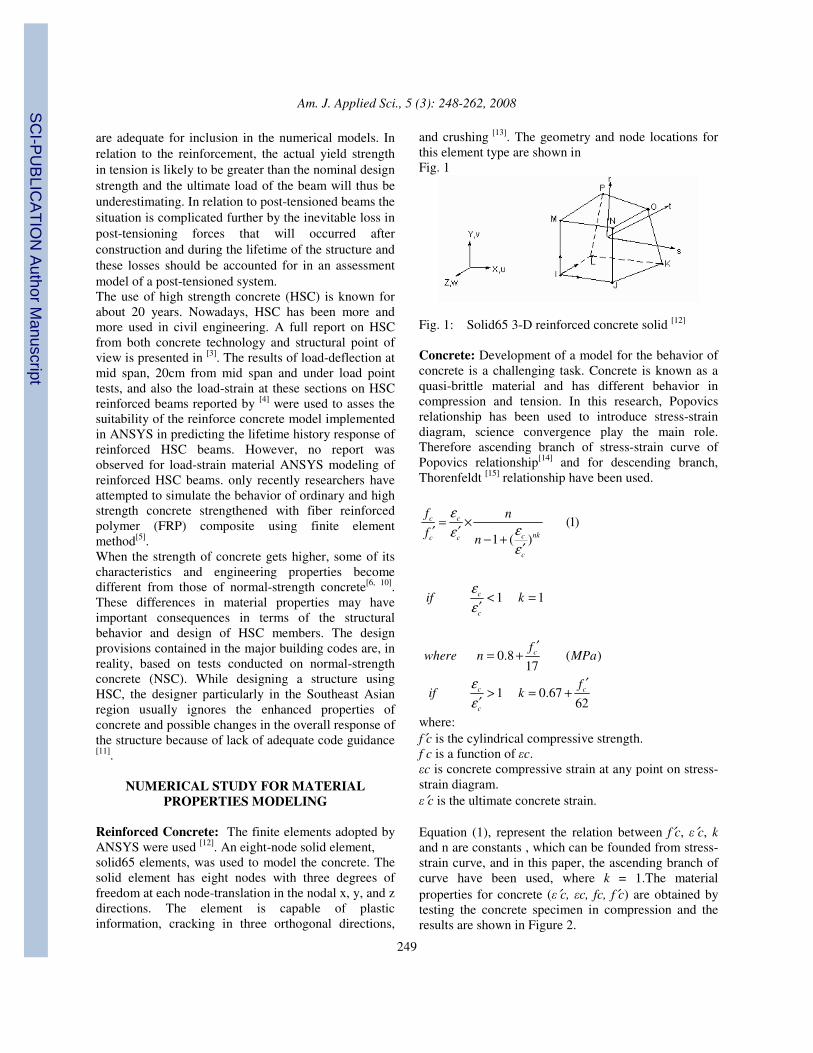
Reinforced Concrete: The finite elements adopted by ANSYS were used [12]. An eight-node solid element, solid65 elements, was used to model the concrete. The solid element has eight nodes with three degrees of freedom at each node-translation in the nodal x, y, and z directions. The element is capable of plastic information, cracking in three orthogonal directions,
and crushing [13]. The geometry and node locations for this element type are shown in Fig. 1
Fig. 1: Solid65 3-D reinforced concrete solid [12] Concrete: Development of a model for the behavior of concrete is a challenging task. Concrete is known as a quasi-brittle material and has different behavior in compression and tension. In this research, Popovics relationship has been used to introduce stress-strain diagram, science convergence play the main role. Therefore ascending branch of stress-strain curve of Popovics relationship[14] and for descending branch, Thorenfeldt [15] relationship have been used.
(1)1 ( )
c c
nkcc c
c
f nf n
εεεε
= ×′ ′ − +
′
1 1c
c
if kεε
< =′
0.8 ( )17
cfwhere n MPa′
= +
1 0.6762
c c
c
fif k
εε
′> = +
′
where: f′c is the cylindrical compressive strength. f c is a function of �c. �c is concrete compressive strain at any point on stress-strain diagram. �′c is the ultimate concrete strain. Equation (1), represent the relation between f′c, �′c, k and n are constants , which can be founded from stress-strain curve, and in this paper, the ascending branch of curve have been used, where k = 1.The material properties for concrete (�′c, �c, fc, f′c) are obtained by testing the concrete specimen in compression and the results are shown in Figure 2.
SC
I-PU
BLIC
ATIO
N Author M
anuscript

Am. J. Applied Sci., 5 (3): 248-262, 2008
250
Fig. 2: Concrete stress-strain diagram Steel Reinforcement: A link8 element was used to model the steel reinforcement. Two nodes are required for this element. Each node has three degrees of freedom, translations in the nodal x, y, and z directions. The element is also capable of carrying plastic deformation. The geometry and node locations for this element type are shown in Figure 3.
Fig. 3: Link8 3-D spar [12]
Fig. 4: Stress-strain diagram for tested tensile bar
Here, the stress-strain curve for steel reinforcement used in concrete beams was obtained from steel bars tested in tension. The curve has an initial linear elastic
portion, a yield plateau (yield point beyond which the strain increases with little or no increase in stress), a strain-hardening range in which stress again increases with strain and finally a range in which the stress drops off until fracture occurs which has been shown in Figure 4 with the following characteristic: 1: elastic portion;
(2)s y s yf fε ε≤ � =
2: yield plateau;
(3)y s sh s yf fε ε ε≤ ≤ � =
3: strain hardening;
sh s uε ε ε≤ ≤ �
2
( ) 2 (4)s sh s shs y u y
u sh u sh
f f f fε ε ε εε ε ε ε
� �� �− −� �= + − −� − −� � ��
Material properties for the steel reinforcement (�y, �sh, �u, fy, fu) and concrete ( , )c cfε ′ ′ are obtained and used, by testing the concrete specimens in compression and steel reinforcement in tension and their stress-strain diagrams are shown in Figure 2 and 4 respectively.
FINITE ELEMENT MODELING
As an initial step, a finite element analysis requires meshing of the model. In the other words, an important step in finite element modelling is the selection of the mesh density. A convergence of results for steel reinforcement and concrete is obtained when an adequate number of elements are used in the model. this is practically achieved when an increase in the mesh density has a negligible effect on results. The ANSYS software has been performed and the modelling results are shown in Figure 5 and 6 for steel and concrete respectively.
Fig. 5: Finite element model of concrete
SC
I-PU
BLIC
ATIO
N Author M
anuscript

Am. J. Applied Sci., 5 (3): 248-262, 2008
251
Fig. 6: Finite element model of steel
GEOMETRY AND MATERIALS PROPERTIES
Test specimens: The geometry and the material properties of six doubly reinforced concrete beams made of HSC as reported by Maghsoudi, et al. [4] were used for this investigation. The details of tested beams are shown in Figure 7. The shear reinforcement was provided along the beam length except in the constant moment zone. Table 1 presents the detailed testing program. In the Table, B stands for HSC beam, C indicate the compressive rebar and the numerals showing the reinforcement steel variations.
(a) Details of tested beams (b)Testing arrangement Note: all dimensions are in (mm) Fig. 7: Details of test beams and testing arrangement
MATERIALS The rebar were tested in tension and an average yield stress, (fy) values of 420 MPa was reported. The average of three-control compressive concrete specimen’s strength for each beam is shown in Table 1. Table 1: Details of testing program of tested beams Test procedure: All the six beams were tested under simply supported condition and were subjected to two-point loads, as shown in Figure 7. For the experimental deflection and strain ductility, the deflection and concrete strain measurements at mid span, 20cm from mid span and under load point were considered. The load was applied in 20 to 25 increments up to failure by means of a 1400 kN hydraulic testing machine (Figure 8 and 9).
Fig. 8: Crack propagation and failure of the beam
under load
Fig. 9: Crack propagation and failure of the beam
under load
DUCTILITY The ductility of a beam can be defined as its ability to sustain inelastic deformation without loss in its load carrying capacity prior to failure. Following this definition, ductility can be expressed in terms of deformation or energy absorption. In the case of steel reinforced beams, where there is clear plastic
SC
I-PU
BLIC
ATIO
N Author M
anuscript

Am. J. Applied Sci., 5 (3): 248-262, 2008
252
Table 1: Details of testing program of tested beams
ρ′�(%) A′s ρ/ρb ρ�(%) As d′(mm) d�(mm) f′c�( MPa) Beam No.
1.01 2�14+1�18 0.36 2.03 4�18 42 251 63.21 BC3
1.24 2�14+1�20 0.43 2.51 4�20 47 250 71.45 BC4
0.61 2�14 0.79 4.81 4�28 40 256 73.77 BC6 1.23 2�20 0.79 4.81 4�28 40 256 73.42 BC10 2.41 2�28 0.79 4.81 4�28 40 256 72.98 BC11 3.61 3�28 0.79 4.81 4�28 40 256 74.35 BC12
Table 2: Comparison of experimental and numerical mid span results of yielding and ultimate deflections for tested
beams Experimental results Numerical Results
Beam No �y (mm) �u (mm) �y (mm) �u (mm)
µexp µnum Error for �y (%)
Error for �u (%)
Error for �d (%)
BC3 6.73 40.4 6 35.2 6.00 5.87 10.85 12.87 2.27 BC4 7.37 35 5.6 25.54 4.75 4.56 24.02 27.03 3.96 BC6 8.71 11.93 7.65 10.72 1.37 1.40 12.17 10.14 -2.31
BC10 8.58 26.4 7.44 23.76 3.08 3.19 13.29 10.00 -3.79 BC11 8.36 18.7 7.04 16.55 2.24 2.35 15.79 11.50 -5.10 BC12 8.68 46.26 6.92 30.15 5.33 4.36 20.28 34.82 18.25
Table 3: Comparison of experimental and numerical at 20 cm from mid span results of yielding and ultimate
deflections for tested beams Experimental results Numerical Results Beam No �y (mm) �u (mm) �y (mm) �u (mm)
µexp µnum Error for �y (%)
Error for �u (%)
Error for �d (%)
BC3 6.60 41.00 6.00 35.20 6.21 5.87 9.09 14.15 5.56 BC4 6.84 28.10 5.60 25.60 4.11 4.57 18.13 8.90 -11.28 BC6 8.42 11.09 7.40 10.24 1.32 1.38 12.11 7.66 -5.06
BC10 8.17 20.10 7.15 22.70 2.46 3.17 12.48 -12.94 -29.05 BC11 7.89 16.27 6.78 16.03 2.06 2.36 14.07 1.48 -14.66 BC12 8.16 37.96 6.67 28.70 4.65 4.30 18.26 24.39 7.50
Table 5: Comparison of experimental and numerical mid span results of yielding and ultimate strain for tested beams
Experimental Numerical Error (%) Beam No. ccε cuε ccε cuε ccε cuε
BC3 0.0015 0.004 0.0014 0.0032 6.67 20 BC4 0.0018 0.0043 0.0013 0.0028 27.78 34.88 BC6 0.0019 0.00316 0.0021 0.0027 -10.53 14.56
BC10 0.002 0.00374 0.00205 0.003 -2.5 19.79 BC11 0.00164 0.00347 0.0018 0.003 -9.75 13.54 BC12 0.0022 0.0041 0.0016 0.003 27.27 26.83
Table 6: Comparison of experimental and numerical at 20 cm from mid span results of yielding and
Experimental Numerical Error (%) Beam No.
ccε cuε ccε cuε ccε cuε
BC3 0.0015 0.0035 0.0014 0.0032 6.67 8.57 BC4 0.0016 0.004 0.0013 0.0028 18.75 30 BC6 0.0019 0.0031 0.0022 0.00275 -15.79 11.29
BC10 0.0021 0.0032 0.00207 0.0028 1.43 12.5 BC11 0.002 0.0036 0.00185 0.00275 7.5 23.61 BC12 0.0022 0.004 0.0017 0.0028 22.73 30
SC
I-PU
BLIC
ATIO
N Author M
anuscript

Am. J. Applied Sci., 5 (3): 248-262, 2008
253
Table 7: Comparison of experimental and numerical under load results of yielding and ultimate strain for tested beams Experimental Numerical Error (%) Beam
No. ccε cuε ccε cuε ccε cuε
BC3 0.00133 0.0034 0.00185 0.00323 -39.09 5 BC4 0.0015 0.0026 0.0018 0.0028 -20 -7.69 BC6 0.0021 0.003 0.00284 0.0029 -35.24 3.33
BC10 0.00214 0.0034 0.0027 0.00291 -26.17 14.41 BC11 0.0027 0.00336 0.00226 0.0028 16.3 16.7 BC12 0.00193 0.0022 0.0025 0.0028 -29.53 -27.27
Table 8: Comparison of experimental and numerical mid span results of yielding and ultimate loads for tested beams
Result Load (kN) BC3 BC4 BC6 BC10 BC11 BC12 Py 355 415 842 820 836 825 Experimental
Results Pu 501 567 946 1033 1035 1095
Py 417 492 935 940 944 950 Numerical Results
Pu 557 640 1027 1216 1124 1211
Py -17.46 -18.55 -11.04 -15 -12.92 -15.15 Error (%) Pu -11.18 -12.87 -8.56 -17.72 -8.6 -10.6 Table 9: Comparison of experimental and numerical mid span results of observed energy of beams
Ratio of
inelasticenergy
totalenergy
Inelastic energy (kN-mm) Total energy (kN-mm)
Error (%)
Num. Exp. Error (%) Num. Exp. Error (%)
Num.
Exp.
Beam No
0.25 0.917 0.919 -7.07 14789 13812 -7.35 16132 15028 BC3 1.09 0.894 0.904 18.62 11849 14560 17.72 13256 16111 BC4 -2.84 0.471 0.458 -12.52 3279 2914 -9.41 6963 6364 BC6 2.54 0.836 0.858 10.86 18354 20589 8.53 21953 24000 BC10 4.98 0.744 0.783 17.70 10021 12175 13.38 13469 15550 BC11 3.77 0.884 0.919 31.89 26099 38321 29.22 29507 41691 BC12
Table 10: Comparison of experimental and numerical at 20 cm from mid span results of observed energy of beams
Ratio of Inelastic energy (kN-mm) Total energy (kN-mm)
Error (%) Num. Exp. Error (%) Num. Exp. Error
(%)
Num.
Exp.
Beam No
0.86 0.917 0.925 -1.04 14788 14636 -1.91 16131 15828 BC3 -0.83 0.894 0.887 -7.78 11849 10994 -6.89 13256 12402 BC4
-11.59 0.465 0.417 -27.51 3082 2417 -14.27 6623 5796 BC6 -0.40 0.834 0.831 -9.01 17440 15999 -8.57 20900 19250 BC10 1.50 0.746 0.757 1.18 9746 9862 -0.33 13071 13028 BC11 2.45 0.882 0.904 18.59 24679 30313 16.54 27968 33511 BC12
Table 11: Comparison of experimental and numerical under load results of observed energy of beams
Ratio of Inelastic energy (kN-mm) Total energy (kN-mm)
Error (%) Num. Exp. Error
(%) Num. Exp. Error (%)
Num.
Exp.
Beam No
0.15 0.909 0.911 2.21 10718 10960 2.06 11787 12035 BC3 -2.88 0.886 0.861 -32.77 8833 6653 -29.04 9975 7730 BC4 -13.53 0.459 0.4041 -23.66 2556 2067 -8.92 5570 5114 BC6 -5.15 0.823 0.782 -33.58 13768 10307 -27.03 16733 13172 BC10 -0.31 0.726 0.723 -2.96 7525 7309 -2.63 10371 10105 BC11 3.62 0.872 0.904 25.54 19284 25898 22.74 22122 28633 BC12
SC
I-PU
BLIC
ATIO
N Author M
anuscript

Am. J. Applied Sci., 5 (3): 248-262, 2008
254
BC3
0
100
200300
400
500
600
0 20 40 60
Deflection (mm)
Loa
d (k
N)
Numerical
Exprimental
BC4
0
100200
300
400
500600
700
0 5 10 15 20 25 30 35 40Deflection (mm)
Loa
d (k
N)
Numerical
Exprimental
BC6
0
200
400
600
800
1000
1200
0 5 10 15Deflection (mm)
Loa
d (k
N)
Numerical
Exprimental
BC10
0
200
400
600
800
1000
1200
1400
0 10 20 30 40Deflection (mm)
Loa
d (k
N)Numerical
Exprimental
BC11
0
200
400
600
800
1000
1200
0 10 20 30Deflection (mm)
Loa
d (k
N)
Numerical
Exprimental
BC12
0200400600800
100012001400
0 10 20 30 40 50 60 70
Deflection (mm)
Loa
d (k
N)
Numerical
Exprimental
Fig. 10: Comparison of experimental and numerical load-deflection results for tested beams at mid span
SC
I-PU
BLIC
ATIO
N Author M
anuscript

Am. J. Applied Sci., 5 (3): 248-262, 2008
255
BC3
0
100
200
300
400
500
600
0 20 40 60Deflection (mm)
Loa
d (k
N)
Numerical
Exprimental
BC4
0100
200300400500
600700
0 10 20 30Deflection (mm)
Loa
d (k
N)
Numerical
Exprimental
BC6
0
200
400
600
800
1000
1200
0 5 10 15Deflection (mm)
Loa
d (k
N)
Numerical
ExprimentalBC10
0
200
400
600
800
1000
1200
1400
0 10 20 30Deflection (mm)
Loa
d (k
N)
Numerical
Exprimental
BC11
0
200
400
600
800
1000
1200
0 5 10 15 20Deflection (mm)
Loa
d (k
N)
Numerical
ExprimentalBC12
0
200400
600
800
10001200
1400
0 10 20 30 40 50 60 70
Deflection (mm)
Loa
d (k
N)
Numerical
Exprimental
Fig. 11: Comparison of experimental and numerical load-deflection results for tested beams at 20 cm from mid span
SC
I-PU
BLIC
ATIO
N Author M
anuscript

Am. J. Applied Sci., 5 (3): 248-262, 2008
256
BC3
0
100
200
300
400
500
600
0 20 40 60
Deflection (mm)
Loa
d (k
N)
Numerical
Exprimental
BC4
0100200300400500600700
0 10 20 30Deflection (mm)
Loa
d (k
N)
Numerical
Exprimental
BC6
0
200
400
600
800
1000
1200
0 5 10 15Deflection (mm)
Loa
d (k
N)
Numerical
Exprimental
BC10
0
200
400
600
800
1000
1200
1400
0 5 10 15 20Deflection (mm)
Loa
d (k
N)
Numerical
Exprimental
BC11
0
200
400
600
800
1000
1200
0 5 10 15 20Deflection (mm)
Loa
d (k
N)
Numerical
Exprimental
BC12
0
200
400
600
800
1000
1200
1400
0 10 20 30 40 50Deflection (mm)
Loa
d (k
N)
Numerical
Exprimental
Fig. 12: Comparison of experimental and numerical load-deflection results for tested beams at under load
SC
I-PU
BLIC
ATIO
N Author M
anuscript

Am. J. Applied Sci., 5 (3): 248-262, 2008
257
BC3
0
100
200
300
400
500
600
0 0.002 0.004 0.006
Strain
Loa
d (k
N)
Numerical
Exprimental
BC4
0
100
200
300
400
500
600
700
0 0.002 0.004 0.006
Strain
Loa
d (k
N)
Numerical
Exprimental
BC6
0
200
400
600
800
1000
1200
0 0.001 0.002 0.003 0.004
Strain
Loa
d (k
N)
Numerical
ExprimentalBC10
0200400600
800100012001400
0 0.001 0.002 0.003 0.004
Strain
Loa
d (k
N)
Numerical
Exprimental
BC11
0
200
400
600
800
1000
1200
0 0.001 0.002 0.003 0.004
Strain
Loa
d (k
N)
Numerical
ExprimentalBC12
0
200
400
600
800
1000
1200
1400
0 0.002 0.004 0.006
Strain
Loa
d (k
N)
Numerical
Exprimental
Fig. 13: Comparison of experimental and numerical concrete strain results for tested beams at mid span
SC
I-PU
BLIC
ATIO
N Author M
anuscript

Am. J. Applied Sci., 5 (3): 248-262, 2008
258
BC3
0
100
200
300
400
500
600
0 0.001 0.002 0.003 0.004
Strain
Loa
d (k
N)
Numerical
Exprimental
BC4
0
100
200
300
400
500
600
700
0 0.001 0.002 0.003 0.004 0.005
Strain
Loa
d (k
N)
Numerical
Exprimental
BC6
0
200
400
600
800
1000
1200
0 0.001 0.002 0.003 0.004Strain
Loa
d (k
N)
Numerical
Exprimental
BC10
0
200
400
600
800
1000
1200
1400
0 0.001 0.002 0.003 0.004Strain
Loa
d (k
N)
Numerical
Exprimental
BC11
0
200
400
600
800
1000
1200
0 0.001 0.002 0.003 0.004Strain
Loa
d (k
N)
Numerical
ExprimentalBC12
0200400600800
100012001400
0 0.001 0.002 0.003 0.004 0.005Strain
Loa
d (k
N)
Numerical
Exprimental
Fig. 14: Comparison of experimental and numerical concrete strain results for tested beams at 20 cm from mid span
SC
I-PU
BLIC
ATIO
N Author M
anuscript

Am. J. Applied Sci., 5 (3): 248-262, 2008
259
BC3
0100200300400500600
0 0.001 0.002 0.003 0.004Strain
Loa
d (k
N)
Numerical
Exprimental
BC4
0100200300400500600700
0 0.001 0.002 0.003Strain
Loa
d (k
N)
Numerical
Exprimental
BC6
0
200
400
600
800
1000
1200
0 0.001 0.002 0.003 0.004
Strain
Loa
d (k
N)
Numerical
Exprimental
BC10
0
200400
600800
10001200
1400
0 0.001 0.002 0.003 0.004
Strain
Loa
d (k
N)
Numerical
Exprimental
BC11
0
200
400
600
800
1000
1200
0 0.001 0.002 0.003 0.004
Strain
Loa
d (k
N)
Numerical
Exprimental
BC12
0
200400
600
800
10001200
1400
0 0.001 0.002 0.003Strain
Loa
d (k
N)
Numerical
Exprimental
Fig. 15: Comparison of experimental and numerical concrete strain results for tested beams at under load
SC
I-PU
BLIC
ATIO
N Author M
anuscript

Am. J. Applied Sci., 5 (3): 248-262, 2008
260
05000
1000015000200002500030000350004000045000
Ene
rgy
(kN
-mm
)
BC3 BC4 BC6 BC10 BC11 BC12
Energy observed at Mid span Section
Num. in.
Num. tot.
Exp. in.
Exp. tot.
0
5000
10000
15000
20000
25000
30000
35000
Ene
rgy
(kN
-mm
)
BC3 BC4 BC6 BC10 BC11 BC12Energy observed at 20 cm from Mid span
Section
Num. in.
Num. tot.
Exp. in.
Exp. tot.
0
5000
10000
15000
20000
25000
30000
Ene
rgy
(kN
-mm
)
BC3 BC4 BC6 BC10 BC11 BC12
Energy observed at Under Load Section
Num. in
Num. tot.
Exp. in.
Exp. tot
Fig. 16: Comparison of experimental and numerical observed energy results for tested beams at different deformation of steel at yield, ductility can be calculated as the ratio of ultimate deformation to deformation at yield. The deformation can be deflections, strains or curvatures. Herein, the first two simple definitions experimentally and theoretically are used to address this problem in reinforced HSC beams at three different sections. Deflection ductility: The experimental and numerical values of deflections at yielding of tensile reinforcement, y∆ , and at ultimate load, � u∆ at mentioned sections are presented respectively in Table 2- 4. The graphical representation of comparison of experimental and numerical results of load-deflection are performed and shown in Figures 10-12. In general, for HSC beams, u∆ increases as ρ decreases. Also, by adding ρ′ in a section, u∆ will increase. It is obvious that y∆ increases as ρ increases and it will
be decreased as ρ′ increases in the section.
STRAIN DUCTILITY
In seismic areas, ductility is an important factor in design of concrete members under flexure; it is due to the increase in capacity of plastic displacement. As a result, the inertial forces imposed to the structures can be decreased. The effective factors on ductility are concrete compression strength f ′ , the percentage of tension and compression steel, ρ and ρ′ , the amount of stirrups confinement for concrete cρ , and their spacing, brittle effect of concrete strength, yield stress of longitudinal bars yf and the effect of width to the depth of the
section b/h and the value of concrete compressive strain [16, 17]. These factors are greatly affected on quantity of last mentioned factor ( uε ). In this area, the shortage of numerical and experimental research specially, while considering reinforced HSC members is available. Therefore, particular emphases are given on concrete compressive strains up to failure of members both
SCI-PU
BLICATIO
N Author M
anuscript

Am. J. Applied Sci., 5 (3): 248-262, 2008
261
numerically and experimentally. Table 5-7 present the value of concrete strains, ccε at yielding of tensile reinforcement, and at ultimate load, cuε at different sections. The graphical representation of comparison of experimental and numerical results of load-concrete strain are performed and shown in Figures 13-15. Displacement ductility is as the ratio of deflection at ultimate load to the deflection at first yielding of tensile steel. Ultimate load is the maximum load applied for a beam during testing[4]. Both experimental and numerical yield and ultimate loads are defined and their comparison is shown in Table 8.
ENERGY BASED METHOD OF DUCTILITY
Another method of finding ductility is based on the energy definition, ductility may be defined as the ratio relating any two of the inelastic, and total energy. The experimental and numerical value of observed energy at yield and ultimate load of Table 8 for different sections are presented in Table 9-11. Herein, the ratio of inelastic to total energy is considered from the load-deflection diagrams (Figures 10-12). The total energy is the area under the load-deflection curve, which can easily calculate (Equation 5 and 6).
�∆
∆∆∆=
u
y
dPEnergyInelastic )( (5)
�∆
∆∆=u
dPEnergyTotal0
)( (6)
The observed energy of tested beams are calculated and plotted in Figure 16. In addition, the comparisons of experimental and numerical results made by ANSYS modelling are shown in Figure 16.
COMPARISON OF LIFETIME HISTORY RESULTS
The comparison of load-deflection diagrams of tested beams and numerical results made by ANSYS modeling are plotted and shown in Figure 10-12 respectively. It is clear that for lifetime history of beams, the obtained variations in percentage of error are 9.09-24.02 and 1.48-34.82 at yielding and ultimate deflection respectively. The minimum percentage of error values of 9.09 and 1.48 are belong to the yield and ultimate load at 20cm from mid span section (Table4) whereas, The maximum percentage of error values of 24.02 and 34.82 are belong to the yield and ultimate
load at mid span section (Table2). This can be due to the material behavior introduced to the software and the nature of ANSYS program. The comparison of experimental and numerical results made by ANSYS modeling load-concrete strain diagrams for different sections are shown in Figures 13-15. It is clear that for life time history of beams, the minimum percentage of values of 1.43 and 5 are belong to the minimum yield and ultimate load (Table 6 and 7) respectively. Whereas, the maximum percentage of error values of 39.09 and 34.88 are belong to the yield and ultimate load (Table 7 and 5) respectively. The comparison of experimental and numerical yield and ultimate load results are presented in Table 8. The minimum and maximum error values for yield and ultimate loads are (11.04-18.55 and 8.56-17.72) respectively. Considering the observed energy, this comparison is shown in Tables 9-11. The minimum and maximum values of total and inelastic energy are between 0.3-29.22 and 1.04-33.58 respectively. However, for the ratio of inelastic to the total energy, it is between 0.15-13.53 respectively.
CONCLUSION
The comparison of load-deflection, load-concrete strain and energy observed diagrams of tested beams and numerical results made by ANSYS modelling are plotted and for lifetime history of beams at three considered sections, the following conclusions are obtained: 1- Considering the load-deflection diagrams, the obtained variations in percentage of error are 9.09-24.02 and 1.48-34.82 at yielding and ultimate deflection respectively. 2- Considering the load-strain diagrams, the minimum percentage of error values are 1.43 and 5 for the minimum yield and ultimate load respectively. Whereas, the maximum percentage of error values of 39.09 and 34.88 are belong to the yield and ultimate load respectively. 3-Considering experimental and numerical yield and ultimate load results the minimum and maximum obtained error values for yield and ultimate loads are (11.04-18.55 and 8.56-17.72) respectively. 4- Considering the observed energy, the comparison indicated that the minimum and maximum values of total and inelastic energy are between 0.3-29.22 and 1.04-33.58 respectively. However, for the ratio of inelastic to the total energy, it is between 0.15-13.53 respectively.
SC
I-PU
BLIC
ATIO
N Author M
anuscript

Am. J. Applied Sci., 5 (3): 248-262, 2008
262
5- As general, the percentage of error by two methods is reduced prior to yielding and it is increasing as the loads are reaching failure. 6- In general, for HSC beams, u∆ increases as ρ
decreases. Also, by adding ρ′ in a section, u∆ will increase. It is obvious that y∆ increases as ρ increases and it will be decreased as ρ′ increases in the section.
ACKNOWLEDGMENTS The authors would like to thank the Civil Engineering department of Kerman University for their assistant.
REFERENCES 1. F. Barbosa and O. R. Gabriel, 1988. Analysis of
Reinforced Concrete Structures using Ansys Nonlinear Concrete Model. Computational Mechanics
2. P. Fanning, 2001. Nonlinear Models of Reinforced and Post-tensioned Concrete Beams. Electronic Journal of Structural Engineering, 20: 111-119
3. Akbarzadeh H., 2004. Effect of tensile and compressive reinforcement ratio on ductility and behavior of high-strength concrete reinforced flexural members. M.Sc. Thesis, Department of Civil Engineering, University of Kerman , Kerman, Iran
4. A. A. Maghsoudi and H. Akbarzadeh, 2005. Effect of �� on Ductility of HSC Members Under Bending. Seventh International Symposium on Utilization of High-Strength/High Performance Concrete, Washington , D.C. , USA
5. D. Kachlakev, T. Miller and S. Yim, 2001. Finite Element Modeling of Reinforced Concrete Structures Strength with FRP Laminates. Report for Oregan Department of Transportation, Salem
6. R. L. Carrasquillo, A. H. Nilson and F. O. Slate, 1981. Properties of high strength concrete subject to short-term loads. Journal of American Concrete. Institute, 78(3):171?178
7. Federation International de la Pre contrainte/Comite Euro-International due Beton (FIP/CEB), High Strength Concrete: State of the Art Report. Bull. d,Information No. 197, London , 1990
8. ACI 1992. State-of-the-Art Report on High-Strength Concrete. ACI 363R, Detroit
9. R. G. Burg and B. W. Ost, 1992. Engineering Properties of Commercially Available High-Strength Concretes. PCA Research and Development Bull., RD104T. Portland Cement Association, Skokie , Ill
10. M. A. Mansur, T. H. Wee and M. S. Chin, 1994. Some Engineering Properties of Locally Produced High-Strength Concrete. Proc., 19th Conf. on our World in Concrete and Structures, CI-Premier Pte. Ltd., Singapore , 97?106
11. M. A. Rashid, M. A. Mansur and P. Paramasivam, 2002. Correlations Between Mechanical Properties of High-Strength concrete. Journal of Materials in Civil Engineering, 14(3): 230-238
12. ANSYS, ANSYS User?s Manual. Version 9 13. K. J. William and E. D. Warnke, 1975.Constitutive
Model for the Triaxial Behaviour of Concrete. Proceedings of the International Association for Bridge and Structural Engineering. ISMES, Bergamo , Italy . 19: 174
14. S. A. Popovics, 1973. Numerical Approach to the Complete Stress-Strain Curve of Concrete. Cement and Concrete Research, 5(3): 583-599
15. E. Thorenfeldt and A. Tomaszewicz, 1987. Mechanical Properties of High-Strength Concrete and Application in Design. Proceedings of the Symposium Utilization of High-Strength Concrete. Tapir, Trondheim . 149-159
16. Park R. and T.Paulay, 1975. Reinforced Concrete Structures? A Wiley Interscience Publication John Wiley and Sons. New York , London , Sydney , Toronto
17. A. A. Maghsoudi and H. Akbarzadeh, 2006. Flexural Ductility of HSC Members. Journal of Structural Engineering and Mechanics.
SC
I-PU
BLIC
ATIO
N Author M
anuscript