nonresponse bias analysis for establishment surveys · nonresponse bias analysis for establishment...
TRANSCRIPT
Nonresponse Bias Analysis for
Establishment Surveys
Guidance from the U.S. Office of
Management and Budget
Brian A. Harris-Kojetin Statistical and Science Policy
Office of Management and Budget
October 15, 2012
The views expressed in this presentation are those of the author
and do not represent changes in OMB policy.
Acknowledgements
• Robert Groves and J. Michael Brick,
• Clyde Tucker, John Dixon, David Cantor
• FCSM Subcommittee on Standards for
Statistical Surveys
2
Overview
• OMB Standards and Guidance on surveys
• Nonresponse rates and Nonresponse bias
analyses
• Overview of techniques for studying
nonresponse bias
• Some key lessons learned so far
3
4
Background
• OMB is charged to develop and oversee the implementation of Government-wide polices, principles, standards and guidelines concerning
– statistical collection procedures and methods
– statistical data classifications
– statistical information presentation and dissemination
– timely release of statistical data
44 USC 3504(e)
5
OMB Guidance and Standards
• Standards and Guidelines for Statistical
Surveys
– Issued in final in September 2006
• Questions and Answers When Designing
Surveys for Information Collections
– Issued in January 2006
• Both available at: – http://www.whitehouse.gov/omb/inforeg_statpolicy/
6
OMB Q&A Guidance
• Audience: all Federal agencies conducting and
sponsoring collections of information that use
statistical methods (broadly defined)
• Assumes little knowledge of clearance
process, survey methodology, and statistics
• 81 Q&A’s
7
Standards for Statistical Surveys
• Revision and Update of Statistical Policy Directives 1 and 2, Standards for Statistical Surveys and Publication of Statistics
• 20 Standards
• Supplemented with Guidelines or Best Practices
– help agencies interpret and fulfill the goals of the Standard
8
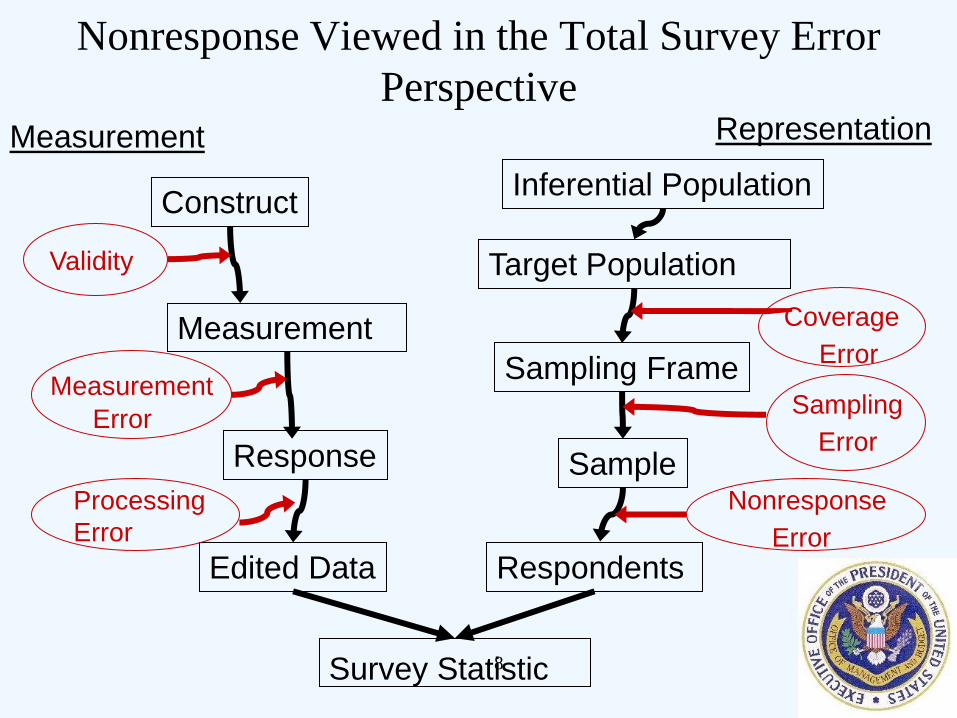
Construct Inferential Population
Measurement
Response
Target Population
Sampling Frame
Sample
Validity
Measurement
Error
Coverage
Error
Sampling
Error
Measurement Representation
Respondents
Nonresponse
Error
Edited Data
Processing
Error
Survey Statistic
Nonresponse Viewed in the Total Survey Error
Perspective
9
Q&A Guidance on Response Rates
and Nonresponse Bias
• Why are response rates important?
• How should response rates be calculated?
• When should weighted response rates be
reported?
• What are acceptable response rates for
different kinds of survey collections?
10
Why are response rates important?
• Common data quality and field performance indicator
• Nonresponse can occur for a number of reasons with different implications
– refusals
– noncontacts
• Response rates are a useful indicator for the risk of nonresponse bias
11
What are acceptable response rates for
different kinds of collections?
• Surveys collecting “influential information”
should achieve high response rates
– dissemination of the information will have or
does have a clear and substantial impact on
important public policies or important private
sector decisions
• Agencies need to consider how they will
use the data and how the methods chosen
will achieve acceptable response rates and
data quality
12
Standards for Statistical Surveys
Standard 1.3 Survey Response Rates • Agencies must design the survey to achieve the
highest practical rates of response, commensurate with the importance of survey uses, respondent burden, and data collection costs, to ensure that survey results are representative of the target population so that they can be used with confidence to inform decisions. Nonresponse bias analyses must be conducted when unit or item response rates suggest the potential for bias to occur.
13
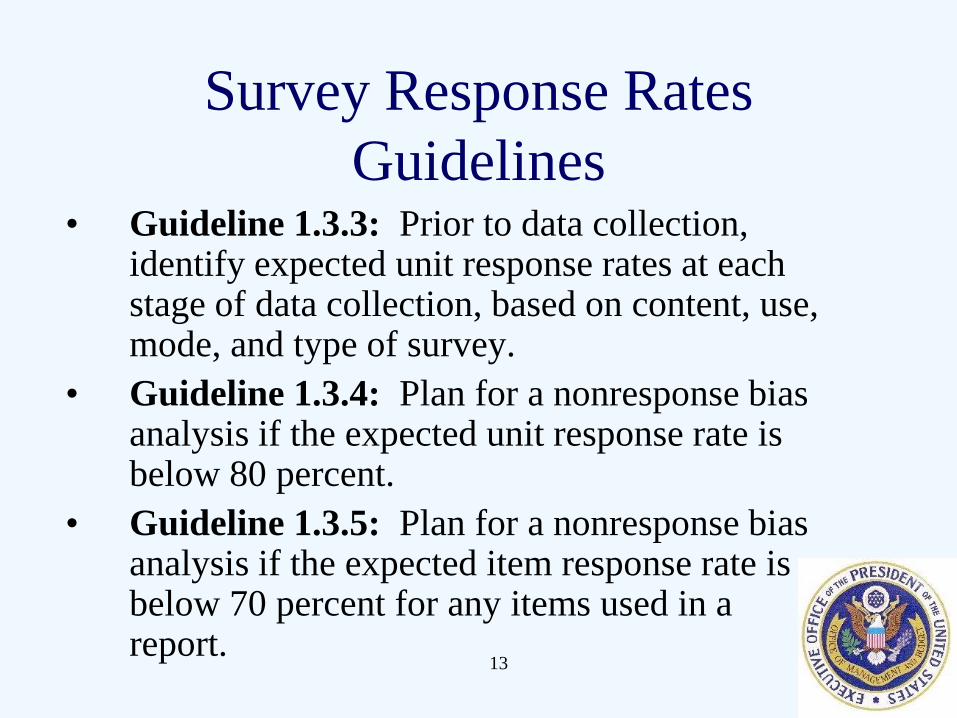
Survey Response Rates
Guidelines • Guideline 1.3.3: Prior to data collection,
identify expected unit response rates at each stage of data collection, based on content, use, mode, and type of survey.
• Guideline 1.3.4: Plan for a nonresponse bias analysis if the expected unit response rate is below 80 percent.
• Guideline 1.3.5: Plan for a nonresponse bias analysis if the expected item response rate is below 70 percent for any items used in a report.
14
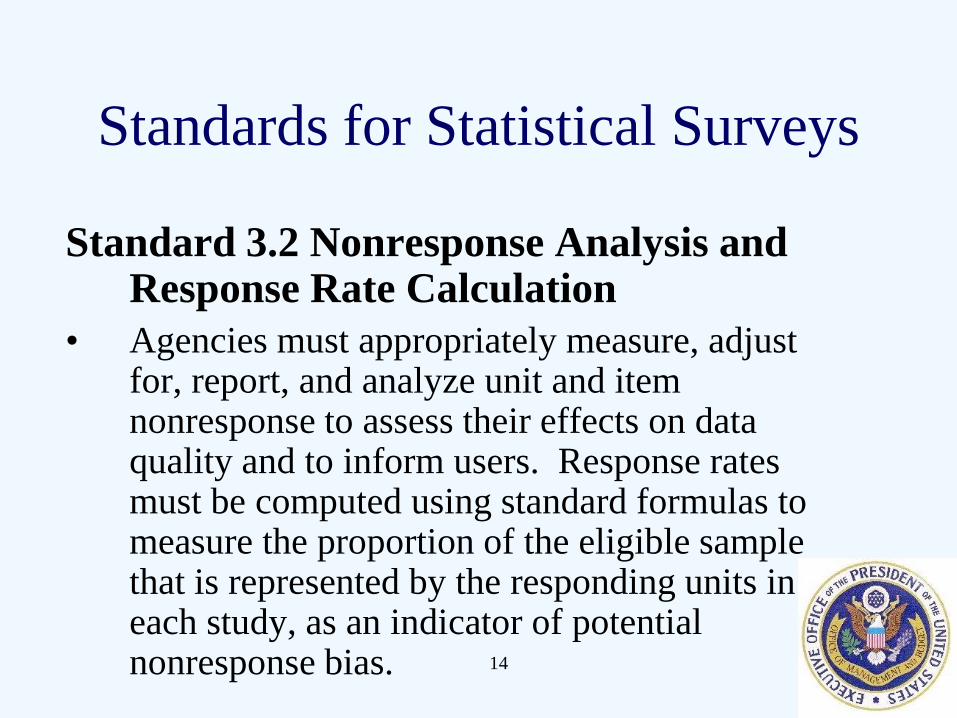
Standards for Statistical Surveys
Standard 3.2 Nonresponse Analysis and Response Rate Calculation
• Agencies must appropriately measure, adjust for, report, and analyze unit and item nonresponse to assess their effects on data quality and to inform users. Response rates must be computed using standard formulas to measure the proportion of the eligible sample that is represented by the responding units in each study, as an indicator of potential nonresponse bias.
15
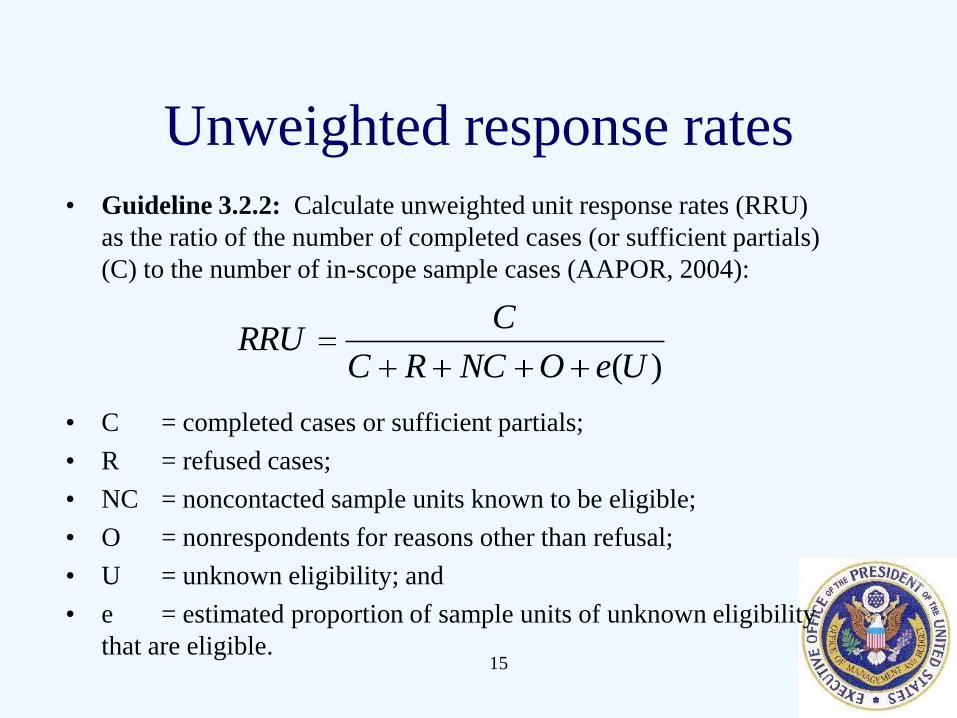
Unweighted response rates
• Guideline 3.2.2: Calculate unweighted unit response rates (RRU)
as the ratio of the number of completed cases (or sufficient partials)
(C) to the number of in-scope sample cases (AAPOR, 2004):
• C = completed cases or sufficient partials;
• R = refused cases;
• NC = noncontacted sample units known to be eligible;
• O = nonrespondents for reasons other than refusal;
• U = unknown eligibility; and
• e = estimated proportion of sample units of unknown eligibility
that are eligible.
)(UeONCRC
CRRU
16
Weighted response rates
• Guideline 3.2.3: Calculate weighted unit response rates
(RRW) to take into account the different probabilities of
selection of sample units, or for economic surveys, the
different proportions of key characteristics that are
represented by the responding units.
Many economic surveys use weighted response rates that
reflect the proportion of a key characteristic, y, such as
“total assets,” “total revenues,” or “total amount of coal
produced.” It may be referred to as a coverage rate, but it
is a weighted item response rate where the item of
interest is a quantity of primary interest for the survey.
17
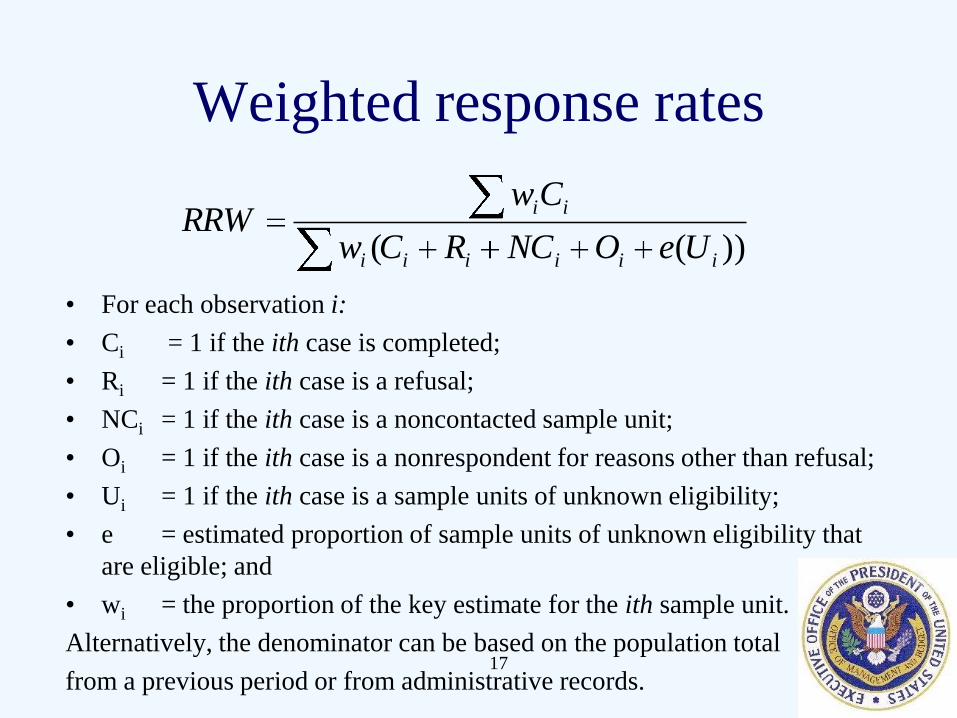
Weighted response rates
• For each observation i:
• Ci = 1 if the ith case is completed;
• Ri = 1 if the ith case is a refusal;
• NCi = 1 if the ith case is a noncontacted sample unit;
• Oi = 1 if the ith case is a nonrespondent for reasons other than refusal;
• Ui = 1 if the ith case is a sample units of unknown eligibility;
• e = estimated proportion of sample units of unknown eligibility that
are eligible; and
• wi = the proportion of the key estimate for the ith sample unit.
Alternatively, the denominator can be based on the population total
from a previous period or from administrative records.
))(( iiiiii
ii
UeONCRCw
CwRRW
18
Nonresponse Analysis
• Guideline 3.2.9: Given a survey with an
overall unit response rate of less than 80
percent using unit response rates as
defined above, conduct an analysis of
nonresponse bias with an assessment of
whether the data are missing completely
at random.
19
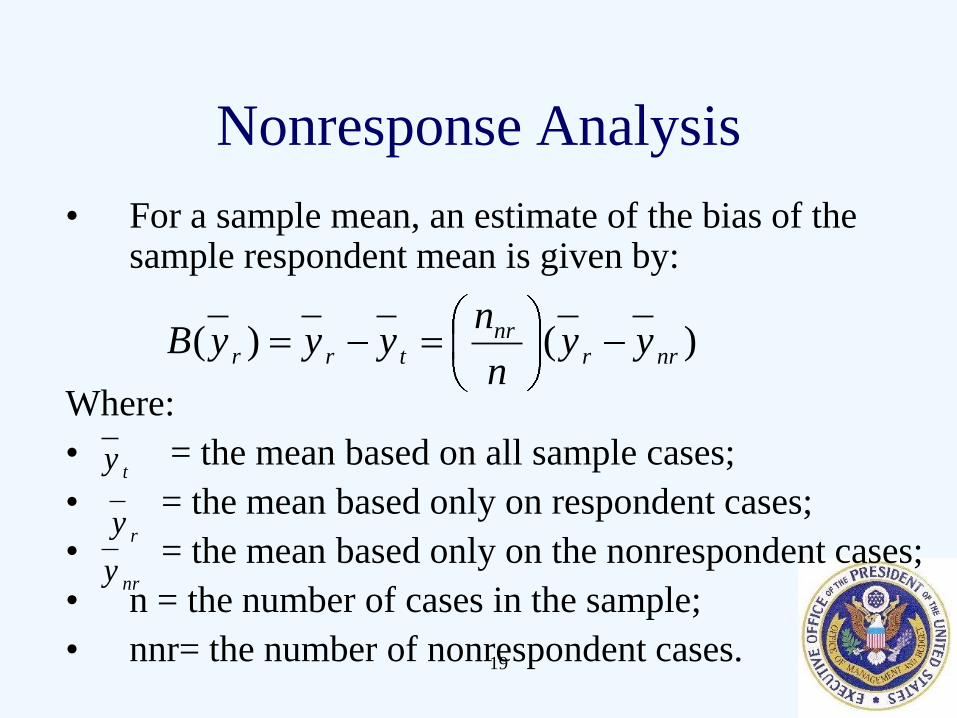
Nonresponse Analysis
• For a sample mean, an estimate of the bias of the sample respondent mean is given by:
Where:
• = the mean based on all sample cases;
• = the mean based only on respondent cases;
• = the mean based only on the nonrespondent cases;
• n = the number of cases in the sample;
• nnr= the number of nonrespondent cases.
)()(nrr
nrtrr
yyn
nyyyB
ty
ry
nry
20
How can agencies examine potential
nonresponse bias?
• Nonresponse bias analyses can include:
– Response rates by different subgroups
– Comparing nonrespondents and respondents on frame variables
– Comparing initial refusers with initial respondents
• Subsample nonrespondents for more extensive follow-up efforts
– Use information to estimate characteristics of nonrespondents
Overview of Nonresponse Bias
Study Techniques
1. Comparison to other estimates
(benchmarking)
2. Nonresponse bias for estimates based on
variables available on sample
3. Studying variation within the respondent set
4. Altering the weighting adjustments
5. Subsample nonrespondents for intensive
follow-up
1. Comparison to Other
Estimates -- Benchmarking
• Data or estimates from another source that are
closely related to respondent estimates used to
evaluate bias due to nonresponse in the survey
estimates
• Another survey or administrative record system
may contain estimates of variables similar to those
being produced from the survey
• Difference between estimates from survey and
other data source is an indicator of bias (both
nonresponse and other)
2. Comparing Respondents and Non-
respondents on available information
• Compare statistics available on both respondents and non-respondents
• The extent there is a difference is an indication of the bias
• Possible Sources of Data:
– Sampling frame variables
– Matched variables from other data-sets
– Screener information
3. Studying variation within the
respondents: Level of Effort
• Some nonresponse models assume that those units that require more effort to respond (more callbacks, incentives, refusal conversion) are similar to the units that do not respond
• Characteristics are estimated for respondents by level of effort (e.g., response propensity scores)
• Models fitted to see if it fits and can be used to estimate characteristics of nonrespondents
4. Weighting Adjustments
• Weighting can reduce nonresponse bias if the
weights are correlated with the estimate.
• Alter estimation weights and compare the estimates
using the various weights to evaluate nonresponse bias. – Weighting methods may include poststratification, raking,
calibration, logistic regression, or even imputation.
• Auxiliary data in weighting that are good predictors
of the characteristic may give alternative weights that
have less bias.
• If the estimates vary by the weighting scheme, then
the weighting approach should be carefully examined and
the one most likely to have lower nonresponse bias
should be used.
5. Subsample Nonrespondents for
Intensive Follow-up
• Use of respondent data obtained through
extra-ordinary efforts as comparison to
respondent data obtained with traditional
efforts
• “Effort” may include callbacks, incentives,
change of mode, use of elite corps of
interviewers
27
Implementation of Standards
• Application of standards requires judgment balancing use of the information and resources
• A key tool for monitoring and enforcing government-wide use of the standards and classification is the information review process under the Paperwork Reduction Act
• All Federal agencies must submit all proposed information collections to OMB.
– All information collected from 10 or more members of the public must be approved by OMB.
– All collections are subject to public comment.
– Collections are approved for a maximum of three years.
28
Key Lessons
• Nonresponse bias can be studied within cost
constraints
– The amount of effort should be proportionate to
the “size” of the survey and the use of the
estimates.
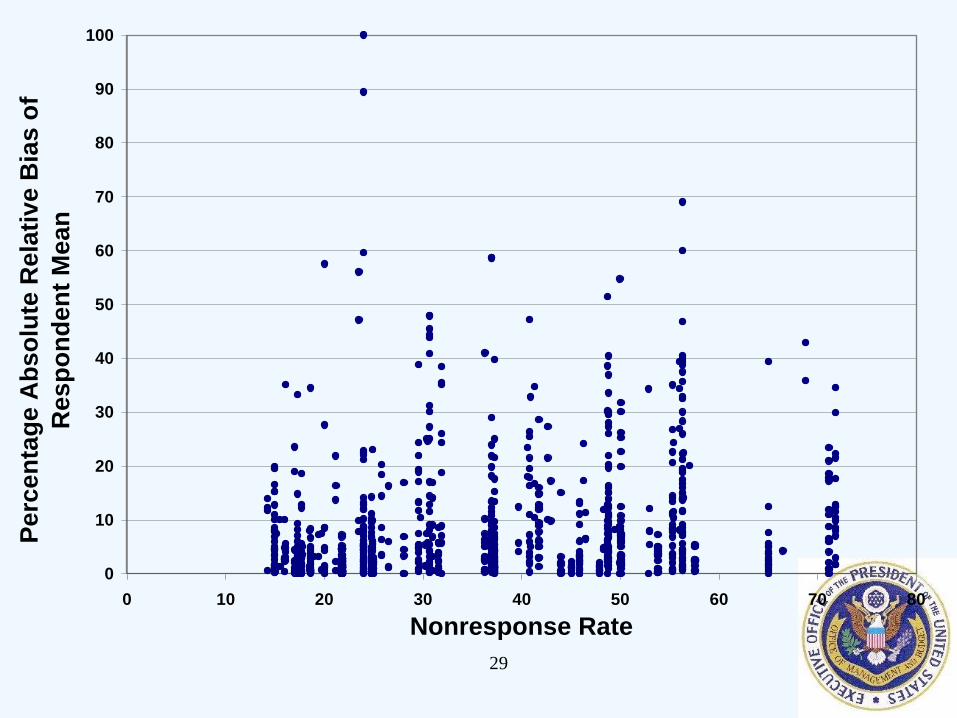
• Existing empirical evidence from household
surveys suggests that response rates are not
good predictors of nonresponse bias
– Nonresponse bias is specific to a statistic
29
0
10
20
30
40
50
60
70
80
90
100
0 10 20 30 40 50 60 70 80
Nonresponse Rate
Pe
rce
nta
ge
Ab
so
lute
Re
lati
ve
Bia
s o
f
Res
po
nd
en
t M
ea
n
30
Key Lessons
• Your survey has estimates that are biased
due to nonresponse
– Some estimates are more biased than others
– Even if some estimates are biased doesn’t mean
all are biased (and vice versa)
• Even though the response rate is not a good
predictor of nonresponse errors does not
mean we can/should ignore it
31
Key Lessons
• Each method of studying nonresponse
provides limited insight into potential
nonresponse bias…therefore,
• Multiple methods are needed
• Think about nonresponse before the survey
32
For Further Information
• Standards and Guidelines for Statistical Surveys
available at:
– http://www.whitehouse.gov/omb/inforeg_statpolicy
• Federal Committee on Statistical Methodology
– www.fcsm.gov
– See working paper #31: Measuring and Reporting
Sources of Error in Surveys
• Contact Brian Harris-Kojetin at