noor financial investment company - kpsc
TRANSCRIPT


Noor Financial Investment Company - KPSC and Subsidiaries
Annual Report 2020
Value I Sustainability I Growth
www.noorinvestment.com
Noor Corporate OfficeIntersection of Jahra Street & Airport RoadShuwaikh, KuwaitP.O. Box 3311 Safat، 13034 Kuwait
Tel: +965 181 80 80 Fax: +965 24929561/2email: [email protected]
Des
ign
& C
once
pt b
y SQ
UA
RE -
sqpm
.com

H. H. SheikhNawaf Al-Ahmad Al-Jaber Al-Sabah
Amir of the State of Kuwait
H. H. SheikhMeshaal Al-Ahmad Al-Jaber Al-Sabah
Crown Prince of the State of Kuwait

76 Annual Report 2020Noor Financial Investment Company - KPSC and Subsidiaries
CONTENTS
Vision, Mission, Values
Key Figures 2020
A brief overview of the Company
Subsidiaries and Associates
Summary of Financial Statements
Vertical Analysis of the Statements of Financial Position and Profit or Loss
Horizontal Analysis of the Statements of Financial Position and Profit or Loss
Board of Directors
Management Team
Board of Directors’ Report
Corporate Governance Report
Board Audit Committee Report and Internal Control Review Report
Remunerations and Allowances Report
Report for the transactions with the Related Parties
Pledge and endorsement of the board of director about the accuracy of financialstatements
Consolidated Financial Statements and Independent Auditors’ Report
9
11
13
14 - 15
16 - 17
18 - 19
20 - 21
22 - 27
28 - 29
30 - 32
33- 46
47 - 49
50 - 53
54 - 55
56 - 57
58 - 117

8 Noor Financial Investment Company - KPSC and Subsidiaries
VISIONWe aspire to be the leading investment company of choice in
the Gulf Cooperation Council (GCC).
MISSIONWe, at Noor, follow the best industry practices in our endeavor to generate superior returns and create value for our shareholders, clients and partners.
We:
• Invest in a vast array of investment classes including equity, fixed income, real estate and private equity
• Provide corporate advisory and asset management services
• Make strategic partnerships locally and internationally with reputable entities
• Invest in human capital and inculcate core values
VALUES• Ethics, personal integrity and transparency
• Team work, respect and accountability
• Innovation and knowledge sharing
• Passion for excellence in execution
9Annual Report 2020

10 Noor Financial Investment Company - KPSC and Subsidiaries 11Annual Report 2020
in KD millions
Consolidated Income
Shareholders' Profit
Earnings Per Share (Fils)
Consolidated Assets
Cash & Cash Equivalents
Shareholders' Equity
Book Value Per Share (Fils)
28.50
11.86
30.02
107.19
9.54
66.88
169.4
KEY FIGURES 2020
12 Noor Financial Investment Company - KPSC and Subsidiaries 13Annual Report 2020
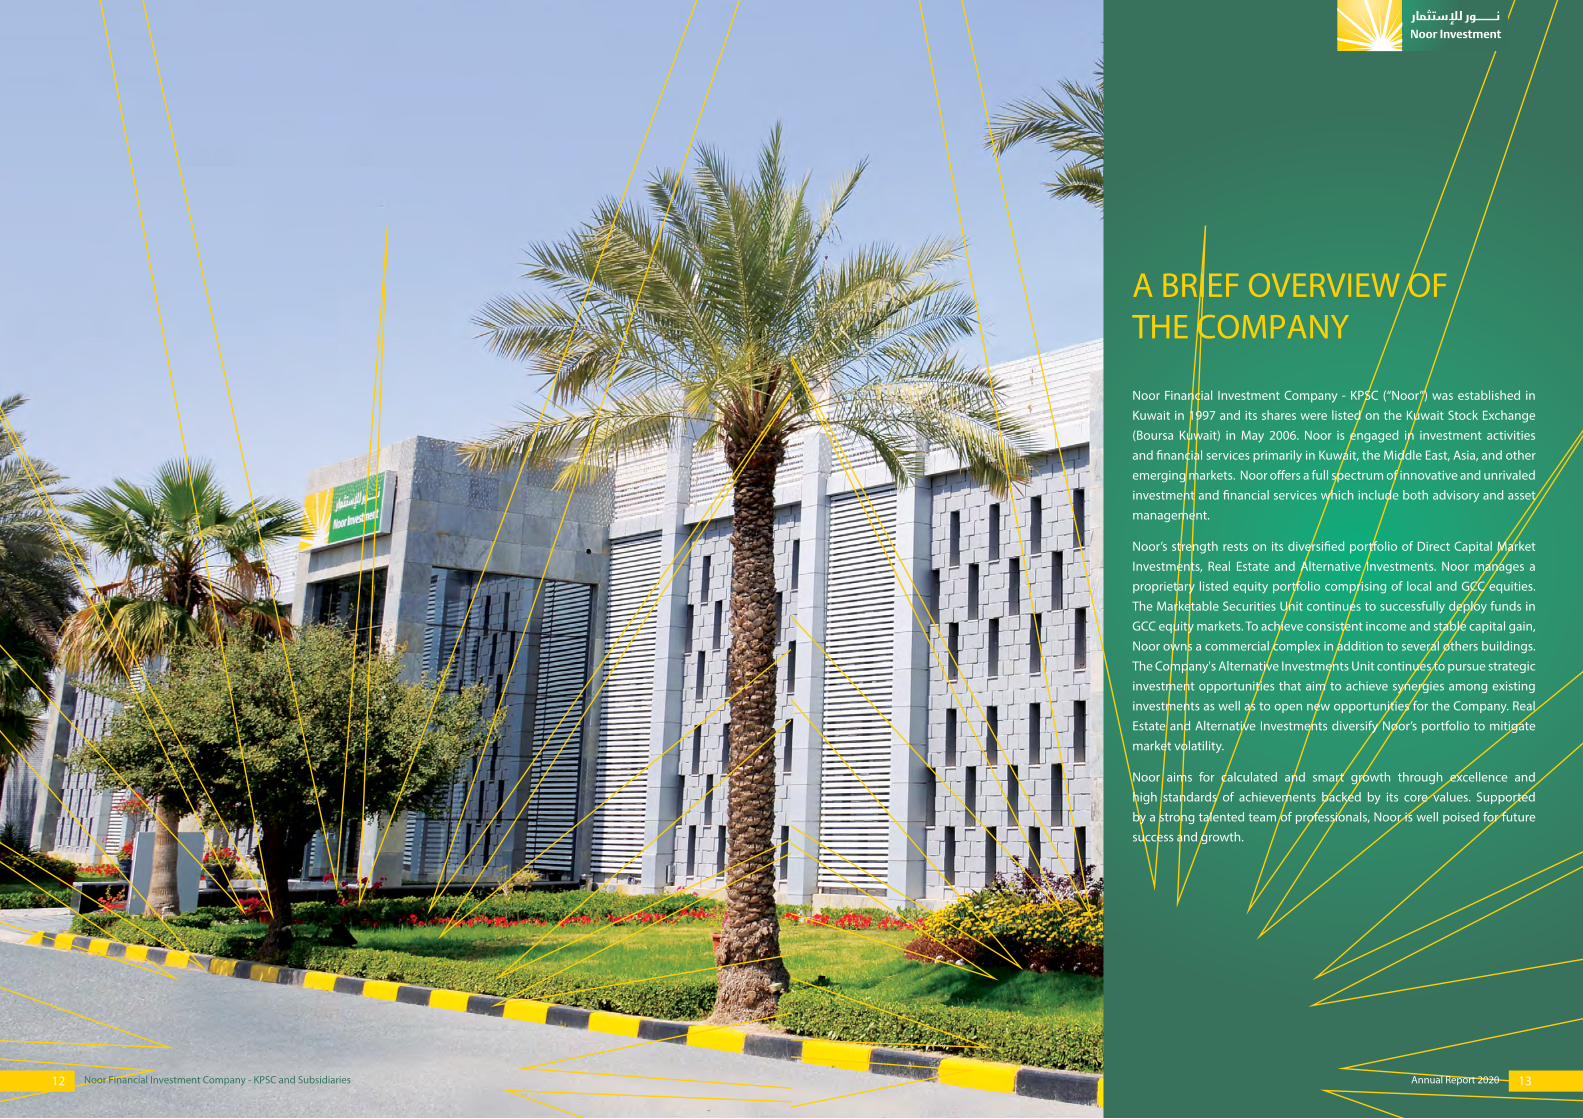
A BRIEF OVERVIEW OFTHE COMPANY
Noor Financial Investment Company - KPSC (“Noor”) was established in Kuwait in 1997 and its shares were listed on the Kuwait Stock Exchange (Boursa Kuwait) in May 2006. Noor is engaged in investment activities and financial services primarily in Kuwait, the Middle East, Asia, and other emerging markets. Noor offers a full spectrum of innovative and unrivaled investment and financial services which include both advisory and asset management.
Noor’s strength rests on its diversified portfolio of Direct Capital Market Investments, Real Estate and Alternative Investments. Noor manages a proprietary listed equity portfolio comprising of local and GCC equities. The Marketable Securities Unit continues to successfully deploy funds in GCC equity markets. To achieve consistent income and stable capital gain, Noor owns a commercial complex in addition to several others buildings. The Company's Alternative Investments Unit continues to pursue strategic investment opportunities that aim to achieve synergies among existing investments as well as to open new opportunities for the Company. Real Estate and Alternative Investments diversify Noor’s portfolio to mitigate market volatility.
Noor aims for calculated and smart growth through excellence and high standards of achievements backed by its core values. Supported by a strong talented team of professionals, Noor is well poised for future success and growth.

14 Noor Financial Investment Company - KPSC and Subsidiaries 15Annual Report 2020
Meezan Bank Limited - PakistanNoor is the largest shareholder in Meezan Bank Limited, Pakistan which is the first and the largest Islamic bank in Pakistan with more than 800 branches across 248 cities in the country. Besides traditional banking channels, the Bank offers numerous alternate distribution channels including internet and mobile banking. Meezan Bank has assets of more than USD 9.5 Billion and deposits of more than USD 7.8 Billion.
Our Subsidiaries and Associates Include:
Hotels Global Group Company - Jordan (HGG)Through its subsidiary, Hotels Global Group Company in Jordan, Noor holds the concession rights of Amman International Airport Hotel which is a 4-star hotel with 300 rooms and multiple Food and Beverage outlets as well as other facilities. Hotels Global Group Company is also operating a transit hotel within the new Queen Alia International Airport terminal in addition to management of third party hospitality businesses.
Noor Telecommunication Company KSCC - KuwaitNoor Telecommunication Company KSCC (Noortel) is a Kuwait-based closed shareholding company that was incorporated in 2007. Noortel carries out its business activities through a specialized group of its subsidiaries and affiliates in Information, Communication and Technology related sectors. Noortel’s IT operations include Arab Information Management Services (AIMS).

SUMMARY OFFINANCIAL STATEMENTS
Amounts in Million KD
2020 2019 2018 2017 2016 2015
Summary of Financial Position
Share capital 41.32 41.32 41.32 41.32 41.32 41.32
Shareholders’ equity 66.88 64.62 54.98 42.44 46.04 43.49
Total borrowings 22.70 27.35 49.11 99.77 106.17 111.90
Long term assets 80.58 78.05 90.54 103.73 116.19 140.56
Total assets 107.19 108.23 131.31 171.11 183.59 186.02
Summary of Profit or Loss
Consolidated income 28.50 29.99 30.71 25.86 24.22 29.62
Profit/(loss) for the year 12.13 8.92 23.79 2.10 0.57 (1.45)
Profit for the year attributable to the owners of the Parent Company 11.86 8.08 24.83 2.84 1.15 1.33
Summary of Cash Flows
Net cash flow from/(used in) operating activities 3.49 (0.06) 6.10 2.71 (0.53) 6.44
Net cash flow from investing activities 7.67 11.75 29.98 5.43 14.48 10.18
Net cash flow used in financing activities (8.16) (14.57) (39.27) (11.22) (6.26) (14.86)
Changes in cash and cash equivalents 3.00 (2.87) (3.20) (3.08) 7.69 1.76
Cash and cash equivalents at end of the year 9.54 6.54 9.42 12.62 15.70 8.01
Ratios
Return on equity 18% 13% 45% 7% 3% 3%
Current ratio 242% 238% 181% 67% 109% 211%
Quick ratio 101% 73% 49% 15% 29% 53%
Debt to equity ratio 18% 29% 57% 140% 131% 162%
1716 Annual Report 2020Noor Financial Investment Company - KPSC and Subsidiaries

1918 Annual Report 2020Noor Financial Investment Company - KPSC and Subsidiaries
Amou
nts i
n M
illio
n KD
2020
2019
2018
2017
2016
2015
Ass
ets
%
%
%
%
%
%
Cash
and
ban
k ba
lanc
es 4
.13
3.9%
2.5
8 2.
4% 5
.28
4.0%
8.4
9 5.
0% 1
0.42
5.
7% 7
.74
4.2%
Shor
t ter
m d
epos
its 7
.00
6.5%
5.6
3 5.
2% 4
.86
3.7%
5.2
6 3.
1% 6
.80
3.7%
2.6
1 1.
4%W
akal
a an
d su
kuk
inve
stm
ents
- -
1.0
0 0.
9% 1
.15
0.9%
1.1
5 0.
7% 1
.16
0.6%
1.0
0 0.
5%In
vest
men
ts a
t fai
r val
ue th
roug
h pr
ofit o
r los
s 7
.60
7.1%
11.
70
10.8
% 1
1.71
8.
9% 1
0.91
6.
4% 1
1.27
6.
1% 1
1.70
6.
3%A
ccou
nts
rece
ivab
le a
nd o
ther
ass
ets
4.4
9 4.
2% 4
.45
4.1%
9.9
2 7.
6% 1
0.90
6.
4% 1
4.77
8.
1% 1
5.27
8.
2%In
vent
orie
s 0
.59
0.5%
0.5
3 0.
5% 0
.51
0.4%
0.7
7 0.
5% 0
.77
0.4%
0.8
8 0.
5%FV
OCI
Inve
stm
ents
13.
24
12.4
% 1
6.17
14
.9%
15.
88
12.1
% -
- -
- -
- A
vaila
ble
for s
ale
inve
stm
ents
- -
- -
- -
33.
72
19.6
% 3
5.07
19
.1%
43.
99
23.6
%In
vest
men
t in
asso
ciat
es 5
2.12
48
.6%
46.
72
43.2
% 4
4.05
33
.5%
61.
99
36.2
% 6
0.76
33
.1%
53.
08
28.5
%In
vest
men
t pro
pert
ies
13.
06
12.2
% 1
3.90
12
.8%
31.
74
24.2
% 3
0.05
17
.5%
33.
82
18.4
% 3
9.76
21
.4%
Prop
erty
and
equ
ipm
ent
1.6
7 1.
5% 1
.96
1.9%
2.8
2 2.
1% 3
.08
1.8%
3.4
0 1.
9% 4
.39
2.4%
Righ
t of u
se o
f ass
ets
1.2
6 1.
2% 1
.43
1.3%
- -
- -
- -
- -
Goo
dwill
and
oth
er in
tang
ible
ass
ets
2.0
3 1.
9% 2
.16
2.0%
3.3
9 2.
6% 4
.79
2.8%
5.3
5 2.
9% 5
.60
3.0%
Tota
l ass
ets
107
.19
100.
0% 1
08.2
3 10
0.0%
131
.31
100.
0% 1
71.1
1 10
0.0%
183
.59
100.
0% 1
86.0
2 10
0.0%
Liab
iliti
es a
nd E
quit
yLi
abili
ties
Due
to b
anks
0.3
3 0.
3% 0
.41
0.4%
0.7
2 0.
5% 0
.92
0.5%
1.2
0 0.
6% 2
.02
1.1%
Acc
ount
s pa
yabl
e an
d ot
her l
iabi
litie
s 9
.27
8.6%
8.1
6 7.
5% 1
0.95
8.
3% 7
.12
4.2%
6.5
8 3.
6% 7
.57
4.1%
Borr
owin
gs 2
2.70
21
.2%
27.
35
25.2
% 4
9.11
37
.4%
99.
77
58.3
% 1
06.1
7 57
.8%
111
.90
60.2
%Pr
ovis
ion
for e
nd o
f ser
vice
inde
mni
ty 1
.27
1.2%
1.0
6 1.
0% 0
.94
0.7%
0.8
8 0.
5% 0
.72
0.4%
0.5
9 0.
3%To
tal l
iabi
litie
s 3
3.57
31
.3%
36.
98
34.1
% 6
1.72
46
.9%
108
.69
63.5
% 1
14.6
7 62
.4%
122
.08
65.7
%
Equi
tySh
are
capi
tal
41.
32
38.5
% 4
1.32
38
.2%
41.
32
31.5
% 4
1.32
24
.2%
41.
32
22.5
% 4
1.32
22
.2%
Shar
e pr
emiu
m 3
.41
3.2%
3.4
1 3.
1% 3
.41
2.6%
3.4
1 2.
0% 3
.41
1.9%
3.4
1 1.
8%Tr
easu
ry s
hare
s (4
.14)
-3.8
% (4
.14)
-3.8
%(3
.54)
-2
.7%
(3.4
1)-2
.0%
(3.4
1)-1
.9%
(3.4
1)-1
.8%
Lega
l res
erve
6.6
8 6.
2% 5
.47
5.1%
4.6
3 3.
5% 2
.06
1.2%
1.7
6 1.
0% 1
.64
0.9%
Volu
ntar
y re
serv
e 6
.68
6.2%
5.4
7 5.
1% 4
.63
3.5%
2.0
6 1.
2% 1
.76
1.0%
1.6
4 0.
9%Cu
mul
ativ
e ch
ange
s in
fair
valu
e (4
.59)
-4.3
% 1
.41
1.3%
(4.9
9)-3
.8%
3.8
1 2.
2% 5
.90
3.2%
3.8
5 2.
1%Fo
reig
n cu
rren
cy tr
ansl
atio
n re
serv
e (2
4.30
)-2
2.7%
(23.
09)
-21.
3%(2
0.91
) -1
5.9%
(13.
88)
-8.1
% (9
.74)
-5.3
% (9
.81)
-5.3
%Re
tain
ed e
arni
ngs
41.
82
39.1
% 3
4.77
32
.0%
30.
42
23.2
% 7
.07
4.1%
5.0
4 2.
7% 4
.85
2.6%
Equi
ty a
ttri
buta
ble
to th
e ow
ners
of t
he P
aren
t Com
pany
66.
88
62.4
% 6
4.62
59
.7%
54.
97
41.9
% 4
2.44
24
.8%
46.
04
25.1
% 4
3.49
23
.4%
Non
-Con
trol
ling
Inte
rest
s 6
.74
6.3%
6.6
3 6.
2% 1
4.62
11
.2%
19.
98
11.7
% 2
2.88
12
.5%
20.
45
10.9
%To
tal e
quit
y 7
3.62
68
.7%
71.
25
65.9
% 6
9.59
53
.1%
62.
42
36.5
% 6
8.92
37
.6%
63.
94
34.3
%To
tal l
iabi
litie
s an
d eq
uity
107
.19
100.
0% 1
08.2
3 10
0.0%
131
.31
100.
0% 1
71.1
1 10
0.0%
183
.59
100.
0% 1
86.0
2 10
0.0%
Ver
tica
l ana
lysi
s of
the
cons
olid
ated
sta
tem
ent o
f fina
ncia
l pos
itio
n
Amou
nts i
n M
illio
n KD
2020
2019
2018
2017
2016
2015
%
%
%
%
%
%
Reve
nue
from
hot
el o
pera
tions
and
IT S
ervi
ces
13.
31
46.7
% 1
3.39
44
.6%
14.
37
46.8
% 1
7.31
66
.9%
14.
91
61.6
% 1
5.70
53
.0%
Real
ised
(los
s)/g
ain
on in
vest
men
ts a
t fai
r val
ue th
roug
h pr
ofit o
r los
s (0
.15)
-0.5
% 1
.87
6.2%
1.2
8 4.
2% 0
.02
0.1%
0.0
8 0.
3% 0
.55
1.9%
Unr
ealis
ed g
ain/
(loss
) on
inve
stm
ents
at f
air v
alue
thro
ugh
profi
t or
loss
0.0
7 0.
2% 1
.71
5.7%
0.5
6 1.
8% 0
.23
0.9%
(0.0
1)-0
.1%
(1.6
1)-5
.5%
Real
ised
gai
n/(lo
ss) o
n sa
le o
f ava
ilabl
e fo
r sal
e in
vest
men
ts -
- -
- -
- 0
.23
0.9%
(0.4
4)-1
.8%
1.5
6 5.
3%Ch
ange
in fa
ir va
lue
of in
vest
men
t pro
pert
ies
(0.8
7)-3
.1%
(1.1
5)-3
.8%
(0.4
9)-1
.6%
(2.0
9)-8
.1%
(0.6
0)-2
.5%
0.9
6 3.
2%D
ivid
end
inco
me
0.8
1 2.
8% 1
.15
3.8%
1.5
0 4.
9% 1
.17
4.5%
1.1
2 4.
6% 2
.14
7.2%
Shar
e of
resu
lts o
f ass
ocia
tes
14.
85
52.1
% 1
0.77
35
.9%
8.6
5 28
.2%
7.7
0 29
.8%
8.2
8 34
.2%
7.1
7 24
.2%
Man
agem
ent a
nd p
lace
men
t fee
s 0
.01
0.1%
0.0
2 0.
1% 0
.02
0.1%
0.0
4 0.
2% 0
.02
0.1%
1.6
2 5.
5%Re
aliz
ed g
ain/
(loss
) on
sale
of i
nves
tmen
t pro
pert
ies
- -
- -
- -
0.0
5 0.
2% (0
.85)
-3.5
% -
- Re
ntal
Inco
me
0.4
7 1.
7% 0
.65
2.2%
0.6
2 1.
9% 1
.20
4.6%
1.7
1 7.
1% 1
.53
5.2%
Real
ised
gai
n on
par
tial
sale
/dis
posa
l of
ass
ocia
tes
- -
1.5
8 5.
3% 4
.20
13.
7%
- -
- -
- -
Tota
l inc
ome
28.
50
100.
0% 2
9.99
10
0.0%
30.
71
100.
0% 2
5.86
10
0.0%
24.
22
100.
0% 2
9.62
10
0.0%
Cost
of s
ales
and
ser
vice
s fr
om h
otel
ope
ratio
ns a
nd IT
ser
vice
s (1
1.13
)-3
9.1%
(10.
56)
-35.
3% (1
1.45
)-3
7.3%
(13.
71)
-53.
0% (1
1.48
)-4
7.4%
(13.
41)
-45.
3%G
ener
al, a
dmin
istr
ativ
e an
d ot
her e
xpen
ses
(4.2
7)-1
5.0%
(5.7
8)-1
9.4%
(5.5
8)-1
8.2%
(5.8
8)-2
2.7%
(5.6
4)-2
3.3%
(5.0
8)-1
7.1%
Ope
rati
ng p
rofit
13.
10
45.9
% 1
3.65
45
.3%
13.
68
44.5
% 6
.27
24.3
% 7
.10
29.3
% 1
1.13
37
.6%
Inte
rest
and
oth
er in
com
e 0
.98
3.4%
1.1
5 3.
7% 1
7.50
57
.0%
2.2
6 8.
7% 0
.68
2.8%
2.5
6 8.
6%Fo
reig
n ex
chan
ge (l
oss)
/gai
n(0
.02)
-0
.1%
(0.8
9)
-3.1
% (0
.02)
-0.1
% (0
.06)
-0.2
% (0
.01)
-0.1
% 0
.11
0.4%
Fina
nce
cost
s (1
.10)
-3.8
% (1
.81)
-6.1
% (4
.78)
-15.
6% (5
.45)
-21.
1% (4
.44)
-18.
3% (4
.24)
-14.
3%Im
pairm
ent i
n va
lue
of in
tang
ible
ass
ets
- -
(0.9
5)-3
.3%
(1.1
8)-3
.8%
- -
- -
(2.0
1)-6
.8%
Impa
irmen
t in
valu
e of
ava
ilabl
e fo
r sal
e in
vest
men
ts -
- -
- -
- (0
.45)
-1.7
% (2
.09)
-8.6
% (8
.25)
-27.
9%Im
pairm
ent i
n va
lue
of in
vest
men
t in
asso
ciat
e -
- -
- -
- -
- -
- (0
.39)
-1.3
%Im
pairm
ent i
n va
lue
of a
ccou
nts
rece
ivab
le (0
.54)
-1.8
% -
- (0
.51)
-1.7
% (0
.36)
-1.4
% (0
.63)
-2.6
% (0
.32)
-1.1
%Im
pairm
ent i
n va
lue
of p
rope
rty
and
equi
pmen
ts
- -
(0.5
3)-1
.9%
- -
- -
- -
- -
Profi
t fro
m C
onti
nuin
g O
pera
tion
1
2.42
43
.6%
10.
62
34.6
% 2
4.69
80
.3%
2.2
1 8.
6% 0
.61
2.5%
(1.4
1)-4
.8%
Dis
ccon
tinu
ed O
pera
tion
(Los
s)/P
rofit
from
dis
cont
ineu
ed o
pear
tion
-
-
(1.4
6)
-4.9
% 0
.02
0.1%
-
-
-
-
-
-
Profi
t bef
ore
Taxe
s 1
2.42
43
.6%
9.1
6 29
.7%
24.
71
80.4
% 2
.21
8.6%
0.6
1 2.
5% (1
.41)
-4.8
%Pr
ovis
ion
for K
FAS,
Zak
at a
nd N
LST
(0.1
2)-0
.4%
(0.1
2)-0
.4%
(0.7
9)-2
.6%
(0.0
6)-0
.2%
(0.0
4)-0
.2%
(0.0
4)-0
.1%
Dire
ctor
s' re
mun
erat
ion
(0.1
7)-0
.6%
(0.1
2)-0
.4%
(0.1
3)-0
.4%
(0.0
5)-0
.2%
- -
- -
Profi
t/(lo
ss) f
or th
e ye
ar 1
2.13
42
.6%
8.9
2 28
.9%
23.
79
77.4
% 2
.10
8.2%
0.5
7 2.
3% (1
.45)
-4.9
%
Att
ribut
able
to n
on-c
ontr
ollin
g in
tere
sts
0.2
7 0.
9% 0
.84
2.7%
(1.0
4)-3
.4%
(0.7
4)-2
.8%
(0.5
8)-2
.4%
(2.7
8)-9
.4%
Att
ribu
tabl
e to
the
owne
rs o
f the
Par
ent c
ompa
ny 1
1.86
41
.7%
8.0
8 26
.2%
24.
83
80.8
% 2
.84
11.0
% 1
.15
4.7%
1.3
3 4.
5%
Ver
tica
l ana
lysi
s of
the
cons
olid
ated
sta
tem
ent o
f pro
fit o
r los
s

2120 Annual Report 2020Noor Financial Investment Company - KPSC and Subsidiaries
Amou
nts i
n M
illio
n KD
2020
20 v
s 19
2019
19 v
s 18
2018
18 v
s 17
2017
17 v
s 16
2016
16 v
s 15
2015
15 v
s 14
Ass
ets
%
%
%
%
%
%
Cash
and
ban
k ba
lanc
es 4
.13
60%
2.5
8 -5
1% 5
.28
-38%
8.4
9 -1
9% 1
0.42
35
% 7
.74
-5%
Shor
t ter
m d
epos
its 7
.00
24%
5.6
3 16
% 4
.86
-8%
5.2
6 -2
3% 6
.80
161%
2.6
1 66
%W
akal
a an
d su
kuk
inve
stm
ents
- -1
00%
1.0
0 -1
3% 1
.15
- 1
.15
-1%
1.1
6 16
% 1
.00
67%
Inve
stm
ents
at f
air v
alue
thro
ugh
profi
t or l
oss
7.6
0 -3
5% 1
1.70
-
11.
71
7% 1
0.91
-3
% 1
1.27
-4
% 1
1.70
-3
3%A
ccou
nts
rece
ivab
le a
nd o
ther
ass
ets
4.4
9 1%
4.4
5 -5
5% 9
.92
-9%
10.
90
-26%
14.
77
-3%
15.
27
7%In
vent
orie
s 0
.59
11%
0.5
3 4%
0.5
1 -3
4% 0
.77
- 0
.77
-13%
0.8
8 18
4%FV
OCI
Inve
stm
ents
13.
24
-18%
16.
17
2% 1
5.88
10
0% -
- -
- -
- A
vaila
ble
for s
ale
inve
stm
ents
- -
- -
- -1
00%
33.
72
-4%
35.
07
-20%
43.
99
-24%
Inve
stm
ent i
n as
soci
ates
52.
12
12%
46.
72
6% 4
4.05
-2
9% 6
1.99
2%
60.
76
14%
53.
08
6%In
vest
men
t pro
pert
ies
13.
06
-6%
13.
90
-56%
31.
74
6% 3
0.05
-1
1% 3
3.82
-1
5% 3
9.76
21
%Pr
oper
ty a
nd e
quip
men
t 1
.67
-15%
1.9
6 -3
0% 2
.82
-8%
3.0
8 -9
% 3
.40
-23%
4.3
9 -3
4%Ri
ght o
f use
of a
sset
s 1
.26
-12%
1.4
3 10
0% -
- -
- -
- -
- G
oodw
ill a
nd o
ther
inta
ngib
le a
sset
s 2
.03
-6%
2.1
6 -3
6% 3
.39
-29%
4.7
9 -1
0% 5
.35
-4%
5.6
0 -4
6%To
tal a
sset
s 1
07.1
9 -1
% 1
08.2
3 -1
8% 1
31.3
1 -2
3% 1
71.1
1 -7
% 1
83.5
9 -1
% 1
86.0
2 -7
%
Liab
iliti
es a
nd E
quit
yLi
abili
ties
Due
to b
anks
0.3
3 -2
0% 0
.41
-43%
0.7
2 -2
2% 0
.92
-23%
1.2
0 -4
1% 2
.02
34%
Acc
ount
s pa
yabl
e an
d ot
her l
iabi
litie
s 9
.27
14%
8.1
6 -2
5% 1
0.95
54
% 7
.12
8% 6
.58
-13%
7.5
7 -2
4%Bo
rrow
ings
22.
70
-17%
27.
35
-44%
49.
11
-51%
99.
77
-6%
106
.17
-5%
111
.90
-10%
Prov
isio
n fo
r end
of s
ervi
ce in
dem
nity
1.2
7 20
% 1
.06
13%
0.9
4 7%
0.8
8 22
% 0
.72
22%
0.5
9 13
%To
tal l
iabi
litie
s 3
3.57
-9
% 3
6.98
-4
0% 6
1.72
-4
3% 1
08.6
9 -5
% 1
14.6
7 -6
% 1
22.0
8 -1
1%
Equi
tySh
are
capi
tal
41.
32
- 4
1.32
-
41.
32
- 4
1.32
-
41.
32
- 4
1.32
-
Shar
e pr
emiu
m 3
.41
- 3
.41
- 3
.41
- 3
.41
- 3
.41
- 3
.41
- Tr
easu
ry s
hare
s (4
.14)
- (4
.14)
17%
(3.5
4)4%
(3.4
1) -
(3.4
1) -
(3.4
1) -
Lega
l res
erve
6.6
8 22
% 5
.47
18%
4.6
3 12
5% 2
.06
17%
1.7
6 7%
1.6
4 9%
Volu
ntar
y re
serv
e 6
.68
22%
5.4
7 18
% 4
.63
125%
2.0
6 17
% 1
.76
7% 1
.64
9%Cu
mul
ativ
e ch
ange
s in
fair
valu
e (4
.59)
-426
% 1
.41
-128
% (4
.99)
-231
% 3
.81
-35%
5.9
0 53
% 3
.85
-36%
Fore
ign
curr
ency
tran
slat
ion
rese
rve
(24.
30)
5% (2
3.09
)10
% (2
0.91
)51
% (1
3.88
)43
% (9
.74)
-1%
(9.8
1)3%
Reta
ined
ear
ning
s 4
1.82
20
% 3
4.77
14
% 3
0.42
33
0% 7
.07
40%
5.0
4 4%
4.8
5 8%
Equi
ty a
ttri
buta
ble
to th
e ow
ners
of t
he P
aren
t Com
pany
66.
88
4% 6
4.62
18
% 5
4.97
30
% 4
2.44
-8
% 4
6.04
6%
43.
49
-4%
Non
-con
trol
ling
inte
rest
s 6
.74
2% 6
.63
-55%
14.
62
-27%
19.
98
-13%
22.
88
12%
20.
45
11%
Tota
l equ
ity
73.
62
3% 7
1.25
2%
69.
59
11%
62.
42
-9%
68.
92
8% 6
3.94
-
Tota
l lia
bilit
ies
and
equi
ty 1
07.1
9 -1
% 1
08.2
3 -1
8% 1
31.3
1 -2
3% 1
71.1
1 -7
% 1
83.5
9 -1
% 1
86.0
2 -7
%
Hor
izon
tal a
naly
sis
of th
e co
nsol
idat
ed s
tate
men
t of fi
nanc
ial p
osit
ion
Amou
nts i
n M
illio
n KD
2020
20 v
s 19
2019
19 v
s 18
2018
18 v
s 17
2017
17 v
s 16
2016
16 v
s 15
2015
15 v
s 14
%
%
%
%
%
%
Reve
nue
from
hot
el o
pera
tions
and
IT S
ervi
ces
13.
31
-1%
13.
39
-7%
14.
37
-17%
17.
31
16%
14.
91
-5%
15.
70
15%
Real
ised
(los
s)/g
ain
on in
vest
men
ts a
t fai
r val
ue th
roug
h pr
ofit o
r los
s (0
.15)
-108
% 1
.87
46%
1.2
8 63
00%
0.0
2 -7
5% 0
.08
-85%
0.5
5 -5
2%U
nrea
lised
gai
n/(lo
ss) o
n in
vest
men
ts a
t fai
r val
ue th
roug
h pr
ofit o
r lo
ss 0
.07
-96%
1.7
1 20
5% 0
.56
143%
0.2
3 -2
400%
(0.0
1)-9
9% (1
.61)
973%
Real
ised
gai
n/(lo
ss) o
n sa
le o
f ava
ilabl
e fo
r sal
e in
vest
men
ts -
- -
- -
-100
% 0
.23
-152
% (0
.44)
-128
% 1
.56
-20%
Chan
ge in
fair
valu
e of
inve
stm
ent p
rope
rtie
s (0
.87)
-24%
(1.1
5)13
5% (0
.49)
77%
(2.0
9)24
8% (0
.60)
-163
% 0
.96
-13%
Div
iden
d in
com
e 0
.81
-30%
1.1
5 -2
3% 1
.50
28%
1.1
7 4%
1.1
2 -4
8% 2
.14
24%
Shar
e of
resu
lts o
f ass
ocia
tes
14.
85
37%
10.
77
25%
8.6
5 12
% 7
.70
-7%
8.2
8 15
% 7
.17
-27%
Man
agem
ent a
nd p
lace
men
t fee
s 0
.01
-50%
0.0
2 -
0.0
2 -5
0% 0
.04
100%
0.0
2 -9
9% 1
.62
3140
%Re
aliz
ed g
ain/
(loss
) on
sale
of i
nves
tmen
t pro
pert
ies
- -
- -
- -1
00%
0.0
5 -1
06%
(0.8
5)-1
00%
- -1
00%
Rent
al In
com
e 0
.47
-28%
0.6
5 5%
0.6
2 -4
8% 1
.20
-30%
1.7
1 12
% 1
.53
51%
Real
ized
gai
n on
par
t of s
ale
/ dis
posa
l of a
ssoc
iete
s -
-100
% 1
.58
-62%
4.2
0 10
0% -
- -
- -
- To
tal i
ncom
e 2
8.50
-5
% 2
9.99
-2
% 3
0.71
19
% 2
5.86
7%
24.
22
-18%
29.
62
-3%
Cost
of s
ales
and
ser
vice
s fr
om h
otel
ope
ratio
ns a
nd IT
ser
vice
s (1
1.13
)5%
(10.
56)
-8%
(11.
45)
-16%
(13.
71)
19%
(11.
48)
-14%
(13.
41)
15%
Gen
eral
, adm
inis
trat
ive
and
othe
r exp
ense
s (4
.27)
-26%
(5.7
8)4%
(5.5
8)-5
% (5
.88)
4% (5
.64)
11%
(5.0
8)-1
%O
pera
ting
pro
fit 1
3.10
-4
% 1
3.65
-
13.
68
118%
6.2
7 -1
2% 7
.10
-36%
11.
13
-20%
Inte
rest
and
oth
er in
com
e 0
.98
-15%
1.1
5 -9
3% 1
7.50
67
4% 2
.26
232%
0.6
8 -7
3% 2
.56
146%
Fore
ign
exch
ange
(los
s)/g
ain
(0.0
2)-9
8% (0
.89)
4350
% (0
.02)
-67%
(0.0
6)50
0% (0
.01)
-109
% 0
.11
-283
%Fi
nanc
e co
sts
(1.1
0)-3
9% (1
.81)
-62%
(4.7
8)-1
2% (5
.45)
23%
(4.4
4)5%
(4.2
4)-7
%Im
pairm
ent i
n va
lue
of in
tang
ible
ass
ets
- -1
00%
(0.9
5)-1
9% (1
.18)
100%
- -
- -1
00%
(2.0
1)10
0%Im
pairm
ent i
n va
lue
of a
vaila
ble
for s
ale
inve
stm
ents
- -
- -
- -1
00%
(0.4
5)-7
8% (2
.09)
-75%
(8.2
5)-5
%Im
pairm
ent i
n va
lue
of in
vest
men
t in
asso
ciat
e -
- -
- -
- -
- -
-100
% (0
.39)
255%
Impa
irmen
t in
valu
e of
acc
ount
s re
ceiv
able
(0.5
4)10
0% -
-100
% (0
.51)
42%
(0.3
6)-4
3% (0
.63)
97%
(0.3
2)-7
8%Im
pairm
ent i
n va
lue
of p
rope
rty
and
equi
pmen
ts
- -1
00%
(0.5
3)-1
00%
- -
- -
- -
- -
Profi
t fro
m C
onti
nuin
g O
pera
tion
1
2.42
17
% 1
0.62
-5
7% 2
4.69
10
17%
2.2
1 26
2% 0
.61
-143
% (1
.41)
-186
2%D
iscc
onti
nued
Ope
rati
on(L
oss)
/Pro
fit fr
om d
isco
ntin
eued
ope
artio
n -
-100
% (1
.46)
-740
0% 0
.02
100%
- -
- -
- -
Profi
t bef
ore
Taxe
s 1
2.42
36
% 9
.16
-63%
24.
7110
18%
2.2
126
2% 0
.61
-143
% (1
.41)
-186
2%Pr
ovis
ion
for K
FAS,
Zak
at a
nd N
LST
(0.1
2) -
(0.1
2)-8
5% (0
.79)
1217
% (0
.06)
50%
(0.0
4)-
(0.0
4)33
%D
irect
ors'
rem
uner
atio
n (0
.17)
42%
(0.1
2)-8
% (0
.13)
160%
(0.0
5)10
0% -
- -
- Pr
ofit/
(loss
) for
the
year
12.
13
36%
8.9
2 -6
3% 2
3.79
1
033%
2
.10
268%
0.5
7 -1
39%
(1.4
5)-3
000%
Att
ribut
able
to n
on-c
ontr
ollin
g in
tere
sts
0.2
7 -6
8% 0
.84
-181
% (1
.04)
41%
(0.7
4)28
% (0
.58)
-79%
(2.7
8)22
0%A
ttri
buta
ble
to th
e ow
ners
of t
he P
aren
t com
pany
11.
86
47%
8.0
8 -6
7% 2
4.83
77
4% 2
.84
147%
1.1
5 -1
4% 1
.33
45%
Hor
izon
tal a
naly
sis
of th
e co
nsol
idat
ed s
tate
men
t of p
rofit
or l
oss

2322 Annual Report 2020Noor Financial Investment Company - KPSC and Subsidiaries
Academic Qualifications:• Bachelor of Electrical and Electronic Engineering, University of Newcastle Upon Tyne, UK.• Doctorate of Electrical and Electronic Engineering, University of Newcastle Upon Tyne, UK.
Current & Previous Posts:• Chairman, Noor Financial Investment Company, Kuwait• Board Member, Privatization Holding Company, Kuwait• Board Member, Arab Information Management Services Company (AIMS), Kuwait• Board Member, IT Partners for Information Technology Company, Kuwait• Board Member, Noor Telecommunications Company, Kuwait• Chairman, Digital Alliances Company, Kuwait• Managing Partner, Ersaal Cable & Wireless Company, Kuwait• Board Member, Ikarus Petroleum Industries Company, Kuwait• Board Member, Eastern United Petroleum Services Company, Kuwait• Chairman, Global Projects Holding Company, Kuwait• Deputy Chairman, Tawasul Services Company, Kuwait• Managing Partner, Dizlee Communications & Consultancy Company, Kuwait• Deputy General Manager, Arab Telecom Company, Kuwait• Managing Partner, Mada Value Added Services Company, Kuwait• Managing Partner, Senyar Capital Economical Consultancy Company, Kuwait• Managing Partner, Askamo Economic Consultancy Company, Kuwait
Dr. Fahad Sulaiman Al-Khaled
BOARD OF DIRECTORS CHAIRMAN BOARD OF DIRECTORS VICE CHAIRMAN
Academic Qualifications:• B.Sc. in Mechanical Engineering, Kuwait University
Current & Previous Posts:• Vice Chairman, Noor Financial Investment Company, Kuwait• Chairman, Noor Jordan Kuwait Financial Investment Company, Jordan• Chairman, Hotels Global Group, Jordan• Board Member, Ahli United Bank B.S.C, Bahrain• Board Member, Kuwait Insurance Company S.A.K, Kuwait• Board Member, United Beverage Company KSCC, Kuwait• Board Member, Al-Alfain Printing, Publication & Distribution Company KSCC, Kuwait• Director, Mohammad Saleh & Reza Yousuf Behbehani Company WLL, Kuwait• Director, Behbehani Capital Company WLL, Kuwait• Manager, Shereen Motor Company WLL, Kuwait• Manager, Behbehani Tire Center Company WLL, Kuwait• Former Board Member, Al Ahli Bank of Kuwait, Kuwait• Former Eng. Kuwait National Petroleum Company Alahmadi, Kuwait
Mr. Abdulghani M.S. Behbehani

2524 Annual Report 2020Noor Financial Investment Company - KPSC and Subsidiaries
BOARD OF DIRECTORS BOARD MEMBER
Academic Qualifications:• B.Sc. in Chemical Engineering, University of Newcastle Upon Tyne, UK• M.Sc. in Chemical Engineering, Kuwait University
Current & Previous Posts:• Board Member, Noor Financial Investment Company, Kuwait• Deputy CEO, Investment and Mega Projects, National Industries Group Holding, Kuwait• Chairman, Privatization Holding Company, Kuwait• Chairman & CEO, Ikarus Petroleum Industries Company, Kuwait• Board Member, Noor Telecommunications Company, Kuwait• Chairman, IT Partners for Information Technology, Kuwait• Chairman, Meezan Bank Limited, Pakistan• Board Member of Sahara International Petrochemical Company (Sipchem)-Saudi Arabia• Board Member at K-Electric Limited Company, Pakistan• Vice Chairman, Airport International Group, Jordan• Chairman, Middle East Complex for Eng. Electronics and Heavy Industries Company, Jordan• Advisory Board Member, Cleantech I & II- Zouk Venture Limited, U.K.• Board Member, Investment Committee of Bouniya Fund, Kuwait Investment Company, Bahrain• Advisory Board Member, Markaz Energy Fund, Kuwait• General Manager, Gas & Oil Fields Services Company, Kuwait• Vice Chairman, Eastern United Petroleum Services Company, Kuwait• Board Member, Kuwait Ceramic Company, Kuwait• Advisory Board Member, ZSOL, U.K.
Mr. Riyadh S. A. A. Edrees
Academic Qualifications:• Bachelor’s in Accounting, Kuwait University
Current Posts:• Board Member, Noor Financial Investment Company, Kuwait• Board Member, Hotels Global Group, Jordan• Deputy CEO, Finance and Admin., National Industries Group Holding, Kuwait• Chairman and CEO, Al Durra National Real Estate Company, Kuwait• Vice Chairman, Meezan Bank Limited, Pakistan• Chairman, Al-Manar Financing & Leasing Company, Kuwait• Chairman, Noor Al-Salhiya Real Estate Company, Kuwait• Vice Chairman, Abu Dhabi Marina Real Estate Investment Company, UAE• Chairman, Shorfat Al-Safwa Company, Saudi Arabia• Chairman, Durrat Al-Shameya Company, Saudi Arabia• General Manager, IKARUS Real Estate Company - Dubai, UAE• Board Member, Al-Ruwad Real Estate Company, Kuwait• Director, Proclad Group Limited- Dubai, UAE
Mr. Faisal A. Al-Nassar
BOARD OF DIRECTORS BOARD MEMBER

2726 Annual Report 2020Noor Financial Investment Company - KPSC and Subsidiaries
Academic Qualifications:• Bachelor in Accounting, Kuwait University
Current & Previous Posts:• Board Member, Noor Financial Investment Company, Kuwait• Vice Chairman and CEO, Noor Al-Salhiya Real Estate Company, Kuwait• Board Member, Meezan Bank Limited, Pakistan• Vice Chairman, Al-Manar Financing & Leasing Company, Kuwait• Board Member, Savola Group, Saudi Arabia• Chairman, Palms Agro Production Company, Kuwait• Board Member, Abu Dhabi Marina Real Estate Investment Company, UAE• Vice Chairman, Al-Durra National Real Estate Company, Kuwait• Board Member, Hotels Global Group, Jordan• Chairman, Arab Group for Investment, Real Estate and Agriculture Development Company, Egypt• General Manager, Sidra Middle East for Building Construction & Electrical, Mechanical Company, Kuwait• General Manager, Ikarus Real Estate Company, UAE• Member, Kuwaiti Association of Accountants, Kuwait• Member, Kuwait Economic Society, Kuwait
Mr. Bader H. Al-Rabiah
BOARD OF DIRECTORS BOARD MEMBER
Academic Qualifications:• Bachelor in Accounting, Kuwait University• Certificate in Credit Management (CCM) from Institute of Banking Studies, Kuwait
Current & Previous Posts:• Board Member, Noor Financial Investment Company, Kuwait• CEO, Al-Masar Leasing & Investment Company, Kuwait• Board Member, Meezan Bank Limited, Pakistan• Chairman & Acting CEO, Priority Automobile Company, Kuwait• Board Member, Amar Finance and Investment Company, Kuwait• Board Member, Al-Riyada Finance and Investment Company, Kuwait• Chairman, Land United Real Estate Company, Kuwait• Board Member, Marsa Abu Dhabi Real Estate Investment Company, UAE• Chairman and CEO, Al-Riyada Real Estate Company, Kuwait• Board Member, Ahjar Holding Company, Kuwait• Corporate Finance Manager, Warba Investment Company, Kuwait• Manager Corporate Banking, Ahli United Bank, Kuwait
Mr. Talal S. Al-Shehab
BOARD OF DIRECTORS BOARD MEMBER - Independent

2928 Annual Report 2020Noor Financial Investment Company - KPSC and Subsidiaries
MANAGEMENT TEAM
Fahad Bader Al Bader, Aiham Bseiso, Gururaj Narasimha Rao, Abdullah Abdulrahman Al Houli, Muhammad Moazzam Rafique
Name Designation
Gururaj Rao Chief Executive Officer
Abdullah Alhouli VP - Head of Alternative Investment Department
Fahad Al-Bader VP - Head of Marketable Securities Department
Moazzam Rafique VP - Head of Finance Department
Aiham Bseiso AVP - Head of Settlements Department
Moneera Al-Bader AVP - Clients Portfolios Section
Maissan Al-Dekheel AVP - Funds Administration Unit
Abdullah Al-Ahmed AVP - Funds Section
Yaqoub Al-Nasrallah AVP - Head of HR & Administration Section / Complaints
Sanjeewa Senarathna AVP - Accounts
Emad Al-Hussain AVP - Head of Compliance & AML Unit
Zahid Ul Haq Abdul Haq Manager - Internal Audit Unit
Neena Fernandes Manager - Alternative Investment
Abdullah Al-Mansour Al-Mohammad Manager - Risk Unit
Mohamed Sabry Manager - Legal Affairs Unit
Roumi Al-Fahad Manager - Clients Portfolios Section
Zeyad Salman Al-Matour Assistant Manager - Investor Relations Unit
Khalaf Al-Khalaf Assistant Manager - Public Relations Unit

3130 Annual Report 2020Noor Financial Investment Company - KPSC and Subsidiaries
BOARD OFDIRECTORS’ REPORT
BOARD OFDIRECTORS’ REPORT
Dear Esteemed Shareholders,It is the utmost pleasure for the Board of Directors of Noor Financial Investment Company to have your presence at the Company’s ordinary general assembly meeting. The Board of Directors is pleased to present you the annual report and audited financial statements of the Company for the year ending on December 31, 2020, asking Almighty Allah to grant us success and guidance.
Company’s Operations:Despite the exceptional challenges posed by the Coronavirus pandemic, the Company achieved a net profit of KD 11.86 million, an increase of 46.8% compared to the previous year. The Company also recorded a growth in Shareholders’ Equity; reaching an amount of KD 66.88 million as of 31 December 2020 compared to KD 64.62 million at the end of previous fiscal year. Noting that the Shareholders’ Equity does not reflect the full market value of Company’s investment in associates except in the event of sale, in line with the approved accounting standards.
Alternative Investments:Despite the ongoing impacts of Coronavirus pandemic, Meezan Bank – one of the Company’s investment – recorded stronger than expected performance across the board. This year, the Bank set an all-time profitability record of PKR 22.4 billion (US$ 139.5 million), growing forty-three percent year on year and leading to 34% return on equity. Market value of Company’s 35.25% stake in Meezan Bank, which is carried at KD 52 million in the books, increased to KD 98.4 million as of 31 December 2020 compared to KD 84.4 million as of 31 December 2019, growing by sixteen percent. Company’s share of results of Meezan Bank stood at KD 14.8 million (2019: KD 10.8 million) providing a growth of more than 37%.
In parallel, the Company obtained the required initial approvals for the merger of its subsidiary, Noor Telecom Company KSCC, with the Company through amalgamation. Independent valuations were conducted for both the companies during the year 2020, and the Company submitted the merger project to the Capital Markets Authority, which issued its approval for it. After obtaining remaining approvals from official authorities, the merger project and the proposed share swap rates will then be submitted to the general assemblies of both the companies for approval or rejection. It is expected that the merger will bring better operating efficiencies in the Group after expected completion in the year 2021, once shareholders decide to approve the merger.
With respect to the Company’s investment in the hotel industry, which is one of the most affected industries globally due to the pandemic, our hotel subsidiary in Jordan continued its activities at a limited scale. The subsidiary recorded a 58% decline in its revenues; which led to an operating loss of KD 570 thousand for the year 2020. We expect the subsidiary to rebound its performance once Covid-19 related restrictions are eased on the industry. We carried out an impairment testing for our assets in the subsidiary which did not lead to any impairment loss.
On the other hand, the Company also had a partial exit from one of the Company’s private equity funds, which generated cash liquidity of KD 460 thousand.
On the real estate side, the Company’s real estate portfolio was resilient despite the significant impact on the sector during the year. In line with the market recovery and the end of lockdown, the Company’s rental income from real estate resumed during the third quarter and the occupancy reached more than 90% in key properties. The value of the Company’s investment properties amounted to KD 13.1 million as of December 31, 2020, which generated rental income of KD 473 thousand during the year in spite of the rent waived for part of the year due to the lockdown.
Marketable Securities:The Company sold marketable securities of KD 3.6 million during the year 2020 from a total portfolio of KD 20.2 million. Liquidity generated from the sale of securities was utilized to reduce Company’s debt. Company’s portfolio of marketable securities stood at KD 14.3 million as of 31 December 2020 which is mainly GCC focused. Noor’s GCC Islamic Fund, which was awarded as the best fund over 3 years in EQUITY GCC (GULF COOP CNCL) category by Lipper Fund Awards from Refinitiv during the year 2019, has reported a performance of 3.21% for the year as opposed to a 1.83% performance in the benchmark.
Borrowings:The Company is recognized for systematically reducing its debts based on a clear plan. It maintained growth and reduced liabilities in parallel, as the ratio of debt to equity reached 0.34, which is very low in the investment sector and is an important indicator of the general performance of the company and its ability to expand in the future. The Company’s debt was reduced from KD 27.4 million to KD 22.7 million during the year by paying KD 4.7 million to the lenders including KD 1.2 million prepayment for the installments due in 2021. The Company posted a total reduction of KD 77 million in debt over past three years.

3332 Annual Report 2020Noor Financial Investment Company - KPSC and Subsidiaries
Shareholders’ Equity:The Shareholders’ Equity stood at KD 66.88 million as of 31 December 2020 leading to a record book value per share of FILS 169 after payment of FILS 6 dividend per share during the year 2020.
The performance indicators and the aforementioned information have reflected positively on the Company and have strengthened its position in the market. It is made possible by the distinguished efforts and continuous hard work of the Board of Directors and the executive team in exploring opportunities to reduce liabilities and achieve expansion and growth. The Company aims to build a new range of products and services in the financial services and investment sector, as well as explore new avenues for investments in the future.
Company’s Financial Performance:The total income of the Company in the Consolidated Statement of Profit or Loss for the year 2020 was KD 28.5 million representing KD 14.8 million share of profits of associates, KD 13.3 million revenue from the operations of the subsidiaries in the IT and hotel industries and KD 0.4 million from other investments. Total income declined by 5% mainly due to drop in the local stock market. The Company posted an operating profit of KD 13.1 million for the year 2020 compared to KD 13.7 for the previous year. Finance cost for the year was reduced by 39% due to the reduction in debt and lower interest rates.
The Company achieved a net profit attributable to the owners of the Parent Company of KD 11.86 million (EPS of 30.02 Fils) for the financial year ended 31 December 2020 compared to a net profit of KD 8.1 million (EPS of 20.24 Fils) for the previous year.
BOD Recommendations:The Board of Directors recommended to the Company’s general assembly to distribute cash dividends to the shareholders at the rate of 6% of the nominal value of the share capital for the year ended December 31, 2020 (2019: 6% cash dividends), which is subject to the approval of Company’s general assembly and competent authorities. The Board of Directors also recommended to distribute a total amount of KD 165,000 as remuneration to the Board of Directors for their work during the fiscal year 2020, which is subject to the approval of Company’s general assembly.
In conclusion, the members of the Board of Directors extend their sincere thanks and gratitude to the Company’s shareholders, customers, and all stakeholders for their confidence and support over the years. The Board also expresses sincere thanks and appreciation to all employees of the company for their sincere efforts, continuous dedication to work and their constructive contributions.
The Board of Directors
Shareholders’ Equity (KD Million) Book Vale per Share (FILS)KD million
-
10.0
20.0
30.0
40.0
50.0
60.0
70.0
80.0
-
20.0
40.0
60.0
80.0
100.0
120.0
140.0
180.0
160.0
FlLS per share
KD 46.0 MillionKD 42.4 Million
KD 55.0 Million
KD 64.6 MillionKD 66.9 Million
20202019201820172016
114.3105.4
137.4
163.6169.4
Debt Debt-to-EquityKD million
120
100
80
60
40
20
-
2.5
2.0
1.5
1.0
0.5
-
Debt-to-Equity Ratio
106100
49
2723
20202019201820172016
2.32.4
0.9
0.40.3
CORPORATE GOVERNANCE
3534 Annual Report 2020Noor Financial Investment Company - KPSC and Subsidiaries
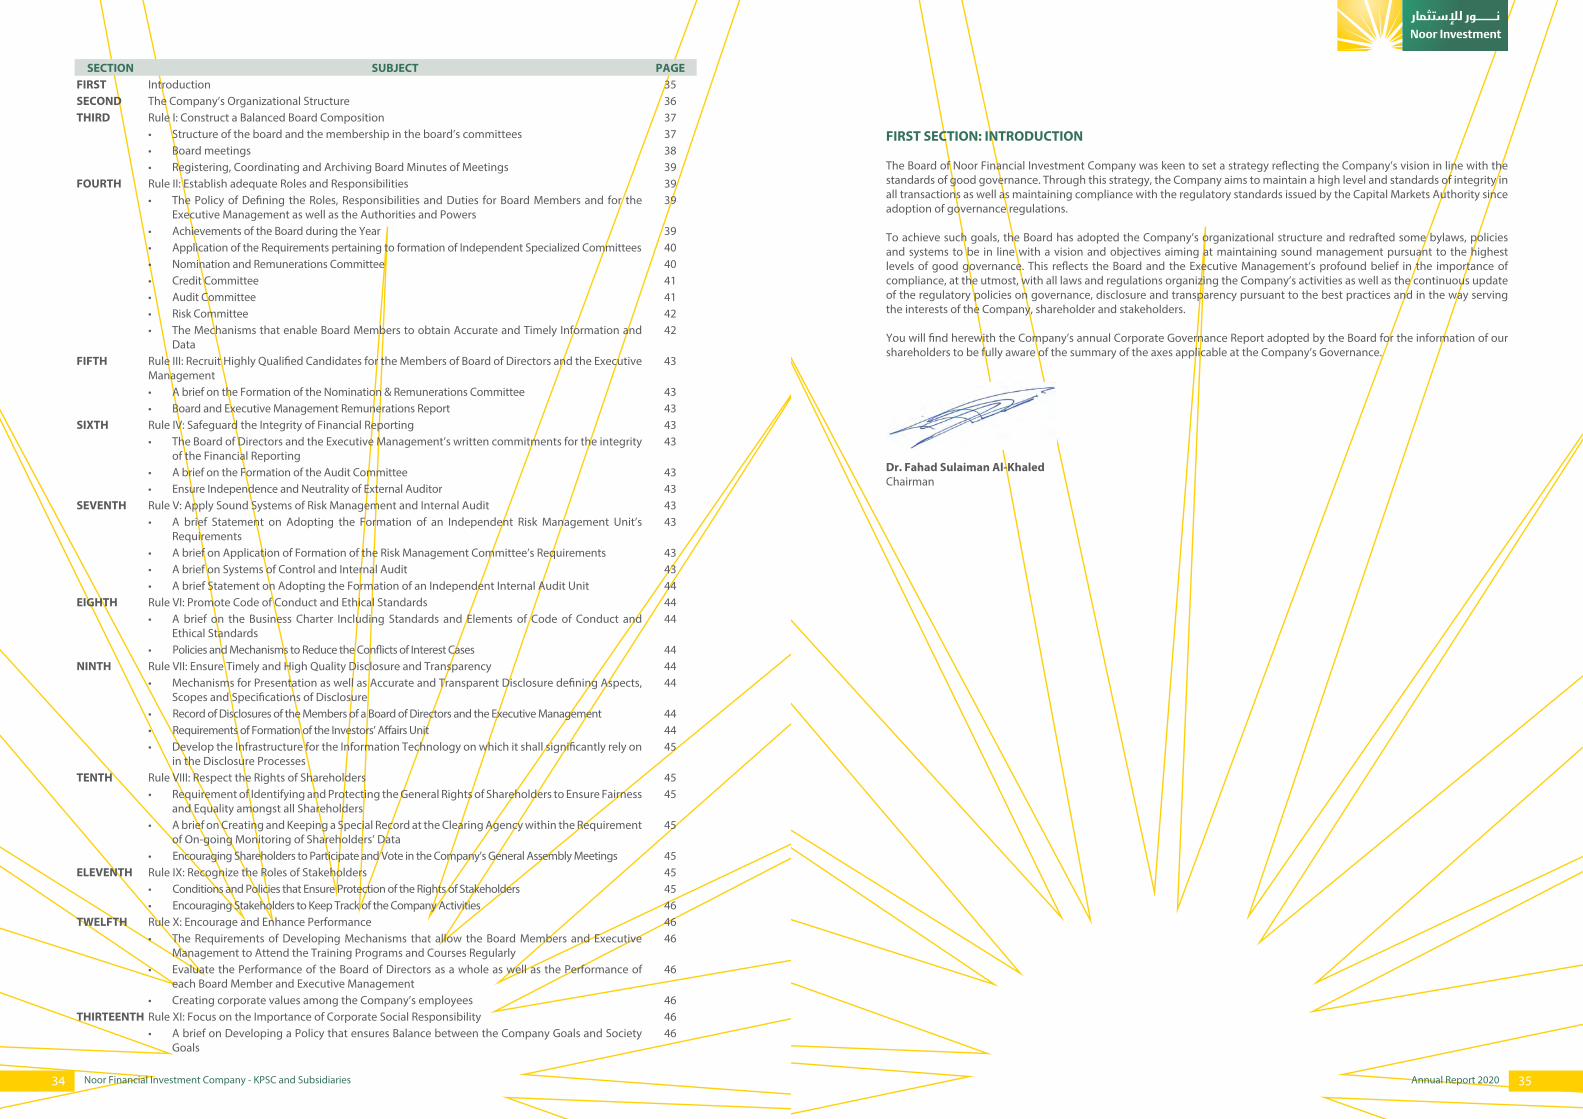
SECTION SUBJECT PAGEFIRST Introduction 35SECOND The Company’s Organizational Structure 36THIRD Rule I: Construct a Balanced Board Composition 37
• Structure of the board and the membership in the board’s committees 37• Board meetings 38• Registering, Coordinating and Archiving Board Minutes of Meetings 39
FOURTH Rule II: Establish adequate Roles and Responsibilities 39• The Policy of Defining the Roles, Responsibilities and Duties for Board Members and for the
Executive Management as well as the Authorities and Powers39
• Achievements of the Board during the Year 39• Application of the Requirements pertaining to formation of Independent Specialized Committees 40• Nomination and Remunerations Committee 40• Credit Committee 41• Audit Committee 41• Risk Committee 42• The Mechanisms that enable Board Members to obtain Accurate and Timely Information and
Data42
FIFTH Rule III: Recruit Highly Qualified Candidates for the Members of Board of Directors and the Executive Management
43
• A brief on the Formation of the Nomination & Remunerations Committee 43• Board and Executive Management Remunerations Report 43
SIXTH Rule IV: Safeguard the Integrity of Financial Reporting 43• The Board of Directors and the Executive Management’s written commitments for the integrity
of the Financial Reporting43
• A brief on the Formation of the Audit Committee 43• Ensure Independence and Neutrality of External Auditor 43
SEVENTH Rule V: Apply Sound Systems of Risk Management and Internal Audit 43• A brief Statement on Adopting the Formation of an Independent Risk Management Unit’s
Requirements43
• A brief on Application of Formation of the Risk Management Committee’s Requirements 43• A brief on Systems of Control and Internal Audit 43• A brief Statement on Adopting the Formation of an Independent Internal Audit Unit 44
EIGHTH Rule VI: Promote Code of Conduct and Ethical Standards 44• A brief on the Business Charter Including Standards and Elements of Code of Conduct and
Ethical Standards44
• Policies and Mechanisms to Reduce the Conflicts of Interest Cases 44NINTH Rule VII: Ensure Timely and High Quality Disclosure and Transparency 44
• Mechanisms for Presentation as well as Accurate and Transparent Disclosure defining Aspects, Scopes and Specifications of Disclosure
44
• Record of Disclosures of the Members of a Board of Directors and the Executive Management 44• Requirements of Formation of the Investors’ Affairs Unit 44• Develop the Infrastructure for the Information Technology on which it shall significantly rely on
in the Disclosure Processes45
TENTH Rule VIII: Respect the Rights of Shareholders 45• Requirement of Identifying and Protecting the General Rights of Shareholders to Ensure Fairness
and Equality amongst all Shareholders45
• A brief on Creating and Keeping a Special Record at the Clearing Agency within the Requirement of On-going Monitoring of Shareholders’ Data
45
• Encouraging Shareholders to Participate and Vote in the Company’s General Assembly Meetings 45ELEVENTH Rule IX: Recognize the Roles of Stakeholders 45
• Conditions and Policies that Ensure Protection of the Rights of Stakeholders 45• Encouraging Stakeholders to Keep Track of the Company Activities 46
TWELFTH Rule X: Encourage and Enhance Performance 46• The Requirements of Developing Mechanisms that allow the Board Members and Executive
Management to Attend the Training Programs and Courses Regularly46
• Evaluate the Performance of the Board of Directors as a whole as well as the Performance of each Board Member and Executive Management
46
• Creating corporate values among the Company’s employees 46THIRTEENTH Rule XI: Focus on the Importance of Corporate Social Responsibility 46
• A brief on Developing a Policy that ensures Balance between the Company Goals and Society Goals
46
FIRST SECTION: INTRODUCTION
The Board of Noor Financial Investment Company was keen to set a strategy reflecting the Company’s vision in line with the standards of good governance. Through this strategy, the Company aims to maintain a high level and standards of integrity in all transactions as well as maintaining compliance with the regulatory standards issued by the Capital Markets Authority since adoption of governance regulations.
To achieve such goals, the Board has adopted the Company’s organizational structure and redrafted some bylaws, policies and systems to be in line with a vision and objectives aiming at maintaining sound management pursuant to the highest levels of good governance. This reflects the Board and the Executive Management’s profound belief in the importance of compliance, at the utmost, with all laws and regulations organizing the Company’s activities as well as the continuous update of the regulatory policies on governance, disclosure and transparency pursuant to the best practices and in the way serving the interests of the Company, shareholder and stakeholders.
You will find herewith the Company’s annual Corporate Governance Report adopted by the Board for the information of our shareholders to be fully aware of the summary of the axes applicable at the Company’s Governance.
Dr. Fahad Sulaiman Al-KhaledChairman
3736 Annual Report 2020Noor Financial Investment Company - KPSC and Subsidiaries
SECO
ND
SEC
TIO
N: T
HE
COM
PAN
Y’S
ORG
AN
IZA
TIO
NA
L ST
RUCT
URE
Lege
nd:
Risk
Com
mitt
ee
Risk
Man
agem
ent
Inte
rnal
Aud
it
Inve
stor
Rel
atio
nsCE
O
Boar
d Se
cret
ary
Com
plia
nce
Publ
ic R
elat
ions
Lega
l
Com
plai
nts
IT
Cred
it
HR
& A
dmin
Clie
nt R
elat
ions
Mar
ketin
g
Fina
nce
Acc
ount
s &
Reg
ulat
ory
Repo
rtin
g
Sett
lem
ent
Trea
sury
Fund
sA
dmin
istr
atio
n
Cust
ody
Dep
tSe
ctio
nU
nit
Inve
stm
ent
Cont
rolle
r
Unr
egis
tere
dBr
oker
age
Clie
nt P
ortf
olio
s
Fund
s
Prop
Por
tfol
ios
Mar
keta
ble
Secu
ritie
sA
ltern
ativ
eIn
vest
men
ts
Prop
Inve
stm
ents
Clie
nt In
vest
men
ts
Adv
isor
y
Plac
emen
ts
Sett
lem
ent
Boar
d of
Dire
ctor
sCh
airm
anN
& R
Com
mitt
ee
Aud
it Co
mm
ittee
Cred
it Co
mm
ittee
Dire
ct R
epor
tA
dmin
istr
ativ
e Fu
nctio
nalit
y In
dire
ct re
port
ing
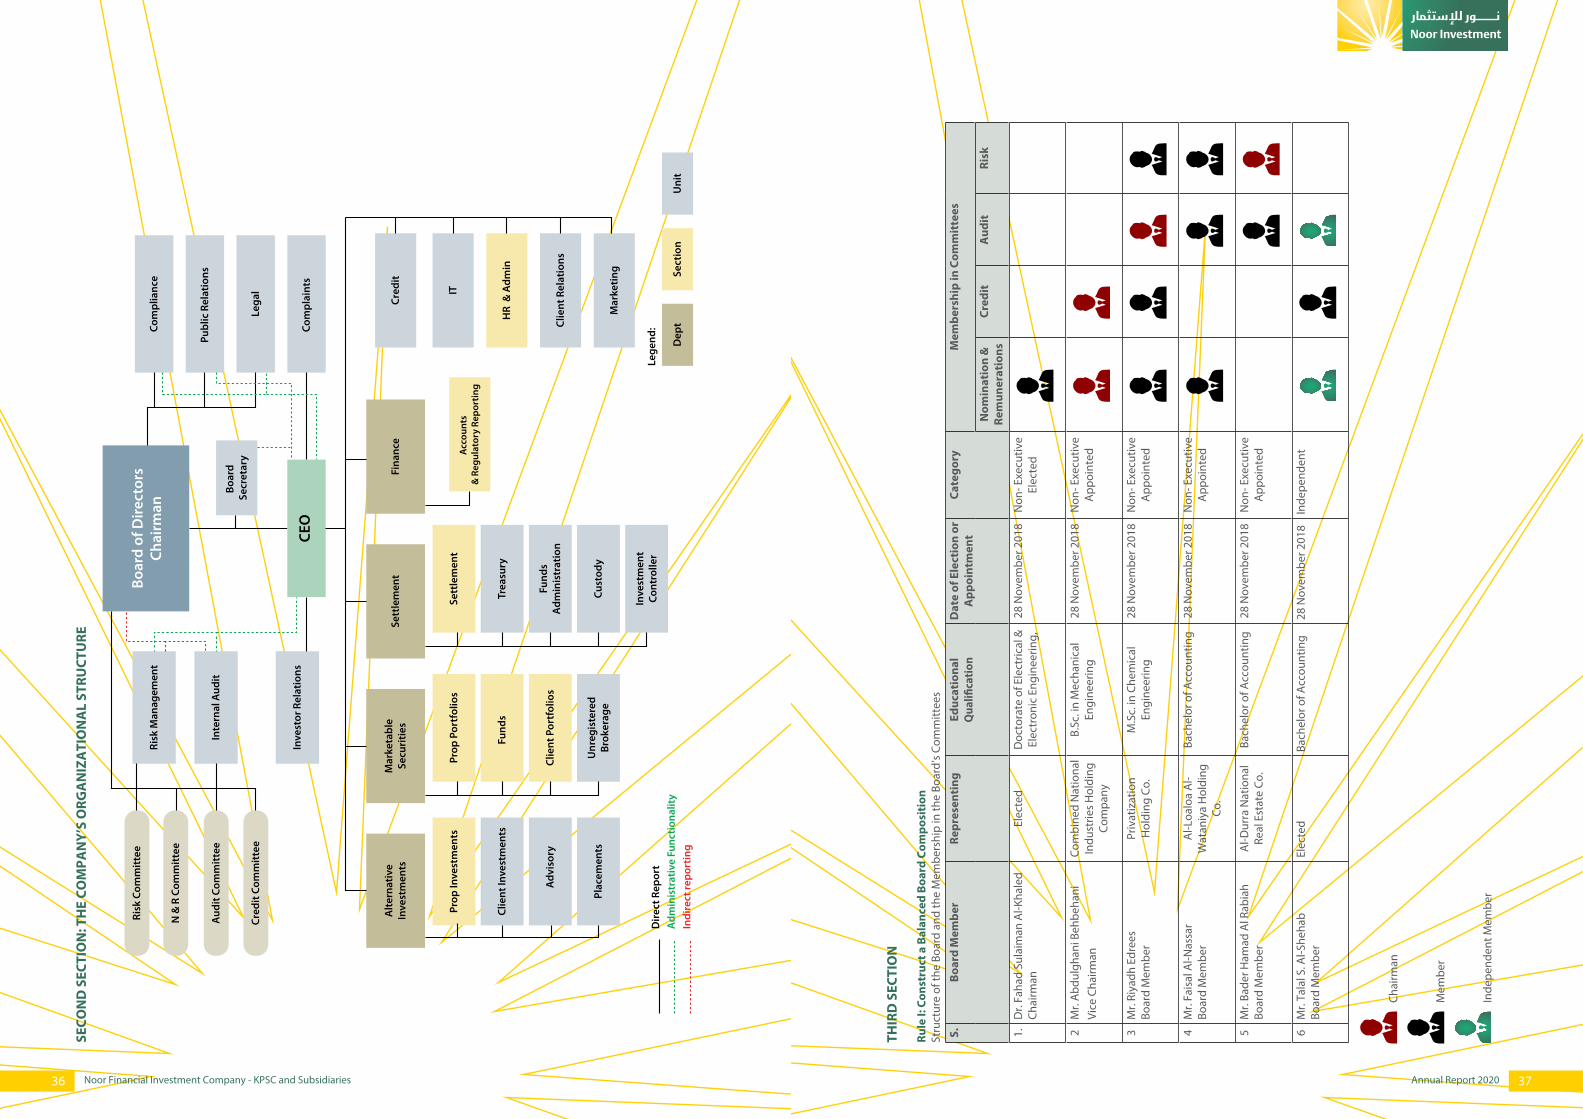
THIR
D S
ECTI
ON
Rule
I: C
onst
ruct
a B
alan
ced
Boar
d Co
mpo
siti
onSt
ruct
ure
of th
e Bo
ard
and
the
Mem
bers
hip
in th
e Bo
ard’
s Co
mm
ittee
s
S.Bo
ard
Mem
ber
Repr
esen
ting
Educ
atio
nal
Qua
lifica
tion
Dat
e of
Ele
ctio
n or
A
ppoi
ntm
ent
Cate
gory
Mem
bers
hip
in C
omm
itte
es
Nom
inat
ion
&
Rem
uner
atio
nsCr
edit
Aud
itRi
sk
1.D
r. Fa
had
Sula
iman
Al-K
hale
d Ch
airm
anEl
ecte
dD
octo
rate
of E
lect
rical
&
Elec
tron
ic E
ngin
eerin
g,28
Nov
embe
r 201
8N
on- E
xecu
tive
Elec
ted
2M
r. A
bdul
ghan
i Beh
beha
ni
Vice
Cha
irman
Com
bine
d N
atio
nal
Indu
strie
s H
oldi
ng
Com
pany
B.Sc
. in
Mec
hani
cal
Engi
neer
ing
28 N
ovem
ber 2
018
Non
- Exe
cutiv
e A
ppoi
nted
3M
r. Ri
yadh
Edr
ees
Boar
d M
embe
rPr
ivat
izat
ion
Hol
ding
Co.
M.S
c. in
Che
mic
al
Engi
neer
ing
28 N
ovem
ber 2
018
Non
- Exe
cutiv
e A
ppoi
nted
4M
r. Fa
isal
Al-N
assa
rBo
ard
Mem
ber
Al-L
oalo
a A
l- W
atan
iya
Hol
ding
Co
.
Bach
elor
of A
ccou
ntin
g28
Nov
embe
r 201
8N
on- E
xecu
tive
App
oint
ed
5M
r. Ba
der H
amad
Al R
abia
h Bo
ard
Mem
ber
Al-D
urra
Nat
iona
l Re
al E
stat
e Co
.Ba
chel
or o
f Acc
ount
ing
28 N
ovem
ber 2
018
Non
- Exe
cutiv
e A
ppoi
nted
6M
r. Ta
lal S
. Al-S
heha
bBo
ard
Mem
ber
Elec
ted
Bach
elor
of A
ccou
ntin
g28
Nov
embe
r 201
8In
depe
nden
t
Chai
rman
Mem
ber
Inde
pend
ent M
embe
r

3938 Annual Report 2020Noor Financial Investment Company - KPSC and Subsidiaries
Boar
d M
eeti
ngs
duri
ng th
e ye
ar 2
020
Mee
ting
Num
ber d
urin
g 20
201
23
45
67
8To
tal
Rem
arks
out o
f 8D
r. Fa
had
Sula
iman
Al-K
hale
d Ch
airm
an√
√√
√ T√ T
√ T√ T
√ T8
%10
0
Mr.
Abd
ulgh
ani B
ehbe
hani
Vi
ce C
hairm
an√
√√
√ T√ T
√ T√ T
√ T8
%10
0
Mr.
Riya
dh E
dree
sBo
ard
Mem
ber
√√
√√ T
√ T√ T
√ T√ T
8%
100
Mr.
Fais
al A
l-Nas
sar
Boar
d M
embe
r√
√√
√ T√ T
√ T√ T
√ T8
%10
0
Mr.
Bade
r Ham
ad A
l Rab
iah
Boar
d M
embe
r√
√ T√
√ T√ T
√ T√ T
√ T8
%10
0
Mr.
Tala
l S. A
l-She
hab
Boar
d M
embe
r√
√√
√ T√ T
√ T√ T
√ T8
%10
0
√A
tten
danc
e
√ TA
tten
danc
e vi
a el
ectr
onic
mea
ns
XEx
cuse
• Registering, Coordinating and Archiving Board Minutes of MeetingsThe Company has a special register where Board minutes of meetings are written in serial numbers as based on the meeting year as well as indicating the place, date, commencement and ending times thereof. The register also indicates the attending and absent members, preparing minutes of discussions and deliberations including performed voting processes, classifying and archiving the same to facilitate refrencing. The Board of Directors has also appointed a Board of Directors Secretary amongst the Company’s employees to take responsibility of these tasks in addition to other tasks relating to the coordination with the members and the other departments in the Company.
FOURTH SECTION
Rule II: Establish Appropriate Roles and Responsibilities• Defining the Roles, Responsibilities and Duties for Board Members and for the Executive Management as well as
the Authorities and PowersThe Board of Directors has specified the roles, responsibilities and duties of the Board of Directors and Executive Management, the authorities and powers delegated to the Executive Management as well as creating procedures that ensure none of the parties possess ultimate authoreties as well as to aim the facilitation of the process of questioning the Board by the Company’s shareholders.
The Board’s roles and responsibilities have been specified as the following:
1. Developing the Company’s policies and procedures and ensuring its transparency in the way that facilities the process of decision making as well as achieving the good governance principles in line with the governance system approved by the Board and setting a monitoring program for it.
2. Existence of the policies segregating the powers and authorities of both the Board of Directors and Executive Management. The authorities delegated to the Executive Management, the decision-making procedures and specifications of the delegation period have been defined.
3. Formation of the Board Committees (Audit Committee, Risk Committee, Nomination and Remunerations Committee and other committees) and the Board has adopted regulations and systems organizing the activities of those committees.
4. Through the reports provided by the Internal Audit Function, the Board shall periodically ensure the applicable internal audit systems’ efficiency and sufficiency in the Company and Subsidiary Companies thereof, as well as ensuring adoption of the appropriate control systems to measure and manage risks and to share the same, in a transparent way, with the stakeholders and the other relative parties in the Company if required. The Board Chairman shall be liable for sound and effective performance of the Board and shall ensure that the members and independent members are obtaining full and correct information on time to enable them take the correct investment decision.
5. Preparing annual report to be cited in the Company’s annual general assembly.
6. Monitoring the performance of each Board member and members of the Executive Management pursuant to the defined performance measurement indicators.
• Most Notable Achievements and Resolutions of the Board during the YearThe Board of Directors has convened 8 times during the financial year ended on 31 December 2020 (in addition to taking 6 resolutions by circulation). Below are the most important resolutions passed during such meetings:
1. Discussion and approval of the interim and annual financial statements of the Company.
2. Approval of the report on the Company’s compliance with all the regulatory requirements mentioned in the Anti-money Laundering laws, relevant reports issued by the Compliance Unit and the other report issued by the external auditor.
3. Amendment to the organizational structure of the Company and amendment and approval of some of the Company’s policies and procedures.
4. Approval of the appointment of the external auditor for the fiscal year 2020.
5. Appointment of the Internal Audit Manager
6. Formation of Credit Committee
7. Approval of the restructuring of the Company’s capital to complete the merger process.
8. Discussion and approval of annual remuneration for the Board of Directors, Board committees and executive management, as well as recommendation of the cash dividends to the shareholders.

4140 Annual Report 2020Noor Financial Investment Company - KPSC and Subsidiaries
9. Discussed and approved several transactions that took place with related parties, including buying and selling of assets.
10. Discussed and approved the investment advisor’s report, valuation report, merger project and related amendments due to Coronavirus pandemic for the merger of Noor Telecommunications Company into Noor Investment Company by way of amalgamation.
11. Discussed with the executive management several important matters, including the decisions of the Financial Action Task Force (FATF) concerning the results of assessment of certain countries wherein the Company has investments.
12. Reviewed the amendments approved by the executive regulations of the Capital Markets Authority Law for the year 2020, as well as the most prominent decisions and instructions issued by the Capital Markets Authority.
• Application of the Requirements pertaining Formation of Independent Specialized CommitteesThe Board has formed four specialized committees (detailed later), after electing the members of the new Board on 28 November 2018, that enable it to effectually fulfill its roles in accordance with the Company needs. Sufficient numbers of members were appointed in such committees including non-executive members as well as one independent member in two of the said committees pursuant to the internal regulations set and approved by the Board and which include specification of the committee’s role, its term, the granted authorities during the term and the supervision of the Board over it. The said committees shall notify the Board with the results of its activities and the decisions taken in absolute transparency through the periodical reports.
The formed committees:
1. Nominations and Remunerations Committee.
2. Credit Committee.
3. Audit Committee.
4. Risk Committee.
Below are the details of the Board Committees.
Nomination and Remunerations Committee:
Date of Forming the Committee Term of the Committee Number of Meetings
2 December 2018 Three years 3
• Roles and Tasks of the Committee
Entrusted with the task of preparing recommendations on nomination for members of the Board of Directors and executive management members, recommendations on the policies and regulations governing remunerations, recommending nomination and re-nomination acceptance for members of the Board of Directors and executive management members and setting policy for the members of the Board of Directors and executive management members’ remuneration. Further, it proposes the performance indicators, assessment of members and executive staff, and submits its recommendation to the board in addition to other related specialties.
• Members of the Nomination and Remunerations Committee:
Sr. Name of the Member Title Attendance Remarks
1 Mr. Abdulghani Mohammed Behbehani Head of Committee 100%
2 Dr. Fahad Sulaiman Al-Khaled Member 100%
3 Mr. Riyadh Salem Edrees Member 100%
4 Mr. Faisal Abdul Aziz Al-Nassar Member 100%
5 Mr. Talal Sultan Al-Shehab Member (Independent) 100% The most prominent achievements of the committee during the year
• Discussing the amendment of the organizational structure.
• Approving the succession plan for the fiscal year.
• Discussing and approving the remuneration of members of the Board of Directors and the remuneration of members of Board committees and employees.
• The amendment of the Human Resources policy in terms of support for National Manpower.
Credit Committee:
Date of Forming the Committee Term of the Committee Number of Meetings
29 January 2020 Three yearsor until BOD term 1
• Roles and Tasks of the Committee
Review the requests submitted for granting and renewing credit facilities based on the recommendation of the credit unit within the limits set by the Central Bank as well as to approve the credit limits for clients, review the final settlement for defaulting clients and extend the credit limits as set out in the credit policy and in accordance with the instructions and directives issued by the Central Bank. The Committee is also responsible for reviewing the credit policy and the proposed amendments to it prior to its approval by the Board of Directors, in accordance with the instructions of the Central Bank and the relevant authorities and in accordance with the company’s strategy.
• Members of the Credit Committee:
Sr. Name of the Member Title Attendance Remarks
1 Mr. Abdulghani Mohammed Behbehani Head of Committee 100%
2 Mr. Riyadh Salem Edrees Member 100%
3 Mr. Talal Sultan Al-Shehab Member 100%
The most prominent achievements of the committee during the year
• Formation of the committee
• Approval of a credit facility for a related party
Audit Committee:
Date of Forming the Committee Term of the Committee Number of Meetings
2 December 2018 Three years 7
• Roles and Tasks of the Committee
This Committee seeks to strengthen the compliance culture in the Company through ensuring fairness and integrity of the Company’s financial statements, ensuring the extent of sufficiency and efficiency of the internal control systems applied in the Company, reviewing periodical financial statements prior to their submission to the Board of Directors, providing the Board of Directors with its recommendations concerning the appointment, re-appointment, or replacement of the external Auditors and ensuring their independence, evaluating sufficiency and efficiency of the internal control systems applied in the Company and the technical supervision on the Company’s internal audit department in order to ensure its effectiveness in performing the operations and tasks assigned by the Board of Directors.
• Members of the Audit Committee:
Sr. Name of the Member Title Attendance Remarks
1 Mr. Riyadh Salem Edrees Head of Committee 100%
2 Mr. Faisal Abdul Aziz Al-Nassar Member 100%
3 Mr. Bader Hamad Al Rabiah Member 100%
4 Mr. Talal Sultan Al-Shehab Member (Independent) 100%
4342 Annual Report 2020Noor Financial Investment Company - KPSC and Subsidiaries
The most prominent achievements of the committee during the year
• Recommending to the Board of Directors on the appointment of internal audit manager.
• Viewing and discussing the interim and annual financial statements
• Discussing the report of the ICR “Internal Control” and the report of the Internal Audit Committee for presenting it to the General Assembly.
• Approval of the related party transactions report for the fiscal year ending on December 31, 2019.
• Discussed and recommended to the Board of Directors on the appointment of external auditor.
• Reviewed the transactions with related parties and submitted recommendations to the Board of Directors
• Discussed and approved the internal audit plan.
Risk Committee:
Date of Forming the Committee Term of the Committee Number of Meetings
2 December 2018 Three years 6
• Roles and Tasks of the Committee
Works mainly to evaluate, monitor and limit all types of risks facing the Company, review transactions to be made by the Company with the related parties and provide proper recommendations thereof to the Board of Directors, evaluate systems and mechanisms of identifying, measuring and monitoring various types of risks that may face the Company, in order to identify areas of weakness and assisting the Board of Directors to identify and evaluate the Company’s acceptable risk level, and ensure that the Company does not exceed such level after being approved by the Board of Directors.
• Members of the Risk Committee:
Sr. Name of the Member Title Attendance Remarks
1 Mr. Bader Hamad Al Rabiah Head of Committee 100%
2 Mr. Faisal Abdul Aziz Al-Nassar Member 100%
3 Mr. Riyadh Salem Edrees Member 100% The most prominent achievements of the committee during the year
• Discussing the credit policy and evidence of its procedures.
• Discussing the reports of the Risk Committee submitted by the Risk Department.
• Discussing the risks involved in transactions with related parties, reviewing those transactions, and submitting a recommendation thereon to the Board of Directors
• The mechanisms that enable Board Members to obtain Accurate and Timely information and dataThe Board Secretary shall provide the Board Members with the sufficient information about the topics that will be discussed during the meeting at least 3 business days before the meeting (unless there is an urgent meeting that required a shorter notice’s invitation) to enable them take the proper decisions, recording all the discussions between the Board members in minutes of meetings with serial numbers, defining the attendees and recording their votes on the decisions taken during the meeting, as well as ensuring good and timely delivery and distribution of reports and agenda relating to the works of the Board and the minutes of meetings’ record.
Members of the Board of Directors shall have full and quick access to all the Company’s information, documents and records through the Board Secretary or the Chairman of the Board of Directors as the same are classified and archived in a way facilitating referring thereto on due time. The Company’s Executive Management shall provide the Board and its committees with all the required documents and information through relying on information technology infrastructure providing periodical reports that are used to take proper and timely decisions.
FIFTH SECTION
Rule III: Recruit Highly Qualified Candidates for the Members of Board of Directors and the Executive Management• A brief on the Formation of the Nomination & Remunerations CommitteeThe Nomination and Remunerations Committee is formed of 5 Board members. A special consideration was given to add one of the independent members to the Committee and to be headed by one of the Non-Executive Members of the Board of Directors. Members that have proper professional expertise in human resources and administration were selected in line with the nature of the Committee and the Company’s work.
Members with technical, leadership and management capabilities enabling them to enjoy independency and fulfilling all the technical requirements and the updates on workflow were selected as well.
• Board and Executive Management Remunerations ReportRemunerations report is attached and it will be presented and read in details in the general assembly of the Company.
SIXTH SECTION
Rule IV: Safeguard the Integrity of Financial Reporting• The Board of Directors and the Executive Management’s Written Undertakings of Soundness and Integrity of
Financial ReportingThe Chief Executive Officer, Financial Manager and his assistant have provided an undertaking that the Company financial reports are provided soundly and fairly, they present all financial aspects of the Company, including data and operational results, and that they are prepared in accordance with the International Accounting Standards approved by the Capital Markets Authority and the other regulatory bodies.Moreover, Board Members have provided another undertaking indicating that the financial statements provided in the general assembly are sound and fair as per the accounting standards.
• A brief on the Formation of the Audit CommitteeThe Audit Committee is formed of four members one of them is independent. The Board Chairman or Executive Members of a Board of Directors are not members in such committee. In addition, the Committee includes at least a member of educational qualification and practical experience in the accounting and financial fields.In case of any conflicts between the recommendations of the Audit Committee and the resolutions of the Board of Directors, the Board of Directors shall include a statement detailing clearly such recommendations and reasons of noncompliance therewith by the Board of Directors.
• Ensure Independence and Neutrality of External AuditorThe Audit Committee has convened and recommended reappointment of the external auditor for the financial year ended 31 December 2020 after ensuring that they are listed in the CMA’s external auditors register and fulfilling all the required provisions stated in the CMA’s resolution concerning the registration of external Auditors.It was also verified that the external Auditor is independent from the Company and its Board of Directors and no services other than services related to the audit functions are provided to the Company, which may affect the auditors’ neutrality or independency. SEVENTH SECTION
Rule V: Apply suitable Systems of Risk Management and Internal Audit• A brief Statement on Adopting the Formation of an Independent Risk Management Unit’s RequirementsAn independent Risk Management Unit has been created which enjoys full independence through reporting directly to the Risk Committee as well as enjoying authorities to fulfill their duties in the optimal way and without being granted financial authorities and powers.
• A brief on Application of Formation of the Risk Management Committee’s RequirementsThe Board of Directors has formed the Risk Management Committee consisting of three members. The head of such committee is a Non-Executive Member of the Board. A special consideration was given to ensure that the Chairman of the Board of Directors is not be a member in such Committee. The membership term was specified as 3 years pursuant to the Committee’s charter which specified the method of its work. It is directly reporting to the Board as per its determined tasks and powers.
• A brief on Systems of Control and Internal AuditThe Company has highly efficient internal controls and risk management systems. The Board of Directors has approved an organizational structure matching the Company’s strategy, its activities, the detailed job descriptions for jobs and levels as well as the official policies and procedures governing all jobs and the Company’s operations. Execution of the same is monitored by the Internal Audit Unit that is fully independent. In addition, the said systems specify the policies, procedures, duties and responsibilities of each job as well as the authorities and reporting schemes for the multiple levels of administrators in the way
4544 Annual Report 2020Noor Financial Investment Company - KPSC and Subsidiaries
fulfilling the dual control and the principle of powers segregation to avoid the conflict between functions.The Company is conducting the Internal Control Review (ICR) through an independent audit firm other than the Company’s external auditors to ensure sufficiency of the internal control systems. An annual report is issued on the same a copy thereof is provided to the Capital markets Authority. In addition, the Company has regulations enabling the employees to contact the Chairman to report any of their concerns about possible violation by any person in the Company (Whistleblowing) through approving the whistleblowing policy and procedures and publishing the same in the folders shared with the employees in addition to putting whistleblowing forms at the Company’s website.
• A brief Statement on Adopting the formation of an Independent Internal Audit UnitThe Internal Audit Unit was formed to report to the Audit Committee and consequently to the Board of Directors. The Unit enjoys full independence and the Board has appointed the head of the Unit based on a recommendation from the Audit Committee. The Board has specified the tasks, reporting line and responsibilities of the Internal Audit Unit.
EIGHTH SECTION
Rule VI: Promote Code of Conduct and Ethical Standards• The Business Charter including Standards and Elements of Code of Conduct and Ethical StandardsThe Board of Directors has developed standards and determinants that establish the Company’s ethical concepts and standards, while, the executive management was assigned to apply the Company goals in accordance with such standards and determinants. The business charter for the Company has specified the tasks entrusted to the Board and all employees. Furthermore, the charter included a set of standards and determinants which establish the principle that each member of the Board of Directors and executive management shall abide by the laws and instructions, represent all shareholders, and abide by what is for the interest of the Company, the shareholders, and other Stakeholders, without limitation to one group only, not to use the official position of influence to achieve a private interest or any personal interests for them or for any third party, not to use the Company’s assets and resources to achieve personal interests and use such assets and resources optimally to achieve the Company’s goals, ensure developing an elaborate system and a clear mechanism that prevents the Members of the Board of Directors and employees from exploiting the information they have due to the position thereof for personal interest and prohibiting disclosure of the Company’s information and data, except in the cases that permit disclosure in accordance with legal requirements.
• Policies and Mechanisms to Reduce the Conflicts of Interest CasesThe Board of Directors has approved a policy for conflict of interest, which includes clear examples of the conflict-of-interest cases and the methods for resolving and dealing with it, without prejudice to the cases set out in the Companies Law.The Conflict-of-Interest Policy included that any members of the Board of Directors shall inform the Board of Directors of the personal interest related thereto in works or agreements concluded for the Company and such reporting shall be listed in the minutes. The member of interest shall not be entitled to vote on the resolution issued in this regard.Furthermore, the Board Chairman shall report to the general assembly at the meeting, the works and agreements, in which a Members of a Board of Directors has a personal interest, and such reporting shall be enclosed with a special report by the Auditor.
NINTH SECTION
Rule VII: Ensure Timely and High Quality Disclosure and Transparency• Mechanisms for Presentation as well as Accurate and Transparent Disclosure defining Aspects, Scopes and
Specifications of DisclosureThe Company has developed a policy for the accurate disclosure which was approved by the Board. It is being updated as per the regulators instructions. Furthermore, it has developed criteria for disclosure of material information as specified in the Executive Bylaws of the Capital Markets Authority, identified aspects, fields, and features of disclosure, the departments responsible of disclosure as well as the steps of disclosure process, method of presentation and the entities to which the disclosure shall be made, in addition to the other means of disclosure represented in the Company’s website.
• Record of Disclosures of the Members of a Board of Directors and the Executive ManagementThe Company has prepared a record of disclosures of the members of the Board of Directors and the Executive Management at the Compliance Unit along with notifying the Board members and the Executive Management to provide the head of the Unit with any trading activities made by them or for their minors on the Company’s stocks, the mother Company’s stocks or the subsidiaries. An undertaking was taken from them on this regard.
• Requirements of formation of the Investors’ Affairs UnitThe Investors’ Affairs Unit was established and an employee was appointed for the Unit. The employee was given complete independency to execute his works and the Unit is reporting directly to the CEO. Further, we are in the process of developing the Company’s website and updating the part related to the information that should be provided to the Investor’s Affairs Section.
• Develop the Infrastructure for the Information Technology on which it shall significantly rely on in the Disclosure Processes
Information technology is considered as a main pillar in the Company’s work. Automatic systems were implemented to monitor the customers’ portfolios and the units’ holders of the investment funds managed by the Company. Periodical reports of the client are obtained easily from such systems.Periodical reports are obtained and submitted to the Board members easily. The Company has expanded its reliance and adoption of information technology in order to communicate with shareholders, investors, and other stakeholders by creating a separate section on the Company’s website for corporate governance and investors’ affairs where all new information and data, that may help the shareholders, current and potential investors to have access to the rights thereof and evaluate the Company’s performance are presented. A new section was created for the Company’s disclosures which are published on Boursa Kuwait and another section for presenting the financial statements and the periodical results of the Company’s activities. Amendment was made to immediately upload the financial statements upon disclosure of the financial results.
TENTH SECTION
Rule VIII: Respect the Rights of Shareholders• Requirements of Identifying and Protecting the General Rights of Shareholders to Ensure Fairness and Equality
amongst all ShareholdersThe Company’s articles of association and internal regulations include the procedures and conditions necessary to ensure having access by all shareholders to the rights thereof, in a manner that achieve fairness and equality without contradiction with the applicable laws, regulations, resolutions and instructions issued in this regard. Shareholders’ rights include listing the ownership value of their shared investment in the Company records, disposal of shares, including registration and transfer of ownership, receiving the decided share in dividends, receiving a share in Company’s assets in case of liquidation, having access to data and information of the Company’s activity and operational and investment strategy regularly easily, participating in meetings of the shareholders’ general assembly and voting on the resolutions thereof as well as electing Members of the Board of Directors, questioning the Board members and the Executive Management and filing liability claim against them in case of failure in executing their tasks. The Company shall treat all shareholder owning the same type of shares equally and without any discrimination.
• A brief on Creating and Keeping a Special Record at the Clearing Agency within the Requirement of On-going Monitoring of Shareholders’ Data
A contract was concluded for keeping the shareholders’ record at a clearing agency licensed by Capital Markets Authority “Kuwait Clearing Company” which is entrusted with the task of recording, maintaining and updating the shareholders’ record. The clearing agency shall provide the Company with a copy of the record on weekly basis. The record contains the information related to the name and number of the shareholder, the number of shares held by the shareholder at a fixed date in addition to the personal information available with the clearing agency with respect to the contact numbers of the shareholder, his address and other information. • Encouraging Shareholders to Participate and Vote in the Company’s General Assembly MeetingsThe right of participation by shareholders in the meeting of the Company’s general assemblies and voting on resolutions thereof is an inherent right for all shareholders regardless of the different levels thereof. The Company shall extend a call for shareholders to attend the general assembly based on an invitation from the Board of Directors within three month after the end of the financial years and upon necessity. The Board of Directors may call for a general assembly to meet based on a reasoned request by shareholders owning not less than 10% of the Company’s capital or a request by the Auditor within 21 days as of the date of such request. The Company shall extend call for shareholders to attend the general assembly, including the agenda, time and place of holding such meeting through announcement in two daily newspapers. Another announcement shall be made as a reminder a week before the date of the general assembly, in addition to publishing the invitation on Boursa Kuwait’s website and the Company’s website along with confirming that any shareholder shall be entitled to authorize another person to attend to the general assembly in accordance with a special proxy. The members of the Board of Directors may not participate in voting on the general assembly resolutions concerning limitation of the responsibility thereof, to management regarding a private interest for their own selves, their spouses, or first degree relatives; or a conflict between them and the Company. The Company shall allow shareholders, prior to holding the general assembly with sufficient time, to have access to all information and data related to the agenda, and in particular the Board of Directors Report, Auditor Report and Financial Statements through the Company’s website and visiting the Company’s head office or through Kuwait Clearing Company.
ELEVENTH SECTION
Rule IX: Recognize the Roles of Stakeholders• Conditions and Policies that Ensure Protection of the Rights of StakeholdersThe Company has developed policies including rules and measures to ensure protection and acknowledgment of the rights of Stakeholders and allow them to have access to compensations, in case of any breach of the rights thereof, as set forth by the laws issued in this regard.

• Encouraging Stakeholders to Keep Track of the Company activitiesThe Company believes that the stakeholders have an important and influential role in enriching the Company’s works and assisting it to succeed. The Company’s Board of Directors realizes that the Company’s ultimate success is stemming from the mutual efforts of many parts including the shareholders, the lenders ad employees. The Company’s procedures, policies and practices are stressing on the importance of respecting the stakeholders’ rights pursuant to the relevant laws and regulations. The Company shall encourage stakeholders to keep track of its diverse activities and to develop mechanisms and frameworks that ensure maximum benefit from contributions of Stakeholders and encouraging them to keep track of the Company activities, in a manner that is consistent with achieving the benefits thereof and to allow Stakeholders to have access to information and data related to the activities thereof. In addition, the Company has set proper mechanisms allowing Stakeholders to report the Board of Directors of any unfair practices committed by the Company against them and provide a proper protection for whistle-blowers.
TWELFTH SECTION
Rule X: Encourage and Enhance Performance• The Requirements of Developing Mechanisms that allow the Board Members and Executive Management to have
regular trainingsThe Company has set induction programs for the newly appointed members and employees (no new appointment wad during the financial year) to ensure that they have a full understanding of the Company’s works and operations, provided that such programs are including the Company’s strategy, objectives , financial and operational aspects of the Company’s activities, legal and regulatory obligations of the Board members, the Company and their respective tasks as well as their authorities and rights and the role of the Board committees. Training programs, workshops, and conferences proper to the current Members of the Board of Directors and executive management were recommended, and they are related to the Company’s work, in order to develop skills and experience thereof and cope with the developments, in a manner that help them to perform assignments entrusted thereto. The Company has conducted a workshop and a training program on anti-money laundering and combating the financing of terrorism in addition of periodic governance files and many courses on disclosure of interests and organizing insiders dealing for the Board Members, Executive Management and other employees.
• Evaluate the Performance of the Board of Directors as a whole as well as the Performance of each Board Member and Executive Management
The Company has developed systems and mechanisms to evaluate the performance of each member of the Board of Directors and executive management annually, it is being updated, through developing a set of performance measurement indicators related to the extent of achieving strategic goals of the Company, quality of risk management, and sufficiency of internal control systems. Further, the Company is, currently, applying these indicators in evaluating the members and the executive management.
• Creating corporate values among the Company’s employees (Value Creation)The Board of Directors seeks to create values within the Company in the short, medium and long term, and to achieve this, the Board of Directors has adopted a Code of Business Conduct, which confirms the existence of means to follow those practices and adherence to the best professional standards and institutional values, and sought to link the extent of commitment to corporate values with the performance evaluation of the Company’s employees in order to ensure the achievement of the Company’s strategic objectives.The most prominent efforts m ade by the Company to encourage institutional values within the Company are to provide the opportunity for all categories of employees to present their ideas and initiatives to the executive management, where discussion sessions are held periodically in the presence of senior management with employees of all administrative levels, to see the ideas that can be applied and develop work procedures that will be reflected in Company business development.
THIRTEENTH SECTION
Rule XI: Focus on the Importance of Corporate Social Responsibility• A brief on Developing a Policy that ensures Balance between the Company Goals and Society ObjectivesThe Company has set a policy, as approved by the Board of Directors, to aim a balance between each of the Company’s goals and the goals of society. It has implemented several projects that serve the community, such as supporting a graduation project for students of the College of Engineering, supporting the children of the Company’s employees, and providing aid to needy families through cooperation with a charitable association.The Company believes in activating its social role, and the importance of community members as the main pillar in society (a detailed report on the mentioned projects is attached later).
BOARD AUDIT COMMITTEE REPORT AND INTERNAL CONTROL REVIEW REPORT
4746 Annual Report 2020Noor Financial Investment Company - KPSC and Subsidiaries
4948 Annual Report 2020Noor Financial Investment Company - KPSC and Subsidiaries
Board Audit Committee Report and Internal Control Review Report
Board Audit Committee ("BAC" or "Committee") FormationThe BAC membership comprises of four Committee members, of which one member is an Independent member thereby ensuring neutrality and impartiality in carrying out the responsibilities.
BAC Meetings 2020During the year 2020, seven meetings of the BAC were held, wherein they discussed matters pertaining to the Company along with providing their recommendations and taking various decisions as detailed below.
Tasks and Duties performed by the BAC• The Committee approved to engage RSM Al-Bazie Consulting to assist the Internal Audit Unit in carrying out internal audit
and preparing internal audit reports for the period up to October 2020.• The Committee reviewed a detailed Internal Control Report of Noor prepared by Internal Audit Unit.• The Committee approved to engage M/s Mazars - Hend Abdullah Al-Surayea & Company, Kuwait to prepare the Internal
Control Review Report (ICR) for the year ended 31st December 2019. The Committee also reviewed Noor’s Internal Control Review Report (ICR) for the year 2019, which was submitted to CMA and noted the observations.
• The Committee reviewed the Related Party Transaction Report for the year 2019 and recommended to the Board for approval.
• Based on the criteria set for external auditor’s performance assessment, the Committee assessed their performance after getting the views of the Executive Management, Financial Management and Chairman of the Board of Directors.
• The Committee recommended to the Board of Directors for the appointment of Abdullatif M. Al-Aiban of M/s Grant Thornton – Al-Qatami, Al-Aiban & Partners – as the external auditor for the financial year ended 31st December 2020.
• The Committee noted the penalties report and recommended to the Board for review and requested to include it with the penalties report to be read at Noor’s next AGM.
• The Committee reviewed various related party transactions during the year 2020 and provided its relevant recommendations to the Board.
• The Committee reviewed the annual and quarterly draft financial statements of the Company and provided their recommendation to the Board.
• The BAC had periodic meetings with external auditors, M/s Grant Thornton, on the audit findings for Noor and its subsidiaries for the year ended 31st December 2019, for the period ended 31st March 2020, 30th June 2020 and 30th
September 2020. Grant Thornton provided the details of the overall audit and review of consolidated financial statements, status of their work and overview of findings.
• The Committee reviewed the complaints report and noted no complaints were lodged during the year. • The Committee recommended to the Board for approval of the appointment of Mr. Zahid ul Haq as Internal Audit Manager
of Noor.• The Committee reviewed and noted the disclosure of COVID-19 impact on the Company’s financial statements as per the
format circulated by CMA.
Internal Control Review ReportThe Board Audit Committee in 2020 has overseen the quality and integrity of internal audit practices at Noor Financial Investment Company. To assess this, the BAC held seven meetings during the year with at least one meeting being held each quarter. Some members of the executive management whom the Committee deemed necessary were asked to attend the meetings as required.
The Committee’s opinion on the internal controlsThe BAC oversaw the adequacy of the Company’s controls and systems. No significant issues in internal controls were noted during the year and whilst some minor issues were reported in the application of controls, the committee was satisfied that these were addressed by the management and had no material impact on the overall operations of the business.
Scope and methodologyThe overall evaluation of the Internal control systems for the year 2020 was carried out in accordance with the Capital Market Authority (Book 15, Article 6-8) instructions encompassing the following aspects:
• Procedures of audit and supervision of efficiency and effectiveness of Internal control systems necessary to protect the Company’s assets, accuracy of financial statements, efficiency of operations, including the administrative, financial, and accounting aspects thereof.
• Compare development of risk factors and the current systems to evaluate the extent of efficiency of the Company’s daily business operations, and its ability to manage the market changes.
• Evaluate performance of the executive management in applying internal audit systems.• Reasons of any weakness in applying the internal control, which affect or may affect the Company’s financial performance
as well as the procedures followed by the Company to resolve identified issues.
Important OutcomesFollowing are important outcomes for above-mentioned meetings:
• BAC reported that it was satisfied with the Company’s Internal Control procedures, which are based on a solid and professional framework, being implemented efficiently, and that all necessary actions have been or are being taken to rectify the weaknesses reported during the year.
• BAC assessed the effectiveness of the Company’s Internal Control systems, including Information technology security and controls, and reviewed the results of Internal and External Auditors’ review of internal controls by obtaining reports on significant findings, recommendations and management’s responses thereto.
• BAC reviewed the key assumptions used in preparation of the financial statements. Moreover, the BAC placed particular emphasis on the fair presentation, reasonableness of the judgment applied, and the appropriateness of significant accounting policies used in their preparation.
• BAC reviewed and evaluated the financial statements for the reasonableness, compliance with the accounting standards and regulatory requirements, completeness and accuracy, prior to issue and approval by the Board of Directors and gave opinion and recommendations with respect thereto.
• BAC discussed the risk assessment for all activities of the company, inspected the level of risk identified. This formed the basis for the annual Internal Audit plan, which was discussed and adopted.
• BAC supervised and reviewed the activities carried out by the Internal Audit function and reviewed the Internal Audit plan.
Reyadh S. Al-EdrissiBAC Chairman

5150 Annual Report 2020Noor Financial Investment Company - KPSC and Subsidiaries
REMUNERATIONS AND ALLOWANCES REPORT TO AGM
Remunerations Report for the Financial Year ended on 31 December 2020
SECTION 1: Policy of Remunerations and Allowances to Members of the Board of DirectorsThe Board of Directors ratified the Remunerations Policy at “Noor”, which covers remunerations to members of the Company’s Board of Directors. This Policy aims at linking these granted remunerations with the management of the Company and the acceptable risk levels for attracting the required personnel to the Company and ensures transparency.The Remunerations Policy for the members of the Board of Directors stipulated the following:
• The total remunerations shall not exceed 10% of the Company’s net profits (after deducting the depreciation, reserves and dividends to which should not be less than 5% of the Company’s capital, or any higher ratio of the same, as provided for in the Company’s articles of association).
• Remunerations to the members of the Board of Directors must be ratified by the General Assembly at its annual meeting, based on proposal of the Remunerations and Nominations Committee and recommendation of the Board of Directors.
• The independent Board Director can be exempted from the maximum limit of the remuneration if approved by the ordinary General Assembly.
• Remunerations and allowances of the members of the Board of Directors are composed of three parts, as follows:
o Part One: Comprising of remuneration and allowance for attendance of the Board of Directors meetings:
1. The Board Directorship Remuneration. This is an annual directorship remuneration granted to all members of the Board of Directors according to the indicators of the performance parameters endorsed by the Board of Directors, and in accordance with the profits realized by the Company, and that such remunerations must be in line with the provisions of article 198 of the Kuwaiti Companies Law. It is subject to the approval of the General Assembly.
2. Meetings Attendance Allowance: Members of the Board of Directors are entitled to receive fixed allowance for attendance of meeting of the Board of Directors in accordance with the certified policy.
o Part Two: Allowances for the Director’s Participation in the Committees’ Membership
The Board of Director ratifies the remunerations of the Board Committees, upon recommendation of the Remunerations and Nominations Committee, which are in the following form:
1. Variable remunerations:
The variable remunerations have been designed to stimulate the outstanding performance members of committees, in accordance with the general framework of risks to the Company. Variable remunerations have been designated based on the performance of the member and the relevant committee in addition to the committee’s performance in general. These remunerations are designated through the member performance appraisal system and in accordance with the discretion of the committee.
Variable remunerations are divided into annual cash remunerations and incentives, where these remunerations are determined on annual basis by the Nominations and Remunerations Committee before approval of the Company’s Board of Directors thereon. The performance appraisal process is carried out in accordance with the performance appraisal policy concerning the Board of Directors and the Committees, approved by the Board of Directors.
2. Meetings Attendance Allowance: Committees’ members are entitled to receive fixed allowance for attendance of meetings of the Board of Directors in accordance with the certified policy.

5352 Annual Report 2020Noor Financial Investment Company - KPSC and Subsidiaries
o Part Three: This includes remuneration paid for the special engagements.
These remunerations are granted in case the Board of Directors engages of any of its director(s) with certain tasks in accordance with article No. 185 of the Companies Law, which stipulates that “The Board of Directors may distribute the work among its members in accordance with the nature of the Company’s business. The Board of Directors may also authorize one of its directors, one of its committees or a third party to perform a certain business or more, oversight an activity of the Company’s activities, or exercising certain authorities or jurisdictions vested in the Board”.
SECTION 2: Policy of Remunerations to the Members of the Executive ManagementThe remunerations regulation concerning the executive management takes into consideration the environment in which the Company exercises its business, the results realized and the Company’s endurance of risks. These regulations comprise the following main components:
• Fixed RemunerationsFixed remunerations in the Company are determined taking into consideration the level of the assigned responsibilities, and the professional course designated to members of the executive management in the Company. Fixed remunerations are agreed contractually with members of the executive management in consideration of their skills, competencies and experience used for performing their occupational roles. Fixed remunerations are reviewed on periodic basis, and fixed remunerations have been determined, including salaries, allowances and benefits within the salaries structure and job grades certified by the Company’s Board of Directors.
• Variable RemunerationsVariable remunerations have been designed to stimulate the high-performing staff, in accordance with the general framework of risks to the Company. Variable remunerations have been designated based on the staff performance, and the organizational sector to which the staff is reporting, in addition to the Company’s performance in general. These remunerations are designated through the individual performance appraisal system.
Variable remunerations are divided into annual cash remunerations, incentives / long term incentives, where these remunerations are determined on annual basis by the Nominations and Remunerations Committee before the approval of Company’s Board of Directors. The performance appraisal process is carried out in accordance with the performance appraisal process of the Company as approved by the Board of Directors.
SECTION 3: Balancing Between Fixed and Variable Remunerations Noor takes the necessary measures to ensure the existence of appropriate balance between fixed and variable remunerations, in order to be able to amend the variable remunerations in case the financial performance is weak or negative. The ratio of the fixed and variable remunerations is reviewed and it is determined annually by the Board of Directors, based on recommendation of the Nominations and Remunerations Committee.
Report of the Remunerations of the Board of Directors and its Committees:
1- Remunerations of the Board of Directors for the year 2020
Item Number Total remuneration
Clarification
Board Members 6 KD 165,000 Recommendation was given to the general assembly of the Company to approve the board of directors’ remuneration in the amount of “Kuwaiti Dinar one hundred sixty-five thousand” in accordance with the Companies Law No. 1 of 2016. This recommendation is subject to the approval of the general assembly of the Company and the relevant regulators.
2- Remunerations of the Board Committees for the year 2020
Board Committees No. of Members Total remuneration Clarification
Auditing Committee 4
KD 190,000
Kuwaiti Dinar one hundred ninety thousand is the total consolidated remunerations for all board committees and their members
Risk Committee 3
Nomination & Remunerations Committee
5
3- Allowances for certain tasks Pursuant to the provisions of Article 185 of the Companies Law, the Board of Directors assigned Chairman of the Board of Directors to follow up one of the important files of the company that requires work outside the Board of Directors’ scope of work. Based on the realized results and objectives, it has been resolved to grant him a special remuneration valuing KD 140 thousand (Kuwaiti Dinar one hundred forty thousand). Recommendation has been given to release this amount by the Nominations and Remunerations Committee and it has been upheld by the Board of Directors.
Second: Members of the Executive Management
1- Remunerations granted to the executives of the company during the financial year ended on 31 December 2020:
Executive Management Members
Fixed salaries Variable remunerations
Other amounts from affiliates
Total remunerations *
CEO (1)
283,217 167,152 31,000 481,369Financial Manager (1)
Vice Presidents (2)
Heads of sections and units (4)
*Include salaries and variable remuneration for the year 2020.
The remunerations report shall be presented and read in detail in the general assembly of the company pursuant to the governance rules.
Chairman of Nominations & Remunerations Committee Abdul Ghani Mohamed Saleh Behbehani

Report for the transactions with the Related Parties
Report for the transactions with the Related Parties
1. List of transactions:
Name of the related party Relationship Transaction
Type Transaction
value (KD) Transaction Description
Arab Information and
Management System (AIMS)
Indirect subsidiary
Credit facility 30,000
Working capital loan of KWD 30,000 granted to AIMS repayable on 24 September 2021, and carries interest at 2% above the CBK discount rate
Kuwaiti Indian Holding (KIHC) Subsidiary Sale of
Shares 870,197 Sale of 10,000 Shared of Noor UK holding and transfer of 100% ownership of Noor UK Holding from Noor to KIHC.
Kuwaiti Indian Holding (KIHC) Subsidiary Fund
Transfers 300,000 Transfer of funds for partial settlement of current account balance
Meezan Bank Limited Associates Dividend
Receipt 4,980,065 Dividend received from Meezan Bank Limited
National Industries Group
Ultimate Parent Company
Loan repayment 2,500,000 Partial repayment of loans
National Industries Group
Ultimate Parent Company
Interest payment 142,691 Interest payment for the loan
Noor Kuwait Holding KSCC Subsidiary Purchase of
shares 1,187,370 Purchase of 7.47 million treasury shares at 159 fills per share.
2. Significant balances of related parties included in the Consolidated Statement of Financial Position:
31 Dec. 2020
KD
2.1 Due from related parties
- Due from related parties 18,462
- Accrued income and management fees 462,515
2.2 Due to related parties
- Due to Ultimate Parent Company 9,080
- Key management personal and other related parties 495,000
- Loan payable to Ultimate Parent Company 2,500,000
2.3 Investments in related parties
- Investments at fair value through profit or loss 1,347
- Investments at FVOCI 6,874,858
3. Significant related party transactions included in the consolidated statement of profit or loss
31 Dec. 2020
Consolidated statement of profit or loss
KD
- Management and placement fee income 3,438
- Finance costs – Ultimate Parent Company 142,040
Dr. Fahad Sulaiman Al-KhaledChairman
5554 Annual Report 2020Noor Financial Investment Company - KPSC and Subsidiaries
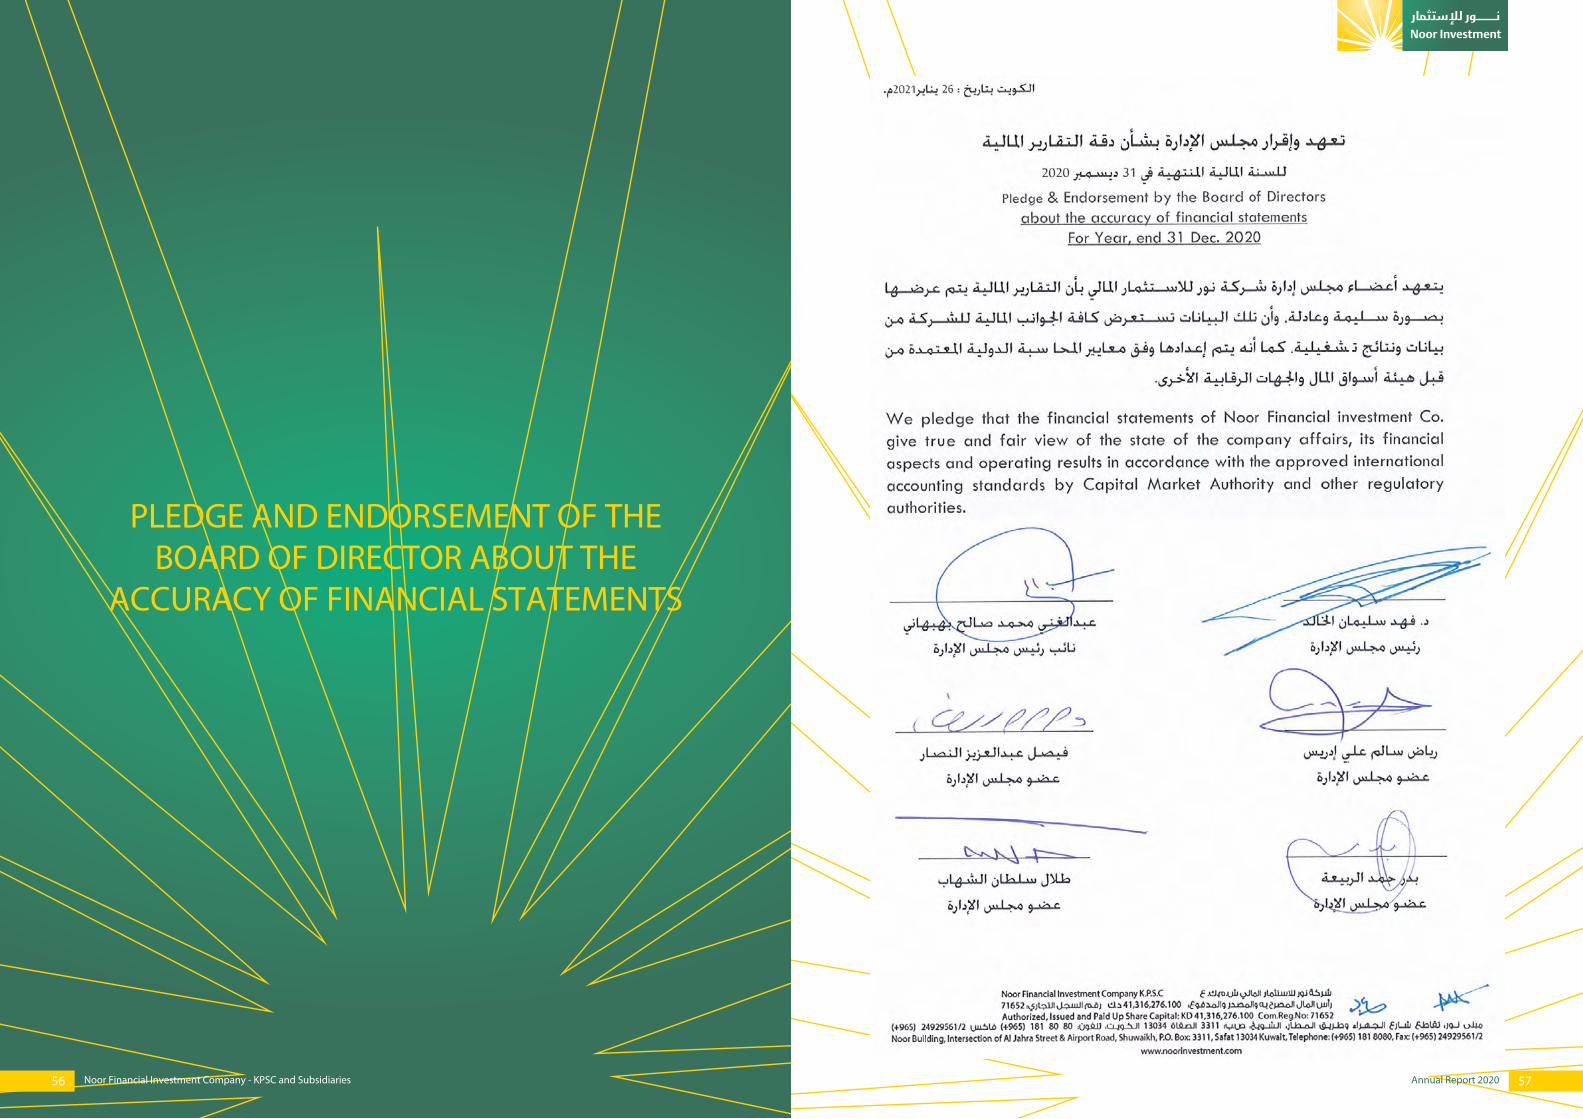
PLEDGE AND ENDORSEMENT OF THE BOARD OF DIRECTOR ABOUT THE
ACCURACY OF FINANCIAL STATEMENTS
5756 Annual Report 2020Noor Financial Investment Company - KPSC and Subsidiaries

Noor Financial Investment Company - KPSC and Subsidiaries
Kuwait
Consolidated Financial Statements and
Independent Auditors’ Report31 December 2020
60 - 62
63
64
65
66 - 67
68 - 69
70 - 117
CONTENTS
Independent auditor’s report
Consolidated statement of profit or loss
Consolidated statement of profit or loss and other comprehensive income
Consolidated statement of financial position
Consolidated statement of changes in equity
Consolidated statement of cash flows
Notes to the consolidated financial statements
5958 Annual Report 2020Noor Financial Investment Company - KPSC and Subsidiaries

6160 Annual Report 2020
Noor Financial Investment Company – KPSC and SubsidiariesConsolidated Financial Statements31 December 2020Kuwait
Noor Financial Investment Company – KPSC and SubsidiariesConsolidated Financial Statements31 December 2020Kuwait
Noor Financial Investment Company - KPSC and Subsidiaries
Al-Qatami, Al-Aiban & Partners Auditors & ConsultantsSouq Al Kabeer Building - Block A - 9th FloorTel: +965 22443900-9Fax: +965 22438451P.O.Box 2986, Safat 13030KuwaitEmail: [email protected]
Independent Auditor’s Report To the Shareholders of Noor Financial Investment Company KPSC - Kuwait
Report on the Audit of the Consolidated Financial Statements
OpinionWe have audited the consolidated financial statements of Noor Financial Investment Company – Kuwaiti Public Shareholding Company (the ‘‘Parent Company”) and Subsidiaries, (collectively the “Group”), which comprise the consolidated statement of financial position as at 31 December 2020, and the consolidated statement of profit or loss, consolidated statement of profit or loss and other comprehensive income, consolidated statement of changes in equity and consolidated statement of cash flows for the year then ended, and notes to the consolidated financial statements, including a summary of significant accounting policies.
In our opinion, the accompanying consolidated financial statements present fairly, in all material respects, the consolidated financial position of the Group as at 31 December 2020, and its consolidated financial performance and its consolidated cash flows for the year then ended in accordance with International Financial Reporting Standards (IFRSs), as adopted for use by the State of Kuwait.
Basis for Opinion We conducted our audit in accordance with International Standards on Auditing (ISAs). Our responsibilities under those standards are further described in the Auditor’s Responsibilities for the Audit of the Consolidated Financial Statements section of our report. We are independent of the Group in accordance with the International Ethics Standards Board for Accountants’ Code of Ethics for Professional Accountants (IESBA Code), and we have fulfilled our other ethical responsibilities in accordance with the IESBA Code. We believe that the audit evidence we have obtained is sufficient and appropriate to provide a basis for our opinion.
Key Audit Matters Key audit matters are those matters that, in our professional judgment, were of most significance in our audit of the consolidated financial statements of the current year. These matters were addressed in the context of our audit of the consolidated financial statements as a whole, and in forming our opinion thereon, and we do not provide a separate opinion on these matters. We have determined the matters described below as the key audit matters.
Valuation of investments held at fair value The Group invests in various assets classes, of which 19% of the total assets represent investments which are carried at fair value and classified either as investments at fair value through profit or loss or as investments at fair value through other comprehensive income. The investments are fair valued on a basis considered most appropriate by the management, depending on the nature of the investment, and the valuation is performed by the Group using a fair value hierarchy as detailed in note 29.3. 69% of these investments are carried at fair value based on Level 1 valuations, and the balance 31% of these investments are carried at fair value either based on Level 2 or Level 3 valuations. Fair value measurement can be a subjective area and more so for the investments classified under level 2 and level 3 since these are valued using inputs other than quoted prices in an active market. Given the inherent subjectivity in valuation of investments classified under level 2 and level 3 we determined this to be a key audit matter. Refer to Note 5.15.3, 5.15.8, 14, 16 and 29.2 for more information on fair valuation of investments at fair value through other comprehensive income and investments at fair value through statement of profit or loss.
Our audit procedures included, among others, documenting and assessing the processes in place to fair value the investment portfolio. Agreeing the carrying value of the investments to the Group’s internal or external valuations prepared using valuation techniques, assessing and challenging the appropriateness of estimates, assumptions and valuation methodology and obtaining supporting documentation and explanations to corroborate the valuations.
Investment Property valuations The Group’s investment properties represent 12% of the total assets and comprise of land and rental buildings located in Kuwait, other Middle East countries and United Kingdom. The Groups policy is that property valuations are performed at year end by external valuators, as detailed in note 29.4. These valuations are based on number of assumptions, including estimated rental revenues, capitalization yields, historical transactions, market knowledge, occupancy rates and cost of construction. Given the fact that the fair value of the investment properties represents a significant judgment area and the valuations are highly dependent on estimates we determined this to be a key audit matter. Refer to Note 18 and 29.4 for more information on the valuation of the Investment Properties.
Our audit procedures included, among others, assessing the appropriateness of management’s process for reviewing and assessing the work of the external valuers and their valuations including management’s consideration of competence and independence of the external valuers. We reviewed the valuation reports from the external valuers and agreed them to the carrying value of the properties. We assessed the appropriateness of the valuation methodologies used in assessing the fair value of the investment properties including discussions with the management on the estimates, assumptions and valuation methodology used in assessing the fair value of investment properties.
Other information included in the Group’s 2020 annual report Management is responsible for the other information. Other information consists of the information included in the Annual Report of the Group for the year ended 31 December 2020 other than the consolidated financial statements and our auditor’s report thereon. We obtained the report of the Parent Company’s Board of Directors, prior to the date of our auditor’s report and we expect to obtain the remaining sections of the Group’s Annual Report for the year ended 31 December 2020 after the date of our auditors’ report.
Our opinion on the consolidated financial statements does not cover the other information and we do not express any form of assurance conclusion thereon.
In connection with our audit of the consolidated financial statements, our responsibility is to read the other information identified above and, in doing so, consider whether the other information is materially inconsistent with the consolidated financial statements or our knowledge obtained during the audit or otherwise appears to be materially misstated. If, based on the work we have performed on the other information that we have obtained prior to the date of this auditors’ report, we conclude that there is a material misstatement of other information, we are required to report that fact. We have nothing to report in this regard.
Responsibilities of Management and Those Charged with Governance for the Consolidated Financial Statements Management is responsible for the preparation and fair presentation of the consolidated financial statements in accordance with IFRSs, as adopted for use by the State of Kuwait, and for such internal control as management determines is necessary to enable the preparation of consolidated financial statements that are free from material misstatement, whether due to fraud or error.
In preparing the consolidated financial statements, management is responsible for assessing the Group’s ability to continue as a going concern, disclosing, as applicable, matters related to going concern and using the going concern basis of accounting unless management either intends to liquidate the Group or to cease operations, or has no realistic alternative but to do so.
Those charged with governance are responsible for overseeing the Group’s financial reporting process.
Auditor’s Responsibilities for the Audit of the Consolidated Financial Statements Our objectives are to obtain reasonable assurance about whether the consolidated financial statements as a whole are free from material misstatement, whether due to fraud or error, and to issue an auditors’ report that includes our opinion. Reasonable assurance is a high level of assurance, but is not a guarantee that an audit conducted in accordance with ISAs will always detect a material misstatement when it exists. Misstatements can arise from fraud or error and are considered material if, individually or in the aggregate, they could reasonably be expected to influence the economic decisions of users taken on the basis of these consolidated financial statements.
As part of an audit in accordance with ISAs, we exercise professional judgment and maintain professional skepticism throughout the audit. We also:
• Identify and assess the risks of material misstatement of the consolidated financial statements, whether due to fraud or error, design and perform audit procedures responsive to those risks, and obtain audit evidence that is sufficient and appropriate to provide a basis for our opinion. The risk of not detecting a material misstatement resulting from fraud is higher than for one resulting from error, as fraud may involve collusion, forgery, intentional omissions, misrepresentations, or the override of internal control.
• Obtain an understanding of internal control relevant to the audit in order to design audit procedures that are appropriate in the circumstances, but not for the purpose of expressing an opinion on the effectiveness of the Group’s internal control.

6362 Annual Report 2020
Noor Financial Investment Company – KPSC and SubsidiariesConsolidated Financial Statements31 December 2020Kuwait
Noor Financial Investment Company – KPSC and SubsidiariesConsolidated Financial Statements31 December 2020Kuwait
Noor Financial Investment Company - KPSC and Subsidiaries
• Evaluate the appropriateness of accounting policies used and the reasonableness of accounting estimates and related disclosures made by management.
• Conclude on the appropriateness of management’s use of the going concern basis of accounting and, based on the audit evidence obtained, whether a material uncertainty exists related to events or conditions that may cast significant doubt on the Group’s ability to continue as a going concern. If we conclude that a material uncertainty exists, we are required to draw attention in our auditor’s report to the related disclosures in the consolidated financial statements or, if such disclosures are inadequate, to modify our opinion. Our conclusions are based on the audit evidence obtained up to the date of our auditor’s report. However, future events or conditions may cause the Group to cease to continue as a going concern.
• Evaluate the overall presentation, structure and content of the consolidated financial statements, including the disclosures, and whether the consolidated financial statements represent the underlying transactions and events in a manner that achieves fair presentation.
• Obtain sufficient appropriate audit evidence regarding the financial information of the entities or business activities within the Group to express an opinion on the consolidated financial statements. We are responsible for the direction, supervision and performance of the Group audit. We remain solely responsible for our audit opinion.
We communicate with those charged with governance regarding, among other matters, the planned scope and timing of the audit and significant audit findings, including any significant deficiencies in internal control that we identify during our audit.
We also provide those charged with governance with a statement that we have complied with relevant ethical requirements regarding independence, and to communicate with them all relationships and other matters that may reasonably be thought to bear on our independence, and where applicable, related safeguards.
From the matters communicated with those charged with governance, we determine those matters that were of most significance in the audit of the consolidated financial statements of the current year and are therefore the key audit matters. We describe these matters in our auditor’s report unless law or regulation precludes public disclosure about the matter or when, in extremely rare circumstances, we determine that a matter should not be communicated in our report because the adverse consequences of doing so would reasonably be expected to outweigh the public interest benefits of such communication.
Report on Other Legal and Regulatory Requirements Furthermore, in our opinion, proper books of account have been kept by the Parent Company and the consolidated financial statements, together with the contents of the report of the Parent Company’s board of directors relating to these consolidated financial statements, are in accordance therewith. We further report that we obtained all the information and explanations that we required for the purpose of our audit and that the consolidated financial statements incorporate all information that is required by the Companies Law No. 1 of 2016 and its Executive Regulations, as amended, and by the Parent Company’s Memorandum of Incorporation and Articles of Association, as amended, that an inventory was duly carried out and that, to the best of our knowledge and belief, no violations of the Companies Law, the Executive Regulations, or of the Parent Company’s Memorandum of Incorporation and Articles of Association, as amended, have occurred during the year ended 31 December 2020 that might have had a material effect on the business or financial position of the Parent Company.
We further report that, during the course of our audit, we have not become aware of any violations of the provisions of Law No. 32 of 1968, as amended, concerning currency, the Central Bank of Kuwait and the organisation of banking business, and its related regulations, or of the provisions of Law No. 7 of 2010, concerning the Capital Markets Authority and its related regulations during the year ended 31 December 2020 that might have had a material effect on the business or financial position of the Parent Company.
Abdullatif M. Al-Aiban (CPA)(Licence No. 94-A)of Grant Thornton – Al-Qatami, Al-Aiban & Partners
Kuwait17 February 2021
Consolidated statement of profit or loss
Note
Year ended 31 Dec.
2020
Year ended31 Dec.
2019
KD KD
Continuing operations
Revenue from hotel operations and IT Services 13,306,655 13,389,851
Realised (loss)/gain on investments at fair value through profit or loss (145,607) 1,870,232
Unrealised gain on investments at fair value through profit or loss 73,279 1,713,417
Dividend income 803,261 1,145,524
Change in fair value of investment properties 18 (872,677) (1,150,306)
Rental Income 473,015 656,897
Share of results of associates 17 14,845,557 10,769,182
Realised gain on partial disposal/disposal of associates 17 - 1,576,423
Management fees 13,263 19,810
Total Income 28,496,746 29,991,030
Cost of sales and services from hotel operations and IT services 8 (11,129,237) (10,557,784)
General, administrative and other expenses 8 (4,269,886) (5,783,342)
Operating profit 13,097,623 13,649,904
Interest and other income 9 986,336 1,151,323
Foreign exchange loss (23,549) (891,600)
Finance costs (1,096,766) (1,810,452)
Impairment in value of intangible assets - (945,000)
Impairment in value of property and equipment - (530,144)
Impairment in value of accounts receivable (544,178) -
Profit from continuing operations 12,419,466 10,624,031
Discontinued operations
Loss from discontinued operations - (1,456,681)
Profit before Zakat and directors’ remuneration 12,419,466 9,167,350
Provision for Zakat (122,448) (127,348)
Directors’ remuneration 26 (165,000) (120,000)
Profit for the year 12,132,018 8,920,002
Attributable to:
Owners of the Parent Company 11,857,421 8,077,234
Non-controlling interests 274,597 842,768
12,132,018 8,920,002
Basic and diluted earnings/(loss) per share attributable to the owners of the Parent Company (Fils)
- From continuing operations 11 30.02 23.89
- From discontinued operations - (3.65)
30.02 20.24
The notes set out on pages 70 to 117 form an integral part of these consolidated financial statements.

6564 Annual Report 2020
Noor Financial Investment Company – KPSC and SubsidiariesConsolidated Financial Statements31 December 2020Kuwait
Noor Financial Investment Company – KPSC and SubsidiariesConsolidated Financial Statements31 December 2020Kuwait
Noor Financial Investment Company - KPSC and Subsidiaries
Consolidated statement of profit or loss and other comprehensive income Year ended
31 Dec. 2020
Year ended31 Dec.
2019
KD KD
Profit for the year 12,132,018 8,920,002
Other comprehensive income:
Items to be reclassified to profit or loss in subsequent periods:
- Exchange differences arising from translation of foreign operations (1,214,497) (3,727,669)
- Transfer to consolidated statement of profit or loss on partial disposal of associate - 1,546,777
Share of other comprehensive income of associates:
- Changes in fair value (3,190,730) 6,290,837
Other comprehensive (loss)/income to be reclassified to profit or loss in subsequent periods (4,405,227) 4,109,945
Items not to be reclassified to profit or loss in subsequent periods
- Remeasurement of defined benefit plan of a foreign associate - (59,730)
- Net changes in fair value arising during the year for equity investments classified as FVOCI (2,939,111) (122,120)
Other comprehensive loss not being reclassified to profit or loss in subsequent periods (2,939,111) (181,850)
Other comprehensive (loss)/income for the year (7,344,338) 3,928,095
Total comprehensive income for the year 4,787,680 12,848,097
Total comprehensive income attributable to:
Owners of the Parent Company 4,633,784 12,245,600
Non-controlling interests 153,896 602,497
4,787,680 12,848,097
The notes set out on pages 70 to 117 form an integral part of these consolidated financial statements.
Consolidated statement of financial position
Note31 Dec.
202031 Dec.
2019
KD KD
Assets
Cash and bank balances 12 4,133,589 2,580,478
Short term deposits 12 6,997,843 5,628,943
Wakala investments 13 - 1,000,000
Investments at fair value through profit or loss 14 7,599,868 11,704,245
Accounts receivable and other assets 15 4,489,542 4,445,898
Inventories 589,801 527,240
Investments at fair value through other comprehensive income 16 13,240,681 16,168,068
Investment in associates 17 52,118,051 46,722,338
Investment properties 18 13,056,083 13,895,210
Property and equipment 1,677,607 1,960,898
Right of use assets 1,257,317 1,432,738
Goodwill and other intangible asset 19 2,029,278 2,164,019
Total assets 107,189,660 108,230,075
Liabilities and Equity
Liabilities
Due to banks 12 333,516 408,598
Accounts payable and other liabilities 20 9,272,195 8,157,560
Borrowings 21 22,699,375 27,352,021
Provision for end of service indemnity 1,269,027 1,058,101
Total liabilities 33,574,113 36,976,280
Equity
Share capital 22 41,316,276 41,316,276
Share premium 22 3,410,573 3,410,573
Treasury shares 23 (4,138,316) (4,138,316)
Legal reserve 24 6,681,356 5,466,869
Voluntary reserve 24 6,681,356 5,466,869
Cumulative changes in fair value 25 (4,592,987) 1,416,153
Foreign currency translation reserve 25 (24,304,564) (23,090,067)
Retained earnings 41,828,327 34,769,670
Equity attributable to the owners of the Parent Company 66,882,021 64,618,027
Non-controlling interests 25 6,733,526 6,635,768
Total equity 73,615,547 71,253,795
Total liabilities and equity 107,189,660 108,230,075
Fahad Sulaiman Al-KhaledChairman
Abdulghani M.S. BehbehaniVice Chairman
The notes set out on pages 70 to 117 form an integral part of these consolidated financial statements.

6766 Annual Report 2020Noor Financial Investment Company - KPSC and Subsidiaries
Noo
r Fin
anci
al In
vest
men
t Com
pany
– K
PSC
and
Subs
idia
ries
Cons
olid
ated
Fin
anci
al S
tate
men
ts31
Dec
embe
r 202
0Ku
wai
t
Cons
olid
ated
sta
tem
ent o
f cha
nges
in e
quity
Eq
uity
att
ribu
tabl
e to
ow
ners
of t
he P
aren
t Com
pany
Tota
l Equ
ity
Shar
e ca
pita
lSh
are
prem
ium
Trea
sury
sh
ares
Lega
l re
serv
eV
olun
tary
re
serv
e
Cum
ulat
ive
chan
ges
in fa
ir v
alue
Fore
ign
curr
ency
tr
ansl
atio
n re
serv
eRe
tain
ed
earn
ings
Su
b-to
tal
Non
-co
ntro
lling
in
tere
sts
KDKD
KDKD
KDKD
KDKD
KDKD
KD
Bala
nce
as a
t 1 Ja
nuar
y 20
2041
,316
,276
3,41
0,57
3(4
,138
,316
)5,
466,
869
5,46
6,86
91,
416,
153
(23,
090,
067)
34,7
69,6
7064
,618
,027
6,63
5,76
871
,253
,795
Rede
mpt
ion
of
Shar
e ca
pita
l by
no
n-co
ntro
lling
inte
rest
-
--
--
--
--
(10,
502)
(10,
502)
Div
iden
d pa
id t
o no
n-co
ntro
lling
in
tere
sts
by a
sub
sidi
ary
--
--
--
--
-(4
5,63
6)(4
5,63
6)
Div
iden
d pa
id d
urin
g th
e ye
ar
(not
e 26
)-
--
--
--
(2,3
69,7
90)
(2,3
69,7
90)
-(2
,369
,790
)
Tran
sact
ions
wit
h ow
ners
--
--
--
-(2
,369
,790
)(2
,369
,790
)(5
6,13
8)(2
,425
,928
)
Profi
t for
the
year
--
--
-11
,857
,421
11,8
57,4
2127
4,59
712
,132
,018
Oth
er c
ompr
ehen
sive
loss
for t
he
year
--
--
-(6
,009
,140
)(1
,214
,497
)-
(7,2
23,6
37)
(120
,701
)(7
,344
,338
)
Tota
l com
preh
ensi
ve (l
oss)
/inco
me
for t
he y
ear
--
--
-(6
,009
,140
)(1
,214
,497
)11
,857
,421
4,63
3,78
415
3,89
64,
787,
680
Tran
sfer
to re
serv
es-
--
1,21
4,48
71,
214,
487
--
(2,4
28,9
74)
--
-
Bala
nce
as a
t 31
Dec
embe
r 202
041
,316
,276
3,41
0,57
3(4
,138
,316
)6,
681,
356
6,68
1,35
6(4
,592
,987
)(2
4,30
4,56
4)41
,828
,327
66,8
82,0
216,
733,
526
73,6
15,5
47
The
note
s set
out
on
page
s 70
to 1
17 fo
rm a
n in
tegr
al p
art o
f the
se co
nsol
idat
ed fi
nanc
ial s
tate
men
ts.
Noo
r Fin
anci
al In
vest
men
t Com
pany
– K
PSC
and
Subs
idia
ries
Cons
olid
ated
Fin
anci
al S
tate
men
ts31
Dec
embe
r 202
0Ku
wai
t
Cons
olid
ated
sta
tem
ent o
f cha
nges
in e
quity
(con
tinue
d) Equi
ty a
ttri
buta
ble
to o
wne
rs o
f the
Par
ent C
ompa
nyTo
tal E
quit
y
Shar
e ca
pita
lSh
are
prem
ium
Trea
sury
sh
ares
Lega
l re
serv
eV
olun
tary
re
serv
e
Cum
ulat
ive
chan
ges
in fa
ir v
alue
Fore
ign
curr
ency
tr
ansl
atio
n re
serv
eRe
tain
ed
earn
ings
Su
b-to
tal
Non
-co
ntro
lling
in
tere
sts
KDKD
KDKD
KDKD
KDKD
KDKD
KD
Bala
nce
as a
t 1 Ja
nuar
y 20
1941
,316
,276
3,41
0,57
3(3
,535
,116
)4,
634,
411
4,63
4,41
1(4
,992
,835
)(2
0,90
9,17
5)30
,417
,331
54,9
75,8
7614
,620
,163
69,5
96,0
39
Dec
reas
e in
non
-con
trol
ling
inte
rest
du
e to
dis
posa
l of s
ubsi
diar
y -
--
--
--
--
(8,4
79,1
34)
(8,4
79,1
34)
Rede
mpt
ion
of
Shar
e ca
pita
l by
no
n-co
ntro
lling
inte
rest
-
--
--
--
--
(16,
431)
(16,
431)
Purc
hase
of T
reas
ury
Shar
es-
-(6
03,2
00)
--
--
-(6
03,2
00)
-(6
03,2
00)
Div
iden
d pa
id t
o no
n-co
ntro
lling
in
tere
sts
by a
sub
sidi
ary
--
--
--
--
-(4
5,63
6)(4
5,63
6)
Div
iden
d pa
id d
urin
g th
e ye
ar
(not
e 26
)-
--
--
--
(2,0
00,2
49)
(2,0
00,2
49)
-(2
,000
,249
)
Oth
er c
hang
es in
non
-con
trol
ling
inte
rest
of s
ubsi
diar
y-
--
--
--
--
(45,
691)
(45,
691)
Tran
sact
ions
wit
h ow
ners
--
(603
,200
)-
--
-(2
,000
,249
)(2
,603
,449
)(8
,586
,892
)(1
1,19
0,34
1)
Profi
t for
the
year
--
--
--
-8,
077,
234
8,07
7,23
484
2,76
88,
920,
002
Oth
er c
ompr
ehen
sive
inco
me/
(loss
) for
the
year
--
--
-6,
408,
988
(2,1
80,8
92)
(59,
730)
4,16
8,36
6(2
40,2
71)
3,92
8,09
5
Tota
l com
preh
ensi
ve in
com
e/(lo
ss)
for t
he y
ear
--
--
-6,
408,
988
(2,1
80,8
92)
8,01
7,50
412
,245
,600
602,
497
12,8
48,0
97
Tran
sfer
to re
serv
es-
--
832,
458
832,
458
--
(1,6
64,9
16)
--
-
Bala
nce
as a
t 31
Dec
embe
r 201
941
,316
,276
3,41
0,57
3(4
,138
,316
)5,
466,
869
5,46
6,86
91,
416,
153
(23,
090,
067)
34,7
69,6
7064
,618
,027
6,63
5,76
871
,253
,795
The
note
s set
out
on
page
s 70
to 1
17 fo
rm a
n in
tegr
al p
art o
f the
se co
nsol
idat
ed fi
nanc
ial s
tate
men
ts.

6968 Annual Report 2020
Noor Financial Investment Company – KPSC and SubsidiariesConsolidated Financial Statements31 December 2020Kuwait
Noor Financial Investment Company – KPSC and SubsidiariesConsolidated Financial Statements31 December 2020Kuwait
Noor Financial Investment Company - KPSC and Subsidiaries
Consolidated statement of cash flows
Note
Year ended 31 Dec.
2020
Year ended31 Dec.
2019
KD KD
OPERATING ACTIVITIES
Profit before Zakat and directors’ remunerations 12,419,466 9,167,350
Adjustments:
Dividend income (803,261) (1,145,524)
Realized gain on disposal / partial disposal of associates - (1,576,423)
Change in fair value of investment properties 872,677 1,150,306
Share of results of associates 17 (14,845,557) (10,769,182)
Net loss recognised on disposal of a subsidiaries - 1,456,681
Interest income and income from Wakala investments (74,403) (68,986)
Reversal of interest expenses on legal case settlement - (813,089)
Reversal of impairment provision on wakala investments (800,000) (200,000)
Depreciation and amortisation 607,883 794,653
Provision for end of service indemnity 279,427 202,650
Finance costs 1,096,766 1,810,452
Impairment in value of accounts receivable 544,178 -
Impairment in value of property and equipment - 530,144
Impairments in value of intangible assets - 945,000
(702,824) 1,484,032
Changes in operating assets and liabilities:
Investments at fair value through profit or loss 4,104,377 7,683
Accounts receivable and other assets (587,823) 722,786
Accounts payable and other liabilities 883,839 (2,127,153)
Inventories (62,561) (17,275)
Cash from operation 3,635,008 70,073
Zakat paid (80,056) (93,468)
Payment of end of service indemnity (68,501) (37,511)
Net cash from/(used in) operating activities 3,486,451 (60,906)
INVESTING ACTIVITIES
Change in short term deposits maturing after 3 Months - (1,250,000)
Change in wakala investments 13 1,000,000 -
Proceeds from redemptions/sale of investments at FVOCI - 72,587
Purchase of investments at FVOCI - (427,040)
Net proceeds from disposal of subsidiaries - 550,046
Dividend received from associates 4,980,065 3,883,480
Dividend received 803,261 1,145,524
Proceeds from disposals/ partial disposal of associates - 7,455,044
Net disposal of property and equipment - 54,370
Proceed from settlement of wakala investment 13 800,000 200,000
Interest income and income from Wakala investments received 74,403 68,986
Net cash from investing activities 7,657,729 11,752,997
The notes set out on pages 70 to 117 form an integral part of these consolidated financial statements.
Consolidated statement of cash flows (continued)
Note
Year ended 31 Dec.
2020
Year ended31 Dec.
2019
KD KD
FINANCING ACTIVITIES
Repayments of borrowings (net) 21 (4,652,646) (10,036,981)
Redemption of units by non-controlling interests of a subsidiary (10,502) (16,431)
Payment to non-controlling interests on reduction of share capital by subsidiaries (14,943) (131,058)
Purchase of treasury shares - (603,200)
Dividend paid by subsidiaries to non-controlling interests (33,992) (99,566)
Dividend paid (2,336,798) (1,854,569)
Finance costs paid (1,098,206) (1,823,448)
Net cash used in financing activities (8,147,087) (14,565,253)
Net increase/(decrease) in cash and cash equivalents 2,997,093 (2,873,162)
Cash and cash equivalents at beginning of the year 6,544,833 9,417,995
Cash and cash equivalents at end of the year 12 9,541,926 6,544,833
Adjustment for non-cash transactions:
- Investment property retained from disposal of subsidiary 7 - 2,890,538
- Settlement of loan from Ultimate Parent Company 17.2 - 3,000,000
- Disposal of investments in associates 17.2 - (3,835,000)
- Proceeds from disposal of subsidiaries 7 - (2,890,538)
- Transfer of investment at FVOCI 17.2 - 168,000
- Transfer of investment property 17.2 - 667,000
The notes set out on pages 70 to 117 form an integral part of these consolidated financial statements.

7170 Annual Report 2020
Noor Financial Investment Company – KPSC and SubsidiariesConsolidated Financial Statements31 December 2020Kuwait
Noor Financial Investment Company – KPSC and SubsidiariesConsolidated Financial Statements31 December 2020Kuwait
Noor Financial Investment Company - KPSC and Subsidiaries
1 Incorporation and activities
Noor Financial Investment Company – KPSC (“the Parent Company”) was incorporated in Kuwait on 1 February 1997 and its shares were listed on the Kuwait Stock Exchange during May 2006. The Parent Company and its subsidiaries are together referred to as “the Group”. The Parent Company is regulated by the Central Bank of Kuwait and also by the Capital Market Authority (CMA), as an investment company and is a subsidiary of National Industries Group Holding KPSC (“the Ultimate Parent Company”).
The principal objectives of the Parent Company are as follows:
- Invest in various economic sectors through establishment of specialized companies or purchase of shares or stakes in those companies;
- Perform the functions of investment trustees and manage all kinds of investment portfolios for third parties;- Facilitate in lending and borrowing transactions for commission or remuneration;- Fund and facilitate in international trade operations;- Conduct research, studies and other technical services related to investment operations and manage funds for third
parties;- Create and manage various investment funds according to the law.- Perform the functions of lead manager for the bonds issued by companies and bodies.- Prepare studies and provide financial advice related to investment for privatization projects;- Carry out all the services and activities that help developing the financial and monetary market in the State of Kuwait;- Trade, by selling and buying, in shares, bonds, Sukuks and other securities listed in Boursa Kuwait and foreign stock
exchanges or unlisted for the Company’s account or the account of its clients for commission or remuneration;- Invest in real estate, industrial and agricultural sectors of the economy in all types of instruments;- Facilitate in selling or buying financial assets and other assets for commission or remuneration;- Provide funding operations to third parties to buy or lease fixed assets and movables through contracts;- Provide technical services for the incorporation of companies and restructuring, merger or disposal of the existing
companies. - Prepare studies and research and provide the necessary consultation in all matters relating to the objectives of the
company.- Acquire industrial property rights, patents, trade and industrial marks, literary and intellectual property rights;- Represent foreign companies, the objectives of which are identical with the objectives of the company in order to market
their products and services in accordance with the relevant Kuwaiti legislation;- To act as an investment controller.
The Parent Company has the right to perform the above-mentioned activities inside and outside the State of Kuwait directly or through an agent. The Parent Company may have an interest or participate in any aspect with the entities performing similar works or which might assist it in the achievement of its objectives in Kuwait or abroad. The Parent Company may also purchase these entities or affiliate them therewith.
Further, the Parent Company may practice works similar or complementary or necessary or related to its above-mentioned objectives and may utilize its surplus funds by investing same in portfolios and funds managed by specialized companies and bodies.
The address of the Parent Company’s registered office is NIG Building, Ground Floor, Shuwaikh, Kuwait (P. O Box 3311, Safat 13034, State of Kuwait).
The Board of Directors of the Parent Company approved these consolidated financial statements for issuance on 17 February 2021. The general assembly of the Parent Company’s shareholders has the power to amend these consolidated financial statements after issuance.
2 Basis of preparation
The consolidated financial statements are prepared under the historical cost convention modified to include the measurement at fair value of investments at fair value through profit or loss, investments at fair value through other comprehensive income and investment properties.
The consolidated financial statements are presented in Kuwaiti Dinars (KD), which is the functional and presentation currency of the Parent Company.
The Group attributes total comprehensive income or loss of subsidiaries between the owners of the parent and the non-controlling interests based on their respective ownership interests.
Notes to the consolidated financial statements
3 Statement of compliance
The consolidated financial statements have been prepared in accordance with the regulations for financial services institutions as issued by the Central Bank of Kuwait (“CBK”) in the State of Kuwait. These regulations require expected credit loss (“ECL”) to be measured at the higher of the ECL on credit facilities computed under IFRS 9 according to the CBK guidelines or the provisions as required by CBK instruction; the consequent impact on related disclosures; and the adoption of all other requirements of International Financial Reporting Standards (“IFRSs”) as issued by the International Accounting Standards Board (“IASB”) (collectively referred to as IFRS, as adopted for use by the State of Kuwait). However as of 31 December 2020 the Parent company and it subsidiaries do not have any credit facilities to third parties.
4 Changes in accounting policies
4.1 New and amended standards adopted by the GroupA number of new and revised standards are effective for annual periods beginning on or after 1 January 2020 which have been adopted by the Group. Information on these new standards is presented below:
Standard or Interpretation Effective for annual periods beginning
IFRS 3 - Amendments 1 January 2020
IAS 1 and IAS 8 - Amendments 1 January 2020
IFRS 16 – Amendments – Covid 19 Rent Related Concessions 1 June 2020
IFRS 3 – AmendmentsThe Amendments to IFRS 3 Business Combinations are changes to Appendix A defined terms, the application guidance, and the illustrative examples of IFRS 3 only with respect to definition of business. The amendments:
• clarify that to be considered a business, an acquired set of activities and assets must include, at a minimum, an input and a substantive process that together significantly contribute to the ability to create outputs;
• narrow the definitions of a business and of outputs by focusing on goods and services provided to customers and by removing the reference to an ability to reduce costs;
• add guidance and illustrative examples to help entities assess whether a substantive process has been acquired; • remove the assessment of whether market participants are capable of replacing any missing inputs or processes and
continuing to produce outputs; and• add an optional concentration test that permits a simplified assessment of whether an acquired set of activities and assets
is not a business
The application of the amendments did not have a significant impact on the Group’s consolidated financial statements.
IAS 1 and IAS 8 – AmendmentsThe amendments to IAS 1 and IAS 8 clarify the definition of ‘material’ and align the definition used in the Conceptual Framework and the standards. The threshold for materiality influencing users has been changed from ‘could influence’ to ‘could reasonably be expected to influence’.
The application of the amendments did not have a significant impact on the Group’s consolidated financial statements.
Several other amendments and interpretations apply for the first time in 2020, but do not have a material impact on the consolidated financial statements of the Group.
The Group has not early adopted any other standard, interpretation or amendment that has been issued but is not yet effective.
IFRS 16 – Amendments- COVID19 Rent Related ConcessionsIFRS 16 contains specific requirements when accounting for changes to lease payments and rent concessions are in the scope of these requirements. Lessees are required to assess whether rent concessions are lease modifications, and if they are, there is specific accounting to be applied. However, applying these requirements to potentially a significant number of leases could be difficult, particularly from a practical perspective due to pressures resulting from the pandemic.
The practical expedient allows lessees to elect to not carry out an assessment to decide whether a COVID-19-related rent concession received is a lease modification. The lessee is permitted to account for the rent concession as if the change is not a lease modification.
Notes to the consolidated financial statements

7372 Annual Report 2020
Noor Financial Investment Company – KPSC and SubsidiariesConsolidated Financial Statements31 December 2020Kuwait
Noor Financial Investment Company – KPSC and SubsidiariesConsolidated Financial Statements31 December 2020Kuwait
Noor Financial Investment Company - KPSC and Subsidiaries
The practical expedient is only applicable to rent concessions provided as a direct result of the COVID-19 pandemic. The relief is only for lessees that are granted these rent concessions. There are no changes for lessors.
All of the following conditions need to be met: • The rent concession provides relief to payments that overall results in the consideration for the lease contract being
substantially the same or less than the original consideration for the lease immediately before the concession was provided.
• The rent concession is for relief for payments that were originally due on or before 30 June 2021. So payments included are those required to be reduced on or before 30 June 2021, but subsequent rental increases of amounts deferred can go beyond 30 June 2021.
• There are no other substantive changes to the other terms and conditions of the lease
The application of the amendments did not have a significant impact on the Group’s consolidated financial statements.
4.2 IASB Standards issued but not yet effectiveAt the date of authorisation of this consolidated financial statements, certain new standards, amendments and interpretations to existing standards have been published by the IASB but are not yet effective, and have not been adopted early by the Group.
Management anticipates that all of the relevant pronouncements will be adopted in the Group’s accounting policies for the first period beginning after the effective date of the pronouncements. Information on new standards, amendments and interpretations that are expected to be relevant to the Group’s consolidated financial statements is provided below. Certain other new standards and interpretations have been issued but are not expected to have a material impact on the Group’s consolidated financial information.
Standard or Interpretation Effective for annual periods beginning
IFRS 10 and IAS 28 Sale or Contribution of Assets between an Investor and its Associate or Joint Venture - Amendments No stated date
IAS 16 – Amendments – Proceeds before intended use 1 January 2022
IAS 37 – Amendments – Onerous contracts -Cost of fulfilling a contract 1 January 2022
Annual Improvements 2018-2020 Cycle 1 January 2022
IAS 1 – Amendments – Classification of current or non-current 1 January 2023
IFRS 10 and IAS 28 Sale or Contribution of Assets between and an Investor and its Associate or Joint Venture - AmendmentsThe Amendments to IFRS 10 Consolidated Financial Statements and IAS 28 Investments in Associates and Joint Ventures (2011) clarify the treatment of the sale or contribution of assets from an investor to its associate or joint venture, as follows:
• require full recognition in the investor’s financial statements of gains and losses arising on the sale or contribution of assets that constitute a business (as defined in IFRS 3 Business Combinations)
• require the partial recognition of gains and losses where the assets do not constitute a business, i.e. a gain or loss is recognised only to the extent of the unrelated investors’ interests in that associate or joint venture.
These requirements apply regardless of the legal form of the transaction, e.g. whether the sale or contribution of assets occurs by an investor transferring shares in a subsidiary that holds the assets (resulting in loss of control of the subsidiary), or by the direct sale of the assets themselves.
IASB has postponed the effective date indefinitely until other projects are completed. However, early implementation is allowed. Management anticipates that the application of these amendments may have an impact on the Group’s consolidated financial statements in future should such transactions arise.
IAS 16 Amendments - Proceeds before intended useThe amendment prohibits an entity from deducting from the cost of property, plant and equipment amounts received from selling items produced while the entity is preparing the asset for its intended use. Instead, an entity will recognise such sales proceeds and related cost in profit or loss.
Management does not anticipate that the adoption of the amendment in the future will have a significant impact on the Group’s consolidated financial statements.
IAS 37 Amendments – Onerous contracts- Cost of fulfilling a contractThe amendments specify which costs an entity includes when assessing whether a contract will be loss-making.
Notes to the consolidated financial statements
The amendments clarify that for the purpose of assessing whether a contract is onerous, the cost of fulfilling the contract includes both the incremental costs of fulfilling that contract and an allocation of other costs that relate directly to fulfilling contracts.
The amendments are only to be applied to contracts for which an entity has not yet fulfilled all of its obligations at the beginning of the annual period in which it first applies the amendments.
Management does not anticipate that the adoption of the amendment in the future will have a significant impact on the Group’s consolidated financial statements.
Annual Improvements 2018-2020 CycleAmendment to IAS 1 simplifies the application of IFRS 1 by a subsidiary that becomes a first-time adopter after its parent in relation to the measurement of cumulative translation differences. Subsidiary that is a first-time adopter later than its parent might have been required to keep two parallel sets of accounting records for cumulative translation differences based on different dates of transition to IFRSs. However, the amendment extends the exemption to cumulative translation differences to reduce costs for first-time adopters.
Amendment to IFRS 9 relates to the ‘10 per cent’ Test for Derecognition of Financial Liabilities – In determining whether to derecognise a financial liability that has been modified or exchanged, an entity assesses whether the terms are substantially different. The amendment clarifies the fees that an entity includes when assessing whether the terms of a new or modified financial liability are substantially different from the terms of the original financial liability.
Taxation in fair value measurements – Before this amendment, when an entity used a discounted cash flow technique to determine the fair value applying IAS 41, IAS 41.22 required the entity to exclude taxation cash flows from the calculation. The amendment to IAS 41 removed from this requirement to exclude taxation cash flows when measuring fair value. This amendment aligned the requirements in IAS 41 on fair value measurement with those in other IFRS Standards.
Management does not anticipate that the adoption of the amendments in the future will have a significant impact on the Group’s consolidated financial statements.
IAS 1 Amendments - Classification of current or non-currentThe amendments to IAS 1 clarify the classification of a liability as either current or non-current is based on the entity’s rights at the end of the reporting period. Stating management expectations around whether they will defer settlement or not does not impact the classification of the liability. It has added guidance about lending conditions and how these can impact classification and has included requirements for liabilities that can be settled using an entity’s own instruments.
5 Summary of significant accounting policies
The significant accounting policies and measurement basis adopted in the preparation of the consolidated financial statements are summarised below:
5.1 Basis of consolidationThe consolidated financial statements comprise financial statements of the Parent Company and all of its subsidiaries. Subsidiaries are all entities (including structured entities) over which the Group has control. The Group controls an entity when the Group is exposed to, or has rights to, variable returns from its involvement with the entity and has the ability to affect those returns through its power over the entity. All subsidiaries have a reporting date of 31 December. The details of the significant subsidiaries are set out in Note 7 to the consolidated financial statements.
All transactions and balances between Group companies are eliminated on consolidation, including unrealised gains and losses on transactions between Group companies. Where unrealised losses on intra-group asset sales are reversed on consolidation, the underlying asset is also tested for impairment from a Group perspective.
Amounts reported in the financial statements of subsidiaries have been adjusted where necessary to ensure consistency with the accounting policies adopted by the Group.
Consolidation of a subsidiary begins when the Group obtains control over the subsidiary and ceases when the Group loses control of the subsidiary. Profit or loss and other comprehensive income of subsidiaries acquired or disposed of during the year are recognised from the date the Group gains control, or until the date the Group ceases to control the subsidiary as applicable.
Non-controlling interests, presented as part of equity, represent the portion of a subsidiary’s profit or loss and net assets that is not held by the Group.
Notes to the consolidated financial statements

7574 Annual Report 2020
Noor Financial Investment Company – KPSC and SubsidiariesConsolidated Financial Statements31 December 2020Kuwait
Noor Financial Investment Company – KPSC and SubsidiariesConsolidated Financial Statements31 December 2020Kuwait
Noor Financial Investment Company - KPSC and Subsidiaries
The Group attributes total comprehensive income or loss of subsidiaries between the owners of the parent and the non-controlling interests based on their respective ownership interests. Losses of subsidiary are attributed to the non-controlling interests even if that results in a deficit balance.
A change in the ownership interest of a subsidiary, without a loss of control, is accounted for as an equity transaction. If the Group loses control over a subsidiary, it:
• Derecognizes the assets (including goodwill) and liabilities of the subsidiary;• Derecognizes the carrying amount of any non-controlling interests;• Derecognizes the cumulative translation differences, recorded in consolidated statement of changes in equity;• Recognizes the fair value of the consideration received;• Recognizes the fair value of any investment retained;• Recognizes any surplus or deficit in consolidated statement of profit or loss;• Reclassifies the parent’s share of components previously recognized in consolidated statement of profit or loss and
other comprehensive income to consolidated statement of profit or loss or retained earnings, as appropriate, as would be required if the Group has directly disposed of the related assets or liabilities.
5.2 Business combinations The Group applies the acquisition method in accounting for business combinations. The consideration transferred by the Group to obtain control of a subsidiary is calculated as the sum of the acquisition-date fair values of assets transferred, liabilities incurred and the equity interests issued by the Group, which includes the fair value of any asset or liability arising from a contingent consideration arrangement. Acquisition costs are expensed as incurred. For each business combination, the acquirer measures the non-controlling interests in the acquiree either at fair value or at the proportionate share of the acquiree’s identifiable net assets.
If the business combination is achieved in stages, the acquisition date fair value of the acquirer’s previously held equity interest in the acquiree is remeasured to fair value at the acquisition date through consolidated statement of profit or loss.
The Group recognises identifiable assets acquired and liabilities assumed in a business combination regardless of whether they have been previously recognised in the acquiree’s financial statements prior to the acquisition. Assets acquired and liabilities assumed are generally measured at their acquisition-date fair values.
When the Group acquires a business, it assesses the financial assets and liabilities assumed for appropriate classification and designation in accordance with the contractual terms, economic circumstances and pertinent conditions as at the acquisition date. This includes the separation of embedded derivatives in host contracts by the acquiree.
Goodwill is stated after separate recognition of identifiable intangible assets. It is calculated as the excess of the sum of a) fair value of consideration transferred, b) the recognised amount of any non-controlling interest in the acquiree and c) acquisition-date fair value of any existing equity interest in the acquiree, over the acquisition-date fair values of identifiable net assets. If the fair values of identifiable net assets exceed the sum calculated above, the excess amount (i.e. gain on a bargain purchase) is recognised in the consolidated statement of profit or loss immediately.
5.3 GoodwillGoodwill represents the future economic benefits arising from a business combination that are not individually identified and separately recognised. See note 5.2 for information on how goodwill is initially determined. Goodwill is carried at cost less accumulated impairment losses. Refer to note 5.14 for a description of impairment testing procedures.
5.4 Investment in associatesAssociates are those entities over which the Group is able to exert significant influence but which are neither subsidiaries nor joint ventures. Investments in associates are initially recognised at cost and subsequently accounted for using the equity method. Any goodwill or fair value adjustment attributable to the Group’s share in the associate is not recognised separately and is included in the amount recognised as investment in associates.
Under the equity method, the carrying amount of the investment in associates is increased or decreased to recognise the Group’s share of the profit or loss and other comprehensive income of the associate, adjusted where necessary to ensure consistency with the accounting policies of the Group.
Unrealised gains and losses on transactions between the Group and its associates and joint ventures are eliminated to the extent of the Group’s interest in those entities. Where unrealised losses are eliminated, the underlying asset is also tested for impairment.
The share of results of an associate is shown on the face of the consolidated statement of profit or loss. This is the profit attributable to equity holders of the associate and therefore is profit after tax and non-controlling interests in the subsidiaries of the associate.
Notes to the consolidated financial statements
The financial statements of the associates are prepared either to the reporting date of the Parent Company or to a date not earlier than three months of the Parent Company’s reporting date, using consistent accounting policies. Adjustments are made for the effects of significant transactions or events that occur between that date and the date of the Group’s consolidated financial statements.
After application of the equity method, the Group determines whether it is necessary to recognise an additional impairment loss on the Group’s investment in its associate. The Group determines at each reporting date whether there is any objective evidence that the investment in the associate is impaired. If this is the case the Group calculates the amount of impairment as the difference between the recoverable amount of the associate and its carrying value and recognises the amount under separate heading in the consolidated statement of profit or loss.
Upon loss of significant influence over the associate, the Group measures and recognises any retained investment at its fair value. Any differences between the carrying amount of the associate upon loss of significant influence and the fair value of the retained investment and proceeds from disposal are recognised in the consolidated statement of profit or loss.
However, when the Group reduces its ownership interest in an associate or a joint venture but the Group continues to use the equity method, the Group reclassifies to profit or loss the proportion of the gain or loss that had previously been recognised in other comprehensive income relating to that reduction in ownership interest if that gain or loss would be reclassified to profit or loss on the disposal of the related assets or liabilities.
5.5 Segment reporting The Group has four operating segments: Investments, Real Estate, IT services and Hotel Operations. In identifying these operating segments, management generally follows the Group’s service lines representing its main products and services. Each of these operating segments is managed separately as each requires different approaches and other resources.
For management purposes, the Group uses the same measurement policies as those used in its consolidated financial statements. In addition, assets or liabilities which are not directly attributable to the business activities of any operating segment are not allocated to a segment.
5.6 RevenueThe Group recognises revenue from the following major sources:
• Rendering of services including fee income earned from services that are provided over a certain period of time and fee income from providing transaction services
• Rental of investment properties • Interest on deposits• Dividend income• Revenue from hotel operations• Revenue from IT services
Revenue is measured based on the consideration to which the Group expects to be entitled in a contract with a customer and excludes amounts collected on behalf of third parties. The Group recognises revenue when it transfers control of a product or service to a customer. The Group follows a 5-step process:
1. Identifying the contract with a customer2. Identifying the performance obligations3. Determining the transaction price4. Allocating the transaction price to the performance obligations5. Recognising revenue when/as performance obligation(s) are satisfied.
The total transaction price for a contract is allocated amongst the various performance obligations based on their relative stand-alone selling prices. The transaction price for a contract excludes any amounts collected on behalf of third parties.
Revenue is recognised either at a point in time or over time, when (or as) the Group satisfies performance obligations by transferring the promised goods or services to its customers.
5.6.1 Rendering of servicesThe Group earns fees and commission income from a diverse range of asset management, investment banking, custody and brokerage services provided to its customers. Fee income can be divided into the following two categories:
• Fee income earned from services that are provided over a certain period of timeFees earned for the provision of services over a period of time are accrued over that period. These fees include commission income and asset management, custody and other management fees.
Notes to the consolidated financial statements

7776 Annual Report 2020
Noor Financial Investment Company – KPSC and SubsidiariesConsolidated Financial Statements31 December 2020Kuwait
Noor Financial Investment Company – KPSC and SubsidiariesConsolidated Financial Statements31 December 2020Kuwait
Noor Financial Investment Company - KPSC and Subsidiaries
• Fee income from providing transaction servicesFees arising for rendering specific advisory services, brokerage services, equity and debt placement transactions for a third party or arising from negotiating or participating in the negotiation of a transaction for a third party are recognised on completion of the underlying transaction.
5.6.2 Rental income The Group earns rental income from operating leases of its investment properties (refer note 5.9).
5.6.3 Interest incomeInterest income is recognised on a time proportion basis using effective interest method.
5.6.4 Gain/(loss) from sale of investment propertiesGain/(loss) from sale of investment properties is recognised at the point in time when control of the assets is transferred to the purchaser.
5.6.5 Dividend incomeDividend income, other than those from investments in associates, is recognised at the time the right to receive payment is established.
5.6.6 Revenue from hotel operationsRevenue from hotel operations includes hotel services revenue, food and beverage and room revenue.
Room revenue is recognised on the rooms occupied on a daily basis and food and beverage and other related sales are accounted for at the time of sale and other related services are recognised on the performance of the service.
5.6.7 Revenue from IT servicesRevenue from IT services represent IT related services and sale of IT related products. Revenue from these services is recognised as service is rendered. Customers are invoiced periodically in accordance with individual contracts as service provided. Any amounts remaining unbilled at the end of a reporting period are presented in the statement of financial position as accounts receivable as only the passage of time is required before payment of these amounts will be due.
5.7 Operating expensesOperating expenses are recognised in consolidated statement of profit or loss upon utilisation of the service or at the date of their origin.
5.8 Borrowing costsBorrowing costs directly attributable to the acquisition, construction or production of a qualifying asset are capitalised during the period of time that is necessary to complete and prepare the asset for its intended use or sale. Other borrowing costs are expensed in the period in which they are incurred and reported in finance costs.
5.9 Leases assetsThe Group as a lessee For any new contracts entered into on or after 1 January 2020, the Group considers whether a contract is, or contains a lease. A lease is defined as ‘a contract, or part of a contract, that conveys the right to use an asset (the underlying asset) for a period of time in exchange for consideration’.
To apply this definition the Group assesses whether the contract meets three key evaluations which are whether:
• the contract contains an identified asset, which is either explicitly identified in the contract or implicitly specified by being identified at the time the asset is made available to the Group
• the Group has the right to obtain substantially all of the economic benefits from use of the identified asset throughout the period of use, considering its rights within the defined scope of the contract
• the Group has the right to direct the use of the identified asset throughout the period of use. The Group assess whether it has the right to direct ‘how and for what purpose’ the asset is used throughout the period of use.
The Group has elected to account for short-term leases and leases of low-value assets using the practical expedients. Instead of recognising a right-of-use asset and lease liability, the payments in relation to these are recognised as an expense in profit or loss on a straight-line basis over the lease term.
Measurement and recognition of leases as a lessee At lease commencement date, the Group recognises a right-of-use asset and a lease liability on the consolidated statement of financial position as follows:
Notes to the consolidated financial statements
Right-of-use assetThe right-of-use asset is measured at cost, which is made up of the initial measurement of the lease liability, any initial direct costs incurred by the Group, an estimate of any costs to dismantle and remove the asset at the end of the lease, and any lease payments made in advance of the lease commencement date (net of any incentives received).
Subsequent to initial measurement, the Group depreciates the right-of-use assets on a straight-line basis from the lease commencement date to the earlier of the end of the useful life of the right-of-use asset or the end of the lease term. The Group also assesses the right-of-use asset for impairment when such indicators exist.
Lease liabilityAt the commencement date, the Group measures the lease liability at the present value of the lease payments unpaid at that date, discounted using the interest rate implicit in the lease if that rate is readily available or the Group’s incremental borrowing rate.
Lease payments included in the measurement of the lease liability are made up of fixed payments (including in substance fixed), variable payments based on an index or rate, amounts expected to be payable under a residual value guarantee and payments arising from options reasonably certain to be exercised.
Subsequent to initial measurement, the liability is reduced for payments made and increased for interest. It is remeasured to reflect any reassessment or modification, or if there are changes in in-substance fixed payments. When the lease liability is remeasured, the corresponding adjustment is reflected in the right-of-use asset, or profit and loss if the right-of-use asset is already reduced to zero.
The Group as a lessor The Group enters into lease agreements as a lessor with respect to some of its investment properties. The Group classifies its leases as either operating or finance leases. When the terms of a lease transfer substantially all the risks and rewards of ownership to the lessee, the contract is classified as finance lease. All other leases are classified as operating leases.
When the Group is an intermediate lessor, it accounts for the head-lease and sub-lease as two separate contacts. The sub-lease is classified as finance lease or operating lease by reference to the right-of-use of asset arising from the head-lease.,
Rental income from operating leases is recognised on a straight-line basis over lease term. Initial direct cost incurred in arranging and negotiating a lease are added to the carrying amount of the lease assets and recognised on a straight-line basis over the lease term.
Amounts due under finance leases are recognised as receivables. Finance lease income is allocated to the accounting periods so as to reflect a constant periodic rate of return on the Group’s net investment outstanding for the finance lease.
5.10 Property and equipmentProperty and equipment are stated at cost less accumulated depreciation and any impairment in value. The Group depreciates its equipment using the straight-line method at rates sufficient to write off the assets over their estimated useful economic lives. The residual value, useful lives and methods of depreciation are reviewed, and adjusted if appropriate at each financial year end.
5.11 Intangible assetsIdentifiable non-monetary assets acquired in a business combination and from which future benefits are expected to flow are treated as intangible assets.
Intangible assets which have a finite life are amortized over their useful lives. Intangible assets of the Group comprise of Indefeasible Rights of Use (IRU).
IRU are the rights to use a portion of the capacity of a terrestrial or submarine transmission cable granted for a fixed period. IRUs are recognised at cost as an asset when the Group has the specific indefeasible right to use an identified portion of the underlying asset, generally optical fibres or dedicated wave length bandwidth and the duration of the right is for the major part of the underlying asset’s economic life. They are amortised on a straight-line basis over the shorter of the expected period of use and the life of the contract which ranges between 10 to 15 years.
5.12 Investment propertiesInvestment properties are properties held to earn rentals and/or for capital appreciation, and are accounted for using the fair value model.
Investment properties are initially measured at cost, including transaction costs. Subsequently, investment properties are re-measured at fair value on an individual basis based on valuations by independent real estate valuators and are included in the consolidated statement of financial position.
Notes to the consolidated financial statements
7978 Annual Report 2020
Noor Financial Investment Company – KPSC and SubsidiariesConsolidated Financial Statements31 December 2020Kuwait
Noor Financial Investment Company – KPSC and SubsidiariesConsolidated Financial Statements31 December 2020Kuwait
Noor Financial Investment Company - KPSC and Subsidiaries
Changes in fair value are taken to the consolidated statement of profit or loss.Investment properties are de-recognised when either they have been disposed or when the investment property is permanently withdrawn from use and no future economic benefit is expected from its disposal. Any gains or losses on the retirement or disposal of an investment property are recognised in the consolidated statement of profit or loss in the year of retirement or disposal.
Transfers are made to or from investment property only when there is a change in use. For a transfer from investment property to owner-occupied property, the deemed cost for subsequent accounting is the fair value at the date of change in use. If owner-occupied property becomes an investment property, the Group accounts for such property in accordance with the policy stated under property and equipment up to the date of change in use.
5.13 Investment in joint operations (jointly controlled investment properties and borrowings)Investment in jointly controlled operations are accounted for under the method of proportionate consolidation whereby the Group recognises its interest in assets, liabilities, income and expenses relating to the assets on a line-by-line basis and classified according to their nature.
5.14 Impairment testing of goodwill and non- financial assetsFor impairment assessment purposes, assets are grouped at the lowest levels for which there are largely independent cash inflows (cash generating units). As a result, some assets are tested individually for impairment and some are tested at cash-generating unit level. Goodwill is allocated to those cash-generating units that are expected to benefit from synergies of the related business combination and represent the lowest level within the Group at which management monitors goodwill.
Cash-generating units to which goodwill has been allocated (determined by the Group’s management as equivalent to its operating segments) are tested for impairment at least annually.
All other individual assets or cash-generating units are tested for impairment whenever events or changes in circumstances indicate that the carrying amount may not be recoverable.
An impairment loss is recognised for the amount by which the asset’s or cash-generating unit’s carrying amount exceeds its recoverable amount, which is the higher of fair value less costs to sell and value-in-use. To determine the value-in-use, management estimates expected future cash flows from the asset or each cash-generating unit and determines a suitable interest rate in order to calculate the present value of those cash flows. The data used for impairment testing procedures are directly linked to the Group’s latest approved budget, adjusted as necessary to exclude the effect of future reorganisations and assets enhancements. Discount factors are determined individually for each asset or cash-generating unit and reflect management’s assessment of respective risk profiles, such as market and asset-specific risk factors.
Impairment losses for cash-generating units reduce first the carrying amount of any goodwill allocated to that cash-generating unit. Any remaining impairment loss is charged pro rata to the other assets in the cash-generating unit. With the exception of goodwill, all assets are subsequently reassessed for indications that an impairment loss previously recognised may no longer exist. An impairment charge is reversed if the cash-generating unit’s recoverable amount exceeds its carrying amount.
5.15 Financial instruments 5.15.1 Recognition, initial measurement and derecognitionFinancial assets and financial liabilities are recognised when the Group becomes a party to the contractual provisions of the financial instrument and are measured initially at fair value adjusted by transactions costs, except for those carried at fair value through profit or loss which are measured initially at fair value. Subsequent measurement of financial assets and financial liabilities are described below.
All ‘regular way’ purchases and sales of financial assets are recognised on the trade date i.e. the date that the entity commits to purchase or sell the asset. Regular way purchases or sales are purchases or sales of financial assets that require delivery of assets within the time frame generally established by regulation or convention in the market place.
A financial asset (or, where applicable a part of financial asset or part of group of similar financial assets) is derecognised when:
• rights to receive cash flows from the assets have expired; • the Group has transferred its rights to receive cash flows from the asset or has assumed an obligation to pay the received
cash flows in full without material delay to a third party under a ‘pass through’ arrangement; and either
(a) the Group has transferred substantially all the risks and rewards of the asset; or (b) the Group has neither transferred nor retained substantially all risks and rewards of the asset, but has transferred
control of the asset.
Notes to the consolidated financial statements
When the Group has transferred its rights to receive cash flows from an asset or has entered into a pass- through arrangement, it evaluates if and to what extent it has retained the risks and rewards of ownership. When it has neither transferred nor retained substantially all the risks and rewards of the asset, nor transferred control of the asset, the Group continues to recognise the transferred asset to the extent of the Group’s continuing involvement. In that case, the Group also recognises an associated liability. The transferred asset and the associated liability are measured on a basis that reflects the rights and obligations that the Group has retained.
A financial liability is derecognised when the obligation under the liability is discharged or cancelled or expires. When an existing financial liability is replaced by another from the same lender on substantially different terms, or the terms of an existing liability are substantially modified, such an exchange or modification is treated as a de-recognition of the original liability and the recognition of a new liability, and the difference in the respective carrying amounts is recognised in the consolidated statement of profit or loss.
5.15.2 Classification of financial assetsFor the purpose of subsequent measurement, financial assets are classified into the following categories upon initial recognition:
• financial assets at amortised cost• financial assets at fair value through other comprehensive income (FVOCI)• financial assets at fair value through profit or loss (FVTPL)
The classification is determined by both:
• the entity’s business model for managing the financial asset• the contractual cash flow characteristics of the financial asset.
The Group may make the following irrevocable election/designation at initial recognition of a financial asset:
• the Group may irrevocably elect to present subsequent changes in fair value of an equity investment in other comprehensive income if certain criteria are met (note 5.15.3); and
• the Group may irrevocably designate a debt investment that meets the amortised cost or FVOCI criteria as measured at FVTPL if doing so eliminates or significantly reduces an accounting mismatch. No such designation has been made.
5.15.3 Subsequent measurement of financial assets
Financial assets at amortised costFinancial assets are measured at amortised cost if the assets meet the following conditions (and are not designated as FVTPL):
• they are held within a business model whose objective is to hold the financial assets and collect its contractual cash flows• the contractual terms of the financial assets give rise to cash flows that are solely payments of principal and interest on
the principal amount outstanding
After initial recognition, these are measured at amortised cost using the effective interest rate method, less provision for impairment. Discounting is omitted where the effect of discounting is immaterial.
The Group’s financial assets at amortised cost comprise of the following:
- Cash and cash equivalentsCash and cash equivalents comprise cash on hand, balances with banks and other financial institutions and short-term deposits due within three months which are subject to an insignificant risk of changes in value.
• Cash and bank balances and short-term depositsCash on hand and demand deposits are classified under cash and bank balances and deposits placed with financial institutions with a maturity of less than one year are classified as short-term deposits.
• Murabaha investments/receivablesMurabaha is an Islamic transaction involving the purchase and immediate sale of an asset at cost plus an agreed profit. The amount due is settled on a deferred payment basis.
When the credit risk of the transaction is attributable to a financial institution, the amount due under Murabaha contracts is classified as a Murabaha investment. Whereas, when the credit risk of transaction is attributable to counterparties other than banks and financial institutions, the amount due is classified as Murabaha receivable.
Notes to the consolidated financial statements

8180 Annual Report 2020
Noor Financial Investment Company – KPSC and SubsidiariesConsolidated Financial Statements31 December 2020Kuwait
Noor Financial Investment Company – KPSC and SubsidiariesConsolidated Financial Statements31 December 2020Kuwait
Noor Financial Investment Company - KPSC and Subsidiaries
Murabaha receivables which arise from the Group’s financing of long-term transactions on an Islamic basis are classified as Murabaha receivables originated by the Group and are carried at the principal amount less provision for credit risks to meet any decline in value. Third party expenses such as legal fees, incurred in granting a Murabaha are treated as part of the cost of the transaction.
All Murabaha receivables are recognized when the legal right to control the use of the underlying asset is transferred to the customer.
• Wakala investmentsWakala is an agreement whereby the Group provides a sum of money to a financial institution under an agency arrangement, who invests it according to specific conditions in return for a fee. The agent is obliged to return the amount in case of default, negligence or violation of any terms and conditions of the Wakala.
• Receivables and other financial assetsTrade receivables are stated at original invoice amount less allowance for impairment.
Receivables which are not categorised under any of the above are classified as “other receivables/other assets”.
Financial assets at FVOCIThe Group’s financial assets at FVOCI comprise of investments in equity shares: These represent investments in equity shares of various companies and include both quoted and unquoted.
Debt instruments at FVOCIThe Group accounts for debt instruments at FVOCI if the assets meet the following conditions:
• they are held under a business model whose objective it is “hold to collect” the associated cash flows and sell; and• the contractual terms of the financial assets give rise to cash flows that are solely payments of principal and interest on
the principal amount outstanding.
Any gains or losses recognised in other comprehensive income (OCI) will be recycled to the consolidated statement of profit or loss upon derecognition of the asset.
Equity investments at FVOCIOn initial recognition, the Group may make an irrevocable election (on an instrument-by-instrument basis) to designate investments in equity instruments as at FVOCI. Designation at FVOCI is not permitted if the equity investment is held for trading or if it is contingent consideration recognised by an acquirer in a businesscombination.
A financial asset is held for trading if:
• it has been acquired principally for the purpose of selling it in the near term; or• on initial recognition it is part of a portfolio of identified financial instruments that the Group manages together and has
evidence of a recent actual pattern of short-term profit-taking; or• it is a derivative (except for a derivative that is a financial guarantee contract or a designated and effective hedging
instrument).
Investments in equity instruments at FVOCI are initially measured at fair value plus transaction costs.
Subsequently, they are measured at fair value with gains and losses arising from changes in fair value recognisedin other comprehensive income and accumulated in the fair value reserve. The cumulative gain or loss is transferred to retained earnings within the consolidated statement of changes in equity.
Dividends on these investments in equity instruments are recognised in the consolidated statement of profit or loss.
Financial assets at FVTPL Financial assets that do not meet the criteria for measurement at amortised cost or FVOCI are categorised at fair value through profit and loss. Further, irrespective of business model financial assets whose contractual cash flows are not solely payments of principal and interest are accounted for at FVTPL. All derivative financial instruments fall into this category, except for those designated and effective as hedging instruments, for which the hedge accounting requirements apply (see below). The category also contains investments in equity shares.
Assets in this category are measured at fair value with gains or losses recognised in consolidated statement of profit or loss. The fair values of financial assets in this category are determined by reference to active market transactions or using a valuation technique where no active market exists.
Notes to the consolidated financial statements
The Group’s financial assets at FVTPL comprise of the investment in equity shares and funds.
5.15.4 Impairment of financial assetsThe Group computes expected credit losses (ECL) on the following financial instruments that are not measured at fair value through profit or loss:
• Loan to customers• Bank balances and short-term deposits• Wakala investments• Other financial assets
Equity instruments are not subject to Expected Credit Losses.
Impairment of credit facilities (loans to customers)Impairment on credit facilities is recognised in the consolidated statement of financial position at an amount equal to the higher of ECL under IFRS 9 according to the CBK guidelines, and the provisions required by the CBK instructions.
Impairment of financial assets other than credit facilities The Group recognises ECL on investment in debt instruments measured at amortised cost or FVOCI and on balances and deposits with banks and other assets.
Expected Credit LossesThe Group applies three-stage approach to measuring expected credit losses (ECL) as follows:
Stage 1: 12 months ECL The Group measures loss allowances at an amount equal to 12-month ECL on financial assets where there has not been significant increase in credit risk since their initial recognition or on exposures that are determined to have a low credit risk at the reporting date. The Group considers a financial asset to have low credit risk when its credit risk rating is equivalent to the globally understood definition of ‘investment grade’.
Stage 2: Lifetime ECL – not credit impaired The Group measures loss allowances at an amount equal to lifetime ECL on financial assets where there has been a significant increase in credit risk since initial recognition but are not credit impaired.
Stage 3: Lifetime ECL – credit impaired The Group measures loss allowances at an amount equal to lifetime ECL on financial assets that are determined to be credit impaired based on objective evidence of impairment.
Life time ECL is ECL that result from all possible default events over the expected life of a financial instrument. The 12-month ECL is the portion of life time expected credit loss that result from default events that are possible within the 12 months after the reporting date. Both life time ECLs and 12-month ECLs are calculated on either an individual basis or a collective basis depending on the nature of the underlying portfolio of financial instruments.
Determining the stage of impairmentAt each reporting date, the Group assesses whether a financial asset or group of financial assets is credit impaired. The Group considers a financial asset to be credit impaired when one or more events that have a detrimental impact on the estimated future cash flows of the financial asset have occurred or when contractual payments are 90 days past due.
At each reporting date, the Group also assesses whether there has been significant increase in credit risk since initial recognition by comparing the risk of default occurring over the remaining expected life from the reporting date with the risk of default at the date of initial recognition. The quantitative criteria used to determine a significant increase in credit risk is a series of relative and absolute thresholds. All financial assets that are 30 days past due are deemed to have significant increase in credit risk since initial recognition and migrated to stage 2 even if other criteria do not indicate a significant increase in credit risk.
Measurement of ECLsECLs are probability weighted estimates of credit losses and are measured as the present value of all cash shortfalls discounted at the effective interest rate of the financial instrument. Cash shortfall represent the difference between cash flows due to the Group in accordance with the contract and the cash flows that the Group expects to receive. The key elements in the measurement of ECL include probability of default (PD), loss given default (LGD) and exposure at default (EAD). The Group estimates these elements using appropriate credit risk models taking into consideration the internal and external credit ratings of the assets, nature and value of collaterals, forward looking macro-economic scenarios etc.
Notes to the consolidated financial statements

8382 Annual Report 2020
Noor Financial Investment Company – KPSC and SubsidiariesConsolidated Financial Statements31 December 2020Kuwait
Noor Financial Investment Company – KPSC and SubsidiariesConsolidated Financial Statements31 December 2020Kuwait
Noor Financial Investment Company - KPSC and Subsidiaries
The Group has applied simplified approach to impairment for trade receivables and other assets as permitted under the standard. The Group has established a provision matrix that is based on the Group’s historical credit loss experience, adjusted for forward-looking factors specific to the debtors and the economic environment.
Provision for credit losses in accordance with CBK instructions The Group is required to calculate provisions for credit losses on finance credit facilities in accordance with the instructions of CBK on the classification of credit facilities and calculation of provisions. Credit facilities are classified as past due when a payment has not been received on its contractual payment date or if the facility is in excess of pre-approved limits. A credit facility is classified as past due and impaired when the instalment or a principal instalment is past due for more than 90 days and if the carrying amount of the facility is greater than its estimated recoverable value. Past due and past due and impaired loans are managed and monitored as irregular facilities and are classified into the following four categories which are then used to determine the provisions.
Category Criteria Specific provisions
Watch list Irregular for a period of 90 days -
Substandard Irregular for a period of 91- 180 days 20%
Doubtful Irregular for a period of 181- 365 days 50%
Bad Irregular for a period exceeding 365 days 100%
The Group may also include a credit facility in one of the above categories based on management’s judgement of a customer’s financial and/or non-financial circumstances.
In addition to specific provisions, minimum general provisions of 1% on cash facilities and 0.5% on non-cash facilities are made on all applicable credit facilities (net of certain restricted categories of collateral) which are not subject to specific provisioning.
5.15.5 Classification and subsequent measurement of financial liabilitiesThe Group’s financial liabilities include borrowings, due to banks and accounts payable and other liabilities.
The subsequent measurement of financial liabilities depends on their classification as follows:
• Financial liabilities at amortised costThese are stated at amortised cost using effective interest rate method. The Group categorises financial liabilities at amortised cost into the following categories:
• Borrowings All borrowings are subsequently measured at amortised cost using the effective interest rate method. Gains and losses are recognised in the consolidated statement of profit or loss when the liabilities are derecognised as well as through the effective interest rate method (EIR) amortisation process.
• Ijara financing Ijara finance payable ending with ownership is an Islamic financing arrangement through which a financial institution provides finance to purchase an asset by way of renting the asset ending with transferring its ownership. This ijara finance payable is stated at the gross amount of the payable, net of deferred finance cost. Deferred finance costs are expensed on a time apportionment basis taking into account the borrowing rate attributable and the balance outstanding.
• Accounts payables and other financial liabilitiesLiabilities are recognised for amounts to be paid in the future for goods or services received, whether billed by the supplier or not, and classified as trade payables. Financial liabilities other than at FVTPL which are not categorised under any of the above are classified as “other liabilities”
All interest-related charges are included within finance costs.
5.15.6 Amortised cost of financial instrumentsThis is computed using the effective interest method less any allowance for impairment. The calculation takes into account any premium or discount on acquisition and includes transaction costs and fees that are an integral part of the effective interest rate.
5.15.7 Offsetting of financial instrumentsFinancial assets and financial liabilities are offset and the net amount reported in the consolidated statement of financial position if, there is a currently enforceable legal right to offset the recognised amounts and there is an intention to settle on a net basis, to realise the assets and settle the liabilities simultaneously.
Notes to the consolidated financial statements
5.15.8 Fair value of financial instrumentsThe fair value of financial instruments that are traded in active markets at each reporting date is determined by reference to quoted market prices or dealer price quotations (bid price for long positions and ask price for short positions), without any deduction for transaction costs.
For financial instruments not traded in an active market, the fair value is determined using appropriate valuation techniques. Such techniques may include using recent arm’s length market transactions; reference to the current fair value of another instrument that is substantially the same; a discounted cash flow analysis or other valuation models.
An analysis of fair values of financial instruments and further details as to how they are measured are provided in Note 29.3
5.16 Equity, reserves and dividend paymentsShare capital represents the nominal value of shares that have been issued and paid up.
Share premium includes any premiums received on issue of share capital. Any transaction costs associated with the issuing of shares are deducted from share premium.
Legal and voluntary reserves comprise appropriations of current and prior period profits in accordance with the requirements of the Companies’ Law and the Parent Company’s Articles of Association.
Other components of equity include the following:
• foreign currency translation reserve – comprises of foreign currency translation differences arising from the translation of financial statements of the Group’s foreign subsidiaries and associates into Kuwaiti Dinar (KD).
• cumulative changes in fair value reserve – comprises of gains and losses relating to investment on fair value through other comprehensive income and Group share of cumulative change in fair value reserve of associates.
Retained earnings include all current and prior period profit. All transactions with owners of the parent are recorded separately within consolidated statement of changes in equity.
Dividend distributions payable to equity shareholders are included in other liabilities when the dividends have been approved in a General Assembly.
5.17 Treasury sharesTreasury shares consist of the Parent Company’s own issued shares that have been re-acquired by the Group and not yet reissued or cancelled. The treasury shares are accounted for using the cost method. Under this method, the weighted average cost of the shares re-acquired is charged to a contra account in equity.
When the treasury shares are reissued, gains are credited to a separate account in equity, (the “gain on sale of treasury shares reserve”), which is not distributable. Any realised losses are charged to the same account to the extent of the credit balance on that account. Any excess losses are charged to retained earnings then to the voluntary reserve and statutory reserve. No cash dividends are paid on these shares. The issue of stock dividend shares increases the number of treasury shares proportionately and reduces the average cost per share without affecting the total cost of treasury shares.
5.18 Provisions, contingent assets and contingent liabilitiesProvisions are recognised when the Group has a present legal or constructive obligation as a result of a past event, it is probable that an outflow of economic resources will be required from the Group and amounts can be estimated reliably. Timing or amount of the outflow may still be uncertain.
Provisions are measured at the estimated expenditure required to settle the present obligation, based on the most reliable evidence available at the reporting date, including the risks and uncertainties associated with the present obligation. Where there are a number of similar obligations, the likelihood that an outflow will be required in settlement is determined by considering the class of obligations as a whole. Provisions are discounted to their present values, where the time value of money is material.
Contingent assets are not recognised in the consolidated statement of financial position, but are disclosed when an inflow of economic benefits is probable.
Contingent liabilities are not recognised in the consolidated statement of financial position, but are disclosed unless the possibility of an outflow of resources embodying economic benefits is remote.
Notes to the consolidated financial statements

8584 Annual Report 2020
Noor Financial Investment Company – KPSC and SubsidiariesConsolidated Financial Statements31 December 2020Kuwait
Noor Financial Investment Company – KPSC and SubsidiariesConsolidated Financial Statements31 December 2020Kuwait
Noor Financial Investment Company - KPSC and Subsidiaries
5.19 Foreign currency translation
5.19.1 Functional and presentation currencyThe consolidated financial statements are presented in Kuwait Dinar (KD), which is also the functional currency of the Parent Company. Each entity in the Group determines its own functional currency and items included in the financial statements of each entity are measured using that functional currency.
5.19.2 Foreign currency transactions and balances Foreign currency transactions are translated into the functional currency of the respective Group entity, using the exchange rates prevailing at the dates of the transactions (spot exchange rate). Foreign exchange gains and losses resulting from the settlement of such transactions and from the re-measurement of monetary items denominated in foreign currency at year-end exchange rates are recognised in consolidated statement of profit or loss. Non-monetary items are not retranslated at year-end and are measured at historical cost (translated using the exchange rates at the transaction date), except for non-monetary items measured at fair value which are translated using the exchange rates at the date when fair value was determined.
Translation difference on non-monetary asset classified as, “fair value through profit or loss” is reported as part of the fair value gain or loss in the consolidated statement of profit or loss and “fair value through other comprehensive income” is reported as part of the cumulative change in fair value reserve within consolidated statement of profit or loss and other comprehensive income.
5.19.3 Foreign operations In the Group’s financial statements, all assets, liabilities and transactions of Group entities with a functional currency other than the KD are translated into KD upon consolidation. The functional currency of the entities in the Group has remained unchanged during the reporting period.
On consolidation, assets and liabilities are translated into KD at the closing rate at the reporting date. Goodwill and fair value adjustments arising on the acquisition of a foreign entity are treated as assets and liabilities of the foreign entity and translated into KD at the closing rate. Income and expenses have been translated into KD at the average rate over the reporting period. Exchange differences are charged/credited to consolidated statement of profit or loss and other comprehensive income and recognised in the foreign currency translation reserve in equity.
On disposal of a foreign operation, the related cumulative translation differences recognised in consolidated statement of changes in equity are reclassified to consolidated statement of profit or loss and are recognised as part of the gain or loss on disposal.
5.20 End of service indemnityThe Parent Company and its local subsidiaries provide end of service benefits to its employees. The entitlement to these benefits is based upon the employees’ final salary and length of service, subject to the completion of a minimum service period in accordance with relevant labour law and the employees’ contracts. The expected costs of these benefits are accrued over the period of employment. This liability, which is unfunded, represents the amount payable to each employee as a result of termination on the reporting date.
In addition to the end of service benefits with respect to its Kuwaiti national employees, the Group also makes contributions to the Public Institution for Social Security calculated as a percentage of the employees’ salaries. The Group’s obligations are limited to these contributions, which are expensed when due.
5.21 Taxation
5.21.1 National Labour Support Tax (NLST)NLST is calculated in accordance with Law No. 19 of 2000 and the Minister of Finance Resolutions No. 24 of 2006 at 2.5% of taxable profit of the Group. As per law, allowable deductions include, share of profits of listed associates and cash dividends from listed companies which are subjected to NLST.
5.21.2 Kuwait Foundation for the Advancement of Sciences (KFAS)The contribution to KFAS is calculated at 1% of taxable profit of the Group in accordance with the modified calculation based on the Foundation’s Board of Directors’ resolution, which states that income from Kuwaiti shareholding associates and subsidiaries, and transfer to statutory reserve should be excluded from profit for the year when determining the contribution.
5.21.3 ZakatContribution to Zakat is calculated at 1% of the profit of the Group in accordance with the Ministry of Finance resolution No. 58/2007 effective from 10 December 2007.
Notes to the consolidated financial statements
5.21.4 Income taxes Income tax payable on profits is recognized as an expense in the period in which the profits arise based on the applicable tax laws and tax rates in each jurisdiction that have been enacted or substantively enacted by the end of reporting date.
Deferred income tax is provided using the liability method on all temporary differences, at the reporting date, between the tax bases of assets and liabilities and their carrying amounts for financial reporting purposes. Deferred tax provisions depend on whether the timing of the reversal of the temporary difference can be controlled and whether it is probable that the temporary difference will reverse in the foreseeable future.
Deferred tax assets and liabilities are measured at the tax rates that are expected to apply to the period when the asset is realized or the liability is settled, based on tax rates (and tax laws) that have been enacted or substantively enacted by the end of reporting date.
Deferred tax assets are recognized for all deductible temporary differences, including carry-forward of unused tax losses, to the extent that it is probable that taxable profit will be available against which the deductible temporary difference can be utilised.
The carrying amount of deferred tax assets is reviewed at each reporting date and reduced to the extent that it is not probable that sufficient taxable profit will be available to allow all or part of the deferred tax assets to be utilised.
5.22 Cash and cash equivalentsFor the purpose of the consolidated statement of cash flows, cash and cash equivalents consist of cash and bank balances, short-term deposits and short term highly liquid investments maturing within three months from the date of inception less due to banks and blocked bank balances.
5.23 InventoriesInventories are stated at the lower of cost or net realisable value and the cost is determined according to the weighted average method.
5.24 Fiduciary assetsAssets held in a trust or fiduciary capacity are not treated as assets of the Group and, accordingly, they are not included in these consolidated financial statements.
5.25 Related party transactionsRelated parties are associates, major shareholders, board of directors, executive staff, their family members and the companies owned by them. All related party transactions are carried out with the approval of the Group’s management.
5.26 Government grants Government grants are recognised where there is reasonable assurance that the grant will be received, and all attached conditions will be complied with. When the grant relates to an expense item, it is recognised as income on a systematic basis over the periods that the related costs, for which it is intended to compensate, are expensed. When the grant relates to an asset, it is recognised as income in equal amounts over the expected useful life of the related asset.
When the Group receives grants of non-monetary assets, the asset and the grant are recorded at nominal amounts and released to profit or loss over the expected useful life of the asset, based on the pattern of consumption of the benefits of the underlying asset by equal annual instalments.
To mitigate the impact of the COVID-19 pandemic, the Government of Kuwait has introduced measures to aid private entities in response to the pandemic. These measures include government assistance made in respect of eligible staff costs in the private sector.
6 Significant management judgements and estimation uncertainty The preparation of the Group’s consolidated financial statements requires management to make judgments, estimates and assumptions that affect the reported amount of revenues, expenses, assets and liabilities and the disclosure of contingent liabilities, at the end of the reporting period. However, uncertainty about these assumptions and estimates could result in outcomes that require a material adjustment to the carrying amount of the asset or liability affected in future periods.
6.1 Significant management judgments In the process of applying the Group’s accounting policies, management has made the following significant judgments, which have the most significant effect on the amounts recognised in the consolidated financial statements:
6.1.1. Business model assessmentThe Group classifies financial assets after performing the business model test (please see accounting policy for financial instruments sections in note 5.15).
Notes to the consolidated financial statements

8786 Annual Report 2020
Noor Financial Investment Company – KPSC and SubsidiariesConsolidated Financial Statements31 December 2020Kuwait
Noor Financial Investment Company – KPSC and SubsidiariesConsolidated Financial Statements31 December 2020Kuwait
Noor Financial Investment Company - KPSC and Subsidiaries
This test includes judgement reflecting all relevant evidence including how the performance of the assets is evaluated and their performance measured and the risks that affect the performance of the assets. Monitoring is part of the Group’s continuous assessment of whether the business model for which the remaining financial assets are held continues to be appropriate and if it is not appropriate whether there has been a change in business model and so a prospective change to the classification of those assets.
6.1.2 Significant increase in credit risk Estimated credit losses are measured as an allowance equal to 12-month ECL for stage 1 assets, or lifetime ECL for stage 2 or stage 3 assets. An asset moves to stage 2 when its credit risk has increased significantly since initial recognition. IFRS 9 does not define “significant” increase. Therefore, assessment whether the credit risk of an asset has significantly increased the Group takes into account qualitative and quantitative reasonable and supportable forward looking information.
6.1.3 Judgements in determining the timing of satisfaction of performance obligationsThe determination of the whether or not performance obligation criterial set out in IFRS 15 relating to transfer of control of goods and services to customers has been satisfied requires significant judgement.
6.1.4 Significant influenceSignificant influence exists when the size of an entity’s own voting rights relative to the size and dispersion of other vote holders, give the entity the practical ability unilaterally to direct the relevant activities of the company.
6.1.5 Fair values of assets and liabilities acquiredThe determination of the fair value of the assets, liabilities and contingent liabilities as a result of business combination requires significant judgement.
6.1.6 Classification of real estate propertyManagement decides on acquisition of a real estate property whether it should be classified as trading, property held for development or investment property.
The Group classifies property as trading property if it is acquired principally for sale in the ordinary course of business.
The Group classifies property as property under development if it is acquired with the intention of development.
The Group classifies property as investment property if it is acquired to generate rental income or for capital appreciation, or for undetermined future use.
6.1.7 Control assessmentWhen determining control, management considers whether the Group has the practical ability to direct the relevant activities of an investee on its own to generate returns for itself. The assessment of relevant activities and ability to use its power to affect variable return requires considerable judgement.
6.2 Estimates uncertainty Information about estimates and assumptions that have the most significant effect on recognition and measurement of assets, liabilities, income and expenses is provided below. Actual results may be substantially different.
6.2.1 Impairment of goodwill The Group determines whether goodwill is impaired at least on an annual basis. This requires an estimation of the value in use of the cash-generating units to which the goodwill is allocated. Estimating the value in use requires the Group to make an estimate of the expected future cash flows from the cash-generating unit and also to choose a suitable discount rate in order to calculate the present value of those cash flows.
6.2.2 Impairment of non-financial assets (intangible assets) The carrying amounts of the Group’s non-financial assets are reviewed at each reporting date to determine whether there is any indication or objective evidence of impairment or when annual impairment testing for an asset is required. If any such indication or evidence exists, the asset’s recoverable amount is estimated and an impairment loss is recognised in the consolidated statement of profit or loss whenever the carrying amount of an asset exceeds its recoverable amount.
6.2.3 Impairment of associatesAfter application of the equity method, the Group determines whether it is necessary to recognize any impairment loss on the Group’s investment in its associates, at each reporting date based on existence of any objective evidence that the investment in the associate is impaired. If this is the case the Group calculates the amount of impairment as the difference between the recoverable amount of the associate and its carrying value and recognizes the amount in the consolidated statement of profit or loss.
Notes to the consolidated financial statements
6.2.4 Impairment of financial assetsMeasurement of estimated credit losses involves estimates of loss given default and probability of default. Loss given default is an estimate of the loss arising in case of default by customer. Probability of default is an estimate of the likelihood of default in the future. The Group based these estimates using reasonable and supportable forward-looking information, which is based on assumptions for the future movement of different economic drivers and how these drivers will affect each other.
6.2.5 Revaluation of investment propertiesThe Group carries its investment properties at fair value, with changes in fair value being recognised in the consolidated statement of profit or loss. The Group engaged independent valuation specialists to determine fair values and the valuators have used valuation techniques to arrive at these fair values. These estimated fair values of investment properties may vary from the actual prices that would be achieved in an arm’s length transaction at the reporting date.
6.2.6 Useful lives of depreciable assetsManagement reviews its estimate of the useful lives of depreciable assets at each reporting date, based on the expected utility of the assets. Uncertainties in these estimates relate to technical obsolescence that may change the utility of certain software and equipment.
6.2.7 Business combinationsManagement uses valuation techniques in determining the fair values of the various elements of a business combination. Particularly, the fair value of contingent consideration is dependent on the outcome of many variables that affect future profitability.
6.2.8 Fair value of financial instrumentsManagement applies valuation techniques to determine the fair value of financial instruments (where active market quotes are not available) and non-financial assets. This requires management to develop estimates and assumptions based on market inputs, using observable data that market participants would use in pricing the instrument. Where such data is not observable, management uses its best estimate. Estimated fair values of financial instruments may vary from the actual prices that would be achieved in an arm’s length transaction at the reporting date.
6.2.9 Impairment of inventoriesInventories are held at the lower of cost and net realisable value. When inventories become old or obsolete, an estimate is made of their net realisable value. For individually significant amounts this estimation is performed on an individual basis. Amounts which are not individually significant, but which are old or obsolete, are assessed collectively and a provision applied according to the inventory type and the degree of ageing or obsolescence, based on historical selling prices.
6.2.10 Contract revenueRecognised amounts of service and related receivables reflect management’s best estimate of each contract’s outcome and stage of completion. For more complex contracts in particular, costs to complete and contract profitability are subject to significant estimation uncertainty.
Notes to the consolidated financial statements

8988 Annual Report 2020
Noor Financial Investment Company – KPSC and SubsidiariesConsolidated Financial Statements31 December 2020Kuwait
Noor Financial Investment Company – KPSC and SubsidiariesConsolidated Financial Statements31 December 2020Kuwait
Noor Financial Investment Company - KPSC and Subsidiaries
7 Subsidiary companies
7.1 Details of the Group’s material consolidated subsidiaries as of the reporting date are as follows:
Subsidiary
Country of registration and place of
business
Proportion of ownership interest held by the Group Nature of business
31 Dec. 2020
31 Dec. 2019
Noor Telecommunication Company - KSCC
Kuwait 49.14% 49.14% Telecommunications and IT Services
(though the Group holds 49.14% of the subsidiary, the Group exercises control over the subsidiary based on its ability to appoint majority board members)
Noor Kuwait Holding – KSCC Kuwait 99.95% 99.95% Investment and related activities
Kuwaiti Indian Holding Company - KSCC Kuwait 56.59% 56.59% Investment and related activities
Noor GCC Islamic Fund Kuwait 94.41% 93.96% Investment and related activities
Hotels Global Group Company - PSC Jordan 100% 100% Hospitality
7.2 Subsidiaries with material non-controlling interests
The Group includes two subsidiaries, with material non-controlling interests (NCI):
Name
Proportion of ownership interests
and voting rightsheld by the NCI
Profit/(loss) allocated to NCI Accumulated NCI
31 Dec. 2020
31 Dec. 2019
31 Dec. 2020
31 Dec. 2019
31 Dec. 2020
31 Dec. 2019
% % KD KD KD KD
Noor Telecommunication Company- KSCC, (NTEL) 50.86% 50.86% 282,290 758,693 5,244,836 5,083,245
Kuwaiti Indian Holding Company -KSCC (KIHC) 43.41% 43.41% (17,657) 75,290 1,161,110 1,224,403
Individually immaterial subsidiaries with non- controlling interests 9,964 8,785 327,580 328,120
274,597 842,768 6,733,526 6,635,768
Notes to the consolidated financial statements
Summarised financial information for the above subsidiaries, before intra-group eliminations, is set out below:
NTEL
KIHC
31 Dec. 2020
31 Dec. 2019
31 Dec. 2020
31 Dec. 2019
KD KD KD KD
Non-current assets 6,791,259 7,152,063 870,197 -
Current assets 7,687,780 6,921,784 1,866,349 2,879,673
Total assets 14,479,039 14,073,847 2,736,546 2,879,673
Non-current liabilities 797,438 642,403 6,795 5,793
Current liabilities 3,875,046 3,924,796 58,267 56,724
Total liabilities 4,672,484 4,567,199 65,062 62,517
Equity attributable to owners of the Parent Company 4,561,719 4,423,403 1,510,374 1,592,753
Non-controlling interests (including NCI of the sub subsidiary) 5,244,836 5,083,245 1,161,110 1,224,403
Total income 12,352,669 13,482,287 14,514 237,841
Profit / (loss) for the year 469,696 1,427,779 (40,673) 173,433
Other comprehensive loss for the year (237,319) (472,139) - -
Total comprehensive income / (loss) for the year 232,377 955,640 (40,673) 173,433
-attributable to owners of the Parent Company 70,787 437,219 (23,016) 98,143
-attributable to NCI 161,590 518,421 (17,657) 75,290
Net cash flow from/(used in) operating activities 758,193 392,979 372,089 (321,429)
Net cash flow from investing activities 180,515 92,247 189,759 36,727
Net cash flow used in financing activities (957,890) (360,985) (100,605) (104,040)
Net cash inflow/(outflow) (19,182) 124,241 461,243 (388,742)
7.3 Disposal of Subsidiary CompaniesDuring the previous year the Parent Company disposed 32.7% of Noor Al Salhiya Real Estate Co.- KSCC (“NSREC”) (subsidiary), equity interest (Group ownership by the time of sale was 59.1%) to its related parties which resulted in loss of control over “NSREC”. As a result of this disposal, the Group lost its control over another subsidiary, Noor CM Holding Company KSC (“NCM”) where the Group’s ownership interest declined from 98% to 49%. Consequent to loss of control over NCM, the Group’s ownership of NSREC was further diluted by 9.5%. Accordingly, NSREC and NCM were reported as discontinued operation for the year ended 31 December 2019. This resulted in a loss of KD1,456,681 recorded in the previous year, being the difference between fair value of consideration KD9,772,513 and carrying value of the net assets disposed KD11,229,194.
The remaining stake of NSREC and NCM was accounted as investments in associates. However, during 3rd and 4th quarter of previous year, the Group disposed the balance stake of 16.9% and 49% of the NSREC and NCM respectively.
Notes to the consolidated financial statements

9190 Annual Report 2020
Noor Financial Investment Company – KPSC and SubsidiariesConsolidated Financial Statements31 December 2020Kuwait
Noor Financial Investment Company – KPSC and SubsidiariesConsolidated Financial Statements31 December 2020Kuwait
Noor Financial Investment Company - KPSC and Subsidiaries
8 Cost of sales and services, general, administrative and other expenses and finance cost
a) Cost of sales and services includes followings
Year ended31 Dec.
2020
Year ended31 Dec.
2019
KD KD
Staff costs 5,045,462 5,260,975
Amortization 134,741 283,759
Others 5,949,034 5,013,050
11,129,237 10,557,784
b) General, administrative and other expenses include the following:
Year ended31 Dec.
2020
Year ended31 Dec.
2019
KD KD
Staff costs 1,960,570 2,079,730
Depreciation and amortization 473,142 510,894
Other expenses 1,836,174 3,192,718
4,269,886 5,783,342
Number of staffs employed by the Parent Company as at 31 December 2020 was 37 (2019: 37).
9 Interest and other income Year ended
31 Dec. 2020
Year ended31 Dec.
2019
KD KD
Interest income 26,149 55,163
Income from wakala investments 48,254 13,823
Reversal of interest expenses on legal cases on settlement - 813,089
Reversal of impairment provision on wakala investment (note 13 b) 740,000 200,000
Other income 171,933 69,248
986,336 1,151,323
Notes to the consolidated financial statements
10 Net gain/(loss) on financial assets
Net gain /(loss)on financial assets, analyzed by category, is as follows:
Year ended31 Dec.
2020
Year ended31 Dec.
2019
KD KD
Financial assets at amortised cost
- Interest on cash and bank balances and short-term deposits 26,149 55,163
- Profit from wakala investments 48,254 13,823
- Impairment in value of accounts receivable (544,178) -
- Reversal of impairment provision on wakala investments 740,000 200,000
Investments at fair value through profit or loss
- Realised (loss)/gain (145,607) 1,870,232
- Unrealised gain 73,279 1,713,417
- Dividend income 321,227 410,425
Investments at FVOCI
- recognised directly in other comprehensive income for investments at FVOCI (2,939,111) (122,120)
- recognised in statement of profit or loss as dividend income 482,034 735,099
(1,937,953) 4,876,039
Distributed as follows:
Net (loss)/gain recognised in the consolidated statement of profit or loss
- Realized (loss)/gain on investments at fair value through profit or loss (145,607) 1,870,232
- Unrealized gain on investments at fair value through profit or loss 73,279 1,713,417
- Dividend income 803,261 1,145,524
- Impairments in value of accounts receivable (544,178) -
- Others 814,403 268,986
Net loss recognised in the consolidated statement of profit or loss and other comprehensive income (2,939,111) (122,120)
(1,937,953) 4,876,039
Notes to the consolidated financial statements

9392 Annual Report 2020
Noor Financial Investment Company – KPSC and SubsidiariesConsolidated Financial Statements31 December 2020Kuwait
Noor Financial Investment Company – KPSC and SubsidiariesConsolidated Financial Statements31 December 2020Kuwait
Noor Financial Investment Company - KPSC and Subsidiaries
11 Basic and diluted earnings/(loss) per share
Earnings/(loss) per share is calculated by dividing the profit/(loss) for the year attributable to the owners of the Parent Company by the weighted average number of shares outstanding during the year as follows:
Year ended 31 Dec.
2020
Year ended31 Dec.
2019
KD KD
Profit/(loss) for the year attributable to the owners of the Parent Company (KD)
- From continuing operations 11,857,421 9,533,915
- From discontinued operations - (1,456,681)
Total 11,857,421 8,077,234
Weighted average number of shares outstanding during the year (excluding treasury share) 394,964,896 399,157,535
Basic and diluted earnings/(loss) per share (Fils)
- From continuing operations 30.02 23.89
- From discontinued operations - (3.65)
Total 30.02 20.24
12 Cash and cash equivalents
Cash and cash equivalents for the purpose of the consolidated statement of cash flows are made up as follows:
Effective annual interests/profit rates
31 Dec.2020
31 Dec.2019
31 Dec.2020
31 Dec.2019
KD KD
Cash and bank balances 4,133,589 2,580,478
Short term deposits 1.0%-1.4% 2.5%-2.75% 6,997,843 5,628,943
11,131,432 8,209,421
Less: Due to banks 5.00% 6.0% (333,516) (408,598)
Less: Blocked balances and secured balances
(5,990) (5,990)
Less: Short term deposits maturing after three months
(1,250,000) (1,250,000)
Cash and cash equivalents as per consolidated statements of cash flows 9,541,926 6,544,833
Due to banks represent bank overdraft facilities utilised by subsidiary and are secured by short term deposits as at 31 December 2020 of KD 622,843 (2019: KD622,843). Deposits amounting to KD 1,390,000 (2019: KD Nil) are secured against borrowing (refer Note 21)
Cash and cash equivalents include bank balances of KD 1,198,441(31 December 2019: KD 1,176,284) which are designated for the purpose of payment of dividends for the Parent Company shareholders, payment to non-controlling interest on account of capital reduction and dividend payments of subsidiaries.
Notes to the consolidated financial statements
13 Wakala investmentsEffective annual interest/
profit rates
31 Dec.2020
31 Dec.2019
31 Dec.2020
31 Dec.2019
KD KD
Wakala investments
Placed with local Islamic banks - 3.00% - 1,000,000
- - 1,000,000
a) Wakala investments of KD14,324,160 (31 December 2019: KD14,324,160) placed with a local Islamic investment company matured in the last quarter of 2008. The investee company defaulted on settlement of these balances on the maturity date. However, revised maturity dates were stipulated by the court. The investee company again defaulted the payment of 2nd, 3rd, 4th and 5th instalments due in June 2014, 2015, 2016 and 2017 respectively. Full provision was made for receivable in accordance with the Central Bank of Kuwait provision rules. The Group initiated various legal cases against the investee company, which have been decided in favor of the Group. During the year 2019, the Parent Company has signed settlement agreement with Investee Company and as per this agreement 50% shares of a local unlisted company (acquired company) have been transferred to Parent Company.
The acquired company along with other entities are pursuing legal action in order to execute their joint rights as per previous court verdict. The management of the Parent Company is of the opinion that the financial impact of this transaction will be adjusted upon completion of the relevant legal proceedings.
b) During the previous years, the Group assumed the financial and legal obligations on wakala investments of KD1,683,250 (in violation of the Commercial Companies Law of 1960) that the Group had placed with the above-mentioned investment company as part of the total wakala investments of KD14,324,160 in a fiduciary capacity under a wakala agreement with certain related parties, despite having no such obligation under the wakala agreement. As noted above, the amount was fully provided in accordance with Central Bank of Kuwait rules. The Group initiated legal proceedings against the parties to recover the amount including profits thereon. During the year 2019, consequent to a court ruling decided in favor of the Group, the related parties entered into a settlement agreement with the Parent Company to settle the above amount of KD1,683,250. The Parent Company so far received an amount of KD1,000,000 as per the settlement schedule and remaining amount of KD683,250 is due in the year 2021. This has resulted in a reversal of provision on wakala investment amounting to KD800,000 during the year 2020 (2019: KD200,000) in accordance with Central Bank of Kuwait credit provisioning rules.
14 Investments at fair value through profit or loss 31 Dec.
202031 Dec.
2019
KD KD
Quoted securities 7,432,583 11,116,688
- Local 3,607,799 6,875,479
- Foreign 3,824,784 4,241,209
Foreign funds 167,285 587,557
7,599,868 11,704,245
Quoted shares with a fair value of KD 869,694 (2019: KD 3,899,087) are secured against borrowings (refer note 21).
Notes to the consolidated financial statements
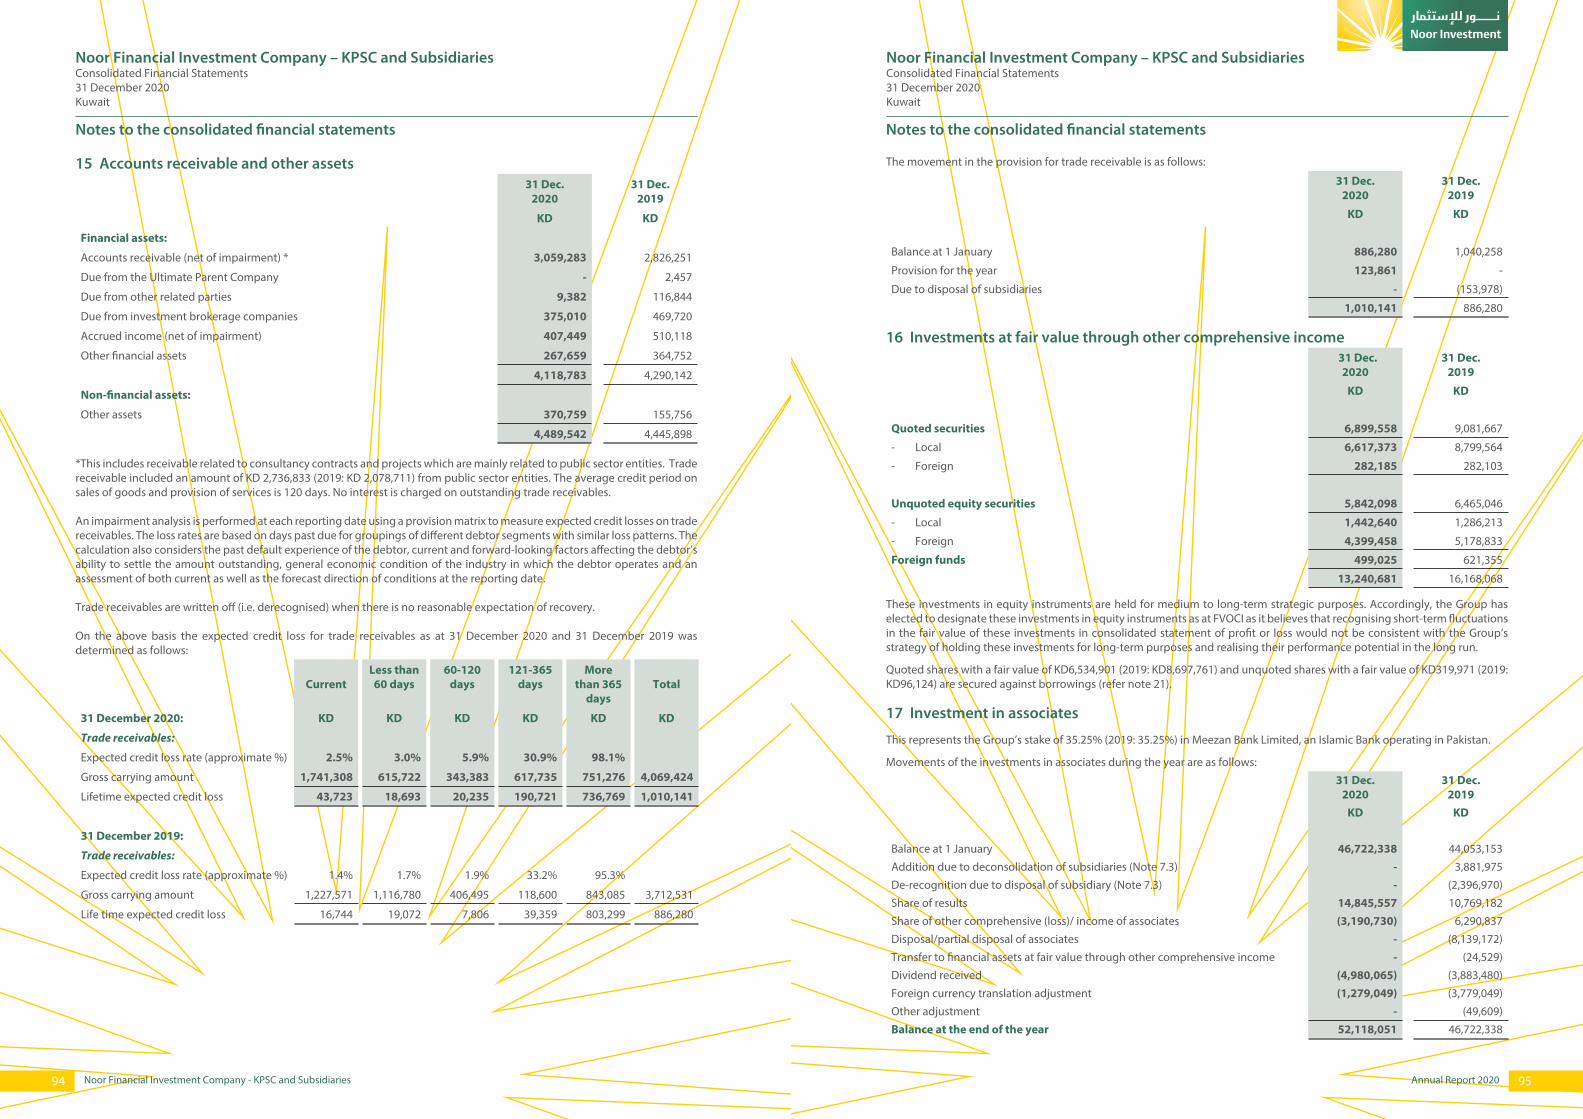
9594 Annual Report 2020
Noor Financial Investment Company – KPSC and SubsidiariesConsolidated Financial Statements31 December 2020Kuwait
Noor Financial Investment Company – KPSC and SubsidiariesConsolidated Financial Statements31 December 2020Kuwait
Noor Financial Investment Company - KPSC and Subsidiaries
15 Accounts receivable and other assets31 Dec.
202031 Dec.
2019
KD KD
Financial assets:
Accounts receivable (net of impairment) * 3,059,283 2,826,251
Due from the Ultimate Parent Company - 2,457
Due from other related parties 9,382 116,844
Due from investment brokerage companies 375,010 469,720
Accrued income (net of impairment) 407,449 510,118
Other financial assets 267,659 364,752
4,118,783 4,290,142
Non-financial assets:
Other assets 370,759 155,756
4,489,542 4,445,898
*This includes receivable related to consultancy contracts and projects which are mainly related to public sector entities. Trade receivable included an amount of KD 2,736,833 (2019: KD 2,078,711) from public sector entities. The average credit period on sales of goods and provision of services is 120 days. No interest is charged on outstanding trade receivables.
An impairment analysis is performed at each reporting date using a provision matrix to measure expected credit losses on trade receivables. The loss rates are based on days past due for groupings of different debtor segments with similar loss patterns. The calculation also considers the past default experience of the debtor, current and forward-looking factors affecting the debtor’s ability to settle the amount outstanding, general economic condition of the industry in which the debtor operates and an assessment of both current as well as the forecast direction of conditions at the reporting date.
Trade receivables are written off (i.e. derecognised) when there is no reasonable expectation of recovery.
On the above basis the expected credit loss for trade receivables as at 31 December 2020 and 31 December 2019 was determined as follows:
CurrentLess than 60 days
60-120 days
121-365 days
More than 365
daysTotal
31 December 2020: KD KD KD KD KD KD
Trade receivables:
Expected credit loss rate (approximate %) 2.5% 3.0% 5.9% 30.9% 98.1%
Gross carrying amount 1,741,308 615,722 343,383 617,735 751,276 4,069,424
Lifetime expected credit loss 43,723 18,693 20,235 190,721 736,769 1,010,141
31 December 2019:
Trade receivables:
Expected credit loss rate (approximate %) 1.4% 1.7% 1.9% 33.2% 95.3%
Gross carrying amount 1,227,571 1,116,780 406,495 118,600 843,085 3,712,531
Life time expected credit loss 16,744 19,072 7,806 39,359 803,299 886,280
Notes to the consolidated financial statements
The movement in the provision for trade receivable is as follows:
31 Dec.2020
31 Dec.2019
KD KD
Balance at 1 January 886,280 1,040,258
Provision for the year 123,861 -
Due to disposal of subsidiaries - (153,978)
1,010,141 886,280
16 Investments at fair value through other comprehensive income 31 Dec.
202031 Dec.
2019
KD KD
Quoted securities 6,899,558 9,081,667
- Local 6,617,373 8,799,564
- Foreign 282,185 282,103
Unquoted equity securities 5,842,098 6,465,046
- Local 1,442,640 1,286,213
- Foreign 4,399,458 5,178,833
Foreign funds 499,025 621,355
13,240,681 16,168,068
These investments in equity instruments are held for medium to long-term strategic purposes. Accordingly, the Group has elected to designate these investments in equity instruments as at FVOCI as it believes that recognising short-term fluctuations in the fair value of these investments in consolidated statement of profit or loss would not be consistent with the Group’s strategy of holding these investments for long-term purposes and realising their performance potential in the long run.
Quoted shares with a fair value of KD6,534,901 (2019: KD8,697,761) and unquoted shares with a fair value of KD319,971 (2019: KD96,124) are secured against borrowings (refer note 21).
17 Investment in associates
This represents the Group’s stake of 35.25% (2019: 35.25%) in Meezan Bank Limited, an Islamic Bank operating in Pakistan.
Movements of the investments in associates during the year are as follows:
31 Dec.2020
31 Dec.2019
KD KD
Balance at 1 January 46,722,338 44,053,153
Addition due to deconsolidation of subsidiaries (Note 7.3) - 3,881,975
De-recognition due to disposal of subsidiary (Note 7.3) - (2,396,970)
Share of results 14,845,557 10,769,182
Share of other comprehensive (loss)/ income of associates (3,190,730) 6,290,837
Disposal/partial disposal of associates - (8,139,172)
Transfer to financial assets at fair value through other comprehensive income - (24,529)
Dividend received (4,980,065) (3,883,480)
Foreign currency translation adjustment (1,279,049) (3,779,049)
Other adjustment - (49,609)
Balance at the end of the year 52,118,051 46,722,338
Notes to the consolidated financial statements

9796 Annual Report 2020
Noor Financial Investment Company – KPSC and SubsidiariesConsolidated Financial Statements31 December 2020Kuwait
Noor Financial Investment Company – KPSC and SubsidiariesConsolidated Financial Statements31 December 2020Kuwait
Noor Financial Investment Company - KPSC and Subsidiaries
17.1 Summarised financial information in respect of Meezan Bank Limited is set out below. The summarised financial information below represents the amounts presented in the financial statements of the associate (and not the Group’s share of those amounts) adjusted for differences in accounting policies between the Group and the associates.
17.1.1. Meezan Bank Limited.
31 Dec.2020
31 Dec.2019
KD KD
Total assets 2,884,284,044 2,203,581,760
Total liabilities and non-controlling interests (2,748,310,527) (2,083,021,095)
Equity attributable to shareholders of Meezan Bank 135,973,517 120,560,665
Revenue 201,398,779 184,484,775
Profit for the year attributable to the shareholders of Meezan bank 42,316,419 30,495,634
Other comprehensive (loss)/income for the year (7,215,006) 18,666,246
Total comprehensive income for the year 35,101,413 49,161,880
Dividends received from the associate during the year (net of taxes) 4,980,065 3,883,480
Proportion of the Group’s ownership interest in Meezan Bank 35.25% 35.25%
Group share in Meezan Bank’s net assets 47,928,927 42,496,307
Goodwill 4,188,909 4,226,031
Carrying value of Group’s ownership interest in Meezan Bank 52,117,836 46,722,338
As at 31 December 2020 the fair value of the Group’s interest in Meezan Bank Limited, which is listed on the Pakistan Stock Exchange was KD 98,402,353(2019: KD 84,389,024), based on the quoted market price available on that exchange, which is a level 1 input in terms of IFRS 13.
17.1.2 Group’s share of associate’s contingent liabilities:
31 Dec.2020
31 Dec.2019
KD KD
Guarantees 25,153,383 26,792,032
Letters of credit 101,009,867 67,897,072
Commitments in respect of forward exchange contracts 124,587,692 184,223,449
Commitment for the acquisition of operating fixed assets 461,099 532,750
Commitment in respect of financing 264,571,360 238,063,655
515,783,401 517,508,958
The local income tax authority in Pakistan has raised a demand requesting Mezzan Bank Limited, an associate of the Group, to pay additional tax amounting to KD3.4 million (Group’s share KD1.2 million) for prior years. The associate has obtained a stay order against this demand and has also filed appeals with the relevant Appellate Authorities. Group’s management, in consultation with tax advisors, is confident that the decision in respect of this matter would be in Group’s favour and, accordingly, no provision is made in these consolidated financial statements with respect thereto.
Notes to the consolidated financial statements
17.2 During the previous year, group has disposed, partially disposed below associates:
• As a result of disposing, NSREC, the Group has de-recognised its associates owned through the disposed subsidiary, including National Tamouh GTC Company - WLL (48%), Ikarus Real Estate Company - LLC (50%), Sidra Middle East Company WLL (25%), Durra National Combined Real Estate Company - WLL (50%) and Durra United Central Market Company - WLL (33%) with a total carrying value of KD2,396,970 as of the disposal date.
• 2.93% of Meezan Bank Limited for a total consideration of KD6,374,344 resulting in a net gain of KD1,596,799.
• Bayt Al Raya Real Estate Development Company (50%) for a total consideration of KD1,048,662 resulting in a net loss of KD108,711.
• Noor Al Salhiya Real Estate Company - KSCC (16.7%) stake to the Ultimate Parent Company for a consideration of KD3,000,000.
• Noor CM Holding Company - KSC (49.5%) stake for a consideration of KD867,038, resulting in a net gain of KD81,322.
18 Investment properties
The movement in investment properties is as follows:
31 Dec. 2020
31 Dec.2019
KD KD
Fair value as at 1 January 13,895,210 31,738,975
De-recognition due to disposal of subsidiary (note 7.3) - (17,396,279)
Additions during the year - 667,000
Changes in fair value (note 18.3) (872,677) (1,150,306)
Foreign currency translation 33,550 35,820
13,056,083 13,895,210
18.1 Investment properties comprise of lands and buildings in the following countries:
31 Dec.2020
31 Dec. 2019
Level 3 Level 3
KD KD
Investment properties
Kuwait
- Land and buildings in Kuwait 10,516,000 10,622,000
Outside Kuwait
- Land in Jordan and buildings in UAE 1,635,953 2,402,297
- Building in UK 904,130 870,913
13,056,083 13,895,210
18.2 Investments properties amounting to KD8,481,000 (2019: KD8,409,000) and KD Nil (2019: KD1,546,000) are secured against bank borrowings and Ijara Financing facilities respectively (refer note 21).
18.3 At 31 December 2020, the Group re-valued its properties based on independent valuations (refer note 29.4 for further details relating to fair values).
Notes to the consolidated financial statements

9998 Annual Report 2020
Noor Financial Investment Company – KPSC and SubsidiariesConsolidated Financial Statements31 December 2020Kuwait
Noor Financial Investment Company – KPSC and SubsidiariesConsolidated Financial Statements31 December 2020Kuwait
Noor Financial Investment Company - KPSC and Subsidiaries
19 Goodwill and other Intangible assets31 Dec.
202031 Dec.
2019
KD KD
Goodwill (Note 19.1) 2,029,278 2,029,278
Other intangible assets (Note 19.2) - 134,741
Total goodwill and other intangible assets 2,029,278 2,164,019
19.1. Goodwill Goodwill represents the excess of cost of acquisition over the Group’s interest in the fair value of the identifiable assets and liabilities of the acquired subsidiaries. Goodwill has been allocated to the IT service business of the Group as that is the cash generating unit (CGU) which is expected to benefit from the synergies of the business combination. It is also the lowest level at which goodwill is monitored for impairment purposes.
Impairment testingThe Group determines whether goodwill is impaired at least on an annual basis. This requires an estimation of the recoverable amount of the CGUs to which these items are allocated. The recoverable amount is determined based on higher of value-in-use calculations or fair value less cost to sell.
Management used the following approach to determine values to be assigned to the following key assumptions in the value in use calculations
Key assumption Basis used to determine value to be assigned to key assumption
Growth rate Anticipated average growth rate of 3% (2019: 4%) per annum. Value assigned reflects past experience and changes in economic environment.
Cash flows beyond the five-year period have been extrapolated using a growth rate of 3% (2019: 4%). This growth rate does not exceed the long-term average growth rate of the market in which the CGU operates.
Discount rate Discount rates of 17.5% (2019: 14%). Discount rates used are pre-tax and reflect specific risks relating to the relevant CGU.
The Group has performed a sensitivity analysis by varying these input factors by a reasonably possible margin and assessing whether the change in input factors result in any of the goodwill allocated to appropriate cash generating units being impaired. Based on the above analysis, there are no indications that goodwill included in any of the cash generating units is impaired.
19.2 Other Intangible assets – Indefeasible right of use (IRU) Intangible asset comprises of indefeasible right of use (IRU) to a telecommunication asset arising from a subsidiary and the movement is as follows:
31 Dec. 2020
31 Dec. 2019
KD KD
Cost
At the beginning of the year 3,267,810 3,267,810
Balance at the end of the year 3,267,810 3,267,810
Accumulated amortization and impairment
At the beginning of the year (3,133,069) (1,904,310)
Charge for the year (134,741) (283,759)
Impairments in value - (945,000)
At the end of the year (3,267,810) (3,133,069)
Net book value at the end of the year - 134,741
Notes to the consolidated financial statements
20 Accounts payable and other liabilities 31 Dec.
202031 Dec.
2019
KD KD
Financial liabilities:
Accounts payable 3,095,126 2,093,767
Taxes payable 1,138,018 1,085,648
Accrued expenses 933,645 945,777
Dividend payable 224,675 180,039
Other payables 820,202 943,607
Due to related parties 495,000 452,000
Payable on account of capital reduction in subsidiary 942,117 957,060
Lease liabilities 1,623,412 1,499,662
9,272,195 8,157,560
All above financial liabilities are non-interest bearing except for lease liabilities. The carrying values of the above liabilities approximate their fair values.
21 Borrowings Effective interest/ Profit rate (p.a.%)
Security
31 Dec.2020
31 Dec.2019
31 Dec. 2020
31 Dec. 2019
KD KD
Short term
Tawaruq Payable – Kuwaiti Dinar - 5.58% Secured - 162,146
Long term
Loans from banks – Kuwaiti Dinar 3.31% 4.57% Secured 20,199,375 21,459,375
Loan from Ultimate Parent Company – Kuwaiti Dinar 3.50% 4.75% Secured 2,500,000 5,000,000
Ijara financing – Kuwaiti Dinar - 5.75% Secured - 730,500
22,699,375 27,189,875
22,699,375 27,352,021
21.1 During the year, the Parent Company has prepaid an amount of KD1,260,000 to the lenders. These loans are fully secured by investments at fair value through profit or loss (note 14), investments at fair value through other comprehensive income (note 16) and investment properties (note 18), and against shares of two unlisted subsidiaries of the Parent Company. Out of KD20,199,375 an amount of KD1,777,500 is due in the year 2022 and the remaining amount of KD18,421,875 is due at the end of the year 2023.
21.2 During the year, the Parent company has paid a total of KD2,500,000 against loan obtained from Ultimate Parent Company. The remaining amount of loan from the Ultimate Parent Company is due in December 2021.
21.3 Ijara financing contracts and Tawaruq Payable was fully paid during the year 2020.
Notes to the consolidated financial statements
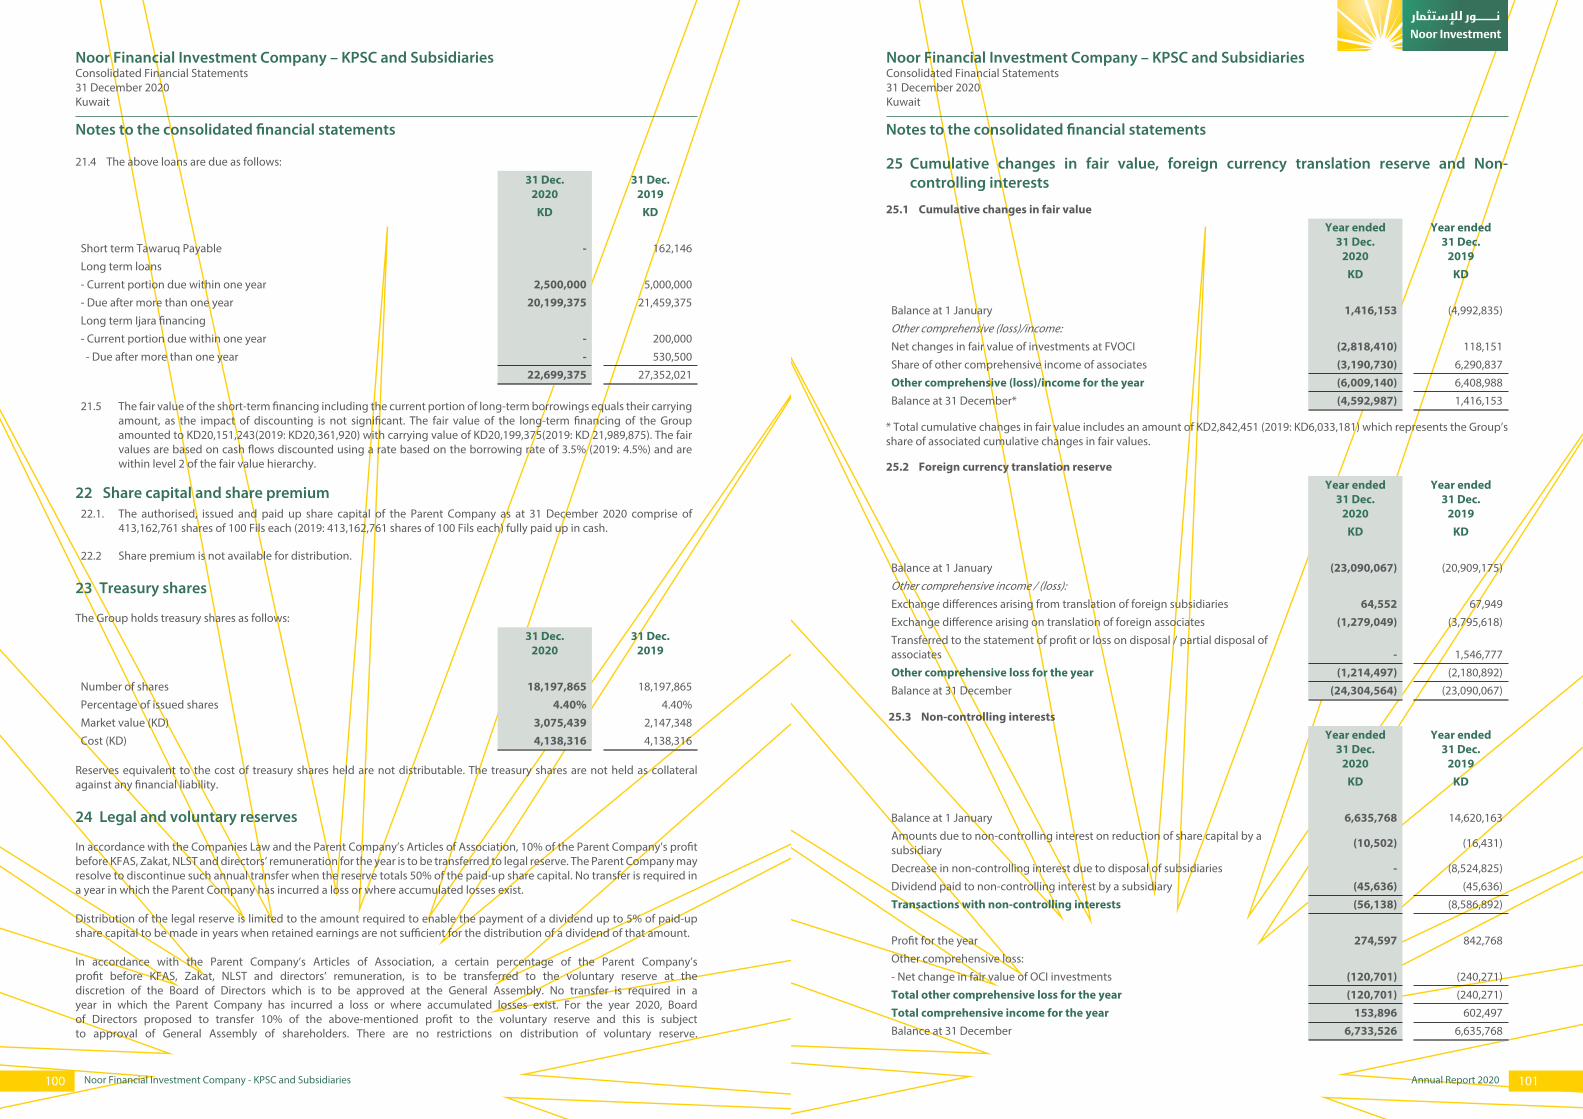
101100 Annual Report 2020
Noor Financial Investment Company – KPSC and SubsidiariesConsolidated Financial Statements31 December 2020Kuwait
Noor Financial Investment Company – KPSC and SubsidiariesConsolidated Financial Statements31 December 2020Kuwait
Noor Financial Investment Company - KPSC and Subsidiaries
21.4 The above loans are due as follows:
31 Dec. 2020
31 Dec.2019
KD KD
Short term Tawaruq Payable - 162,146
Long term loans
- Current portion due within one year 2,500,000 5,000,000
- Due after more than one year 20,199,375 21,459,375
Long term Ijara financing
- Current portion due within one year - 200,000
- Due after more than one year - 530,500
22,699,375 27,352,021
21.5 The fair value of the short-term financing including the current portion of long-term borrowings equals their carrying amount, as the impact of discounting is not significant. The fair value of the long-term financing of the Group amounted to KD20,151,243(2019: KD20,361,920) with carrying value of KD20,199,375(2019: KD 21,989,875). The fair values are based on cash flows discounted using a rate based on the borrowing rate of 3.5% (2019: 4.5%) and are within level 2 of the fair value hierarchy.
22 Share capital and share premium 22.1. The authorised, issued and paid up share capital of the Parent Company as at 31 December 2020 comprise of
413,162,761 shares of 100 Fils each (2019: 413,162,761 shares of 100 Fils each) fully paid up in cash.
22.2 Share premium is not available for distribution.
23 Treasury shares
The Group holds treasury shares as follows:
31 Dec. 2020
31 Dec.2019
Number of shares 18,197,865 18,197,865
Percentage of issued shares 4.40% 4.40%
Market value (KD) 3,075,439 2,147,348
Cost (KD) 4,138,316 4,138,316
Reserves equivalent to the cost of treasury shares held are not distributable. The treasury shares are not held as collateral against any financial liability.
24 Legal and voluntary reserves
In accordance with the Companies Law and the Parent Company’s Articles of Association, 10% of the Parent Company’s profit before KFAS, Zakat, NLST and directors’ remuneration for the year is to be transferred to legal reserve. The Parent Company may resolve to discontinue such annual transfer when the reserve totals 50% of the paid-up share capital. No transfer is required in a year in which the Parent Company has incurred a loss or where accumulated losses exist.
Distribution of the legal reserve is limited to the amount required to enable the payment of a dividend up to 5% of paid-up share capital to be made in years when retained earnings are not sufficient for the distribution of a dividend of that amount.
In accordance with the Parent Company’s Articles of Association, a certain percentage of the Parent Company’s profit before KFAS, Zakat, NLST and directors’ remuneration, is to be transferred to the voluntary reserve at the discretion of the Board of Directors which is to be approved at the General Assembly. No transfer is required in a year in which the Parent Company has incurred a loss or where accumulated losses exist. For the year 2020, Board of Directors proposed to transfer 10% of the above-mentioned profit to the voluntary reserve and this is subject to approval of General Assembly of shareholders. There are no restrictions on distribution of voluntary reserve.
Notes to the consolidated financial statements
25 Cumulative changes in fair value, foreign currency translation reserve and Non-controlling interests
25.1 Cumulative changes in fair valueYear ended
31 Dec. 2020
Year ended 31 Dec.
2019KD KD
Balance at 1 January 1,416,153 (4,992,835)
Other comprehensive (loss)/income:Net changes in fair value of investments at FVOCI (2,818,410) 118,151
Share of other comprehensive income of associates (3,190,730) 6,290,837
Other comprehensive (loss)/income for the year (6,009,140) 6,408,988
Balance at 31 December* (4,592,987) 1,416,153
* Total cumulative changes in fair value includes an amount of KD2,842,451 (2019: KD6,033,181) which represents the Group’s share of associated cumulative changes in fair values.
25.2 Foreign currency translation reserveYear ended
31 Dec. 2020
Year ended 31 Dec.
2019KD KD
Balance at 1 January (23,090,067) (20,909,175)
Other comprehensive income / (loss):Exchange differences arising from translation of foreign subsidiaries 64,552 67,949
Exchange difference arising on translation of foreign associates (1,279,049) (3,795,618)
Transferred to the statement of profit or loss on disposal / partial disposal of associates - 1,546,777
Other comprehensive loss for the year (1,214,497) (2,180,892)
Balance at 31 December (24,304,564) (23,090,067)
25.3 Non-controlling interestsYear ended
31 Dec. 2020
Year ended 31 Dec.
2019KD KD
Balance at 1 January 6,635,768 14,620,163
Amounts due to non-controlling interest on reduction of share capital by a subsidiary (10,502) (16,431)
Decrease in non-controlling interest due to disposal of subsidiaries - (8,524,825)
Dividend paid to non-controlling interest by a subsidiary (45,636) (45,636)
Transactions with non-controlling interests (56,138) (8,586,892)
Profit for the year 274,597 842,768
Other comprehensive loss:
- Net change in fair value of OCI investments (120,701) (240,271)
Total other comprehensive loss for the year (120,701) (240,271)
Total comprehensive income for the year 153,896 602,497
Balance at 31 December 6,733,526 6,635,768
Notes to the consolidated financial statements

103102 Annual Report 2020Noor Financial Investment Company - KPSC and Subsidiaries
Noor Financial Investment Company – KPSC and SubsidiariesConsolidated Financial Statements31 December 2020Kuwait
26 Dividend distribution and Directors’ remuneration
Subject to the requisite consent of the relevant authorities and approval from the General Assembly, the Parent Company’s Board of Directors propose to distribute a cash dividend to shareholders equivalent to 6 Fils per share for the year ended 31 December 2020 (2019: 6 Fils). The Board of Directors’ of the Parent Company proposed to distribute an amount of KD165,000 as directors’ remuneration for year ended 31 December 2020 (2019: KD120,000) subject to approval of the General Assembly of the Parents Company’s Shareholders.
The shareholders of the Parent Company at the Annual General Meeting held on 29 April 2020, approved to distribute a cash dividend to shareholders equivalent to 6 fils per share amounting to KD2,369,790 for the year ended 31 December 2019 and an amount of KD120,000 as directors’ remuneration for year ended 31 December 2019.
Notes to the consolidated financial statements
27 S
egm
ent a
naly
sis
The
Gro
up a
ctiv
ities
are
con
cent
rate
d in
four
mai
n se
gmen
ts: I
nves
tmen
ts, R
eal E
stat
e, IT
ser
vice
s an
d H
otel
ope
ratio
ns. T
hese
seg
men
ts a
re re
gula
rly re
view
ed b
y th
e Ch
ief O
pera
ting
Dec
isio
n M
aker
(C
OD
M) f
or re
sour
ce a
lloca
tion
and
perf
orm
ance
ass
essm
ent.
In a
dditi
on, t
he s
egm
ents
resu
lts, a
sset
s an
d lia
bilit
ies
are
repo
rted
bas
ed o
n th
e ge
ogra
phic
al lo
catio
n in
whi
ch th
e G
roup
ope
rate
s in
. Se
gmen
t res
ults
incl
ude
reve
nue
and
expe
nse
dire
ctly
att
ribut
able
to e
ach
repo
rtin
g se
gmen
t as
the
Gro
up d
oes
not h
ave
any
inte
r seg
men
t cha
rges
. Seg
men
t ass
ets
com
pris
e th
ose
oper
atin
g as
sets
th
at a
re d
irect
ly a
ttrib
utab
le to
the
segm
ent.
Segm
enta
l inf
orm
atio
n fo
r the
yea
rs e
nded
31
Dec
embe
r 202
0 an
d 31
Dec
embe
r 201
9 ar
e as
follo
ws:
Inve
stm
ents
Real
Est
ate
IT s
ervi
ces
Hot
el o
pera
tion
sTo
tal
31 D
ec
2020
31 D
ec
2019
31 D
ec
2020
31 D
ec 2
019
31 D
ec
2020
31 D
ec
2019
31 D
ec
2020
31 D
ec
2019
31 D
ec
2020
31 D
ec
2019
KD
KDKD
KD
KD
KDKD
KD
KD
KD
Sale
s -
- -
-12
,238
,735
10,8
26,9
511,
067,
920
2,56
2,90
013
,306
,655
13,3
89,8
51In
vest
men
ts re
late
d in
com
e (r
ealis
ed,
unre
alis
ed a
nd d
ivid
end
inco
me)
730,
933
4,7
29,1
73
--
--
--
730,
933
4,72
9,17
3Re
ntal
inco
me
- -
473,
015
656,
897
--
--
473,
015
656,
897
Real
ised
gai
n on
dis
posa
ls/ p
artia
l di
spos
al o
f ass
ocia
tes
- 1
,576
,423
-
--
--
--
1,57
6,42
3Ch
ange
in fa
ir va
lue
of in
vest
men
t pr
oper
ties
--
(872
,677
)(1
,150
,306
)-
--
-(8
72,6
77)
(1,1
50,3
06)
Man
agem
ent a
nd p
lace
men
t fee
13,2
63 1
9,81
0 -
--
--
-13
,263
19,8
10Sh
are
of re
sults
of a
ssoc
iate
s 14
,845
,557
10,7
57,5
10-
11,6
72-
--
-14
,845
,557
10,7
69,1
82Se
gmen
t inc
ome
15,5
89,7
53 1
7,08
2,91
6(3
99,6
62)
(481
,737
)12
,238
,735
10,8
26,9
511,
067,
920
2,56
2,90
028
,496
,746
29,9
91,0
30Co
st o
f sal
es a
nd s
ervi
ces
--
--
(10,
594,
189)
(9,4
94,4
23)
(535
,048
)(1
,063
,361
)(1
1,12
9,23
7)(1
0,55
7,78
4)G
ener
al a
nd a
dmin
istr
ativ
e ex
pens
es
(2,1
11,5
69)
(3,2
27,1
61)
(129
,409
)(3
7,07
8)(1
,025
,412
)(1
,155
,165
)(1
,003
,496
)(1
,363
,938
)(4
,269
,886
)(5
,783
,342
)O
pera
ting
(loss
)/pr
ofit
13,4
78,1
8413
,855
,755
(529
,071
)(5
18,8
15)
619,
134
177,
363
(470
,624
)13
5,60
113
,097
,623
13,6
49,9
04
Inte
rest
inco
me,
oth
er in
com
e an
d fo
reig
n ex
chan
ge g
ain/
(loss
)94
5,82
0 (5
72,2
91)
--
16,9
6783
2,01
4-
-96
2,78
725
9,72
3Im
pairm
ents
(2
87,6
05)
- (6
4,25
7)(5
30,1
44)
(37,
159)
(945
,000
)(1
55,1
57)
-(5
44,1
78)
(1,4
75,1
44)
Fina
nce
cost
(908
,311
) (1
,580
,061
)(2
9,01
3)(4
6,32
8)(3
6,68
1)(2
3,26
1)(1
22,7
61)
(160
,802
)(1
,096
,766
)(1
,810
,452
) Se
gmen
t pro
fit/(
loss
) fro
m c
ontin
uing
op
erat
ions
13,2
28,0
8811
,703
,403
(622
,341
)(1
,095
,287
)56
2,26
141
,116
(748
,542
)(2
5,20
1)12
,419
,466
10,6
24,0
31Se
gmen
t (lo
ss)/
profi
t fro
m
disc
ontin
ued
oper
atio
ns-
--
(1,4
56,6
81)
--
--
-(1
,456
,681
)Pr
ofit b
efor
e Za
kat a
nd d
irect
ors’
re
mun
erat
ion
13,2
28,0
8811
,703
,403
(622
,341
)(2
,551
,968
)56
2,26
141
,116
(748
,542
)(2
5,20
1)12
,419
,466
9,16
7,35
0
Ass
ets
83,3
97,2
1780
,916
,834
13,0
83,7
19 1
4,01
2,95
5 7,
169,
772
8,76
3,44
73,
538,
952
4,53
6,83
910
7,18
9,66
010
8,23
0,07
5Li
abili
ties
(27,
463,
115)
(30,
259,
033)
(12,
478)
(739
,512
)(3
,885
,148
)(3
,792
,379
)(2
,213
,372
)(2
,185
,356
)(3
3,57
4,11
3)(3
6,97
6,28
0)N
et A
sset
s55
,934
,102
50,6
57,8
0113
,071
,241
13,2
73,4
433,
284,
624
4,97
1,06
81,
325,
580
2,35
1,48
373
,615
,547
71,2
53,7
95
Noo
r Fin
anci
al In
vest
men
t Com
pany
– K
PSC
and
Subs
idia
ries
Cons
olid
ated
Fin
anci
al S
tate
men
ts31
Dec
embe
r 202
0Ku
wai
t
Not
es to
the
cons
olid
ated
fina
ncia
l sta
tem
ents

105104 Annual Report 2020
Noor Financial Investment Company – KPSC and SubsidiariesConsolidated Financial Statements31 December 2020Kuwait
Noor Financial Investment Company – KPSC and SubsidiariesConsolidated Financial Statements31 December 2020Kuwait
Noor Financial Investment Company - KPSC and Subsidiaries
Geographical Segments
The geographical segments are as follows:
Profit/(loss) before taxes and directors’
remunerations Assets Liabilities
31 Dec 2020
31 Dec 2019
31 Dec 2020
31 Dec 2019
31 Dec 2020
31 Dec 2019
KD KD KD KD KD KD
Domestic and GCC (1,962,925) (1,423,456) 44,027,299 48,388,426 31,346,486 34,883,232
Others 14,382,391 10,590,806 63,162,361 59,841,649 2,227,627 2,093,048
12,419,466 9,167,350 107,189,660 108,230,075 33,574,113 36,976,280
28 Related party transactions
Related parties represent the Ultimate Parent Company, associates, directors and key management personnel of the Group, and other related parties such as subsidiaries of the Ultimate Parent Company (fellow subsidiaries), major shareholders and companies in which directors and key management personnel of the Group are principal owners or over which they are able to exercise significant influence or joint control. Key management personnel include board of directors, chief executive officers (CEO) and principal officers of the Parent Company and its subsidiaries. Pricing policies and terms of these transactions are approved by the Group’s management.
Significant related party transactions and balances included in the consolidated financial statements are as follows:
31 Dec. 2020
31 Dec.2019
KD KD
Consolidated statement of financial position:
Due from related parties and Ultimate Parent Company (refer note 15)
- Due from Ultimate Parent Company - 2,457
- Due from other related parties 18,462 116,844
- Accrued income and management fees 462,515 460,842
Due to related parties (refer note 20)
- Due to Ultimate Parent Company 9,080 -
- Key management personal and other related parties 495,000 452,000
Loans payable to Ultimate Parent Company (note 21) 2,500,000 5,000,000
Transactions with related parties
Proceeds from disposal of subsidiaries (KD 5,890,538 – note 7.3)
- Retained investment property of the disposed subsidiary as a part of the disposal consideration (note 7.3) - 2,890,538
- Cash consideration received (note 7.3) - 3,000,000
Proceeds from disposal of an associate (note 17.2) - 867,038
Disposal of associate to Ultimate Parent Company (note 17.2) - 3,000,000
Investments in related parties
Investments at fair value through profit or loss 1,347 33,971
Investments at FVOCI 6,874,858 8,839,809
Notes to the consolidated financial statements
31 Dec. 2020
31 Dec.2019
KD KD
Consolidated statement of profit or loss
Management and placement fees 3,438 2,941
Finance costs – Ultimate Parent Company 142,040 549,623
Loss on disposal of subsidiaries (note 7.3) - 1,456,681
Gain on disposal of an associate (note 17.2) - 81,322
Compensation of key management personnel of the Group:
Salaries and other short-term benefits 668,596 608,600
Remuneration for committees 330,000 330,000
End of service benefits 26,478 43,773
Board of directors’ remuneration 165,000 120,000
Total key management compensation 1,190,074 1,102,373
29 Summary of financial assets and liabilities by category and fair value measurement
29.1 Categories of financial assets and liabilitiesThe carrying amounts of the Group’s financial assets and liabilities as stated in the consolidated statement of financial position may also be categorized as follows:
31 Dec. 2020
31 Dec.2019
KD KD
Financial assets at amortised cost
• Cash and bank balances 4,133,589 2,580,478
• Short term deposits 6,997,843 5,628,943
• Wakala investments - 1,000,000
• Accounts receivable and other assets (note 15) 4,118,783 4,290,142
15,250,215 13,499,563
Investments at fair value through profit or loss (note 14) 7,599,868 11,704,245
Investments at FVOCI (note 16) 13,240,681 16,168,068
36,090,764 41,371,876
Financial liabilities (at amortised costs) :
• Due to banks (note 12) 333,516 408,598
• Accounts payable and other liabilities (note 20) 9,272,195 8,157,560
• Borrowings (note 21) 22,699,375 27,352,021
32,305,086 35,918,179
29.2 Fair value measurement Fair value represents the price that would be received to sell an asset or paid to transfer a liability in an orderly transaction between market participants at the measurement date. The Group measures financial instruments such as investments at fair value though profit or loss and investments at FVOCI and measurement details are disclosed in note 29.3 to the consolidated financial statements. In the opinion of the Group’s management, except for certain long-term borrowing (refer note 21) the carrying amounts of all other financial assets and liabilities which are carried at amortised costs are considered a reasonable approximation of their fair values.
The Group also measures non-financial assets such as investment properties at fair value at each annual reporting date (refer 29.4).
Notes to the consolidated financial statements
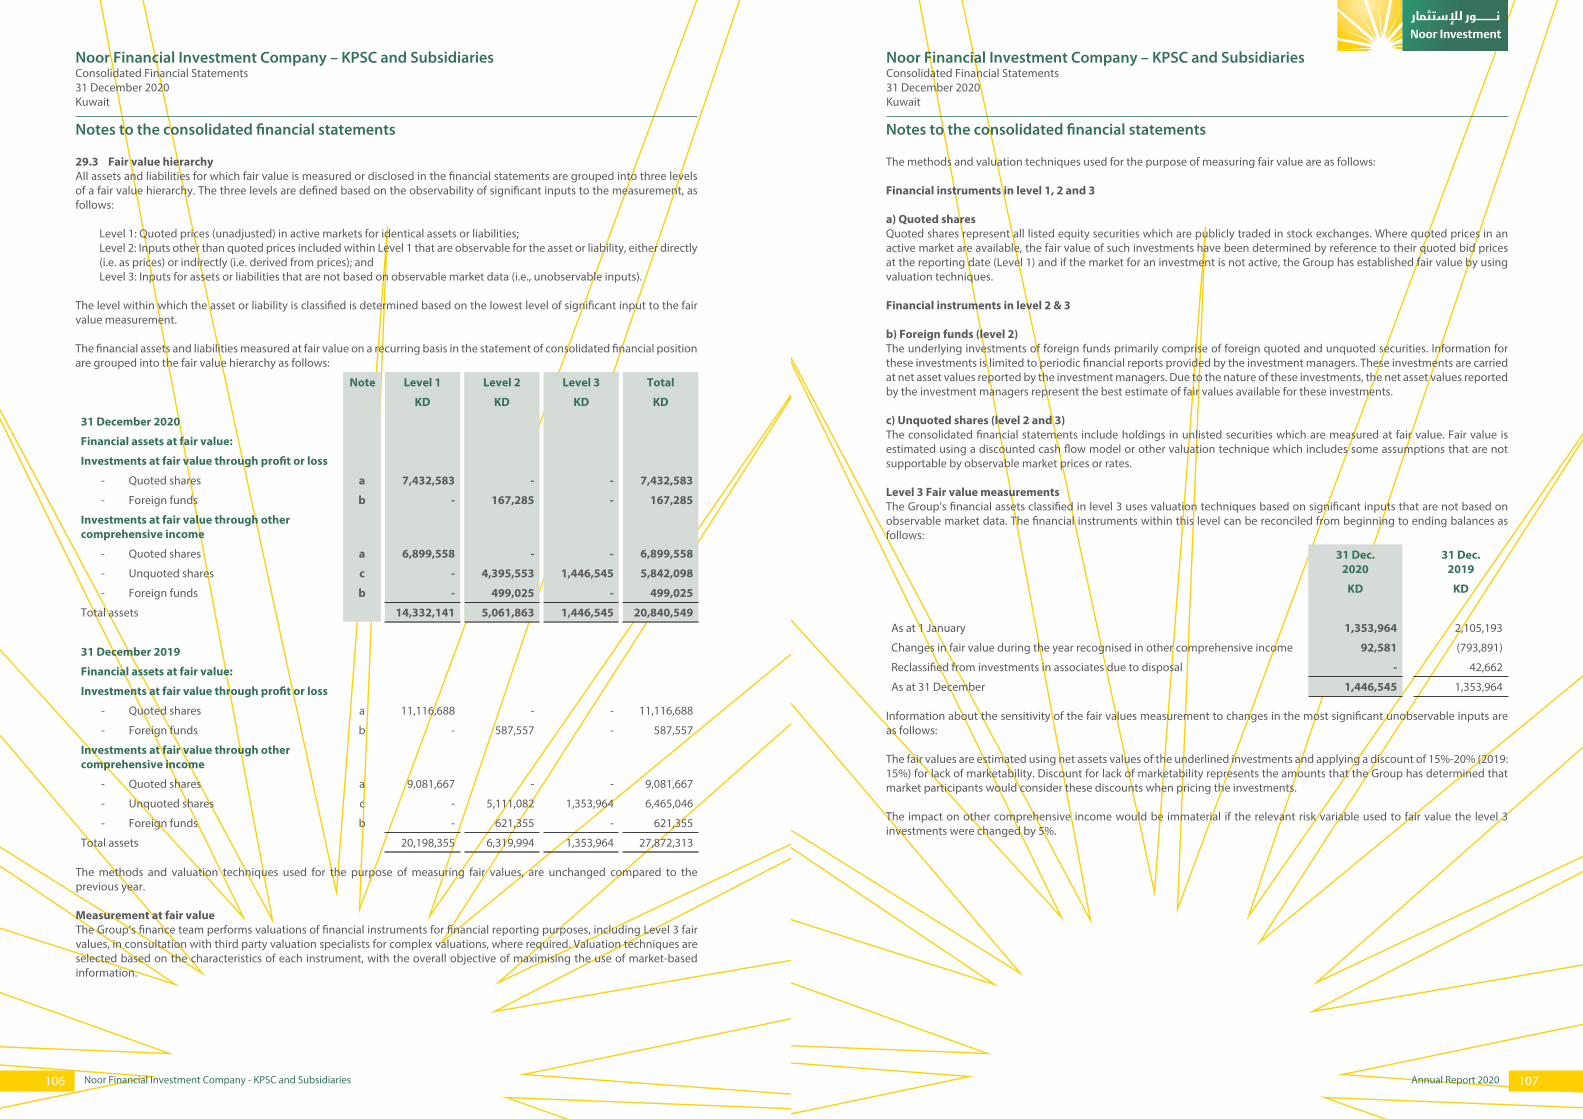
107106 Annual Report 2020
Noor Financial Investment Company – KPSC and SubsidiariesConsolidated Financial Statements31 December 2020Kuwait
Noor Financial Investment Company – KPSC and SubsidiariesConsolidated Financial Statements31 December 2020Kuwait
Noor Financial Investment Company - KPSC and Subsidiaries
29.3 Fair value hierarchyAll assets and liabilities for which fair value is measured or disclosed in the financial statements are grouped into three levels of a fair value hierarchy. The three levels are defined based on the observability of significant inputs to the measurement, as follows:
Level 1: Quoted prices (unadjusted) in active markets for identical assets or liabilities;Level 2: Inputs other than quoted prices included within Level 1 that are observable for the asset or liability, either directly (i.e. as prices) or indirectly (i.e. derived from prices); andLevel 3: Inputs for assets or liabilities that are not based on observable market data (i.e., unobservable inputs).
The level within which the asset or liability is classified is determined based on the lowest level of significant input to the fair value measurement.
The financial assets and liabilities measured at fair value on a recurring basis in the statement of consolidated financial position are grouped into the fair value hierarchy as follows:
Note Level 1 Level 2 Level 3 Total
KD KD KD KD
31 December 2020
Financial assets at fair value:
Investments at fair value through profit or loss
- Quoted shares a 7,432,583 - - 7,432,583
- Foreign funds b - 167,285 - 167,285
Investments at fair value through other comprehensive income
- Quoted shares a 6,899,558 - - 6,899,558
- Unquoted shares c - 4,395,553 1,446,545 5,842,098
- Foreign funds b - 499,025 - 499,025
Total assets 14,332,141 5,061,863 1,446,545 20,840,549
31 December 2019
Financial assets at fair value:
Investments at fair value through profit or loss
- Quoted shares a 11,116,688 - - 11,116,688
- Foreign funds b - 587,557 - 587,557
Investments at fair value through other comprehensive income
- Quoted shares a 9,081,667 - - 9,081,667
- Unquoted shares c - 5,111,082 1,353,964 6,465,046
- Foreign funds b - 621,355 - 621,355
Total assets 20,198,355 6,319,994 1,353,964 27,872,313
The methods and valuation techniques used for the purpose of measuring fair values, are unchanged compared to the previous year.
Measurement at fair valueThe Group’s finance team performs valuations of financial instruments for financial reporting purposes, including Level 3 fair values, in consultation with third party valuation specialists for complex valuations, where required. Valuation techniques are selected based on the characteristics of each instrument, with the overall objective of maximising the use of market-based information.
Notes to the consolidated financial statements
The methods and valuation techniques used for the purpose of measuring fair value are as follows:
Financial instruments in level 1, 2 and 3
a) Quoted sharesQuoted shares represent all listed equity securities which are publicly traded in stock exchanges. Where quoted prices in an active market are available, the fair value of such investments have been determined by reference to their quoted bid prices at the reporting date (Level 1) and if the market for an investment is not active, the Group has established fair value by using valuation techniques.
Financial instruments in level 2 & 3
b) Foreign funds (level 2)The underlying investments of foreign funds primarily comprise of foreign quoted and unquoted securities. Information for these investments is limited to periodic financial reports provided by the investment managers. These investments are carried at net asset values reported by the investment managers. Due to the nature of these investments, the net asset values reported by the investment managers represent the best estimate of fair values available for these investments.
c) Unquoted shares (level 2 and 3)The consolidated financial statements include holdings in unlisted securities which are measured at fair value. Fair value is estimated using a discounted cash flow model or other valuation technique which includes some assumptions that are not supportable by observable market prices or rates. Level 3 Fair value measurements The Group’s financial assets classified in level 3 uses valuation techniques based on significant inputs that are not based on observable market data. The financial instruments within this level can be reconciled from beginning to ending balances as follows:
31 Dec. 2020
31 Dec.2019
KD KD
As at 1 January 1,353,964 2,105,193
Changes in fair value during the year recognised in other comprehensive income 92,581 (793,891)
Reclassified from investments in associates due to disposal - 42,662
As at 31 December 1,446,545 1,353,964
Information about the sensitivity of the fair values measurement to changes in the most significant unobservable inputs are as follows:
The fair values are estimated using net assets values of the underlined investments and applying a discount of 15%-20% (2019: 15%) for lack of marketability. Discount for lack of marketability represents the amounts that the Group has determined that market participants would consider these discounts when pricing the investments.
The impact on other comprehensive income would be immaterial if the relevant risk variable used to fair value the level 3 investments were changed by 5%.
Notes to the consolidated financial statements

109108 Annual Report 2020
Noor Financial Investment Company – KPSC and SubsidiariesConsolidated Financial Statements31 December 2020Kuwait
Noor Financial Investment Company – KPSC and SubsidiariesConsolidated Financial Statements31 December 2020Kuwait
Noor Financial Investment Company - KPSC and Subsidiaries
29.4 Fair value measurement of non-financial assetsThe following table shows the information regarding the level 3 fair value measurements of investment properties:
Description and Valuation technique Significant unobservable inputs
Range of unobservable inputs
2020 2019
Yield Method
Commercial Building in Kuwait Estimated market price for land (per sqm) KD7,350 KD7,250
Average monthly rent (per sqm) KD5.47 KD5.63
Yield rate 7.26% 7.54%
Investment Building in Kuwait Estimated market price for land (per sqm) KD950 KD1,050
Average monthly rent (per sqm) KD3.86 KD3.86
Yield rate 8.29% 7.49%
Building in UAE Vacancy rate 15% 15%
Average monthly rent (per sqm) KD1.36 KD2.53
Yield rate 9% 10%
Building in UK Average monthly rent (per sqm) KD19.03 KD18.33
Yield rate 6.89% 6.89%
Market Approach
Land in Kuwait Estimated market price for land (per sqm) KD1,100 KD1,150
Land in Jordan Estimated market price for land (per sqm) KD55.3 KD55.2
Buildings in Kuwait represent rental properties on freehold land categorized as “Investment Lands” (i.e. land which can be used to construct multiple residential unit buildings, commercial units apartments, villas, Duplex and Studios. The fair value of the investment property has been determined based on valuations obtained from independent valuators, who are specialized in valuing these types of investment properties. The significant inputs and assumptions are developed in close consultation with management.
One of these valuators is a local bank (for local investment properties) who has valued the investment properties using primarily two methods, one of which is the yield method and other being a combination of the market comparison approach for the land and cost minus depreciation approach for the buildings. The other valuator who is a local/foreign reputable valuator has also valued the investment properties primarily by using a combination of the methods noted above. When the market comparison approach is used adjustments have been incorporated for factors specific to the land in question, including plot size, location, construction/development cost and current use. For the valuation purpose for properties in Kuwait, the Group has selected the lower value of the two valuations (2019: lower of two valuations).
Notes to the consolidated financial statements
30 Risk management objectives and policies
The Group’s principal financial liabilities comprise of borrowings, due to banks and accounts payable and other liabilities. The main purpose of these financial liabilities is to raise finance for the Group’s operations.
The Group has various financial assets such as accounts receivable and other assets, cash and bank balances, short term deposits, wakala investments and investment securities which arise directly from operations.
The Group’s activities expose it to a variety of financial risks: market risk (including currency risk, interest rate risk and price risk), credit risk and liquidity risk.
The Parent Company’s Board of Directors sets out policies for managing each of these risks as discussed below.
The Group does not use derivative financial instruments.
30.1 Market riskThe significant financial risks to which the Group is exposed to are described below:
a) Foreign currency riskForeign currency risk is the risk that the fair values or future cash flows of a financial instrument will fluctuate due to changes in foreign exchange rates.
The Group mainly operates in the Middle East and few Asians countries and is exposed to foreign currency risk arising from various foreign currency exposures, primarily with respect to US Dollar and UAE Dirham. The Parent Company’s consolidated statement of financial position can be affected by the movement in these currencies. To mitigate the Group’s exposure to foreign currency risk, non-Kuwaiti Dinar cash flows are monitored.
Generally, the Group’s risk management procedures distinguish short-term foreign currency cash flows (due within twelve months) from longer-term cash flows. Foreign currency risk is managed on the basis of limits determined by the Parent Company’s board of directors and a continuous assessment of the Groups’ open positions.
The Group’s significant net exposure to foreign currency denominated monetary assets less monetary liabilities at the reporting date, translated into Kuwaiti Dinars at the closing rates are as follows:
2020Equivalent
KD
2019Equivalent
KD
US Dollar 488,100 1,444,835
UAE Dirhams 25,810 144,635
Exposures to foreign exchange rates vary during the year depending on the volume and nature of the transactions. Nonetheless, a reasonable possible change in exchanges rates of the foreign currencies noted above would not have a significant impact on the Group’s consolidated profit or loss.
b) Interest rate riskInterest rate risk arises from the possibility that changes in interest rates will affect future cash flows or the fair values of financial instruments. The Group is exposed to interest rate risk with respect to due to banks and borrowings which are at floating interest rates. The risk is managed by the Group by maintaining an appropriate mix between fixed and floating rate short term deposits and borrowings.
Positions are monitored regularly to ensure positions are maintained within established limits.
Notes to the consolidated financial statements
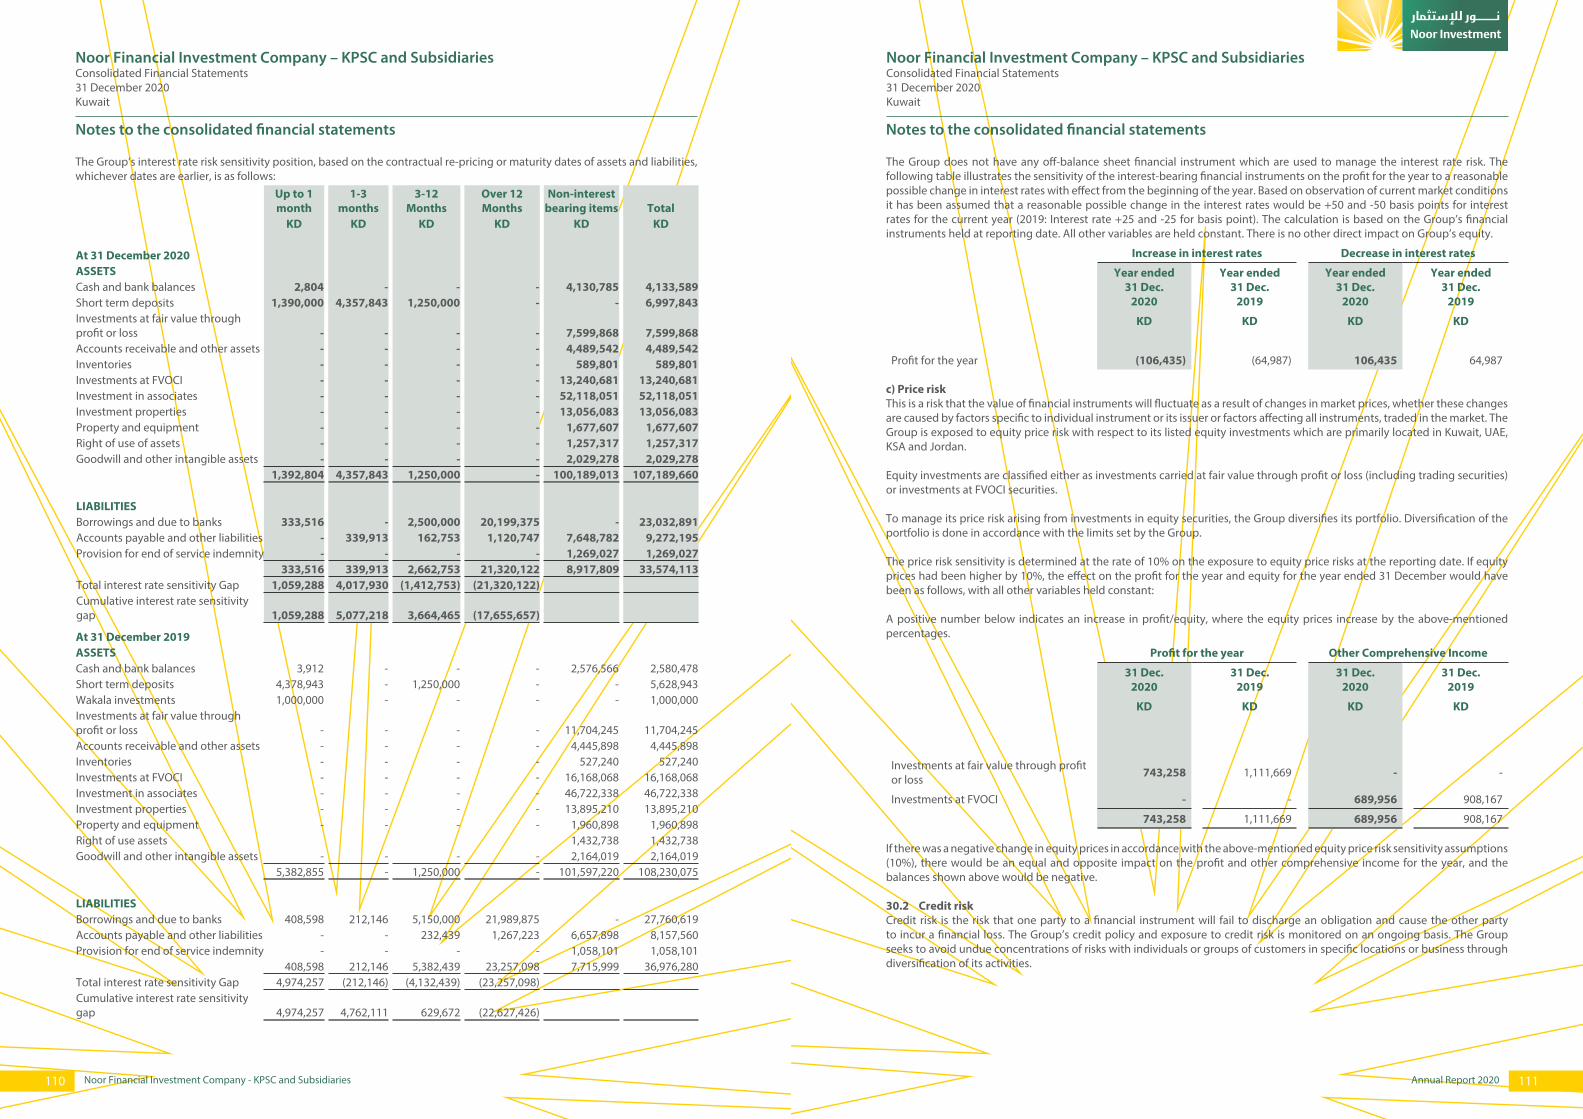
111110 Annual Report 2020
Noor Financial Investment Company – KPSC and SubsidiariesConsolidated Financial Statements31 December 2020Kuwait
Noor Financial Investment Company – KPSC and SubsidiariesConsolidated Financial Statements31 December 2020Kuwait
Noor Financial Investment Company - KPSC and Subsidiaries
The Group’s interest rate risk sensitivity position, based on the contractual re-pricing or maturity dates of assets and liabilities, whichever dates are earlier, is as follows:
Up to 1 month
1-3months
3-12Months
Over 12Months
Non-interest bearing items Total
KD KD KD KD KD KD
At 31 December 2020ASSETSCash and bank balances 2,804 - - - 4,130,785 4,133,589Short term deposits 1,390,000 4,357,843 1,250,000 - - 6,997,843Investments at fair value through profit or loss - - - - 7,599,868 7,599,868Accounts receivable and other assets - - - - 4,489,542 4,489,542Inventories - - - - 589,801 589,801Investments at FVOCI - - - - 13,240,681 13,240,681Investment in associates - - - - 52,118,051 52,118,051Investment properties - - - - 13,056,083 13,056,083Property and equipment - - - - 1,677,607 1,677,607Right of use of assets - - - - 1,257,317 1,257,317Goodwill and other intangible assets - - - - 2,029,278 2,029,278
1,392,804 4,357,843 1,250,000 - 100,189,013 107,189,660
LIABILITIESBorrowings and due to banks 333,516 - 2,500,000 20,199,375 - 23,032,891Accounts payable and other liabilities - 339,913 162,753 1,120,747 7,648,782 9,272,195Provision for end of service indemnity - - - - 1,269,027 1,269,027
333,516 339,913 2,662,753 21,320,122 8,917,809 33,574,113Total interest rate sensitivity Gap 1,059,288 4,017,930 (1,412,753) (21,320,122)Cumulative interest rate sensitivity gap 1,059,288 5,077,218 3,664,465 (17,655,657)
At 31 December 2019ASSETSCash and bank balances 3,912 - - - 2,576,566 2,580,478 Short term deposits 4,378,943 - 1,250,000 - - 5,628,943 Wakala investments 1,000,000 - - - - 1,000,000 Investments at fair value through profit or loss - - - - 11,704,245 11,704,245 Accounts receivable and other assets - - - - 4,445,898 4,445,898Inventories - - - - 527,240 527,240 Investments at FVOCI - - - - 16,168,068 16,168,068 Investment in associates - - - - 46,722,338 46,722,338 Investment properties - - - - 13,895,210 13,895,210Property and equipment - - - - 1,960,898 1,960,898 Right of use assets 1,432,738 1,432,738 Goodwill and other intangible assets - - - - 2,164,019 2,164,019
5,382,855 - 1,250,000 - 101,597,220 108,230,075
LIABILITIESBorrowings and due to banks 408,598 212,146 5,150,000 21,989,875 - 27,760,619Accounts payable and other liabilities - - 232,439 1,267,223 6,657,898 8,157,560Provision for end of service indemnity - - - - 1,058,101 1,058,101
408,598 212,146 5,382,439 23,257,098 7,715,999 36,976,280Total interest rate sensitivity Gap 4,974,257 (212,146) (4,132,439) (23,257,098)Cumulative interest rate sensitivity gap 4,974,257 4,762,111 629,672 (22,627,426)
Notes to the consolidated financial statements
The Group does not have any off-balance sheet financial instrument which are used to manage the interest rate risk. The following table illustrates the sensitivity of the interest-bearing financial instruments on the profit for the year to a reasonable possible change in interest rates with effect from the beginning of the year. Based on observation of current market conditions it has been assumed that a reasonable possible change in the interest rates would be +50 and -50 basis points for interest rates for the current year (2019: Interest rate +25 and -25 for basis point). The calculation is based on the Group’s financial instruments held at reporting date. All other variables are held constant. There is no other direct impact on Group’s equity.
Increase in interest rates Decrease in interest rates
Year ended31 Dec.
2020
Year ended31 Dec.
2019
Year ended31 Dec.
2020
Year ended31 Dec.
2019
KD KD KD KD
Profit for the year (106,435) (64,987) 106,435 64,987
c) Price riskThis is a risk that the value of financial instruments will fluctuate as a result of changes in market prices, whether these changes are caused by factors specific to individual instrument or its issuer or factors affecting all instruments, traded in the market. The Group is exposed to equity price risk with respect to its listed equity investments which are primarily located in Kuwait, UAE, KSA and Jordan.
Equity investments are classified either as investments carried at fair value through profit or loss (including trading securities) or investments at FVOCI securities.
To manage its price risk arising from investments in equity securities, the Group diversifies its portfolio. Diversification of the portfolio is done in accordance with the limits set by the Group.
The price risk sensitivity is determined at the rate of 10% on the exposure to equity price risks at the reporting date. If equity prices had been higher by 10%, the effect on the profit for the year and equity for the year ended 31 December would have been as follows, with all other variables held constant:
A positive number below indicates an increase in profit/equity, where the equity prices increase by the above-mentioned percentages.
Profit for the year Other Comprehensive Income
31 Dec.2020
31 Dec.2019
31 Dec.2020
31 Dec.2019
KD KD KD KD
Investments at fair value through profit or loss 743,258 1,111,669 - -
Investments at FVOCI - - 689,956 908,167
743,258 1,111,669 689,956 908,167
If there was a negative change in equity prices in accordance with the above-mentioned equity price risk sensitivity assumptions (10%), there would be an equal and opposite impact on the profit and other comprehensive income for the year, and the balances shown above would be negative.
30.2 Credit riskCredit risk is the risk that one party to a financial instrument will fail to discharge an obligation and cause the other party to incur a financial loss. The Group’s credit policy and exposure to credit risk is monitored on an ongoing basis. The Group seeks to avoid undue concentrations of risks with individuals or groups of customers in specific locations or business through diversification of its activities.
Notes to the consolidated financial statements

113112 Annual Report 2020
Noor Financial Investment Company – KPSC and SubsidiariesConsolidated Financial Statements31 December 2020Kuwait
Noor Financial Investment Company – KPSC and SubsidiariesConsolidated Financial Statements31 December 2020Kuwait
Noor Financial Investment Company - KPSC and Subsidiaries
The Group’s exposure to credit risk is limited to the carrying amounts of financial assets recognised at the reporting date, as summarized below:
31 Dec.2020
31 Dec.2019
KD KD
Bank balances 4,129,799 2,579,516
Short term deposits 6,997,843 5,628,943
Wakala investments - 1,000,000
Accounts receivable and other assets (refer note 16) 4,489,542 4,290,142
Investments at FVTPL 167,285 587,557
Investments at FVOCI 499,025 621,355
16,283,494 14,707,513
Except for the wakala investment referred to in note 13 and accounts receivable and other assets referred to in note 15, none of the above financial assets are past due or impaired. The Group continuously monitors defaults of customers and other counterparty, identified either individually or by group, and incorporates this information into its credit risk controls. Where available at reasonable cost, external credit ratings and/or reports on customers and other counterparties are obtained and used. The Group’s policy is to deal only with creditworthy counterparties. The Group’s management considers that all the above financial assets that are neither past due nor impaired, review are of good credit quality.
None of the Group’s financial assets are secured by collateral or other credit enhancements.
In respect of receivables, the Group is not exposed to any significant credit risk exposure to any single counterparty. The credit risk for cash and bank balances, short term deposits and amounts due from related parties is considered negligible, since the counterparties are reputable financial institutions/entities with high credit quality. Information on other significant concentrations of credit risk is set out in note 30.3.
30.3 Concentration of financial assets and liabilities The distribution of financial assets and financial liabilities by geographic region is as follows:
Kuwait Middle EastAsia & Africa
Europe & USA Total
KD KD KD KD KD
At 31 December 2020
Cash and bank balances 3,316,579 814,513 2,497 - 4,133,589
Short term deposits 6,997,843 - - - 6,997,843
Investments at fair value through profit or loss 3,607,799 3,693,093 298,976 - 7,599,868
Accounts receivable and other assets (note 15) 3,728,055 266,526 470,144 24,817 4,489,542
Investments at FVOCI 8,060,013 3,650,045 1,336,421 194,202 13,240,681
25,710,289 8,424,177 2,108,038 219,019 36,461,523
Due to banks 333,516 - - - 333,516
Accounts payable and other liabilities 7,044,568 2,220,117 - 7,510 9,272,195
Borrowings 22,699,375 - - - 22,699,375
30,077,459 2,220,117 - 7,510 32,305,086
Notes to the consolidated financial statements
Kuwait Middle EastAsia & Africa
Europe & USA Total
KD KD KD KD KDAt 31 December 2019Cash and bank balances 1,987,563 591,297 1,618 - 2,580,478 Short term deposits 5,628,943 - - - 5,628,943 Wakala investments 1,000,000 - - - 1,000,000 Investments at fair value through profit or loss 6,875,479 4,072,482 756,284 - 11,704,245 Accounts receivable and other assets (note 15) 3,283,798 531,573 459,946 14,825 4,290,142Investments at FVOCI 10,085,778 3,664,833 2,184,687 232,770 16,168,068
28,861,561 8,860,185 3,402,535 247,595 41,371,876
Due to banks 408,598 - - - 408,598 Accounts payable and other liabilities 6,072,566 2,084,230 - 764 8,157,560 Borrowings 27,352,021 - - - 27,352,021
33,833,185 2,084,230 - 764 35,918,179
30.4 Liquidity riskLiquidity risk is the risk that the Group will be unable to meet its liabilities when they fall due. To limit this risk, management has arranged diversified funding sources, manages assets with liquidity in mind, and monitors liquidity on a daily basis.
The table below summarises the maturity profile of the Group’s assets and liabilities. Except for investments carried at fair value through profit or loss and fair value through other comprehensive income investments, the maturities of assets and liabilities have been determined on the basis of the remaining period from the reporting date to the contractual maturity date.
The maturity profile for investments carried at fair value through profit or loss, fair value through other comprehensive income and investment properties is determined based on management’s estimate of liquidation of those investments.
Maturity profile of assets and liabilities are as follows:
1 year Over 1 year TotalKD KD KD
At 31 December 2020ASSETSCash and bank balances 4,133,589 - 4,133,589Short term deposits 6,997,843 - 6,997,843Investment at fair value through profit or loss 7,599,868 - 7,599,868Accounts receivable and other assets 4,489,542 - 4,489,542Inventories 589,801 - 589,801Investments at FVOCI 1,030,900 12,209,781 13,240,681Investment in associates - 52,118,051 52,118,051Investment properties 1,769,253 11,286,830 13,056,083Property and equipment - 1,677,607 1,677,607Right of use of assets - 1,257,317 1,257,317Goodwill and other intangible assets - 2,029,278 2,029,278
26,610,796 80,578,864 107,189,660
LIABILITIES
Accounts payable and other liabilities 8,151,448 1,120,747 9,272,195
Due to banks 333,516 - 333,516
Borrowings 2,500,000 20,199,375 22,699,375
Provision for end of service indemnity - 1,269,027 1,269,027
10,984,964 22,589,149 33,574,113
Notes to the consolidated financial statements

115114 Annual Report 2020
Noor Financial Investment Company – KPSC and SubsidiariesConsolidated Financial Statements31 December 2020Kuwait
Noor Financial Investment Company – KPSC and SubsidiariesConsolidated Financial Statements31 December 2020Kuwait
Noor Financial Investment Company - KPSC and Subsidiaries
1 year Over 1 year TotalKD KD KD
At 31 December 2019
ASSETS
Cash and bank balances 2,580,478 - 2,580,478
Short term deposits 5,628,943 - 5,628,943
Wakala investments 1,000,000 - 1,000,000
Investment at fair value through profit or loss 11,704,245 - 11,704,245
Accounts receivable and other assets 4,445,898 - 4,445,898
Inventories 527,240 - 527,240
Investments at FVOCI 1,731,635 14,436,433 16,168,068
Investment in associates - 46,722,338 46,722,338
Investment properties 2,564,930 11,330,280 13,895,210
Property and equipment - 1,960,898 1,960,898
Right of use of assets - 1,432,738 1,432,738
Goodwill and other intangible assets - 2,164,019 2,164,019
30,183,369 78,046,706 108,230,075
LIABILITIES
Accounts payable and other liabilities 6,890,337 1,267,223 8,157,560
Due to banks 408,598 - 408,598
Borrowings 5,362,146 21,989,875 27,352,021
Provision for end of service indemnity - 1,058,101 1,058,101
12,661,081 24,315,199 36,976,280
The contractual maturity of financial liabilities based on undiscounted cash flows is as follows:
Up to 1month
1-3Months
3-12months
1-5years Total
31 December 2020 KD KD KD KD KD
Financial liabilities
Accounts payable and other liabilities - - 6,479,121 1,120,747 7,599,868
Borrowings and due to banks 146 522,156 3,066,801 21,532,188 25,121,291
146 522,156 9,545,922 22,652,935 32,721,159
31 December 2019
Financial liabilities
Accounts payable and other liabilities - - 6,890,337 1,267,223 8,157,560
Borrowings and due to banks 408,598 471,724 6,122,425 24,634,569 31,637,316
408,598 471,724 13,012,762 25,901,792 39,794,876
31 Capital risk management
The Group’s capital risk management objectives are to ensure that the Group maintains a strong credit rating and healthy ratios in order to support its business and maximise shareholder value.
The Group manages the capital structure and makes adjustments in the light of changes in economic conditions and risk characteristics of the underlying assets. In order to maintain or adjust the capital structure, the Group may adjust the number of dividends paid to sahareholders, buy back shares, issue new shares or sell assets to reduce debt. See note 22.
Notes to the consolidated financial statements
The Parent Company is required to maintain a minimum share capital of KD15 million as it is registered as an investment company regulated by the Central Bank of Kuwait.
The capital structure of the Group consists of the following:
31 Dec.2020
31 Dec.2019
KD KD
Borrowings (refer note 21) 22,699,375 27,352,021
Less: Cash and cash equivalents (refer note 12) (9,541,926) (6,544,833)
Net debt 13,157,449 20,807,188
Total equity 73,615,547 71,253,795
Consistent with others in the industry, the Group monitors capital on the basis of the gearing ratio.
This ratio is calculated as net debt divided by total equity as follows:
31 Dec.2020
KD
31 Dec.2019
KD
Net debt 13,157,449 20,807,188
Total equity 73,615,547 71,253,795
Net debt to total equity ratio 18% 29%
32 Fiduciary assets
The Group manages mutual funds and portfolios on behalf of its Ultimate Parent Company, other related parties and outsiders, and maintains securities in fiduciary accounts which are not reflected in the Group’s consolidated statement of financial position. Assets under management at 31 December 2020 amounted to KD25,301,493 (2019: KD26,986,404) of which assets managed on behalf of its Ultimate Parent Company and other related parties amounted to KD19,415,735 (2019: KD19,681,561).
33 Contingent liabilities and capital commitments
Contingent liabilitiesOn 1 December 2011, the Parent Company’s Jordanian subsidiary, Noor Jordanian Kuwaiti Financial Investment Company Limited (“the Seller”) disposed of its entire equity interest in one of its Jordanian subsidiaries (Noor Jordan Kuwait Transport Company JSCC) to nine individual buyers (“the Buyers”). Subsequent to the transfer of shares and control to the Buyers, they have filed a case against the seller claiming misrepresentation in valuing subsidiary assets at JD4,500,000 (KD1,924,718). The subsidiary’s management and legal advisor believe that the favourable decision of the court is probable; hence, no provision for any effects that may result has been made in the consolidated financial statements.
Capital commitmentsAt the reporting date the Group had commitments of KD Nil towards purchase of investments and development of investment properties (2019: KD1,038,605) and guarantees amounting to KD3,786,114 (2019: KD1,169,544).
Notes to the consolidated financial statements

117116 Annual Report 2020
Noor Financial Investment Company – KPSC and SubsidiariesConsolidated Financial Statements31 December 2020Kuwait
Noor Financial Investment Company – KPSC and SubsidiariesConsolidated Financial Statements31 December 2020Kuwait
Noor Financial Investment Company - KPSC and Subsidiaries
34 Reconciliation of liabilities arising from financing activities
The changes in the Group’s liabilities arising from financing activities can be classified as follows:
BorrowingsDue after one
year
Borrowingsdue within one
yearTotal
KD KD KD
1 January 2020 21,989,875 5,362,146 27,352,021
Cash flows:
- Repayment (1,790,500) (2,862,146) (4,652,646)
31 December 2020 20,199,375 2,500,000 22,699,375
1 January 2019 38,249,950 10,859,127 49,109,077
Cash flows:
- Repayment (1,110,000) (8,926,981) (10,036,981)
Non-cash
- In kind settlement (3,000,000) - (3,000,000)
- Reclassification (5,200,000) 5,200,000 -
- Disposal of subsidiary (6,950,075) (1,770,000) (8,720,075)
31 December 2019 21,989,875 5,362,146 27,352,021
35 Effect of COVID 19
The outbreak of Coronavirus (“COVID19”) pandemic and related global responses have caused material disruptions to businesses around the world, leading to an economic slowdown. Governments worldwide imposed travel bans and strict quarantine measures in order to slow the spread of Covid-19. Business are dealing with lost revenue and disrupted supply chains. While the country has started to ease the lockdown, the relaxation has been gradual. Global and local equity markets have experienced significant volatility and weakness. While governments and central banks have reacted with various financial packages and reliefs designed to stabilise economic conditions, the duration and extent of the impact of the COVID19 outbreak remains unclear at this time.
Further, during the year, the Group received an aggregate amount of KD 167,031 as Covid-19 support towards staff expenses from the Government of Kuwait.
Management has updated its assumptions with respect to judgements and estimates on various account balances which may be potentially impacted due to continued uncertainties in the volatile economic environment in which the Group conducts its operations. The reported amounts best represent management’s assessment based on observable information. Markets, however, remain volatile and asset carrying values remain sensitive to market fluctuations.
Management is aware that a continued and persistent disruption could negatively impact the financial position, performance and cash flows of the Group in the future. Management continues to closely monitor the market trends, its supply-chain, industry reports and cash flows to minimise any negative impact on the Group.
36 Merger with a subsidiary
The Board of Directors of the Parent Company in the meeting held on 18 November 2019 approved, in principle, to offer one of its subsidiaries, Noor Telecommunication Holding Company KSCC (merged entity), to merge by way of amalgamation with the Parent Company (merging entity), as stipulated in the CMA regulations bylaw Chapter 9 (Acquisition and Merger) of law No.7.
Notes to the consolidated financial statements
Further, the Board of Directors in the meeting held on 9 December 2020, approved to submit the revised documents including advisors reports to the regulatory authorities in order to obtain the related approvals. Further, the Board of Directors of the Parent Company approved the swap ratio and revised capital structure. The Parent Company received approval of the Capital Market Authority for the merger on 31 December 2020. In order to continue the merger process, the Board of Directors of the Parent Company recommended during the month of December 2020 to reduce share capital of the Parent Company by KD 1,333,549 through cancellation of 13,335,499 treasury shares and to issue 13,335,499 new shares at Fills 100 per share to the non-controlling interest holders of the merged entity on completion of the merger subject to regulatory and shareholders approvals.
As a result of the proposed merger and subject to the other approvals of regulatory authorities and the shareholders of both the merging entities, the shareholders of the merged entity are expected to receive shares of the Parent Company.
37 Comparative amounts
Certain comparative amounts have been reclassified to conform to the presentation in the current year. Such reclassification does not affect previously reported net assets, net equity, net results for the year or net increase in cash and cash equivalents.
Notes to the consolidated financial statements