nordea helsinki 13 05 - norskeskog.com · norske skog nordea paper seminar helsinki 13 may 2008...
TRANSCRIPT

Norske Skog
Nordea Paper Seminar Helsinki 13 May 2008
Andreas Enger, CFO

2
Content
Overview and result 1Q 2008Strategic focus and recent actionsCosts and market fundamentals

3
Norske Skog headlines
World’s second largest producer
of newsprint, fourth largest of
magazine paper:
19 mills in 14 countries
Capacity: 6.5 mill. tonnes (6 mill.
tonnes after closures in 2008)
Revenue (2007) ~ NOK 27.1 billion

4
Main activities in first quarter
Increased focus on portfolio restructuring to reduce debtMeasures to improve operating rate by closing overcapacityReducing headquarter costHalting the Pisa PM2 projectContinued efforts on operational improvements

5
Measures to improve operating rate
Steti will be closed end of May 2008Capacity reduction of 130 000 t/yVolumes transferred to Golbey and Parenco
Follum PM2 will be stopped end ofJune 2008
Capacity reduction of 130 000 t/yMost volumes transferred to Skogn and Parenco
Cheongwon will close end 2008Capacity reduction of 190 000 t/yOptimizing Asian production structure
*= Target end 2008

6
Profitable to shut down capacity
▪ Moving production to the most profitable units
▪ Removing fixed costs at shut-down plants
▪ Reducing costs per tonne for the group
▪ Total profit improvement for newsprint in Europe of approx. NOK 400 million
Changes in European mills operating results after shut-downs
-150
-100
-50
0
50
100
150
200
250
300
Steti
Follum
Skogn Parenco Golbey Bruck
MNOK/year

7
Q1 2008 in brief
EBITDA NOK 489 mill(NOK 778 mill, Q4 2007)
Underlying gross operating earnings NOK 634 mill (NOK 926 mill)
including realised gains on cash flow hedging
Pre tax profit –NOK 1 108 mill(-NOK 82 mill)
including NOK 1 254 mill in impairments
Cash flow from operations NOK 832 mill(NOK 521 mill)
Weak results in all segmentsImprovement in magazine paper

8
Gross operating margins by region
12,4 %
25,2 %
10,9 %
20,0 %
5,0 %
0,0 %
5,0 %
10,0 %
15,0 %
20,0 %
25,0 %
30,0 %
Q4 07Q1 089,3 %
14,7 %
7,0 %
0,7 %
10,2 %
Newsprint Europe Newsprint Australasia
Newsprint Asia Newsprint South America
Magazine Europe

9
Balance sheet and cash flow
0,931,051,12Gearing
4,6 %0,7 %0,2 %ROCE
16 61116 40815 742Net interest-bearing debt
44 54043 26042 108Total assets
2,16(0,36)2,81Free cash flow per share
(199)(599)(390)Investments in operational fixed assets
607521832Net cash flow from operating activities
Q1 2007Q4 2007Q1 2008Million NOK

10
The debt situation
2008: Mainly local debt in Asia2009: Mainly NOK bonds2010: Bank debt, with covenants2011: USD bonds2017: Euro bonds31.03.2008:
Cash & cash equivalents: NOK 2 bnUndrawn credit facilities: NOK 6 bn (with covenants)Gearing: 1.12; should not exceed 1.4
1
4,1
1
1,2
3,3
4,5
1,5
1
0 1 2 3 4 5
2033
2017-19
2015-16
2012-14
2011
2010
2009
2008
Debt maturity schedule, 31. 03.2008
NOK billion

Strategic focus and recent actions

12
Skogn
SaugbrugsFollum
Golbey
Parenco WalsumSteti
Bruck
MNI (34%)
Sing Buri
Shanghai
Hebei
ChongwonJeonju
Albury
Boyer
Tasman Bio Bio
Pisa
Industrial strategy in four regions
Capacity management, Capacity management, restructuring and restructuring and consolidation in Europeconsolidation in Europe
Growth, restructuring Growth, restructuring and consolidation in Asiaand consolidation in Asia
Capitalize on our strong Capitalize on our strong position in Australasiaposition in Australasia
Participate in a Participate in a growth market growth market

13
Actions to realize significant values in 2008
Structured review of Norske Skog’s portfolioMillsOther assets (power contracts)
Work has started to sell properties not related to production activities
Corporate headquarter announced for sale New Zealand harbour area/warehouse sold

14
Actions to reduce costs
Closure of 450.000 tonnes of capacityReduced fixed costs by NOK 250 mill.Increased contribution by NOK 250 mill.
Reduce corporate administration cost by at least NOK 150 mill.
Substantially downsize the corporate headquarterReorganise corporate management
Continue the profit improvement programTarget: NOK 3 billion by 2008Implementing best practise globallyEstablish permanent improvement culture

15
Taking lead in climate change actions
Climate change target:Reducing emissions of green house gases by 25 percent in 2020
A good start in 2007:Emissions fell by 3 percentPhasing in bio-energyFocus on energy saving processes
Participating in 3C Combat Climate ChangeGlobal action for rapid and cost effective transition to low emission economy

16
Customers care about the environment
John HartiganChairman and chief executiveNews Limited
“...the biggest single step in carbon reduction by any of our partners to date”

Increasing costs and market fundamentals

18
Fighting increasing costs
Variable cost pr ton: + 35 %
Average sales price: - 2 %
Indexed with100 as startingpoint in 2002.
80
90
100
110
120
130
140
2002 2003 2004 2005 2006 2007
Fixed costs are reduced by 22 %
Totale costs + 12 %

19
38 % (14%)
29 % (11%)22 % (8%)
11 % (4%)
Total cost breakdown - 2007
Raw materials37 %
Energy17 %
Labour cost10 %
Other cost14 %
Depreciation12 %
Distribution10 %
Raw materials
Total cost
Wood
Recovered paper
Kraft pulp
Chemicals etc.

20
39 %
24 %
25 %
11 % 1 %Norway
Continental Europe
Australasia
South America
Asia
Wood consumption 2007
68 %
32 %
RoundwoodChips
Wood consumption ~ 6,6 mill. m3

21
The global newsprint market
Australasia
• Stable demand• Limited imports• Prices falling due to USD
development• Good cash flow
2000 2008
South America
• Increasing demand
• Import region• Good access to
raw materials• Strong cost
pressure
2000 2008
The graphs show the development in demand for newsprint in the individual regions in 2000 and 2008
North America
• Dramatic dip in newsprint consumption
• Large-scale shut-downs have improved market balance
• Price increase of more than 10 per cent
• Consolidation and continued capacity curtailments
2000 2008
• The world’ s largest newsprint market
• Great growth potential• Demand and prices rising
Asia
2000 2008
2000 2008
Europe Newsprint
• Import pressure• Prices falling• Implementing capacity
curtailments to improve prices• Need for restructuring Magazine paper:• Greatly improved market balance
following capacity curtailments• Significant price increase

22
Global demand development (Q1 08 vs. Q1 07 - Partly based on preliminary statistics)
Better supply & demand balance- 0.7%World – Std News
Increased consumption, but also customer stock building+14.7%South Am – Std News
Stock variations-11.7%Australasia – Std News
Strong growth in China and India+4.6%Asia (ex Japan) – Std News
Still tight marked, but the heat is off+ 1.3%Europe – Magazine
Easter 2008 was in March, versus April last year-3.5%Europe – Std News
Down, but less than 2007-5.7%North America Std News
CommentsChange from
Q1 07 to Q1 08Region and product
23
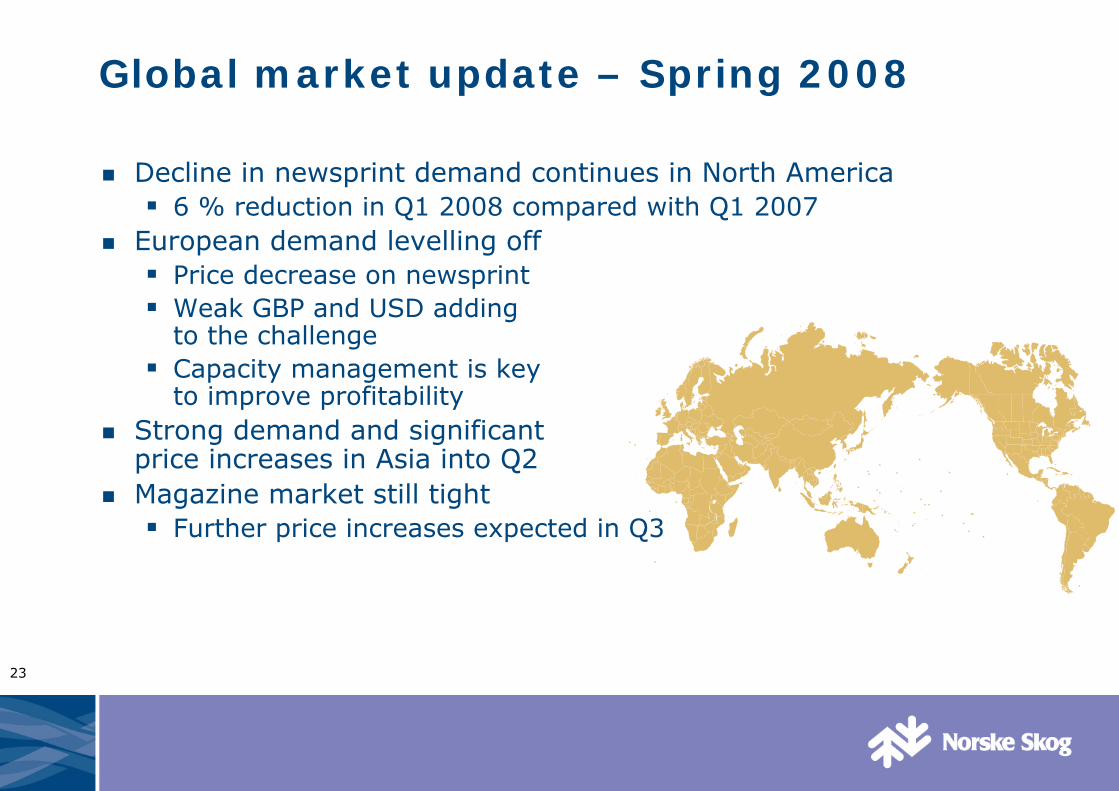
Global market update – Spring 2008
Decline in newsprint demand continues in North America6 % reduction in Q1 2008 compared with Q1 2007
European demand levelling offPrice decrease on newsprintWeak GBP and USD adding to the challengeCapacity management is key to improve profitability
Strong demand and significant price increases in Asia into Q2Magazine market still tight
Further price increases expected in Q3

24
Newsprint market in Asia & China
Strong growth in many Asian countries, expected to continueAnnounced projects are on holdLong term potential in China
Growth driven by increase in readership and GDPStrong growth despite restrictions on advertising and editorial writingLarge number of small and inefficient newsprint mills – closure of capacity and productions of other grades is happening
Prices up 10 per cent 1Q 2008 in ChinaPrices up 20 per cent in Hong Kong and Singapore 2Q 2008
Daily Copies Sold in the 5 Largest Markets
Regional Per Capita Newsprint Consumption
Source: World Association of Newspapers.
Source: PPPC, research reports.
100
7970
53
22
0
20
40
60
80
100
120
China India Japan USA Germany
Cop
ies
sold
M
Asia (ex Japan) Newsprint Deliveries ('000 tonnes)
4,000
5,000
6,000
7,000
8,000
9,000
10,000
2003 2004 2005 2006 2007

25
Presence in China of strategic value
Only Western company with a large presenceShanghai 145.000 ton newsprint capacityHebei 330.000 ton newsprint capacityTotals 10 per cent of Norske Skog’s newsprint capacity
Weak margins due to overcapacity so farSmall Chinese enterprises forced to close down
Energy shortagesStricter environmental regulations
Norske Skog is an interesting partner for consolidations

26
Capacity Changes – Standard Newsprint Europe
Source: PPPC Supply&Demand, October 2007. Capacity 2008 and 2009 reduced by 550’ tonnes from closures announced after October 2007. Myllykoski/Germany (swing PM) and Palm in UK are included.
Europe Std News
02468
1012141618
1997 1998 1999 2000 2001 2002 2003 2004 2005 2006 2007(E)
2008(E)
2009(E)
Milli
on to
nnes
1997: 11.4 mill
Peak 2006:12.99 mill 2007: 12.95 mill
Europe Std News
-8
-6
-4
-2
0
2
4
6
8
1997 1998 1999 2000 2001 2002 2003 2004 2005 2006 2007(E)
2008(E)
2009(E)C
apac
ity C
hang
e (%
)
AAGR 1997- 2007: 1.4%

27
Capacity Changes – Standard Newsprint North America
Source: PPPC Supply&Demand, October 2007. Capacity 2008 and 2009 reduced by 700’ tonnes from closures announced by AbitibiBowater and Tembec after October 2007.
North Am Std News
02468
1012141618
1997 1998 1999 2000 2001 2002 2003 2004 2005 2006 2007(E)
2008(E)
2009(E)
Milli
on to
nnes
2007: 11.86 mill
Capacity peak: 16.61 mill
North Am Std News
-8
-6
-4
-2
0
2
4
6
8
1997 1998 1999 2000 2001 2002 2003 2004 2005 2006 2007(E)
2008(E)
2009(E)
Cap
acity
Cha
nge
(%)
AAGR 1997- 2007: -2.9%

28
World Std News
05
1015202530354045
1997 1998 1999 2000 2001 2002 2003 2004 2005 2006 2007(E)
2008(E)
2009(E)
Milli
on to
nnes
World Std News
-4
-3
-2
-1
0
1
2
3
4
1997 1998 1999 2000 2001 2002 2003 2004 2005 2006 2007(E)
2008(E)
2009(E)
Cap
acity
Cha
nge
(%)
Capacity Changes – Standard Newsprint World
2007: 39.95 mill1997: 38.15 mill
Source: PPPC Supply&Demand, October 2007. Capacity 2008 and 2009 reduced by announced closures of 1.45 mill tonnes tonnes in North America, Europe and Asia after October 2007.2009 includes new PM by Shandong Huatai in Guangzhou, but the project will be delayed. Expected increase in 2009 will then be 1 %, coming from Palm in UK and Pisa PM 2 in Brazil.
Peak 2009: 40.3 mill
AAGR 1997- 2007: 0.7%

29
Prices are edging upwards
Price improvements in balanced markets:Newsprint Northern America +10 percentChina +10 percentMagazine + 5 percent
Newsprint Europe is still laggingPrices down 5 percent in local currency Q 1 2008A stronger NOK adds 2,5 percent on the negative side
We expect price improvement to follow capacity adjustments in Europe

30
Capacity determines price developments
-5,0
-2,5
0,0
2,5
5,0
-15 -10 -5 0 5 10 15 20
2000
2001
2002
2003
2004
2005
2006
Price development the next year(%)
Chances in capacity utilisation in a given year(%)
European newsprint

Norske Skog
Nordea Paper Seminar, Helsinki 13 May 2008
Andreas Enger, CFO