nordtest tr 537 (2011-11) mn
TRANSCRIPT
7/26/2019 NORDTEST TR 537 (2011-11) MN
http://slidepdf.com/reader/full/nordtest-tr-537-2011-11-mn 1/54
Nordic Innovation Telephone +47 23 35 45 40 Project 1589-02Stensberggata 25, [email protected] NO-0170 OSLO www.nordtest.info
Handbook
for
Calculation of
Measurement Uncertaintyin
Environmental Laboratories
TR
53
7ed.3
Approved
2011-11
7/26/2019 NORDTEST TR 537 (2011-11) MN
http://slidepdf.com/reader/full/nordtest-tr-537-2011-11-mn 2/54
NT TECHN REPORT 537
Edition 3
Approved 2011-11
Authors:
Bertil Magnusson1
Teemu Näykki2
Håvard Hovind3
Mikael Krysell4
NORDTEST project number
1589-02
Institution1)
SP, Sweden,2)
SYKE, Finland,3)
NIVA, Norway,4)
Eurofins A/S,Denmark
Title:
Handbook for Calculation of Measurement Uncertainty in Environmental
Laboratories
Abstract:
This handbook is written for environmental testing laboratories in the Nordic countries, inorder to give support to the implementation of the concept of measurement uncertainty for
their routine measurements. The aim is to provide a practical, understandable and common
way of measurement uncertainty calculations, mainly based on already existing qualitycontrol and validation data, according to the European accreditation guideline /12/, theEurolab Technical Report No. 1 /3/ and the ISO/DTS 21748 Guide /8/. Nordtest hassupported this project economically in order to promote and enhance harmonisation
between laboratories on the Nordic market.
Practical examples, taken directly from the everyday world of environmental laboratories,are presented and explained. However, the approach is very general and should beapplicable to most testing laboratories in the chemical field.
The handbook covers all steps in the analytical chain from the arrival of the sample in the
laboratory until the data has been reported. It is important to notice that vital parts of the
total measurement uncertainty are not included, e.g. sampling, sample transportation and possible gross errors during data storage/retrieval. The recommendations in this document
are primarily for guidance. It is recognised that while the recommendations presented doform a valid approach to the evaluation of measurement uncertainty for many purposes,
other suitable approaches may also be adopted – see references in Section 9. Especially theEURACHEM/CITAC-Guide /2/ is useful in cases where sufficient previous data is not
available, and therefore the mathematical analytical approach according to GUM /1/ withall different steps is to be used.Basic knowledge in the use of quality control and statistics is required. In order to make it possiblefor the reader to follow the calculations, some raw data is given in appendices.
Technical Group: Expert Group Quality and Metrology
ISSN Language
EnglishPages
46
Key words
handbook, laboratories, environmental, testing, measurements, uncertainty, chemical
Distributed by
Nordic InnovationStenbergsgata 25 NO-0170 Oslo
Report Internet address:
www.nordtest.info

7/26/2019 NORDTEST TR 537 (2011-11) MN
http://slidepdf.com/reader/full/nordtest-tr-537-2011-11-mn 3/54

7/26/2019 NORDTEST TR 537 (2011-11) MN
http://slidepdf.com/reader/full/nordtest-tr-537-2011-11-mn 4/54
Handbookfor
Calculation ofMeasurement Uncertainty
in
Environmental Laboratories
Version 3 February 2008
Nordtest project 1589-02
Project participants
Bertil Magnusson, SP, SwedenTeemu Näykki, SYKE, FinlandHåvard Hovind, NIVA, Norway
Mikael Krysell, Eurofins A/S, Denmark
Drawings by Petter Wang, NIVA, Norway
Valuable comments on the
contents have been provided by:
Rolf Flykt, SwedenIrma Mäkinen, FinlandUlla O. Lund, DenmarkSteve Ellison, UK
Downloading address:
www.nordtest.info

7/26/2019 NORDTEST TR 537 (2011-11) MN
http://slidepdf.com/reader/full/nordtest-tr-537-2011-11-mn 5/54
Nordtest Technical Report 537 edition 3 approved 2011-11
7/26/2019 NORDTEST TR 537 (2011-11) MN
http://slidepdf.com/reader/full/nordtest-tr-537-2011-11-mn 6/54
Nordtest Technical Report 537 edition 3 approved 2011-11
Contents:
1 DEFINITIONS AND ABBREVIATIONS ...................................................... 1
2 INTRODUCTION ............................................................................................ 32.1 SCOPE AND FIELD OF APPLICATION ............................................................... ............ 3
2.2 COMMENT TO CUSTOMERS ................................................................ ....................... 3
2.3 ABOUT MEASUREMENT U NCERTAINTY .................................................................... 4
3 CALCULATION OF EXPANDED UNCERTAINTY, U - OVERVIEW ...... 63.1 CUSTOMER NEEDS ................................................................................................... . 7
3.2 FLOW SCHEME FOR UNCERTAINTY CALCULATIONS ................................................. . 7
3.3 SUMMARY TABLE FOR UNCERTAINTY CALCULATIONS.............................................. 9
4 REPRODUCIBILITY WITHIN-LABORATORY - u(R w) ............................ 104.1 CUSTOMER DEMANDS.............................................................. ............................... 10
4.2 CONTROL SAMPLE COVERING THE WHOLE ANALYTICAL PROCESS .......................... 10
4.3 CONTROL SAMPLE FOR DIFFERENT MATRICES AND CONCENTRATION LEVELS ........ 11
4.4 U NSTABLE CONTROL SAMPLES ............................................................................... 12
5 METHOD AND LABORATORY BIAS – u(bias) ....................................... 155.1 CERTIFIED R EFERENCE MATERIAL ......................................................................... 15
5.2 I NTERLABORATORY COMPARISONS .............................................................. .......... 175.3 R ECOVERY ............................................................................. ................................ 18
6 REPRODUCIBILITY BETWEEN LABORATORIES, SR ........................... 196.1 DATA GIVEN IN STANDARD METHOD ............................................................ .......... 19
6.2 DATA FROM INTERLABORATORY COMPARISONS ..................... ............................... 19
7 EXAMPLES ................................................................................................... 217.1 AMMONIUM IN WATER ............................................................ ............................... 21
7.2 BOD IN WASTEWATER ............................................................ ............................... 217.3 PCB IN SEDIMENT ........................................................ .......................................... 25
7.4 CONCENTRATION RANGES ...................................................................................... 288 REPORTING UNCERTAINTY .................................................................... 30
9 REFERENCES ............................................................................................... 32
10 APPENDICES ................................................................................................ 33
Appendix 1: Empty flow scheme for calculations .................................................. 33 Appendix 2: Empty summary table ......................................................................... 34 Appendix 3: Error model used in this handbook..................................................... 35 Appendix 4: Uncertainty of bias for NH4-N in section 3.2 ..................................... 36 Appendix 5: Raw data for NH4-N in section 4.3 ..................................................... 37
Appendix 6: Raw data for oxygen in Section 4.4 ................................................... 39 Appendix 7: Raw data for BOD in section 7.2 ....................................................... 40 Appendix 8: Estimation of standard deviation from range ..................................... 41 Appendix 9: Template for evaluation of measurement uncertainty ........................ 42

7/26/2019 NORDTEST TR 537 (2011-11) MN
http://slidepdf.com/reader/full/nordtest-tr-537-2011-11-mn 7/54
Nordtest Technical Report 537 edition 3 approved 2011-11

7/26/2019 NORDTEST TR 537 (2011-11) MN
http://slidepdf.com/reader/full/nordtest-tr-537-2011-11-mn 8/54
7/26/2019 NORDTEST TR 537 (2011-11) MN
http://slidepdf.com/reader/full/nordtest-tr-537-2011-11-mn 9/54
Nordtest Technical Report 537 edition 3 approved 2011-11
Page 1 of 46
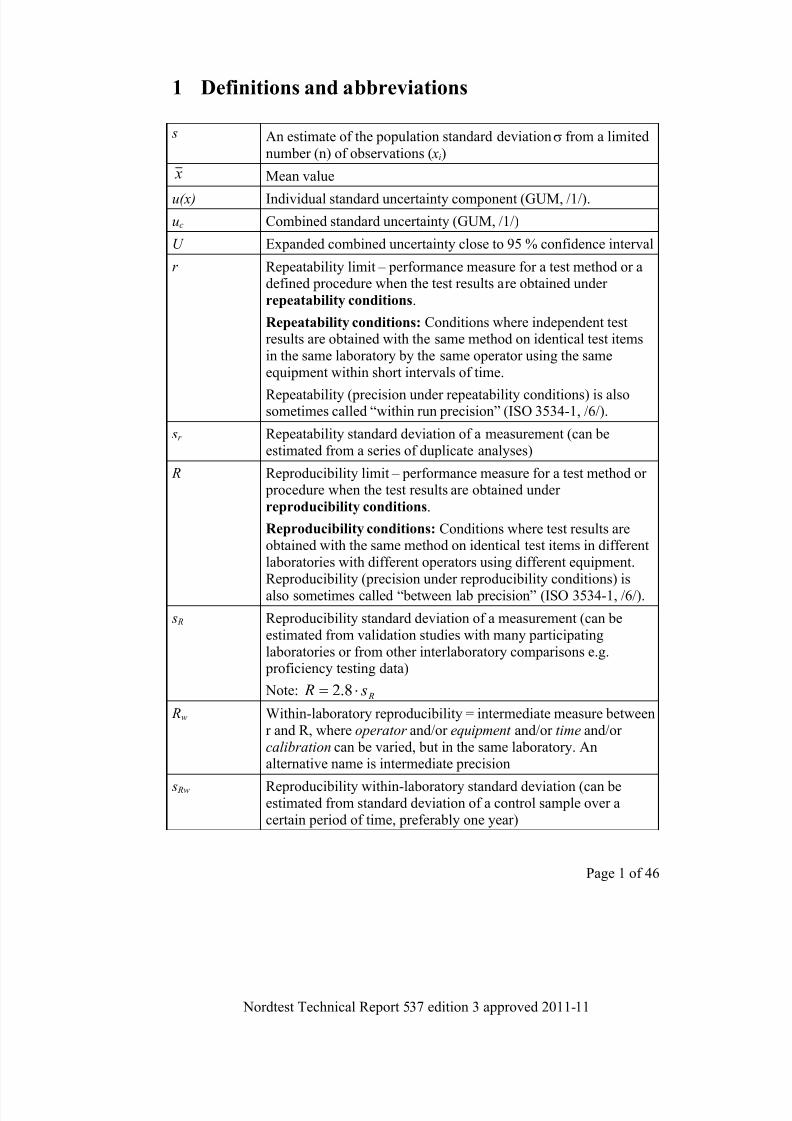
1 Definitions and abbreviations
s An estimate of the population standard deviation from a limited
number (n) of observations ( xi)
x Mean value
u(x) Individual standard uncertainty component (GUM, /1/).
uc Combined standard uncertainty (GUM, /1/)
U Expanded combined uncertainty close to 95 % confidence interval
r Repeatability limit – performance measure for a test method or adefined procedure when the test results are obtained underrepeatability conditions.
Repeatability conditions: Conditions where independent testresults are obtained with the same method on identical test itemsin the same laboratory by the same operator using the sameequipment within short intervals of time.
Repeatability (precision under repeatability conditions) is alsosometimes called “within run precision” (ISO 3534-1, /6/).
sr Repeatability standard deviation of a measurement (can beestimated from a series of duplicate analyses)
R Reproducibility limit – performance measure for a test method or procedure when the test results are obtained underreproducibility conditions.
Reproducibility conditions: Conditions where test results areobtained with the same method on identical test items in differentlaboratories with different operators using different equipment.Reproducibility (precision under reproducibility conditions) isalso sometimes called “between lab precision” (ISO 3534-1, /6/).
s R Reproducibility standard deviation of a measurement (can beestimated from validation studies with many participatinglaboratories or from other interlaboratory comparisons e.g. proficiency testing data)
Note: R s R 8.2
Rw Within-laboratory reproducibility = intermediate measure betweenr and R, where operator and/or equipment and/or time and/orcalibration can be varied, but in the same laboratory. Analternative name is intermediate precision
s Rw Reproducibility within-laboratory standard deviation (can beestimated from standard deviation of a control sample over acertain period of time, preferably one year)

7/26/2019 NORDTEST TR 537 (2011-11) MN
http://slidepdf.com/reader/full/nordtest-tr-537-2011-11-mn 10/54
Nordtest Technical Report 537 edition 3 approved 2011-11
Page 2 of 46
CRM Certified Reference Material
Certifiedvalue
Assigned value given to a CRM, quantified through a certification process (traceable to SI-unit and with a known uncertainty)
Nominalvalue
Nominal value is the assigned value, e.g. in an interlaboratorycomparison where it is the organiser’s best representation of the“true value”
u(Cref) Uncertainty component from the certified or nominal value
bias Difference between mean measured value from a large series oftest results and an accepted reference value (a certified or nominalvalue). The measure of trueness is normally expressed in term of bias.
Bias for a measurement, e.g. for a laboratory or for an analyticalmethod.
u(bias) Uncertainty component for bias. The u(bias), is always included
in the measurement uncertainty calculations
RMS bias
n
bias i 2)(
Interlaboratorycomparison
General term for a collaborative study for either method performance, laboratory performance (proficiency testing) ormaterial certification.
7/26/2019 NORDTEST TR 537 (2011-11) MN
http://slidepdf.com/reader/full/nordtest-tr-537-2011-11-mn 11/54
Nordtest Technical Report 537 edition 3 approved 2011-11
Page 3 of 46
2 Introduction
2.1 Scope and fi eld of application
This handbook is written for environmental testing laboratories in the Nordiccountries, in order to give support to the implementation of the concept ofmeasurement uncertainty for their routine measurements. The aim is to provide a
practical, understandable and common way of measurement uncertaintycalculations, mainly based on already existing quality control and validation data,according to the European accreditation guideline /12/, the Eurolab TechnicalReport No. 1 /3/ and the ISO/DTS 21748 Guide /8/. Nordtest has supported this project economically in order to promote and enhance harmonisation between
laboratories on the Nordic market.
Practical examples, taken directly from the everyday world of environmental
laboratories, are presented and explained. However, the approach is very generaland should be applicable to most testing laboratories in the chemical field.
The handbook covers all steps in the analytical chain from the arrival of the samplein the laboratory until the data has been reported. It is important to notice that vital
parts of the total measurement uncertainty are not included, e.g. sampling, sampletransportation and possible gross errors during data storage/retrieval.
The recommendations in this document are primarily for guidance. It is recognised
that while the recommendations presented do form a valid approach to theevaluation of measurement uncertainty for many purposes, other suitableapproaches may also be adopted – see references in Section 9. Especially theEURACHEM/CITAC-Guide /2/ is useful in cases where sufficient previous data isnot available, and therefore the mathematical analytical approach according toGUM /1/ with all different steps is to be used.
Basic knowledge in the use of quality control and statistics is required. In order tomake it possible for the reader to follow the calculations, some raw data is given in
appendices
2.2 Comment to customers
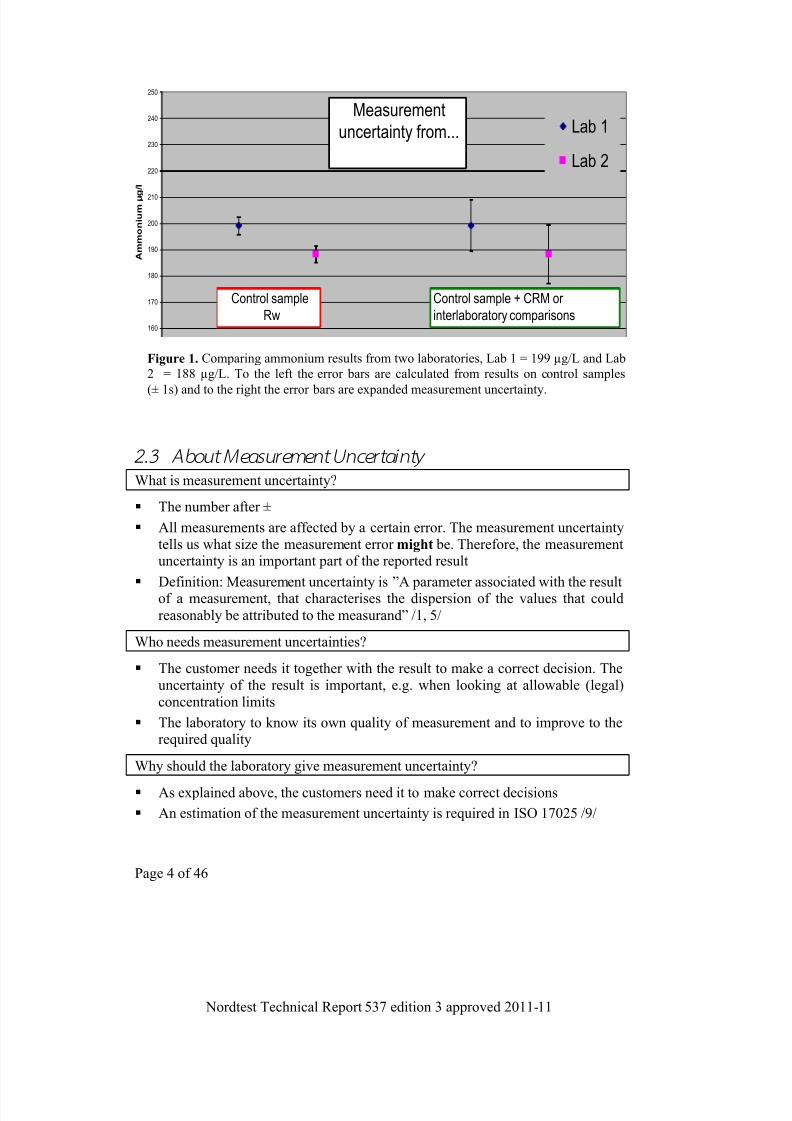
Previously, laboratories usually reported uncertainty as the standard deviationcalculated from data for an internal control sample. The measurement uncertaintyalso taking into account method and laboratory bias and using a coverage factor of2, can give uncertainty values which may be a factor of 2 to 5 times higher than previously (Figure 1). However, this does not reflect a change in the performanceof the laboratory, just a much better estimation of the real variation betweenlaboratories. In Figure 1, the ammonium results from two laboratories are in goodagreement – the difference is about 5 %. You can see this if you look to the right
where measurement uncertainty is calculated correctly, but not if you look to theleft, where the uncertainty is calculated directly from a control sample and presented as the standard deviation (± 1 s).
7/26/2019 NORDTEST TR 537 (2011-11) MN
http://slidepdf.com/reader/full/nordtest-tr-537-2011-11-mn 12/54
Nordtest Technical Report 537 edition 3 approved 2011-11
Page 4 of 46
2.3 About Measurement Uncertain ty
What is measurement uncertainty?
The number after ±
All measurements are affected by a certain error. The measurement uncertaintytells us what size the measurement error might be. Therefore, the measurementuncertainty is an important part of the reported result
Definition: Measurement uncertainty is ”A parameter associated with the resultof a measurement, that characterises the dispersion of the values that could
reasonably be attributed to the measurand” /1, 5/
Who needs measurement uncertainties?
The customer needs it together with the result to make a correct decision. Theuncertainty of the result is important, e.g. when looking at allowable (legal)concentration limits
The laboratory to know its own quality of measurement and to improve to therequired quality
Why should the laboratory give measurement uncertainty?
As explained above, the customers need it to make correct decisions
An estimation of the measurement uncertainty is required in ISO 17025 /9/
150
160
170
180
190
200
210
220
230
240
250
0 6
A m m o n i u m µ
g / l
Lab 1
Lab 2
Measurement
uncertainty from...
Control sample
Rw
Control sample + CRM or
interlaboratory comparisons
Figure 1. Comparing ammonium results from two laboratories, Lab 1 = 199 µg/L and Lab
2 = 188 µg/L. To the left the error bars are calculated from results on control samples
(± 1s) and to the right the error bars are expanded measurement uncertainty.
7/26/2019 NORDTEST TR 537 (2011-11) MN
http://slidepdf.com/reader/full/nordtest-tr-537-2011-11-mn 13/54
Nordtest Technical Report 537 edition 3 approved 2011-11
Page 5 of 46
How is measurement uncertainty obtained?
The basis for the evaluation is a measurement and statistical approach, wherethe different uncertainty sources are estimated and combined into a singlevalue
“ Basis for the estimation of measurement uncertainty is the existing knowledge(no special scientific research should be required from the laboratories).
Existing experimental data should be used (quality control charts, validation,interlaboratory comparisons, CRM etc.)” / 12/
Guidelines are given in GUM /1/, further developed in, e.g., EA guidelines/12/, the Eurachem/CITAC guide /2/, in a Eurolab technical report /3/ and in
ISO/DTS 21748 /8/
How is the result expressed with measurement uncertainty?
Measurement uncertainty should normally be expressed as U , the combined
expanded measurement uncertainty, using a coverage factor k = 2, providing alevel of confidence of approximately 95 %
It is often useful to state how the measurement uncertainty was obtained
Example, where ± 7 is the measurement uncertainty:
Ammonium (NH4-N) = 148 ± 7 µg/L. The measurement uncertainty, 7 µg/L
(95 % confidence level, i.e. the coverage factor k=2) is estimated from controlsamples and from regular interlaboratory comparisons
How should measurement uncertainty be used?
It can be used as in Figure 1, to decide whether there is a difference betweenresults from different laboratories, or results from the same laboratory at
different occasions (time trends etc.)
It is necessary when comparing results to allowable values, e.g. tolerance limitsor allowable (legal) concentrations
7/26/2019 NORDTEST TR 537 (2011-11) MN
http://slidepdf.com/reader/full/nordtest-tr-537-2011-11-mn 14/54
Nordtest Technical Report 537 edition 3 approved 2011-11
Page 6 of 46
3 Calculation of expanded uncertainty, U - overview
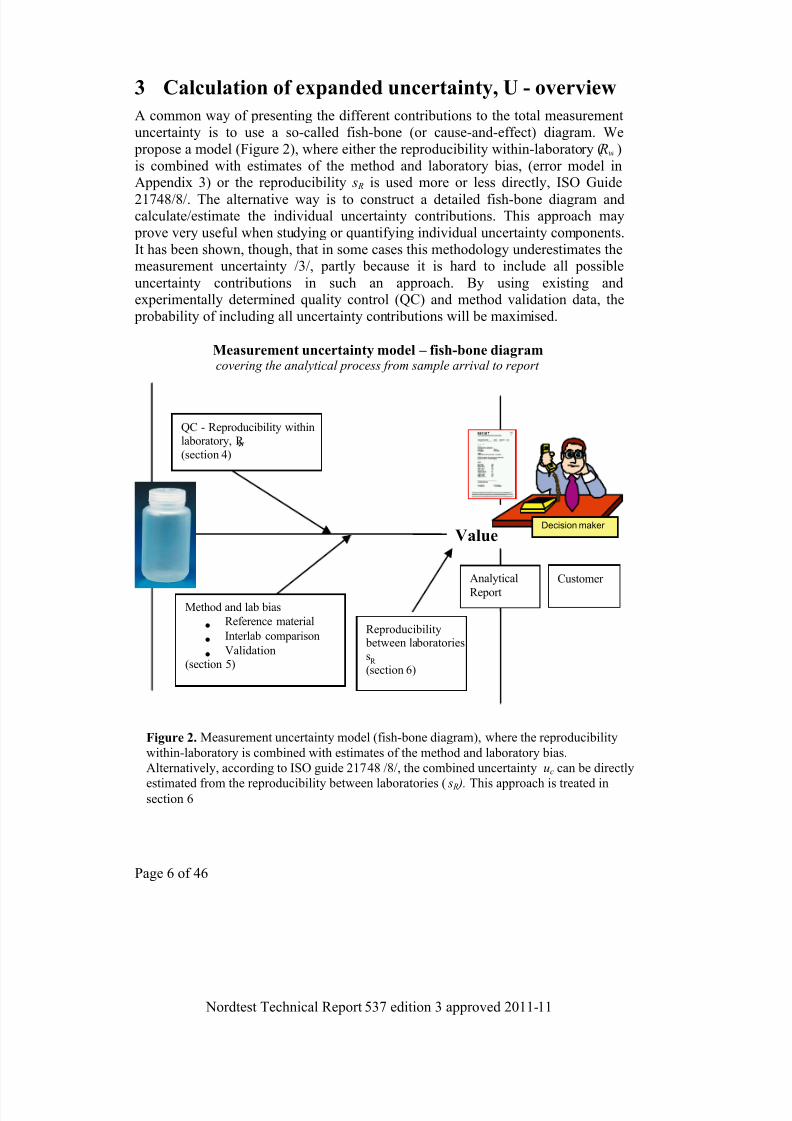
A common way of presenting the different contributions to the total measurementuncertainty is to use a so-called fish-bone (or cause-and-effect) diagram. We propose a model (Figure 2), where either the reproducibility within-laboratory ( Rw )is combined with estimates of the method and laboratory bias, (error model inAppendix 3) or the reproducibility s R is used more or less directly, ISO Guide
21748/8/. The alternative way is to construct a detailed fish-bone diagram andcalculate/estimate the individual uncertainty contributions. This approach may prove very useful when studying or quantifying individual uncertainty components.It has been shown, though, that in some cases this methodology underestimates themeasurement uncertainty /3/, partly because it is hard to include all possible
uncertainty contributions in such an approach. By using existing andexperimentally determined quality control (QC) and method validation data, the probability of including all uncertainty contributions will be maximised.
Measurement uncertainty model – fish-bone diagramcovering the analytical process from sample arrival to report
Figure 2. Measurement uncertainty model (fish-bone diagram), where the reproducibility
within-laboratory is combined with estimates of the method and laboratory bias.
Alternatively, according to ISO guide 21748 /8/, the combined uncertainty uc can be directly
estimated from the reproducibility between laboratories ( s R ). This approach is treated insection 6
Analytical Report
QC - Reproducibility within laboratory, R ( section 4)
Method and lab bias
Reference material
Interlab comparison
Validation (section 5)
Value
Customer
Reproducibility between laboratories s R ( section 6)
Decision maker

7/26/2019 NORDTEST TR 537 (2011-11) MN
http://slidepdf.com/reader/full/nordtest-tr-537-2011-11-mn 15/54
Nordtest Technical Report 537 edition 3 approved 2011-11
Page 7 of 46
3.1 Customer needs
Before calculating or estimating the measurement uncertainty, it is recommended
to find out what are the needs of the customers. After that, the main aim of theactual uncertainty calculations will be to find out if the laboratory can fulfil thecustomer demands with the analytical method in question. However, customers arenot used to specifying demands, so in many cases the demands have to be set in
dialogue with the customer. In cases where no demands have been established, aguiding principle could be that the calculated expanded uncertainty, U , should beapproximately equal to, or less than, 2 times the reproducibility, s R.
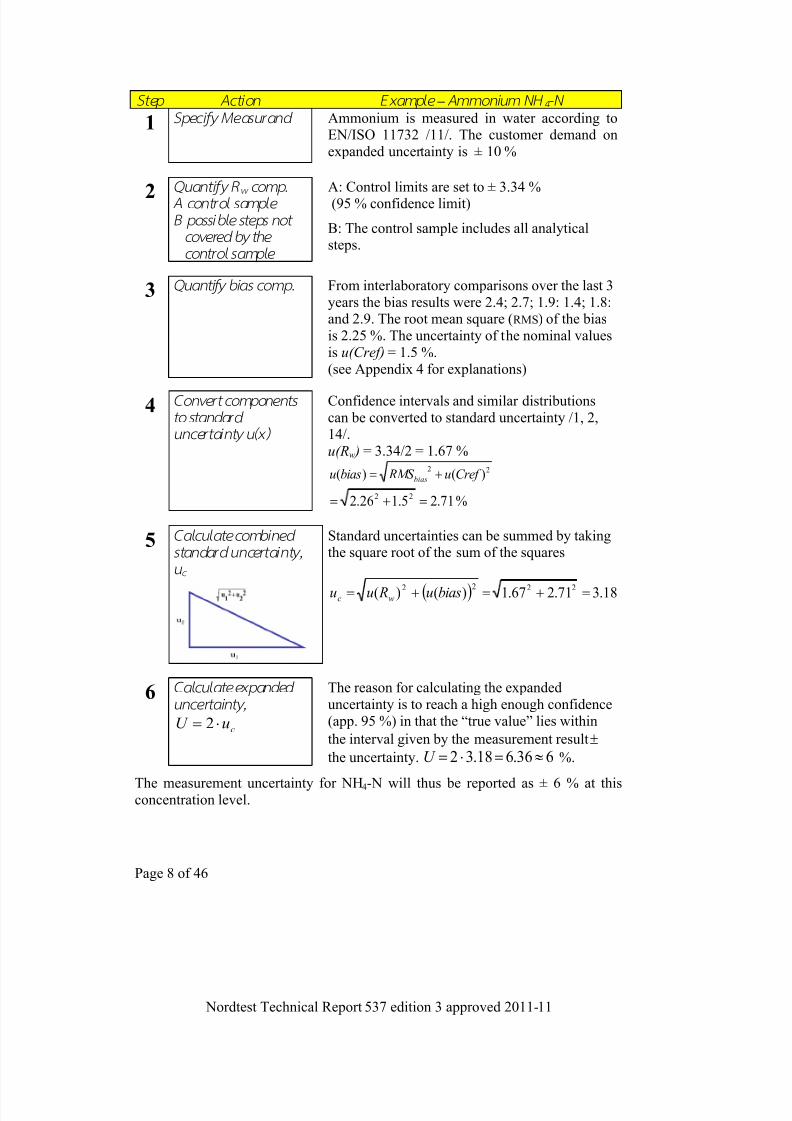
3.2 F low scheme for uncertainty calculations
The flow scheme presented in this section forms the basis for the method outlinedin this handbook. The flow scheme, involving 6 defined steps, should be followed
in all cases. The example with NH4-N in water shows the way forward forcalculating the measurement uncertainty using the flow scheme. Explanations ofthe steps and their components will follow in the succeeding chapters. For each
step, there may be one or several options for finding the desired information.
Background for the NH 4-N example –
automatic photometric method: Thelaboratory has participated in 6 interlaboratory comparisons recently. All resultshave been somewhat higher than the nominal value. The laboratory thereforeconcludes that there may be a small positive bias. On average, the bias has been
+2.2 %. This bias is considered small by the laboratory and is not corrected for intheir analytical results, but exists, and is thus another uncertainty component. Theraw data for this example is found in Appendix 4.
For this method, the main sources of uncertainty are contamination and variation in
sample handling, both causing random uncertainty components. These uncertaintysources will be included in the calculations below.
7/26/2019 NORDTEST TR 537 (2011-11) MN
http://slidepdf.com/reader/full/nordtest-tr-537-2011-11-mn 16/54
Nordtest Technical Report 537 edition 3 approved 2011-11
Page 8 of 46
Step Acti on Example – Ammonium NH 4 -N
1 Specif y Measurand Ammonium is measured in water according toEN/ISO 11732 /11/. The customer demand onexpanded uncertainty is ± 10 %
2Quantify R w comp.
A control sample
B possible steps not
covered by the
control sample
A: Control limits are set to ± 3.34 %(95 % confidence limit)
B: The control sample includes all analyticalsteps.
3 Quant if y bias comp. From interlaboratory comparisons over the last 3years the bias results were 2.4; 2.7; 1.9: 1.4; 1.8:and 2.9. The root mean square (RMS) of the biasis 2.25 %. The uncertainty of the nominal valuesis u(Cref) = 1.5 %.(see Appendix 4 for explanations)
4 Convert components
to standard
uncertainty u(x)
Confidence intervals and similar distributionscan be converted to standard uncertainty /1, 2,14/.
u(Rw ) = 3.34/2 = 1.67 %22)()( Cref u RMS biasu bias
%71.25.126.2 22
5 Calcul ate combined
standard uncertainty,
u c
Standard uncertainties can be summed by takingthe square root of the sum of the squares
18.371.267.1)()( 2222 biasu Ruu wc
6 Calcul ate expanded
uncertainty,
cuU 2
The reason for calculating the expandeduncertainty is to reach a high enough confidence(app. 95 %) in that the “true value” lies within
the interval given by the measurement result
the uncertainty. 636.618.32 U %.
The measurement uncertainty for NH4-N will thus be reported as ± 6 % at thisconcentration level.
7/26/2019 NORDTEST TR 537 (2011-11) MN
http://slidepdf.com/reader/full/nordtest-tr-537-2011-11-mn 17/54
Nordtest Technical Report 537 edition 3 approved 2011-11
Page 9 of 46
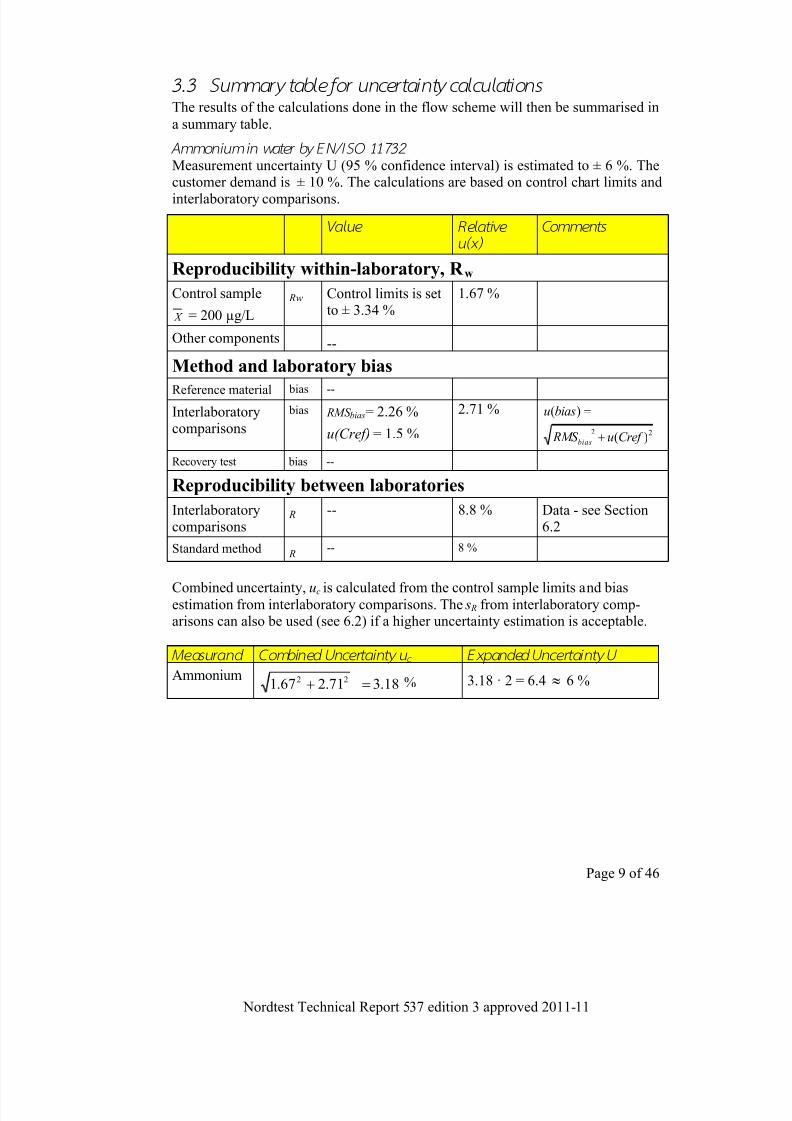
3.3 Summary table for uncertainty calculations
The results of the calculations done in the flow scheme will then be summarised in
a summary table.
Ammonium in water by EN/I SO 11732
Measurement uncertainty U (95 % confidence interval) is estimated to ± 6 %. Thecustomer demand is ± 10 %. The calculations are based on control chart limits and
interlaboratory comparisons.
Value Relative
u(x)
Comments
Reproducibility within-laboratory, R w
Control sample
X = 200 µg/L
Rw Control limits is setto ± 3.34 %
1.67 %
Other components --
Method and laboratory bias
Reference material bias --
Interlaboratorycomparisons
bias RMS bias= 2.26 %
u(Cref) = 1.5 %
2.71 %
22)(
)(
Cref u RMS
biasu
bias
Recovery test bias --
Reproducibility between laboratories
Interlaboratorycomparisons
R -- 8.8 % Data - see Section6.2
Standard method R -- 8 %
Combined uncertainty, uc is calculated from the control sample limits and biasestimation from interlaboratory comparisons. The s R from interlaboratory comp-arisons can also be used (see 6.2) if a higher uncertainty estimation is acceptable.
Measurand Combined Uncertainty u c Expanded Uncertainty U
Ammonium18.371.267.1 22 % 3.18 · 2 = 6.4 6 %
7/26/2019 NORDTEST TR 537 (2011-11) MN
http://slidepdf.com/reader/full/nordtest-tr-537-2011-11-mn 18/54
Nordtest Technical Report 537 edition 3 approved 2011-11
Page 10 of 46
4 Reproducibility within-laboratory - u(R w)
In this section the most common ways of estimating the reproducibility within-laboratory component, u(Rw), for the measurement uncertainty calculation areexplained:
Stable control samples covering the whole analytical process. Normally
one sample at low concentration level and one at a high concentrationlevel.
Control samples not covering the whole analytical process. Uncertaintiesestimated from control samples and from duplicate analyses of realsamples with varying concentration levels.
Unstable control samples.
It is of utmost importance that the estimation must cover all steps in the analyticalchain and all types of matrices – worst-case scenario. The control sample datashould be run in exactly the same way as the samples e.g. if the mean of duplicatesamples is used for ordinary samples, then the mean of duplicate control samplesshould be used for the calculations.
It is likewise important to cover long-term variations of some systematicuncertainty components within the laboratory, e.g. caused by different stocksolutions, new batches of critical reagents, recalibrations of equipment, etc. In
order to have a representative basis for the uncertainty calculations and to reflectany such variation the number of results should ideally be more than 50 and covera time period of approximately one year, but the need differs from method tomethod.
4.1 Customer demands
Some laboratories choose to use the customer demand when setting the limits in
their control charts. The actual performance of the method is not interesting, aslong as it meets the customer demands on expanded uncertainty. If, for example,
the customer asks for data with an (expanded) measurement uncertainty of ± 10 %,then, from our experience, a good starting point is to set the control limits ± 5 %.The u(Rw ) used in the calculations will then be 2.5 %.
1 This is just a proposal and
the measurement uncertainty calculations will show if these control limits areappropriate.
4.2 Control sample cover ing the whole analytical process
When a stable control sample is covering the whole analytical process and has a
matrix similar to the samples, the within-laboratory reproducibility at thatconcentration level can simply be estimated from the analyses of the control
1 Treating the control limits according to GUM /1/ as type B estimate with 95 %
confidence limit
7/26/2019 NORDTEST TR 537 (2011-11) MN
http://slidepdf.com/reader/full/nordtest-tr-537-2011-11-mn 19/54
Nordtest Technical Report 537 edition 3 approved 2011-11
Page 11 of 46
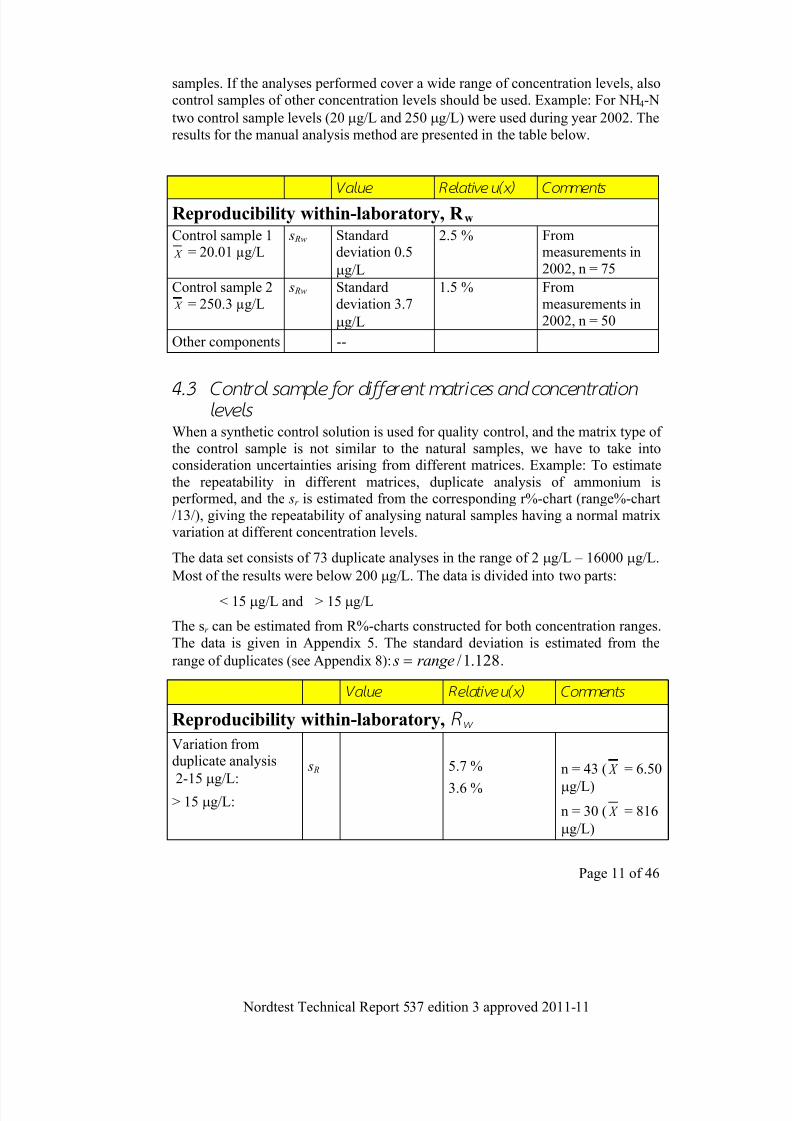
samples. If the analyses performed cover a wide range of concentration levels, alsocontrol samples of other concentration levels should be used. Example: For NH 4-N
two control sample levels (20 g/L and 250 g/L) were used during year 2002. The
results for the manual analysis method are presented in the table below.
Value Relati ve u(x) Comments
Reproducibility within-laboratory, R w Control sample 1
X = 20.01 µg/L s Rw Standard
deviation 0.5
g/L
2.5 % Frommeasurements in2002, n = 75
Control sample 2
X = 250.3 µg/L s Rw Standard
deviation 3.7
g/L
1.5 % Frommeasurements in2002, n = 50
Other components --
4.3
Control sample for dif ferent matri ces and concentrationlevels
When a synthetic control solution is used for quality control, and the matrix type ofthe control sample is not similar to the natural samples, we have to take intoconsideration uncertainties arising from different matrices. Example: To estimate
the repeatability in different matrices, duplicate analysis of ammonium is performed, and the sr is estimated from the corresponding r%-chart (range%-chart/13/), giving the repeatability of analysing natural samples having a normal matrixvariation at different concentration levels.
The data set consists of 73 duplicate analyses in the range of 2 g/L – 16000 g/L.
Most of the results were below 200 g/L. The data is divided into two parts:
< 15 g/L and > 15 g/L
The sr can be estimated from R%-charts constructed for both concentration ranges.
The data is given in Appendix 5. The standard deviation is estimated from the
range of duplicates (see Appendix 8): 128.1/range s .
Value Relati ve u(x) Comments
Reproducibility within-laboratory, R w
Variation fromduplicate analysis
2-15 g/L:> 15 g/L:
s R 5.7 %
3.6 %
n = 43 ( X = 6.50
g/L)
n = 30 ( X = 816
g/L)
7/26/2019 NORDTEST TR 537 (2011-11) MN
http://slidepdf.com/reader/full/nordtest-tr-537-2011-11-mn 20/54
Nordtest Technical Report 537 edition 3 approved 2011-11
Page 12 of 46
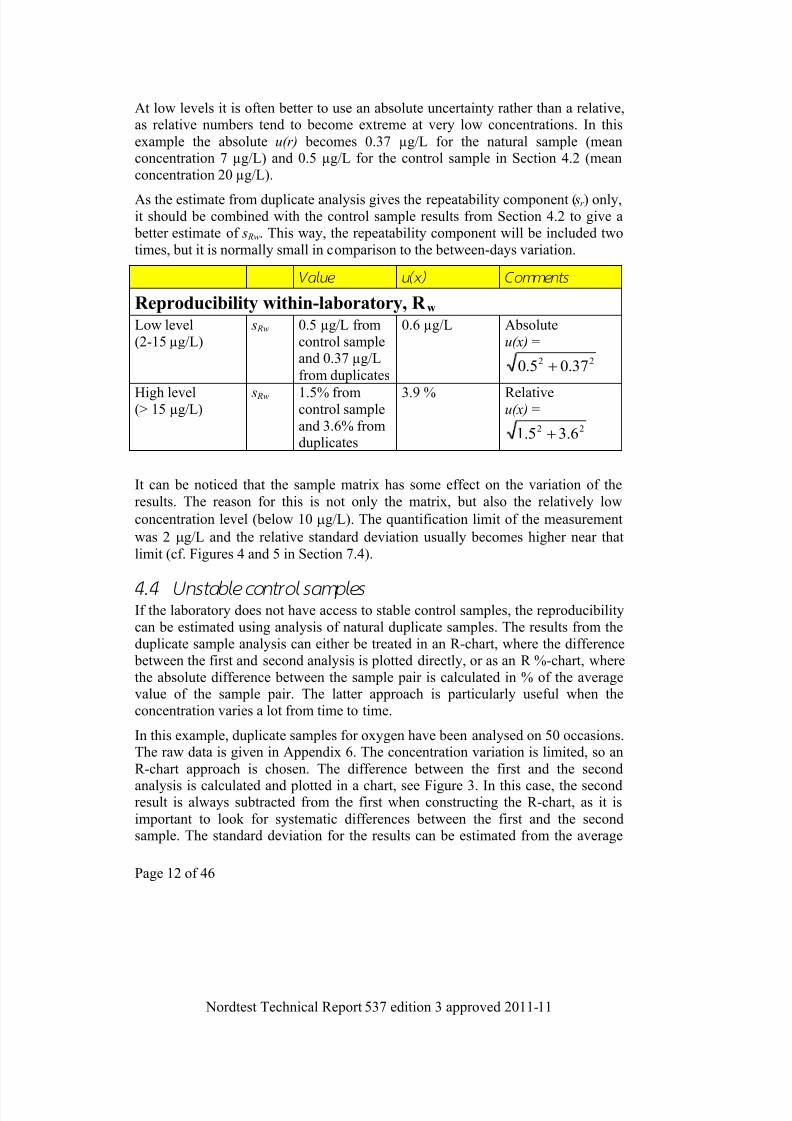
At low levels it is often better to use an absolute uncertainty rather than a relative,as relative numbers tend to become extreme at very low concentrations. In this
example the absolute u(r) becomes 0.37 µg/L for the natural sample (meanconcentration 7 µg/L) and 0.5 µg/L for the control sample in Section 4.2 (meanconcentration 20 µg/L).
As the estimate from duplicate analysis gives the repeatability component ( sr ) only,it should be combined with the control sample results from Section 4.2 to give a better estimate of s Rw. This way, the repeatability component will be included twotimes, but it is normally small in comparison to the between-days variation.
Value u(x ) Comments
Reproducibility within-laboratory, R w Low level(2-15 µg/L)
s Rw 0.5 µg/L fromcontrol sampleand 0.37 µg/L
from duplicates
0.6 µg/L Absoluteu(x) =
22 37.05.0
High level(> 15 µg/L)
s Rw 1.5% fromcontrol sampleand 3.6% fromduplicates
3.9 % Relativeu(x) =
22 6.35.1
It can be noticed that the sample matrix has some effect on the variation of the
results. The reason for this is not only the matrix, but also the relatively low
concentration level (below 10 g/L). The quantification limit of the measurement
was 2 g/L and the relative standard deviation usually becomes higher near that
limit (cf. Figures 4 and 5 in Section 7.4).
4.4
Unstable control samplesIf the laboratory does not have access to stable control samples, the reproducibilitycan be estimated using analysis of natural duplicate samples. The results from theduplicate sample analysis can either be treated in an R-chart, where the difference between the first and second analysis is plotted directly, or as an R %-chart, wherethe absolute difference between the sample pair is calculated in % of the averagevalue of the sample pair. The latter approach is particularly useful when theconcentration varies a lot from time to time.
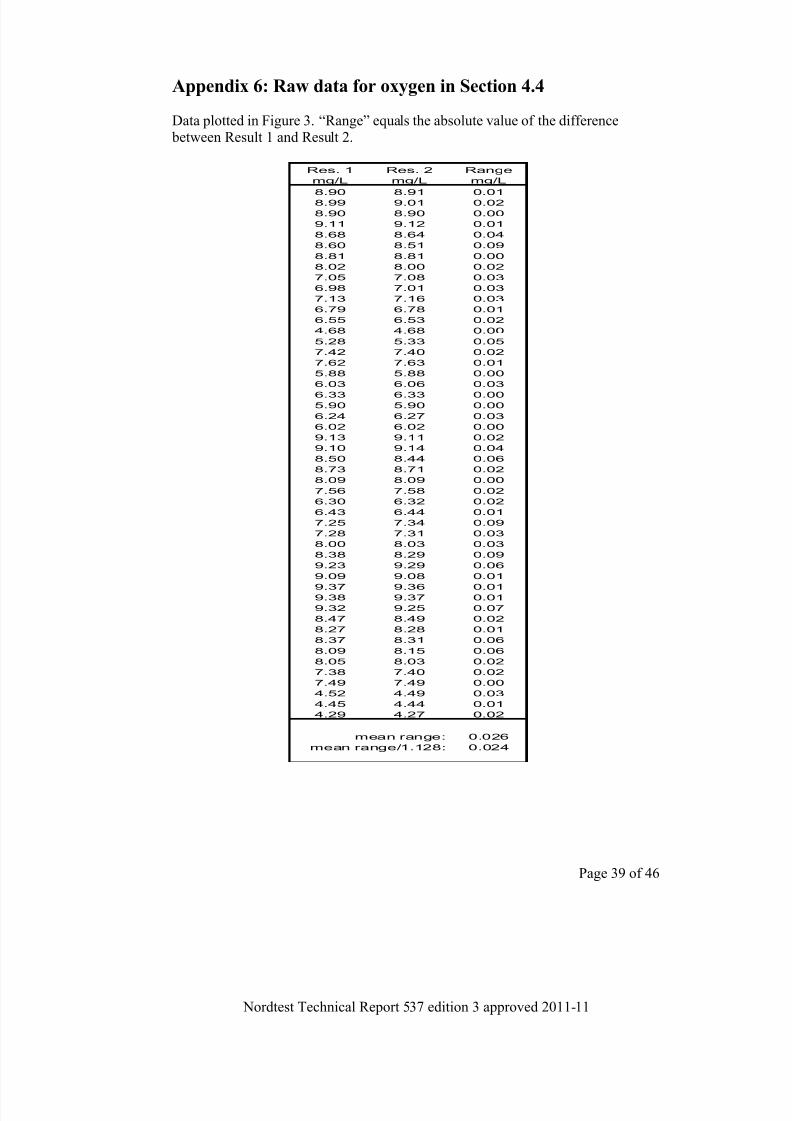
In this example, duplicate samples for oxygen have been analysed on 50 occasions.The raw data is given in Appendix 6. The concentration variation is limited, so an
R-chart approach is chosen. The difference between the first and the second
analysis is calculated and plotted in a chart, see Figure 3. In this case, the secondresult is always subtracted from the first when constructing the R-chart, as it is
important to look for systematic differences between the first and the secondsample. The standard deviation for the results can be estimated from the average
7/26/2019 NORDTEST TR 537 (2011-11) MN
http://slidepdf.com/reader/full/nordtest-tr-537-2011-11-mn 21/54
Nordtest Technical Report 537 edition 3 approved 2011-11
Page 13 of 46
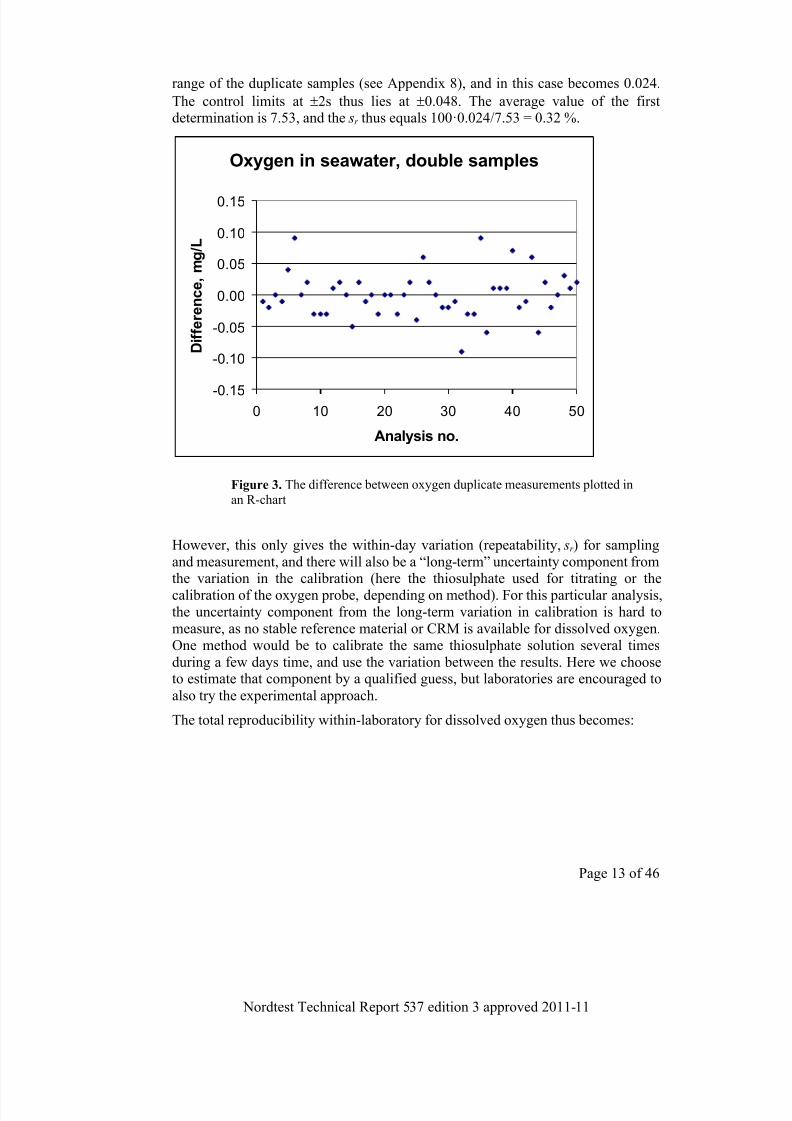
range of the duplicate samples (see Appendix 8), and in this case becomes 0.024.
The control limits at 2s thus lies at 0.048. The average value of the firstdetermination is 7.53, and the sr thus equals 100·0.024/7.53 = 0.32 %.
Oxygen in seawater, double samples
-0.15
-0.10
-0.05
0.00
0.05
0.10
0.15
0 10 20 30 40 50
Analysis no.
D i f f e r e n c e , m g / L
However, this only gives the within-day variation (repeatability, sr ) for samplingand measurement, and there will also be a “long-term” uncertainty component fromthe variation in the calibration (here the thiosulphate used for titrating or thecalibration of the oxygen probe, depending on method). For this particular analysis,the uncertainty component from the long-term variation in calibration is hard tomeasure, as no stable reference material or CRM is available for dissolved oxygen.One method would be to calibrate the same thiosulphate solution several timesduring a few days time, and use the variation between the results. Here we chooseto estimate that component by a qualified guess, but laboratories are encouraged to
also try the experimental approach.
The total reproducibility within-laboratory for dissolved oxygen thus becomes:
Figure 3. The difference between oxygen duplicate measurements plotted in
an R-chart

7/26/2019 NORDTEST TR 537 (2011-11) MN
http://slidepdf.com/reader/full/nordtest-tr-537-2011-11-mn 22/54
Nordtest Technical Report 537 edition 3 approved 2011-11
Page 14 of 46
Value Relative u(x) Comments
Reproducibility within-laboratory, R w
Duplicatemeasurements of
natural samples,difference used in r-chart
s R s = 0.024 mg/L
X = 7.53 mg/L
0.32 % Measurements in2000-2002,
n= 50
Estimated variationfrom differences incalibration over time
s = 0.5 % 0.5 %Estimate, basedon experience
Combined uncertainty for R w
Repeatability +
reproducibility incalibration
59.05.032.0
22 %
7/26/2019 NORDTEST TR 537 (2011-11) MN
http://slidepdf.com/reader/full/nordtest-tr-537-2011-11-mn 23/54
Nordtest Technical Report 537 edition 3 approved 2011-11
Page 15 of 46
5 Method and Laboratory bias – u(bias)
In this chapter the most common ways of estimating the bias components will beoutlined, namely the use of CRM, participation in interlaboratory comparisons(proficiency test) and recovery tests. Sources of bias should always be eliminated if possible. According to GUM /1/ a measurement result should always be correctedif the bias is significant and based on reliable data such as a CRM. However, even
if the bias is zero, it has to be estimated and treated as an uncertainty component. Inmany cases the bias can vary depending on changes in matrix. This can be reflectedwhen analysing several matrix CRMs, e.g. the bias could be both positive andnegative. Examples are given and explained for the proposed calculations.
For every estimation of the uncertainty from the method and laboratory bias, twocomponents have to be estimated to obtain u(bias):
1) the bias (as % difference from the nominal or certified value)
2) the uncertainty of the nominal/certified value, u(Cref) or u(Crecovery)
The uncertainty of the bias, u(bias) can be estimated by
22)()( Cref u RMS biasu bias where
CRM
i
biasn
bias RMS
2)(
and if only one CRM is used also the sbias have to be included and u(bias) can the be estimated /14, 15/
2 by
2
2
2)()( Cref u
n
sbiasbiasu bias
5.1 Certi fi ed Reference Material
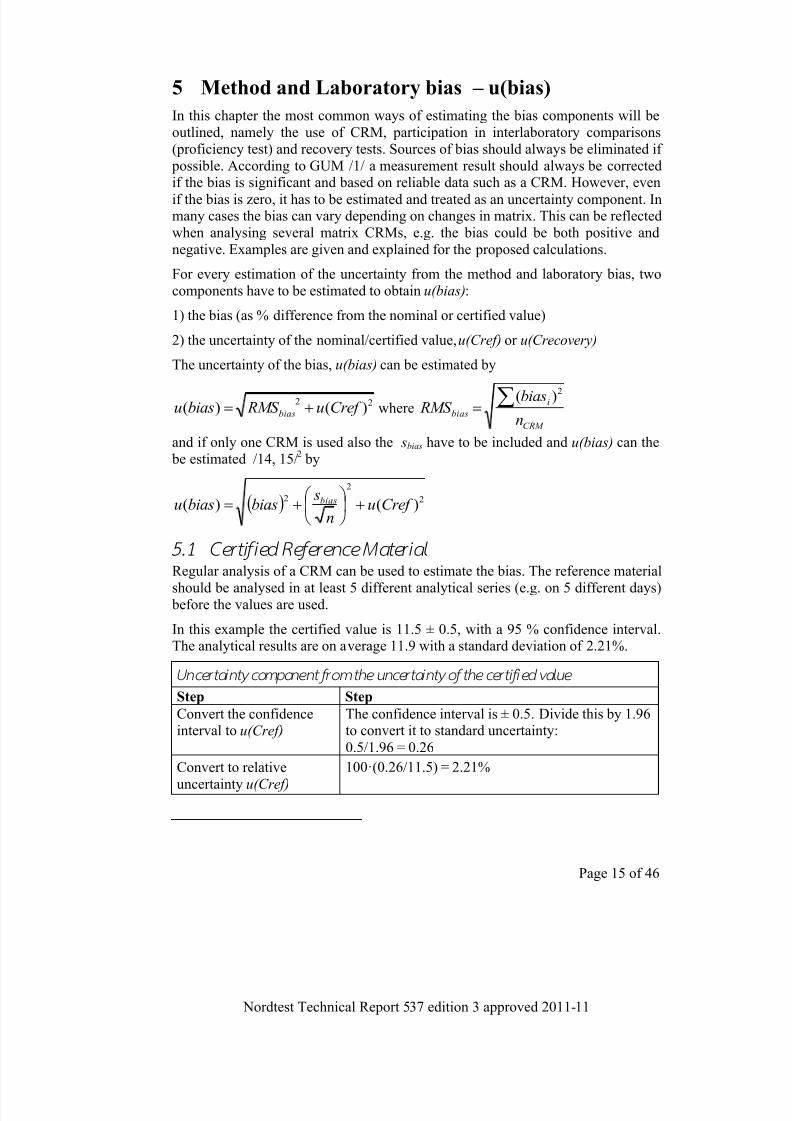
Regular analysis of a CRM can be used to estimate the bias. The reference material
should be analysed in at least 5 different analytical series (e.g. on 5 different days) before the values are used.
In this example the certified value is 11.5 ± 0.5, with a 95 % confidence interval.The analytical results are on average 11.9 with a standard deviation of 2.21%.
Uncertainty component fr om the uncertainty of the certif ied value
Step Step
Convert the confidenceinterval to u(Cref)
The confidence interval is ± 0.5. Divide this by 1.96to convert it to standard uncertainty:
0.5/1.96 = 0.26
Convert to relative
uncertainty u(Cref)
100·(0.26/11.5) = 2.21%

7/26/2019 NORDTEST TR 537 (2011-11) MN
http://slidepdf.com/reader/full/nordtest-tr-537-2011-11-mn 24/54
Nordtest Technical Report 537 edition 3 approved 2011-11
Page 16 of 46
3 Quanti fy Method and
laboratory bias
%3.4811.5)/11.5-(11.9100 bias
sbias = 2.2 % (n = 12)u(Cref) = 2.21 %
4Convert components
to standard
uncertainty u (x)
2
2
2)()( Cref u
n
sbiasbiasu bias
%2.421.212
2.248.3
2
2
2
If several CRM:s are used, we will get different values for the bias. The
uncertainty of the bias estimation will be calculated in the following way (see alsosection 5.2).
3 Quanti fy Method and
laboratory bias
bias CRM1 is 3.48%, s2,2 (n=12), u(Cref)=2.21 % bias CRM2 is -0.9% s=2,0 (n=7)), u(Cref)=1.8 % bias CRM3 is 2.5%, s= 2,8 (n=10), u(Cref)=1.8 %For the bias the RMS bias = 2.50mean u(Cref)=1,9 %
4 Convert components
to standard
uncertainty u (x)
22)()( Cref u RMS biasu bias
%1.39.150.2 22
7/26/2019 NORDTEST TR 537 (2011-11) MN
http://slidepdf.com/reader/full/nordtest-tr-537-2011-11-mn 25/54
Nordtest Technical Report 537 edition 3 approved 2011-11
Page 17 of 46
5.2 I nter laboratory comparisons
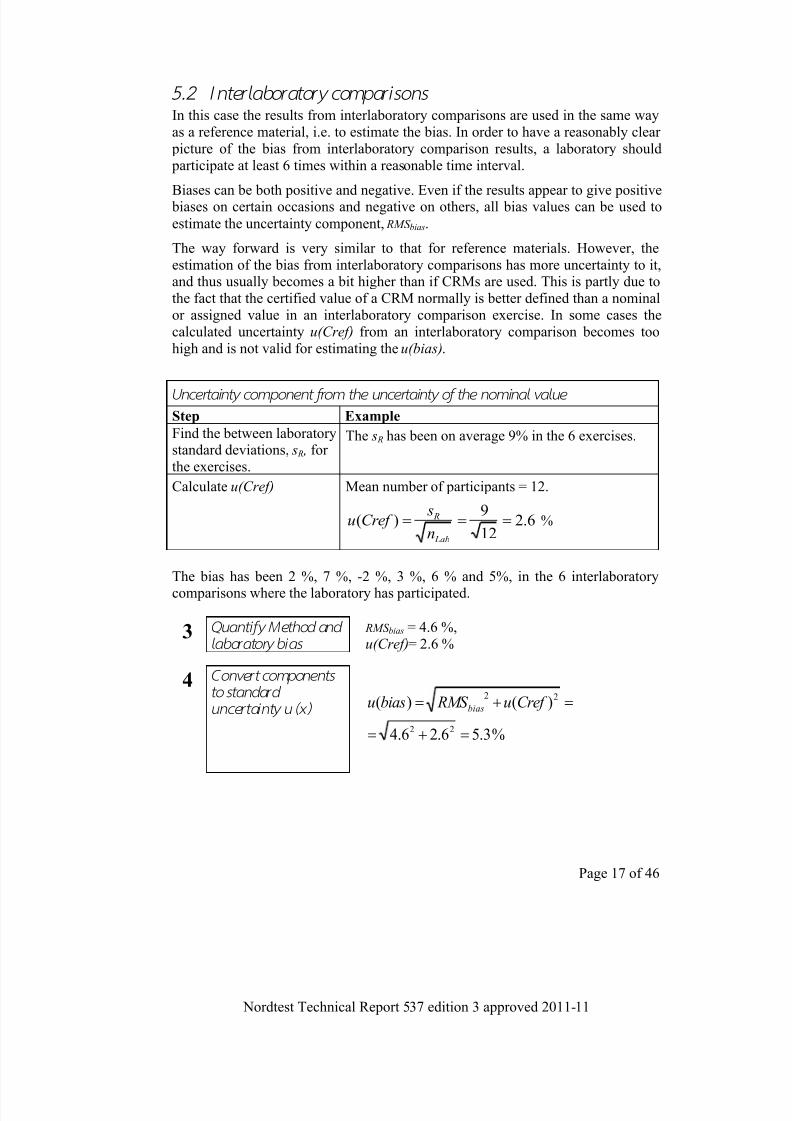
In this case the results from interlaboratory comparisons are used in the same wayas a reference material, i.e. to estimate the bias. In order to have a reasonably clear picture of the bias from interlaboratory comparison results, a laboratory should participate at least 6 times within a reasonable time interval.
Biases can be both positive and negative. Even if the results appear to give positive biases on certain occasions and negative on others, all bias values can be used to
estimate the uncertainty component, RMS bias.
The way forward is very similar to that for reference materials. However, theestimation of the bias from interlaboratory comparisons has more uncertainty to it,and thus usually becomes a bit higher than if CRMs are used. This is partly due tothe fact that the certified value of a CRM normally is better defined than a nominalor assigned value in an interlaboratory comparison exercise. In some cases thecalculated uncertainty u(Cref) from an interlaboratory comparison becomes toohigh and is not valid for estimating the u(bias).
Uncertainty component f rom the uncertainty of the nominal value
Step Example
Find the between laboratorystandard deviations, s R , forthe exercises.
The s R has been on average 9% in the 6 exercises.
Calculate u(Cref) Mean number of participants = 12.
6.212
9)(
Lab
R
n
sCref u %
The bias has been 2 %, 7 %, -2 %, 3 %, 6 % and 5%, in the 6 interlaboratory
comparisons where the laboratory has participated.
3 Quanti fy Method and
laboratory bias
RMS bias = 4.6 %,u(Cref)= 2.6 %
4 Convert components
to standard
uncertainty u (x)
%3.56.26.4
)()(
22
22
Cref u RMS biasu bias
7/26/2019 NORDTEST TR 537 (2011-11) MN
http://slidepdf.com/reader/full/nordtest-tr-537-2011-11-mn 26/54
Nordtest Technical Report 537 edition 3 approved 2011-11
Page 18 of 46
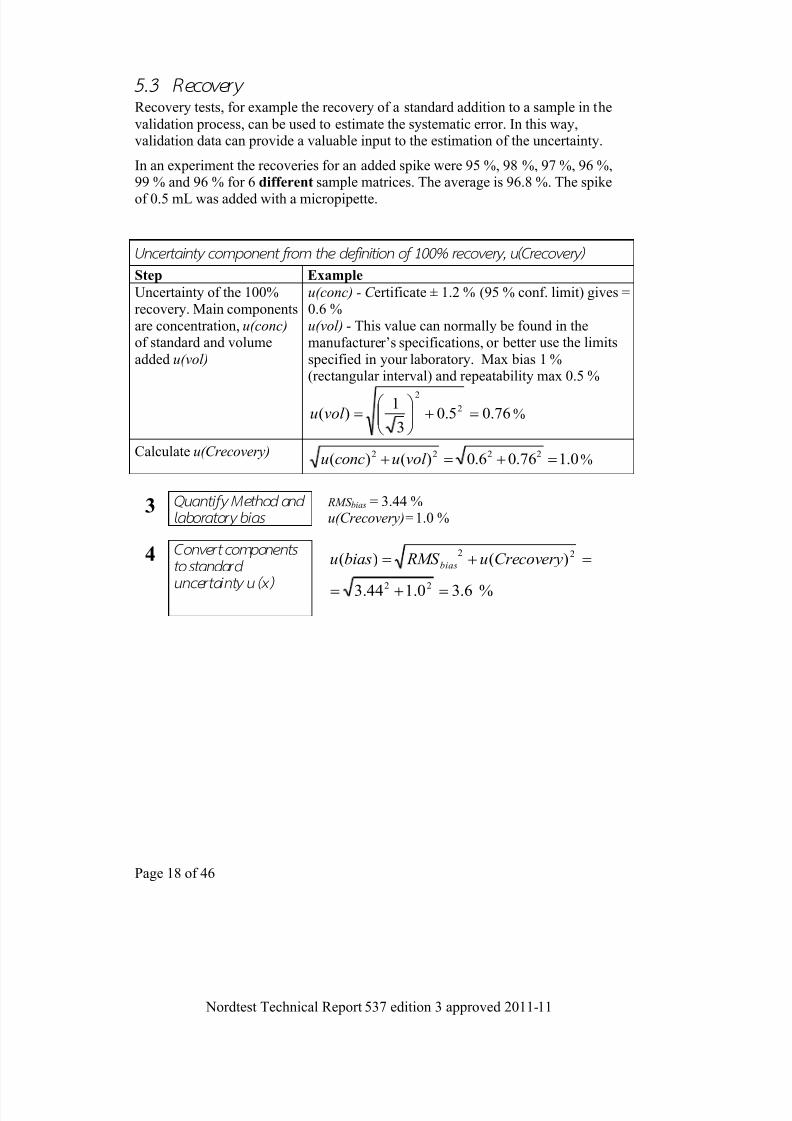
5.3 Recovery
Recovery tests, for example the recovery of a standard addition to a sample in the
validation process, can be used to estimate the systematic error. In this way,validation data can provide a valuable input to the estimation of the uncertainty.
In an experiment the recoveries for an added spike were 95 %, 98 %, 97 %, 96 %,99 % and 96 % for 6 different sample matrices. The average is 96.8 %. The spike
of 0.5 mL was added with a micropipette.
Uncertainty component fr om the defi ni tion of 100% recovery, u(Crecovery)
Step Example
Uncertainty of the 100%recovery. Main componentsare concentration, u(conc) of standard and volume
added u(vol)
u(conc) - C ertificate ± 1.2 % (95 % conf. limit) gives =0.6 %u(vol) - This value can normally be found in themanufacturer’s specifications, or better use the limits
specified in your laboratory. Max bias 1 %(rectangular interval) and repeatability max 0.5 %
76.05.03
1)( 2
2
vol u %
Calculate u(Crecovery) 0.176.06.0)()( 2222 vol uconcu %
3 Quanti fy Method and
laboratory bias
RMS bias = 3.44 %u(Crecovery)=1.0 %
4 Convert components
to standard
uncertainty u (x) %6.30.144.3
)()(
22
22
erycovCreu RMS biasu bias

7/26/2019 NORDTEST TR 537 (2011-11) MN
http://slidepdf.com/reader/full/nordtest-tr-537-2011-11-mn 27/54
Nordtest Technical Report 537 edition 3 approved 2011-11
Page 19 of 46
6 Reproducibility between laboratories, sR
If the demand on uncertainty is low, it can be possible to directly use the s R frominterlaboratory comparisons as an approximation of uc /8/. In such case the
expanded uncertainty becomes R sU 2 . This may be an overestimate depending
on the quality of the laboratory – worst-case scenario. It may also be an
underestimate due to sample inhomogeneity or matrix variations.
6.1 Data given in standard method
In order to use a figure taken directly from the standard method, the laboratorymust prove that they are able to perform in accordance with the standard method/8/, i.e. demonstrating control of bias and verification of the repeatability, s r .Reproducibility data can either be given as a standard deviation s R or asreproducibility limit R and then s R = R/2.8
The example below is taken from ISO/DIS 15586 Water Quality — Determinationof trace elements by atomic absorption spectrometry with graphite furnace. The
matrix is wastewater. Combined uncertainty in wastewater, uc, is taken from the s R
from interlaboratory comparison exercises quoted in the ISO method.Table 1 ISO/DIS 15586 - Results from the interlaboratory comparison – Cd in water with
graphite furnace AAS. The wastewater was digested by the participants.
Cd nLab Outliers Nominal value Mean Recovery, s r s R
µg/L µg/L % % %
Synthetic Lower 33 1 0.3 0.303 101 3.5 17.0
Synthetic Higher 34 2 2.7 2.81 104 1.9 10.7
Fresh water Lower 31 2 0.572 2.9 14.9
Fresh water Higher 31 3 3.07 2.1 10.4
Wastewater
27 2 1.00 3.1 27.5
Measurand Combined Uncertainty uc Expanded Uncertainty U
Cd uc = 27.5 % 2·uc = 55 % 50 %
6.2 Data f rom inter laboratory comparisons
Interlaboratory comparisons are valuable tools in uncertainty evaluation. Thereproducibility between laboratories is normally given directly in reports from the
exercises as s R.These data may well be used by a laboratory (having performed satisfactorily in the
comparisons) as the standard uncertainty of the analysed parameter, provided thatthe comparison covers all relevant uncertainty components and steps (see /9/,
7/26/2019 NORDTEST TR 537 (2011-11) MN
http://slidepdf.com/reader/full/nordtest-tr-537-2011-11-mn 28/54
Nordtest Technical Report 537 edition 3 approved 2011-11
Page 20 of 46
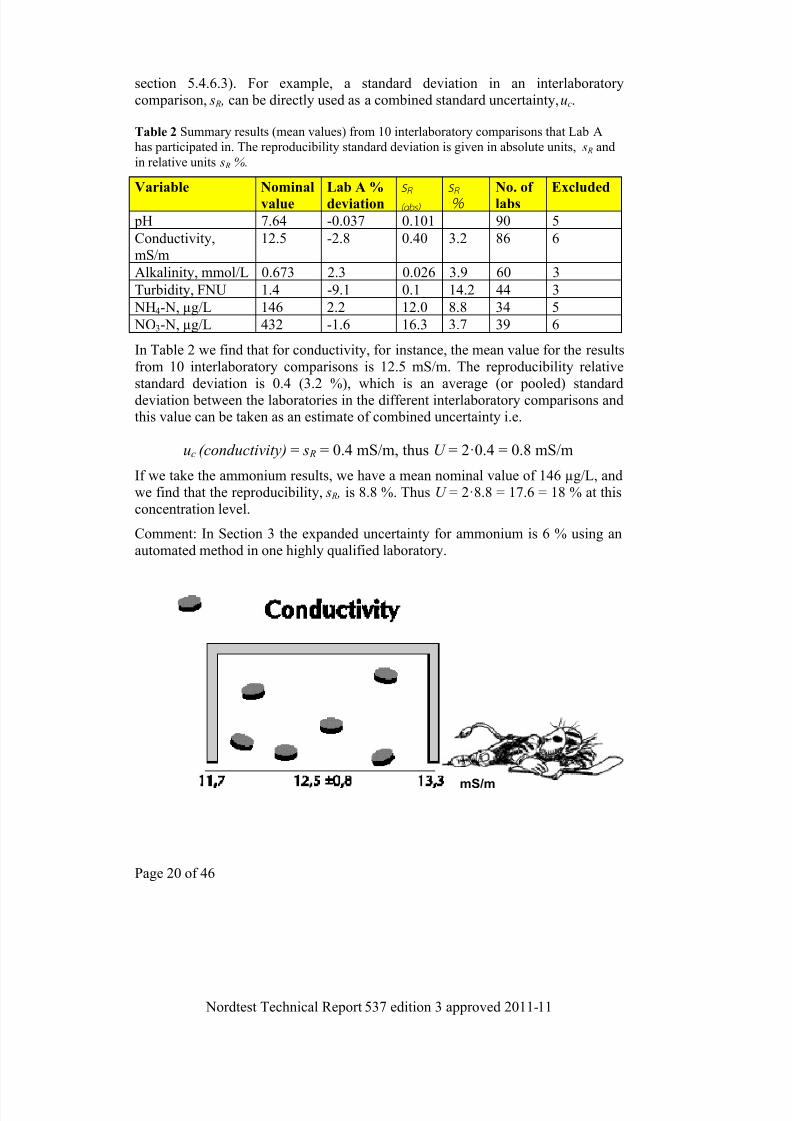
section 5.4.6.3). For example, a standard deviation in an interlaboratorycomparison, s R , can be directly used as a combined standard uncertainty, uc.
Table 2 Summary results (mean values) from 10 interlaboratory comparisons that Lab A
has participated in. The reproducibility standard deviation is given in absolute units, s R and
in relative units s R %.
Variable Nominal
value
Lab A %
deviation
s R
(abs)
s R%
No. of
labs
Excluded
pH 7.64 -0.037 0.101 90 5
Conductivity,mS/m
12.5 -2.8 0.40 3.2 86 6
Alkalinity, mmol/L 0.673 2.3 0.026 3.9 60 3
Turbidity, FNU 1.4 -9.1 0.1 14.2 44 3
NH4-N, µg/L 146 2.2 12.0 8.8 34 5
NO3-N, µg/L 432 -1.6 16.3 3.7 39 6
In Table 2 we find that for conductivity, for instance, the mean value for the resultsfrom 10 interlaboratory comparisons is 12.5 mS/m. The reproducibility relativestandard deviation is 0.4 (3.2 %), which is an average (or pooled) standarddeviation between the laboratories in the different interlaboratory comparisons andthis value can be taken as an estimate of combined uncertainty i.e.
uc (conductivity) = s R = 0.4 mS/m, thus U = 2·0.4 = 0.8 mS/m
If we take the ammonium results, we have a mean nominal value of 146 µg/L, andwe find that the reproducibility, s R , is 8.8 %. Thus U = 2·8.8 = 17.6 = 18 % at thisconcentration level.
Comment: In Section 3 the expanded uncertainty for ammonium is 6 % using anautomated method in one highly qualified laboratory.
mS/m

7/26/2019 NORDTEST TR 537 (2011-11) MN
http://slidepdf.com/reader/full/nordtest-tr-537-2011-11-mn 29/54
Nordtest Technical Report 537 edition 3 approved 2011-11
Page 21 of 46
7 Examples
In this chapter, practical examples on how measurement uncertainty can becalculated using the method of this handbook are given.
7.1 Ammonium in water
Ammonium in water has already been treated in section 3.2 and section 6.2 . Theresults are summarised in Table 3.
Table 3 Measurement uncertainty of ammonium in water – comparison of different
calculations
Uncertainty calculations based on
Relative expandeduncertainty, U
Comment
Control sample + proficiency testing
± 6 % Uncertainty for one goodlaboratory- level 200 µg/L.
Interlaboratorycomparisons
± 18 % Uncertainty in general amonglaboratories – level 150 µg/L
7.2 BOD in wastewater
Biological Oxygen Demand, BOD, is a standard parameter in the monitoring ofwastewater. This example shows how data from ordinary internal quality controlcan be used together with CRM results or data from interlaboratory comparisonexercises to calculate the within-lab reproducibility and bias components of themeasurement uncertainty. The results are summarised in Table 4
Table 4 Measurement uncertainty of BOD in water - comparison of different
calculations
Uncertainty calculations
based on
Relative expanded
uncertainty, U
Comment
Control sample + CRM ± 10 %
Control sample +interlaboratory comparisons
± 10 % n = 3, unreliableestimate
Interlaboratorycomparisons
± 16 % Uncertainty in generalamong laboratories
For BOD at high concentrations, using the dilution analytical method, the majorerror sources are the actual oxygen measurement and variation in the quality of the
seeding solution. These errors will be included in the calculations.
The raw data from the internal quality control, using a CRM, used for the
calculations is shown in Appendix 7.

7/26/2019 NORDTEST TR 537 (2011-11) MN
http://slidepdf.com/reader/full/nordtest-tr-537-2011-11-mn 30/54
Nordtest Technical Report 537 edition 3 approved 2011-11
Page 22 of 46
The laboratory has only participated in three interlaboratory comparison exercisesthe last 2 years (Table 5). At least six would be needed, so here we estimate the bias two different ways – with CRM and with interlaboratory comparisons.
Table 5 BOD - results from interlaboratory comparisons
Exercise Nominal
value
Laboratory
result
Bias s R Number of labs
mg/L mg/L % %
1 154 161 + 4.5 7.2 232 219 210 - 4.1 6.6 253 176 180 +2.3 9.8 19
X +0.9 7.873 22.3
RMS bias 3.76 - -
3 If s R or the number of participants vary substantially from exercise to exercise, then a
pooled standard deviation will be more correct to use. In this case, where the variation in s R is limited, we simply calculate the mean s R (the corresponding pooled standard deviation
becomes 7.82, an insignificant difference).

7/26/2019 NORDTEST TR 537 (2011-11) MN
http://slidepdf.com/reader/full/nordtest-tr-537-2011-11-mn 31/54
Nordtest Technical Report 537 edition 3 approved 2011-11
Page 23 of 46
Example A: BOD with Internal quality control + a CRM
Step Acti on Example: BOD in wastewater
1 Specify Measurand BOD in wastewater, measured with EN1899-1(method with dilution, seeding and ATU). Thedemand on uncertainty is ± 20 %.
2 Quantify u(Rw)
A control sample
B possible steps notcovered by thecontrol sample
A: The control sample, which is a CRM, givesan s = 2.6 % at a level of 206 mg/L O2. s = 2.6% is also when setting the control chart limits.
B: The analysis of the control sample includesall analytical steps after sampling
3 Quantify Method andlaboratory bias
The CRM is certified to 206 5 mg/L O2. Theaverage result of the control chart is 214.8.Thus, there is a bias of 8.8 mg/L = 4.3 %.
The sbias is 2.6 % (n=19)
The u(Cref) is 5 mg/L / 1.96 = 1.2 %
4 Convert components tostandard uncertaintyu(x)
u(Rw ) = 2.6 %
%5.42.119
6.23.4
)()(
2
2
2
2
2
2
Cref un
sbiasbiasu bias
5 Calculate combinedstandard uncertainty, uc uc =
225.46.2 = 5.2 %
6 Calculate expanded
uncertainty, cuU 2
%104.102.52 U

7/26/2019 NORDTEST TR 537 (2011-11) MN
http://slidepdf.com/reader/full/nordtest-tr-537-2011-11-mn 32/54
Nordtest Technical Report 537 edition 3 approved 2011-11
Page 24 of 46
Example B: BOD with Internal quality control + interlaboratory comparison
results
Step Acti on Example: BOD in wastewater
1 Specify Measurand BOD in wastewater, measured with EN1899-1(method with dilution, seeding and ATU). Thedemand on uncertainty is ± 20 %.
2 Quantify u(Rw)
A control sample
B possible steps notcovered by thecontrol sample
A: The control sample, which is a CRM, givesan s of 2.6 % at a level of 206 mg/L O2. s = 2.6% is also used as s when setting the controlchart limits.
B: The analysis of the control sample includesall analytical steps after sampling
3 Quantify Method andlaboratory biasData from Table 5
RMS bias = 3.76
67.13.22
9.7)( n
sCref u R
4 Convert components tostandard uncertainty
u(x)
u(Rw ) = 2.6 %
%11.467.176.3
)()(
22
22
Cref u RMS biasubias
5 Calculate combinedstandard uncertainty, uc uc = 86.411.46.2
22 %
6 Calculate expanded
uncertainty, cuU 2 %107.986.42 U

7/26/2019 NORDTEST TR 537 (2011-11) MN
http://slidepdf.com/reader/full/nordtest-tr-537-2011-11-mn 33/54
Nordtest Technical Report 537 edition 3 approved 2011-11
Page 25 of 46
7.3 PCB in sediment
In this example, the u(Rw ) is estimated from a quality control sample and theu(bias) is estimated from two different sources: in the first example the use of aCRM and in the second example participation in interlaboratory comparisons. Inthe summary table both ways of calculating the u(bias) will be compared.
For this analysis, the sample-work up is a major error source (both for random andsystematic errors), and it is thus crucial that this step is included in the calculations.
The number of interlaboratory comparisons is too few to get a good estimate.
Example C: PCB with Internal quality control + a CRM
Step Action Example: PCB in sediment
1 Specify Measurand Sum of 7 PCB:s in sediment by extraction andGC-MS(SIM). Demand on expandeduncertainty is ± 20 %.
2 Quantify u(Rw)
A control sample
B possible steps notcovered by thecontrol sample
A: The control sample, which is a CRM, givesan s Rw = 8 % at a level of 150 µg/kg dry matter.
s Rw = 8 % is also used when setting the controlchart limits.B: The analysis of the control sample includesall steps except for drying the sample todetermine the dry weight. The uncertaintycontribution from that step is considered smalland is not accounted for.
3 Quantifymethod andlaboratory bias
The CRM is certified to 152 14 µg/kg. Theaverage result of the control chart is 144. Thus,there is a bias = 5.3 %.The sbias = 8 % (n=22)u(Cref) 14 µg/kg/1.96, which is 4.7 % relative.
4 Convert components tostandard uncertaintyu(x)
u(Rw ) = 8 %
29.77.422
83.5
)()(
2
2
2
2
2
2
Cref un
sbiasbiasu bias
5 Calculate combinedstandard uncertainty, uc
uc =22
29.78 = 10.8 %
6 Calculate expanded
uncertainty, cuU 2
%226.218.102 U
7/26/2019 NORDTEST TR 537 (2011-11) MN
http://slidepdf.com/reader/full/nordtest-tr-537-2011-11-mn 34/54
Nordtest Technical Report 537 edition 3 approved 2011-11
Page 26 of 46
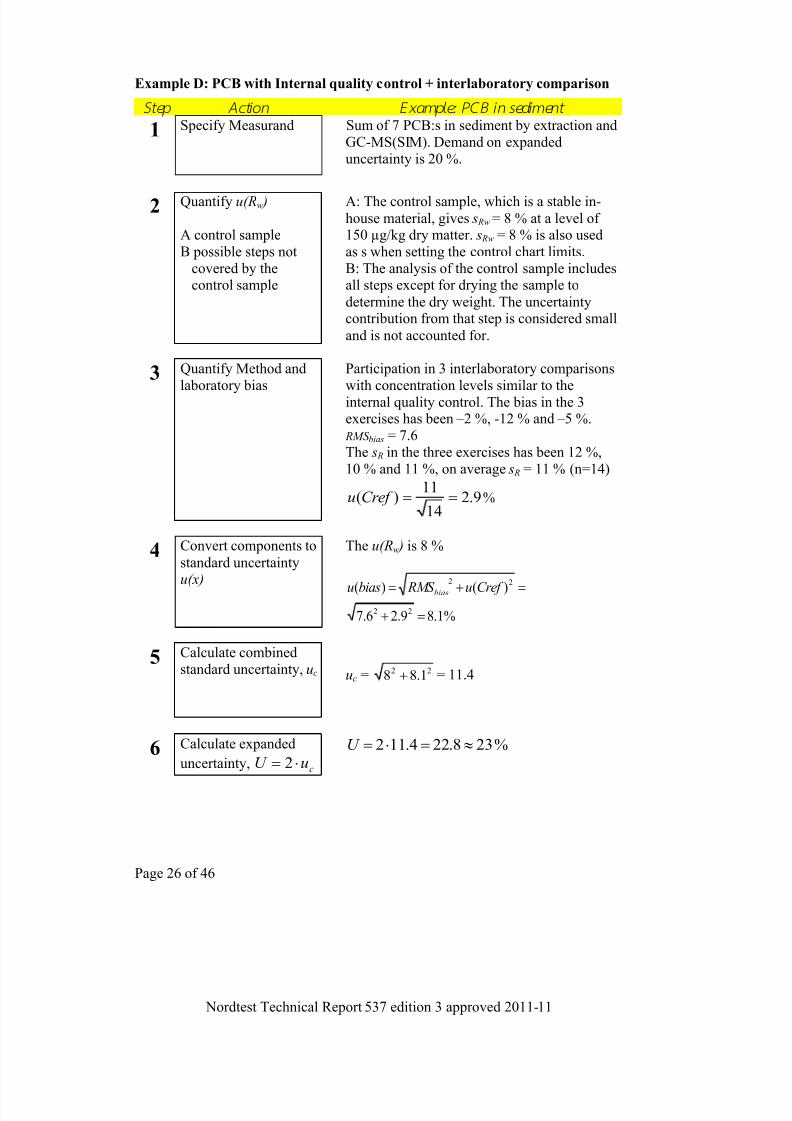
Example D: PCB with Internal quality control + interlaboratory comparison
Step Acti on Example: PCB in sediment
1 Specify Measurand Sum of 7 PCB:s in sediment by extraction andGC-MS(SIM). Demand on expandeduncertainty is 20 %.
2 Quantify u(Rw )
A control sampleB possible steps not
covered by thecontrol sample
A: The control sample, which is a stable in-house material, gives s Rw = 8 % at a level of150 µg/kg dry matter. s Rw = 8 % is also usedas s when setting the control chart limits.B: The analysis of the control sample includesall steps except for drying the sample to
determine the dry weight. The uncertaintycontribution from that step is considered small
and is not accounted for.
3 Quantify Method and
laboratory bias
Participation in 3 interlaboratory comparisons
with concentration levels similar to theinternal quality control. The bias in the 3exercises has been – 2 %, -12 % and – 5 %. RMS bias = 7.6The s R in the three exercises has been 12 %,10 % and 11 %, on average s R = 11 % (n=14)
9.214
11)( Cref u %
4 Convert components to
standard uncertaintyu(x)
The u(Rw ) is 8 %
%1.89.26.7
)()(22
22
Cref u RMS biasu bias
5 Calculate combinedstandard uncertainty, uc uc =
221.88 = 11.4
6 Calculate expanded
uncertainty, cuU 2
%238.224.112 U
7/26/2019 NORDTEST TR 537 (2011-11) MN
http://slidepdf.com/reader/full/nordtest-tr-537-2011-11-mn 35/54
Nordtest Technical Report 537 edition 3 approved 2011-11
Page 27 of 46
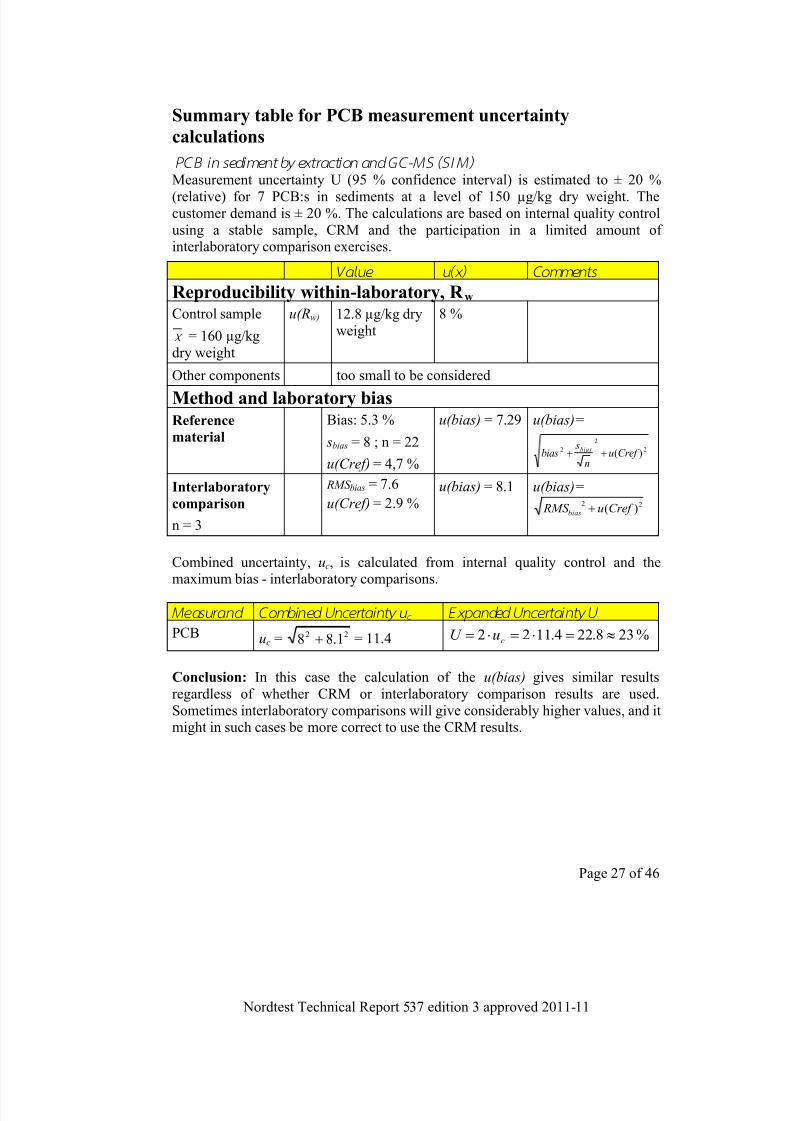
Summary table for PCB measurement uncertainty
calculations
PCB in sediment by extraction and GC-MS (SIM )
Measurement uncertainty U (95 % confidence interval) is estimated to ± 20 %
(relative) for 7 PCB:s in sediments at a level of 150 µg/kg dry weight. Thecustomer demand is ± 20 %. The calculations are based on internal quality controlusing a stable sample, CRM and the participation in a limited amount ofinterlaboratory comparison exercises.
Value u(x) Comments
Reproducibility within-laboratory, R w Control sample
X = 160 µg/kgdry weight
u(Rw) 12.8 µg/kg dryweight
8 %
Other components too small to be considered
Method and laboratory biasReference
material
Bias: 5.3 %
sbias = 8 ; n = 22
u(Cref) = 4,7 %
u(bias) = 7.29 u(bias)=
2
2
2 )(Cref un
sbias bias
Interlaboratory
comparison
n = 3
RMS bias = 7.6
u(Cref) = 2.9 %u(bias) = 8.1 u(bias)=
22)(Cref u RMS bias
Combined uncertainty, uc, is calculated from internal quality control and themaximum bias - interlaboratory comparisons.
Measurand Combined Uncertainty u c Expanded Uncertainty U
PCB uc =22 1.88 = 11.4 %238.224.1122 cuU
Conclusion: In this case the calculation of the u(bias) gives similar resultsregardless of whether CRM or interlaboratory comparison results are used.Sometimes interlaboratory comparisons will give considerably higher values, and itmight in such cases be more correct to use the CRM results.
7/26/2019 NORDTEST TR 537 (2011-11) MN
http://slidepdf.com/reader/full/nordtest-tr-537-2011-11-mn 36/54
Nordtest Technical Report 537 edition 3 approved 2011-11
Page 28 of 46
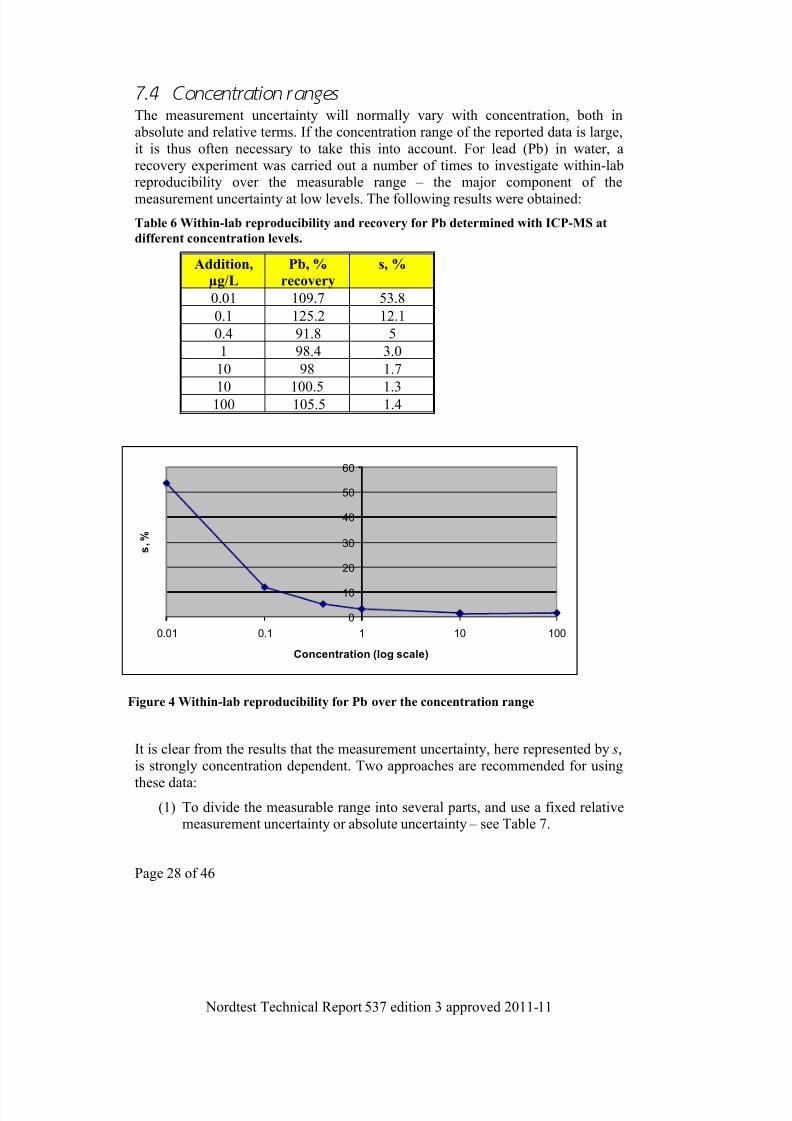
7.4 Concentration ranges
The measurement uncertainty will normally vary with concentration, both inabsolute and relative terms. If the concentration range of the reported data is large,it is thus often necessary to take this into account. For lead (Pb) in water, arecovery experiment was carried out a number of times to investigate within-labreproducibility over the measurable range – the major component of the
measurement uncertainty at low levels. The following results were obtained:
Table 6 Within-lab reproducibility and recovery for Pb determined with ICP-MS at
different concentration levels.
Addition,
µg/L
Pb, %
recovery
s, %
0.01 109.7 53.8
0.1 125.2 12.1
0.4 91.8 5
1 98.4 3.0
10 98 1.7
10 100.5 1.3100 105.5 1.4
It is clear from the results that the measurement uncertainty, here represented by s,is strongly concentration dependent. Two approaches are recommended for using
these data:(1) To divide the measurable range into several parts, and use a fixed relative
measurement uncertainty or absolute uncertainty – see Table 7.
0
10
20
30
40
50
60
0.01 0.1 1 10 100
Concentration (log scale)
s ,
%
Figure 4 Within-lab reproducibility for Pb over the concentration range

7/26/2019 NORDTEST TR 537 (2011-11) MN
http://slidepdf.com/reader/full/nordtest-tr-537-2011-11-mn 37/54
Nordtest Technical Report 537 edition 3 approved 2011-11
Page 29 of 46
Table 7 Within-lab reproducibility for Pb divided into three concentration ranges
Within-lab reproducibility Pb
Range (µg/L) s(rel) s(rel) or (abs)
0.01-0.09 50 % 0.01 (µg/L)
0.1 - 10 10 % 10 %> 10 2 % 2 %
In the second column s is relative and given in %. In the third column s is also
relative but an absolute value is given in the lower range close to the detectionlimit.
(2) To use an equation that describes how the measurement uncertainty varies withconcentration
Plotting s % against 1/concentration gives a straight line, and a relatively simpleequation. (see Figure 5).
Figure 5: The relationship between within-lab reproducibility and the invertedconcentration for Pb in the range 0.1 – 100 µg/L.
The straight-line equation above tells us that the within-lab reproducibility equals
1.06 multiplied with 1/concentration plus 1.77. For example, at a concentration of 2µg/L the within-lab reproducibility becomes 1.06·1/2 + 1.77 = 2.3 %. Whenreporting to customers, the laboratory can choose between quoting the formula orcalculating the measurement uncertainty for each value, using the formula. For
further reading, see for example /2/.
y = 1.06x + 1,77
R2 = 0.9798
0
5
10
15
0 2 4 6 8 10 12
1/concentration
s
%

7/26/2019 NORDTEST TR 537 (2011-11) MN
http://slidepdf.com/reader/full/nordtest-tr-537-2011-11-mn 38/54
Nordtest Technical Report 537 edition 3 approved 2011-11
Page 30 of 46
8 Reporting uncertainty
This is an example on what a data report could look like, when measurementuncertainty has been calculated and is reported together with the data. Thecompany and accreditation body logotypes are omitted, and the report does notcontain all information normally required for an accredited laboratory. It isrecommended to use either relative or absolute values for the benefit of the
customer.
Analytical Report
Sample identification: P1 – P4Samples received: 14 December 2002Analysis period: 14 – 16 December 2002
Results
NH4-N (µg/L):Sample Result U Method
P1 103 6% 23B
P2 122 6% 23B
P3 12 10% 23B
P4 14 10% 23B
TOC (mg/L)
Sample Result U Method
P1 40 4.0 12-3
P2 35 3.5 12-3
P3 10 1.0 12-3P4 9 0.9 12-3
Signed: Dr Analyst

7/26/2019 NORDTEST TR 537 (2011-11) MN
http://slidepdf.com/reader/full/nordtest-tr-537-2011-11-mn 39/54
Nordtest Technical Report 537 edition 3 approved 2011-11
Page 31 of 46
The laboratory should also prepare a note explaining how the measurementuncertainty has been calculated for the different parameters. Normally, such anexplanatory note should be communicated to regular customers and othercustomers who ask for information. An example is given below:
Note on measurement uncertainty from Dr Analyst’s laboratory
Measurement uncertainty:
U = expanded Measurement Uncertainty, estimated from control sample
results, interlaboratory comparison and the analyses of CRMs, using acoverage factor of 2 to reach approximately 95% confidence level.
NH4-N: U is estimated to 6% above 100 µg/L and 10% below 100 µg/L.
TOC: U is estimated to 10% over the whole concentration range.
References:
Guide To The Expression Of Uncertainty In Measurement (GUM)
Quantifying Uncertainty in Analytical Measurement.EURACHEM/CITAC Guide
Handbook for calculation of measurement uncertainty in
environmental laboratories
7/26/2019 NORDTEST TR 537 (2011-11) MN
http://slidepdf.com/reader/full/nordtest-tr-537-2011-11-mn 40/54
Nordtest Technical Report 537 edition 3 approved 2011-11
Page 32 of 46
9 References
1. Guide To The Expression Of Uncertainty In Measurement (GUM). BIPM,IEC, IFCC, ISO, IUPAC, IUPAP, OIML. International Organization ofStandardization, Geneva Switzerland, 1
st Edition 1993, Corrected and reprinted
1995.
2. Quantifying Uncertainty in Analytical Measurement. EURACHEM/CITAC
Guide, 2nd
Edition, 2000
3. Measurement Uncertainty in Testing, Eurolab Technical Report No. 1/2002
4. Interlaboratory comparison test data, personal communication, H. Hovind, NIVA, Norway.
5. ISO Guide 99 (2007) International vocabulary of metrology basic and general
concepts and associated terms, VIM, 3rd edn. ISO, Geneva, Switzerland
6. ISO/IEC 3534-1-2, Statistics – Vocabulary and symbols Parts 1-2
7. ISO 5725-1-6:1994, Accuracy (trueness and precision) of measurementmethods and results
8. ISO/TS 21748:2004, Guide to the use of repeatability, reproducibility andtrueness estimates in measurement uncertainty estimation
9. EN ISO/IEC 17025:2005, General Requirements for the Competence ofCalibration and Testing Laboratories
10. ISO/TR 13530:1997, Water quality – Guide to analytical quality control for
water analysis
11. EN ISO 11732:1997, Water quality -- Determination of ammonium nitrogen byflow analysis (CFA and FIA) and spectrometric detection
12. EA-4/16: EA guideline on The Expression of uncertainty in quantitativetesting,.www.european-accreditation.org
13. ISO8258, First edition, 1991-12-15, Shewhart Control Charts
14. V. J. Barwick, Ellison L.R., Analyst, 1999, 124, 981-990
15. E. Hund, D.L. Massart and J. Smeyers-Verbeke, Operational definitions of
uncertainty. TrAC, 20 (8), 2001
7/26/2019 NORDTEST TR 537 (2011-11) MN
http://slidepdf.com/reader/full/nordtest-tr-537-2011-11-mn 41/54
Nordtest Technical Report 537 edition 3 approved 2011-11
Page 33 of 46
10 Appendices
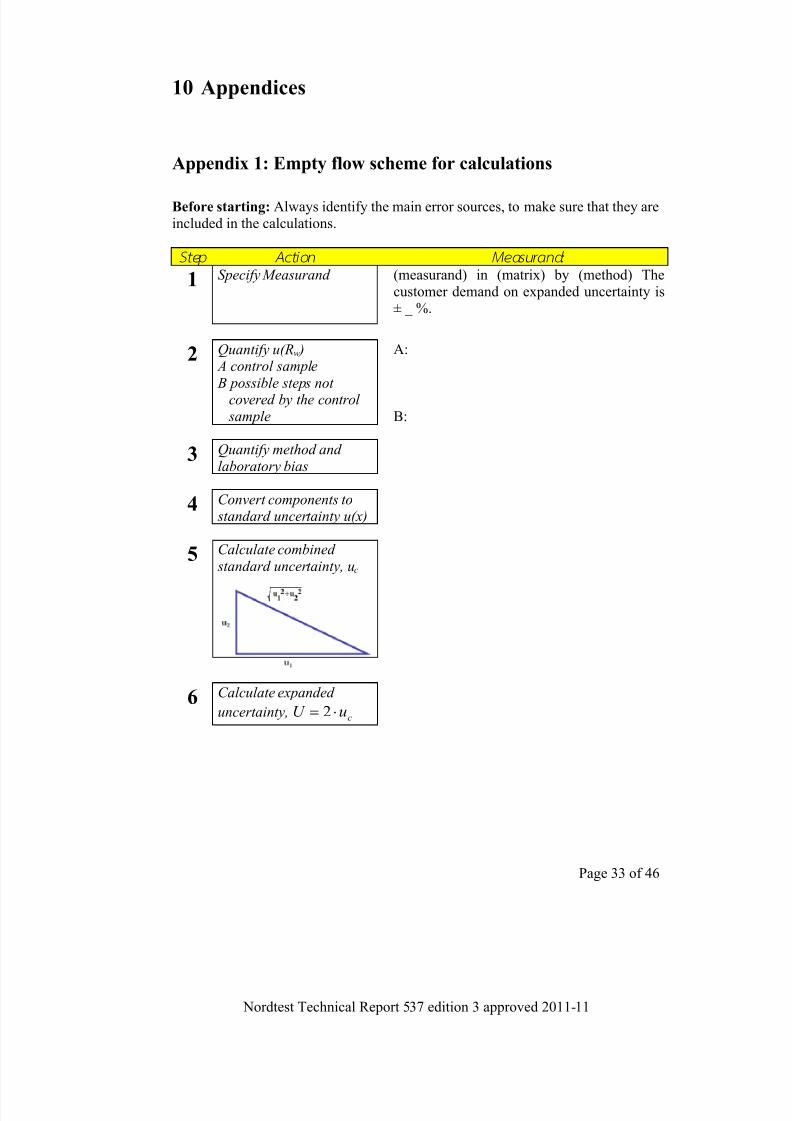
Appendix 1: Empty flow scheme for calculations
Before starting: Always identify the main error sources, to make sure that they areincluded in the calculations.
Step Action Measurand:
1 Specify Measurand (measurand) in (matrix) by (method) Thecustomer demand on expanded uncertainty is± _ %.
2 Quantify u(Rw ) A control sample
B possible steps notcovered by the control sample
A:
B:
3 Quantify method andlaboratory bias
4 Convert components to standard uncertainty u(x)
5 Calculate combined standard uncertainty, uc
6 Calculate expanded
uncertainty, cuU 2
7/26/2019 NORDTEST TR 537 (2011-11) MN
http://slidepdf.com/reader/full/nordtest-tr-537-2011-11-mn 42/54
Nordtest Technical Report 537 edition 3 approved 2011-11
Page 34 of 46
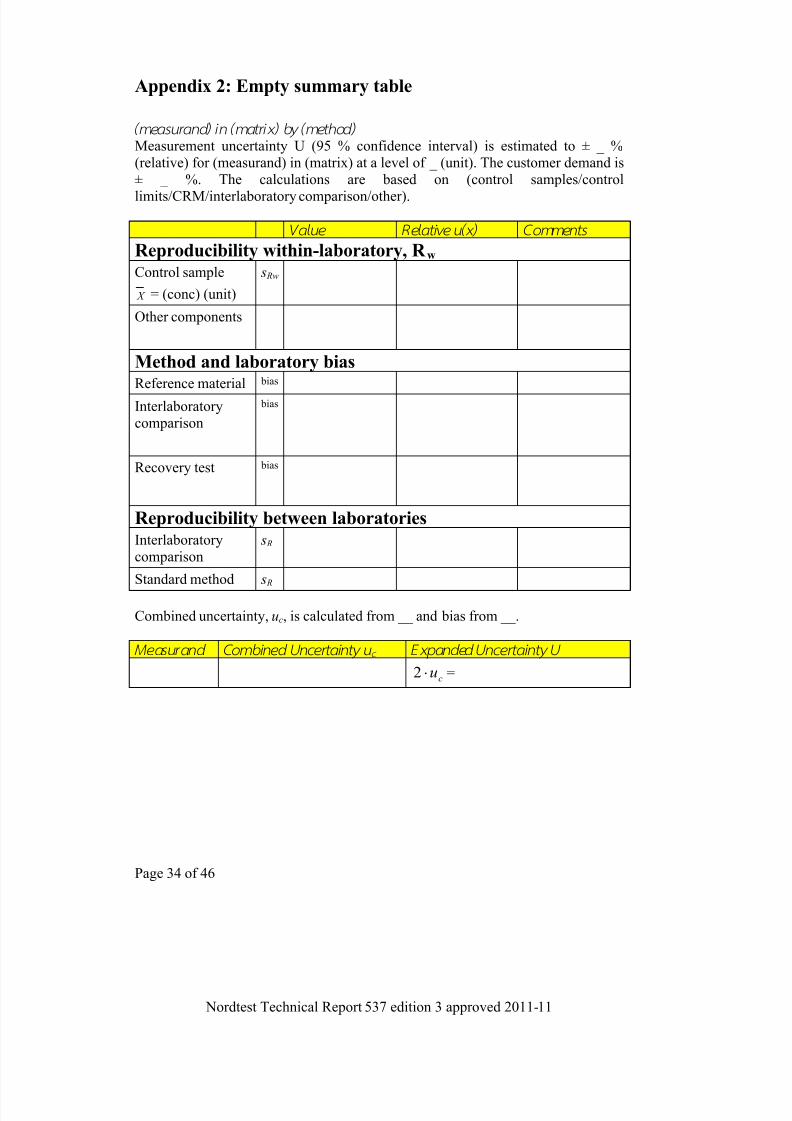
Appendix 2: Empty summary table
(measurand) in (matri x) by (method)
Measurement uncertainty U (95 % confidence interval) is estimated to ± _ %(relative) for (measurand) in (matrix) at a level of _ (unit). The customer demand is± _ %. The calculations are based on (control samples/control
limits/CRM/interlaboratory comparison/other).
Value Relative u(x) Comments
Reproducibility within-laboratory, R w Control sample
X = (conc) (unit)
s Rw
Other components
Method and laboratory biasReference material bias
Interlaboratorycomparison
bias
Recovery test bias
Reproducibility between laboratoriesInterlaboratorycomparison
s R
Standard method s R
Combined uncertainty, uc, is calculated from __ and bias from __.
Measurand Combined Uncertainty u c Expanded Uncertainty U
cu2 =
7/26/2019 NORDTEST TR 537 (2011-11) MN
http://slidepdf.com/reader/full/nordtest-tr-537-2011-11-mn 43/54
Nordtest Technical Report 537 edition 3 approved 2011-11
Page 35 of 46
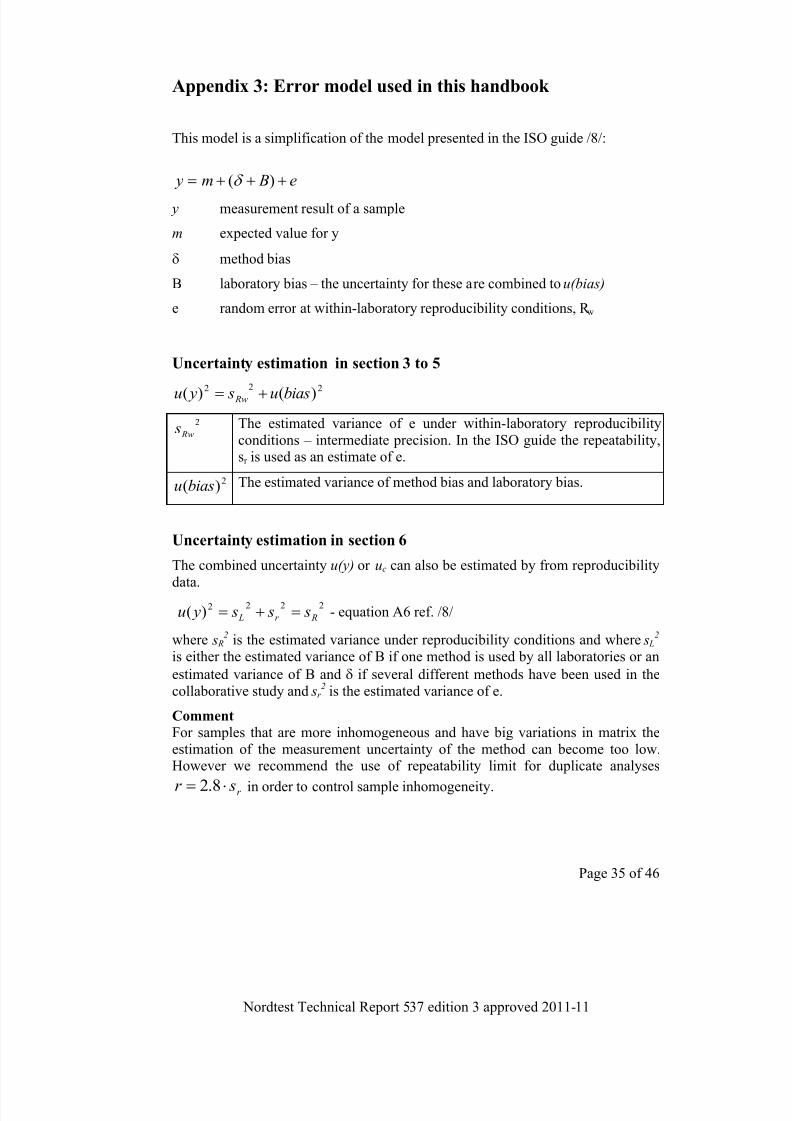
Appendix 3: Error model used in this handbook
This model is a simplification of the model presented in the ISO guide /8/:
e Bm y )(
y measurement result of a sample
m expected value for y
method bias
B laboratory bias – the uncertainty for these are combined to u(bias)
e random error at within-laboratory reproducibility conditions, R w
Uncertainty estimation in section 3 to 5
22
2 )()( biasu s yu Rw
2
Rw s The estimated variance of e under within-laboratory reproducibilityconditions – intermediate precision. In the ISO guide the repeatability,sr is used as an estimate of e.
2)(biasu The estimated variance of method bias and laboratory bias.
Uncertainty estimation in section 6
The combined uncertainty u(y) or uc can also be estimated by from reproducibility
data.2222)( Rr L s s s yu - equation A6 ref. /8/
where s R2 is the estimated variance under reproducibility conditions and where s L
2 is either the estimated variance of B if one method is used by all laboratories or an
estimated variance of B and if several different methods have been used in thecollaborative study and sr
2 is the estimated variance of e.
Comment
For samples that are more inhomogeneous and have big variations in matrix theestimation of the measurement uncertainty of the method can become too low.However we recommend the use of repeatability limit for duplicate analyses
r sr 8.2 in order to control sample inhomogeneity.
7/26/2019 NORDTEST TR 537 (2011-11) MN
http://slidepdf.com/reader/full/nordtest-tr-537-2011-11-mn 44/54
Nordtest Technical Report 537 edition 3 approved 2011-11
Page 36 of 46
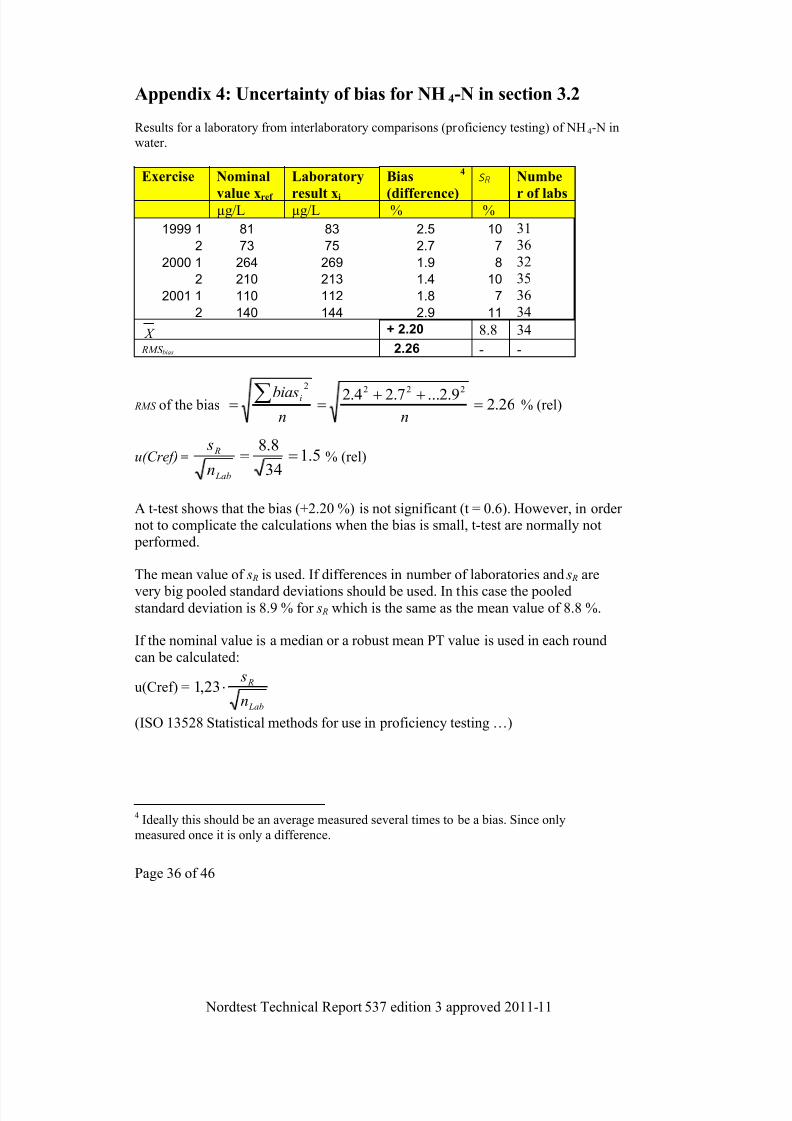
Appendix 4: Uncertainty of bias for NH4-N in section 3.2
Results for a laboratory from interlaboratory comparisons (proficiency testing) of NH4-N in
water.
Exercise Nominal
value xref
Laboratory
result xi
Bias4
(difference)
s R Numbe
r of labsµg/L µg/L % %
1999 1 81 83 2.5 10 31
2 73 75 2.7 7 36
2000 1 264 269 1.9 8 32
2 210 213 1.4 10 35
2001 1 110 112 1.8 7 36
2 140 144 2.9 11 34
X + 2.20 8.8 34
RMS bias 2.26 - -
RMS of the bias 26.29.2...7.24.2 222
2
nnbiasi % (rel)
u(Cref) = 5.134
8.8
Lab
R
n
s% (rel)
A t-test shows that the bias (+2.20 %) is not significant (t = 0.6). However, in ordernot to complicate the calculations when the bias is small, t-test are normally not performed.
The mean value of s R is used. If differences in number of laboratories and s R are
very big pooled standard deviations should be used. In this case the pooledstandard deviation is 8.9 % for s R which is the same as the mean value of 8.8 %.
If the nominal value is a median or a robust mean PT value is used in each roundcan be calculated:
u(Cref) =
Lab
R
n
s23,1
(ISO 13528 Statistical methods for use in proficiency testing …)
4 Ideally this should be an average measured several times to be a bias. Since only
measured once it is only a difference.
7/26/2019 NORDTEST TR 537 (2011-11) MN
http://slidepdf.com/reader/full/nordtest-tr-537-2011-11-mn 45/54
Nordtest Technical Report 537 edition 3 approved 2011-11
Page 37 of 46
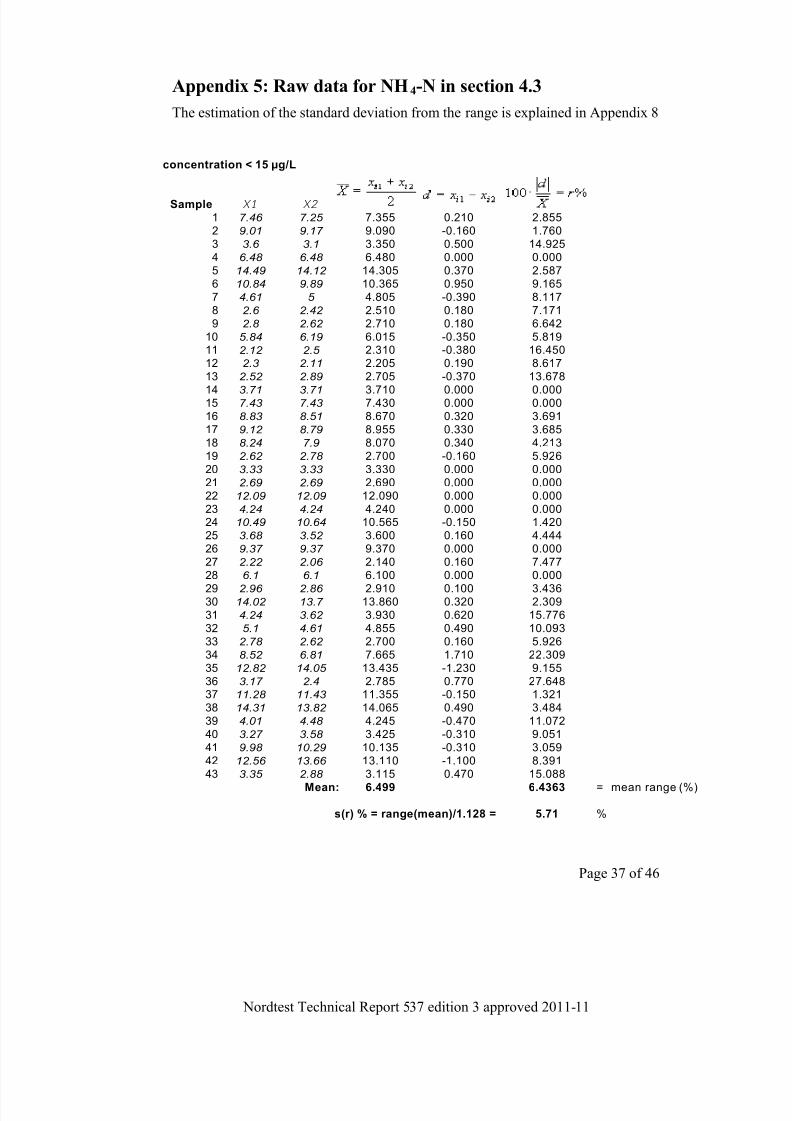
Appendix 5: Raw data for NH4-N in section 4.3
The estimation of the standard deviation from the range is explained in Appendix 8
concentration < 15 µg/L
Sample X 1 X 2
1 7.46 7.25 7.355 0.210 2.8552 9.01 9.17 9.090 -0.160 1.7603 3.6 3.1 3.350 0.500 14.9254 6.48 6.48 6.480 0.000 0.0005 14.49 14.12 14.305 0.370 2.5876 10.84 9.89 10.365 0.950 9.1657 4.61 5 4.805 -0.390 8.1178 2.6 2.42 2.510 0.180 7.1719 2.8 2.62 2.710 0.180 6.642
10 5.84 6.19 6.015 -0.350 5.81911 2.12 2.5 2.310 -0.380 16.45012 2.3 2.11 2.205 0.190 8.61713 2.52 2.89 2.705 -0.370 13.678
14 3.71 3.71 3.710 0.000 0.00015 7.43 7.43 7.430 0.000 0.00016 8.83 8.51 8.670 0.320 3.69117 9.12 8.79 8.955 0.330 3.68518 8.24 7.9 8.070 0.340 4.21319 2.62 2.78 2.700 -0.160 5.92620 3.33 3.33 3.330 0.000 0.00021 2.69 2.69 2.690 0.000 0.00022 12.09 12.09 12.090 0.000 0.00023 4.24 4.24 4.240 0.000 0.00024 10.49 10.64 10.565 -0.150 1.42025 3.68 3.52 3.600 0.160 4.44426 9.37 9.37 9.370 0.000 0.00027 2.22 2.06 2.140 0.160 7.47728 6.1 6.1 6.100 0.000 0.000
29 2.96 2.86 2.910 0.100 3.43630 14.02 13.7 13.860 0.320 2.30931 4.24 3.62 3.930 0.620 15.77632 5.1 4.61 4.855 0.490 10.09333 2.78 2.62 2.700 0.160 5.92634 8.52 6.81 7.665 1.710 22.30935 12.82 14.05 13.435 -1.230 9.15536 3.17 2.4 2.785 0.770 27.64837 11.28 11.43 11.355 -0.150 1.32138 14.31 13.82 14.065 0.490 3.48439 4.01 4.48 4.245 -0.470 11.07240 3.27 3.58 3.425 -0.310 9.05141 9.98 10.29 10.135 -0.310 3.05942 12.56 13.66 13.110 -1.100 8.39143 3.35 2.88 3.115 0.470 15.088
Mean: 6.499 6.4363 = mean range (%)
s(r) % = range(mean)/1.128 = 5.71 %

7/26/2019 NORDTEST TR 537 (2011-11) MN
http://slidepdf.com/reader/full/nordtest-tr-537-2011-11-mn 46/54
Nordtest Technical Report 537 edition 3 approved 2011-11
Page 38 of 46
concentration > 15 µg/L
Sample X1 X2
1 37.62 36.85 37.235 0.770 2.068
2 16.18 16.56 16.370 -0.380 2.321
3 28.82 28.65 28.735 0.170 0.592
4 4490 4413 4451.500 77.000 1.730
5 135.7 124.7 130.200 11.000 8.449
6 62.56 62.25 62.405 0.310 0.497
7 158.9 159.2 159.050 -0.300 0.189
8 16540 16080 16310.000 460.000 2.820
9 31.26 30.12 30.690 1.140 3.715
10 58.49 60.11 59.300 -1.620 2.732
11 740.5 796.2 768.350 -55.700 7.249
12 130.3 126.9 128.600 3.400 2.644
13 29.35 29.19 29.270 0.160 0.54714 1372 1388 1380.000 -16.000 1.159
15 36.55 44.74 40.645 -8.190 20.150
16 22.57 23.37 22.970 -0.800 3.483
17 34.75 33.15 33.950 1.600 4.713
18 92.93 94.01 93.470 -1.080 1.155
19 40.6 42.23 41.415 -1.630 3.936
20 80.36 86.36 83.360 -6.000 7.198
21 15.76 18.54 17.150 -2.780 16.210
22 78.22 73.76 75.990 4.460 5.869
23 48.89 50.91 49.900 -2.020 4.048
24 17.65 16.72 17.185 0.930 5.412
25 36.56 35.3 35.930 1.260 3.507
26 51.89 52.2 52.045 -0.310 0.596
27 197.5 206.5 202.000 -9.000 4.455
28 70.32 69.22 69.770 1.100 1.577
29 29.99 30.62 30.305 -0.630 2.079
30 31.9 32.36 32.130 -0.460 1.432
Mean: 816.331 4.0843 = mean range (%)
s(r) % = range(mean)/1.128 = 3.62 %
7/26/2019 NORDTEST TR 537 (2011-11) MN
http://slidepdf.com/reader/full/nordtest-tr-537-2011-11-mn 47/54
Nordtest Technical Report 537 edition 3 approved 2011-11
Page 39 of 46
Appendix 6: Raw data for oxygen in Section 4.4
Data plotted in Figure 3. “Range” equals the absolute value of the difference between Result 1 and Result 2.
Res. 1 Res. 2 Range
mg/L mg/L mg/L
8.90 8.91 0.018.99 9.01 0.02
8.90 8.90 0.00
9.11 9.12 0.01
8.68 8.64 0.04
8.60 8.51 0.09
8.81 8.81 0.00
8.02 8.00 0.02
7.05 7.08 0.03
6.98 7.01 0.03
7.13 7.16 0.03
6.79 6.78 0.01
6.55 6.53 0.02
4.68 4.68 0.00
5.28 5.33 0.05
7.42 7.40 0.02
7.62 7.63 0.01
5.88 5.88 0.00
6.03 6.06 0.03
6.33 6.33 0.005.90 5.90 0.00
6.24 6.27 0.03
6.02 6.02 0.00
9.13 9.11 0.02
9.10 9.14 0.04
8.50 8.44 0.06
8.73 8.71 0.02
8.09 8.09 0.00
7.56 7.58 0.02
6.30 6.32 0.02
6.43 6.44 0.01
7.25 7.34 0.09
7.28 7.31 0.03
8.00 8.03 0.03
8.38 8.29 0.09
9.23 9.29 0.06
9.09 9.08 0.01
9.37 9.36 0.019.38 9.37 0.01
9.32 9.25 0.07
8.47 8.49 0.02
8.27 8.28 0.01
8.37 8.31 0.06
8.09 8.15 0.06
8.05 8.03 0.02
7.38 7.40 0.02
7.49 7.49 0.00
4.52 4.49 0.03
4.45 4.44 0.01
4.29 4.27 0.02
mean range: 0.026
mean range/1.128: 0.024
7/26/2019 NORDTEST TR 537 (2011-11) MN
http://slidepdf.com/reader/full/nordtest-tr-537-2011-11-mn 48/54
Nordtest Technical Report 537 edition 3 approved 2011-11
Page 40 of 46
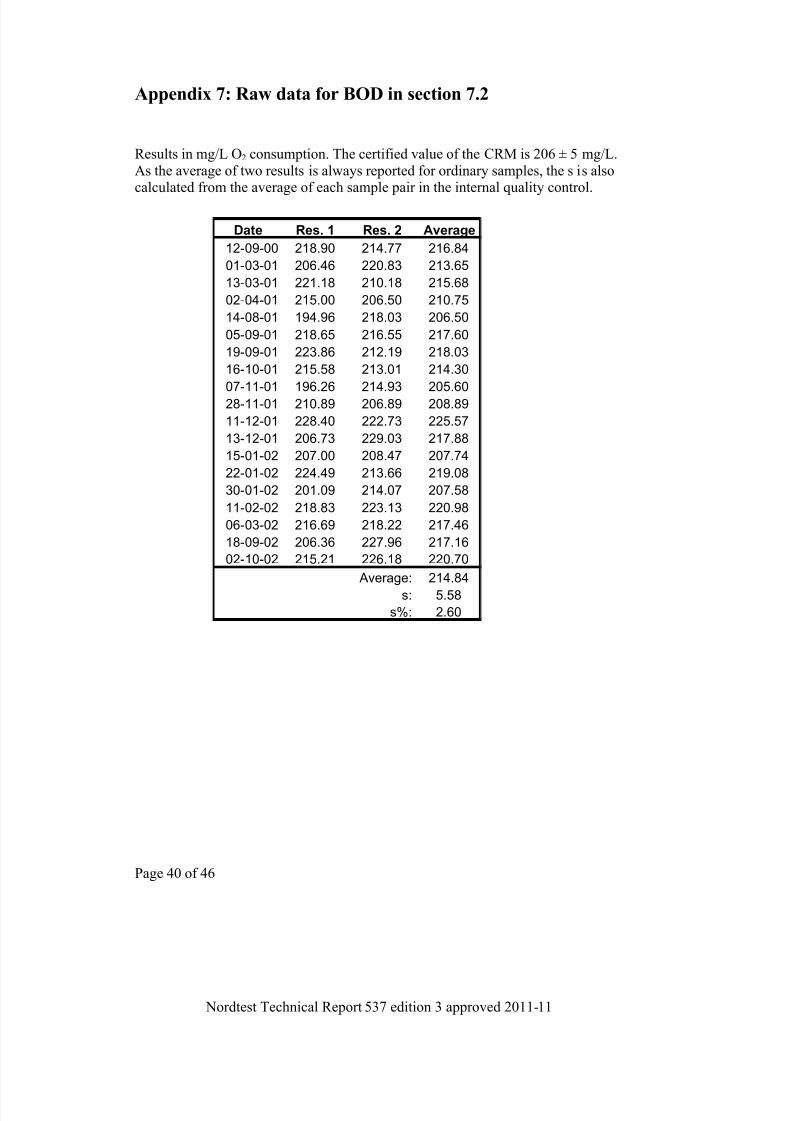
Appendix 7: Raw data for BOD in section 7.2
Results in mg/L O2 consumption. The certified value of the CRM is 206 ± 5 mg/L.As the average of two results is always reported for ordinary samples, the s is alsocalculated from the average of each sample pair in the internal quality control.
Date Res. 1 Res. 2 Average
12-09-00 218.90 214.77 216.84
01-03-01 206.46 220.83 213.65
13-03-01 221.18 210.18 215.68
02-04-01 215.00 206.50 210.75
14-08-01 194.96 218.03 206.50
05-09-01 218.65 216.55 217.60
19-09-01 223.86 212.19 218.03
16-10-01 215.58 213.01 214.30
07-11-01 196.26 214.93 205.6028-11-01 210.89 206.89 208.89
11-12-01 228.40 222.73 225.57
13-12-01 206.73 229.03 217.88
15-01-02 207.00 208.47 207.74
22-01-02 224.49 213.66 219.08
30-01-02 201.09 214.07 207.58
11-02-02 218.83 223.13 220.98
06-03-02 216.69 218.22 217.46
18-09-02 206.36 227.96 217.16
02-10-02 215.21 226.18 220.70
Average: 214.84
s: 5.58
s%: 2.60

7/26/2019 NORDTEST TR 537 (2011-11) MN
http://slidepdf.com/reader/full/nordtest-tr-537-2011-11-mn 49/54
Nordtest Technical Report 537 edition 3 approved 2011-11
Page 41 of 46
Appendix 8: Estimation of standard deviation from range
Number ofsamples
Factor ,d2
Estimation of standard deviation
from range (max-min),
/1/ and /13, page 11/.
The standard deviation, scan be estimated from
2d
range s
where d2 is dependent on
number of measurements (n)
(Example, see Appendix 5 and 6)
n=2 1.128
n=3 1.693
n=4 2.059
n=5 2.326
n=6 2.534
n=7 2.704
n=8 2.847
n=9 2.970
n=10 3.078
For comparison
Rectangularinterval 3.464
95 % conf. limit. 3.92
7/26/2019 NORDTEST TR 537 (2011-11) MN
http://slidepdf.com/reader/full/nordtest-tr-537-2011-11-mn 50/54
Nordtest Technical Report 537 edition 3 approved 2011-11
Page 42 of 46
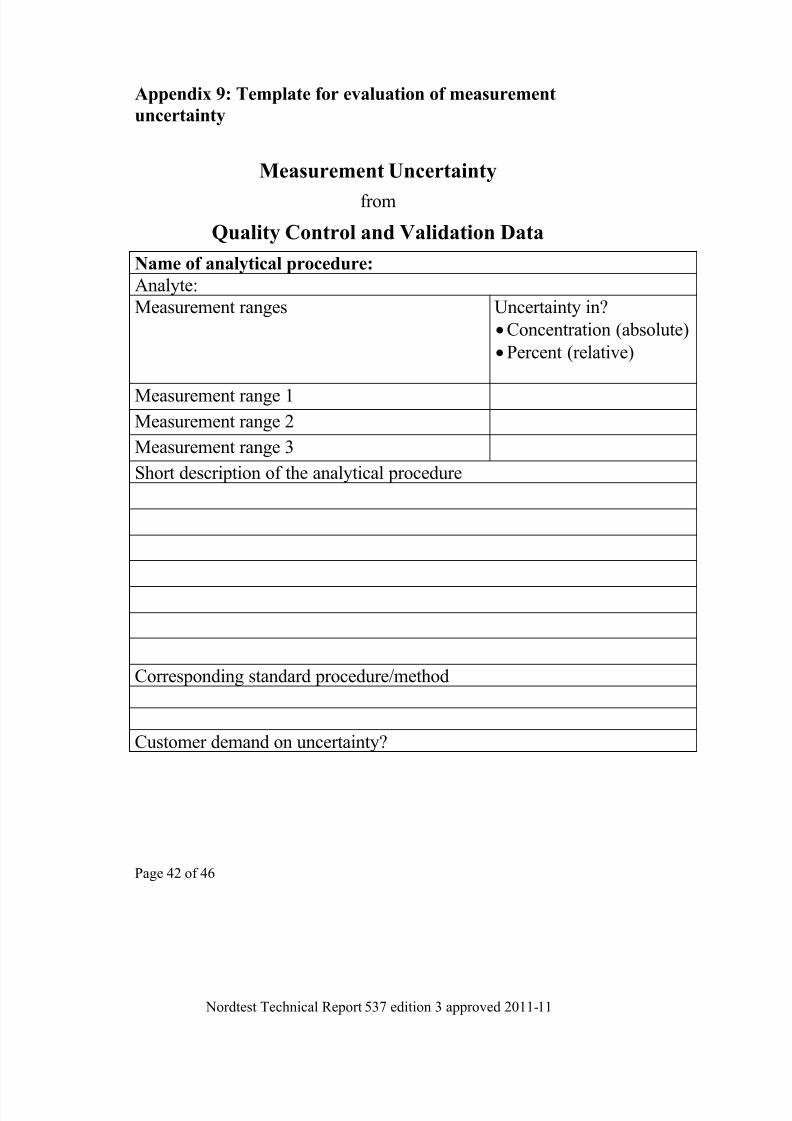
Appendix 9: Template for evaluation of measurement
uncertainty
Measurement Uncertainty
from
Quality Control and Validation Data
Name of analytical procedure:
Analyte:
Measurement ranges Uncertainty in?
Concentration (absolute)
Percent (relative)
Measurement range 1
Measurement range 2
Measurement range 3
Short description of the analytical procedure
Corresponding standard procedure/method
Customer demand on uncertainty?
7/26/2019 NORDTEST TR 537 (2011-11) MN
http://slidepdf.com/reader/full/nordtest-tr-537-2011-11-mn 51/54
Nordtest Technical Report 537 edition 3 approved 2011-11
Page 43 of 46
Reproducibility within laboratory R w – (w=within lab)Control sample: Low Middle High
Composition of control sample
Mean value
Standard deviation, s
Number of determinations, n
Number of months
Nominal value
Preliminary estimate of sRw from the warning limits of the control chart
Warning limits ±
2
limitswarning s prel Rw
Conc. (abs)
% (relative)
List of differences in the procedure/method or property of control samples
compared with test samples and if possible also an indication of size. From
size an estimate of standard uncertainty, u can be made.
Difference Size u
1
2
3
4
Differences could e.g. be sample amount or matrix, instability, temperature,
inhomogeneity, impurities that effects the analytical result. Inhomogeneity
of test samples can be assessed by running duplicates. If there are important
differences increased within-lab reproducibility can be calculated below.
Estimation of an increased sRw
Control sample
22)( sdifference
prel
Rw Rw s s s
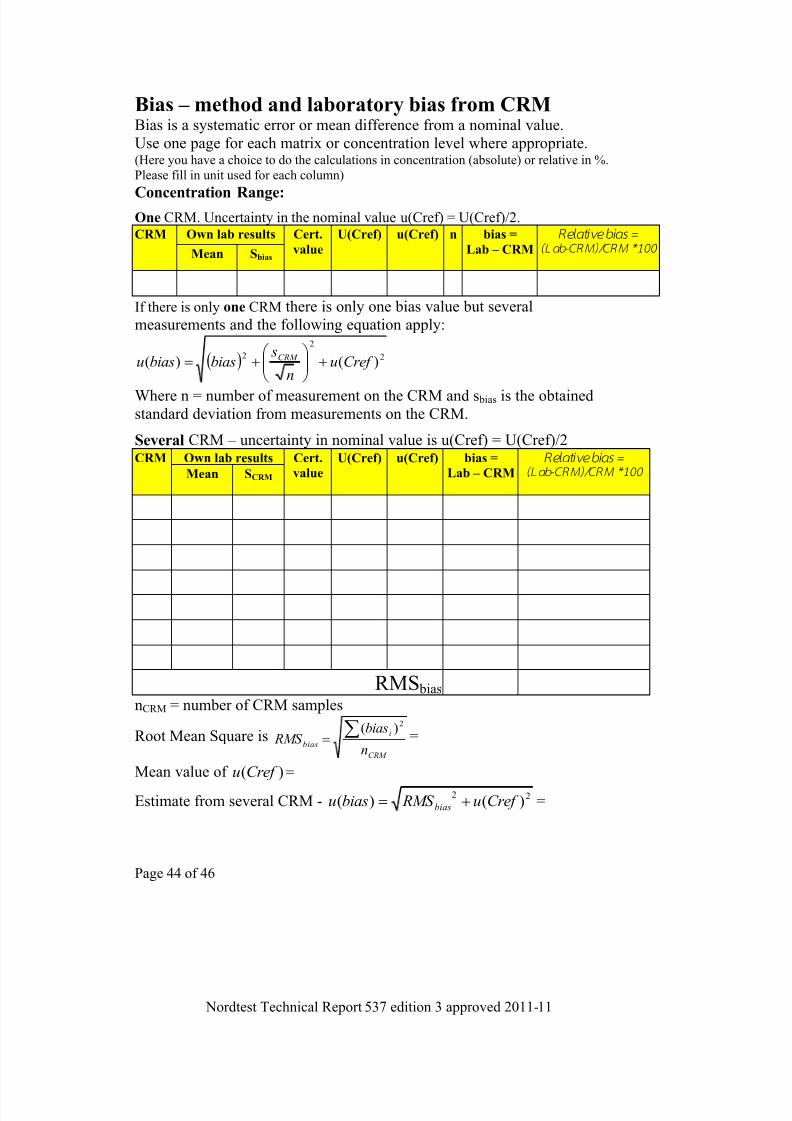
7/26/2019 NORDTEST TR 537 (2011-11) MN
http://slidepdf.com/reader/full/nordtest-tr-537-2011-11-mn 52/54
Nordtest Technical Report 537 edition 3 approved 2011-11
Page 44 of 46
Bias – method and laboratory bias from CRMBias is a systematic error or mean difference from a nominal value.
Use one page for each matrix or concentration level where appropriate.(Here you have a choice to do the calculations in concentration (absolute) or relative in %.
Please fill in unit used for each column)
Concentration Range:One CRM. Uncertainty in the nominal value u(Cref) = U(Cref)/2.CRM Own lab results Cert.
value
U(Cref) u(Cref) n bias =
Lab – CRM
Relative bias =
(Lab-CRM)/CRM * 100 Mean Sbias
If there is only one CRM there is only one bias value but several
measurements and the following equation apply:
2
2
2)()( Cref u
n
sbiasbiasu CRM
Where n = number of measurement on the CRM and s bias is the obtainedstandard deviation from measurements on the CRM.
Several CRM – uncertainty in nominal value is u(Cref) = U(Cref)/2
CRM Own lab results Cert.
value
U(Cref) u(Cref) bias =
Lab – CRM
Relative bias =
(Lab-CRM)/CRM * 100 Mean SCRM
RMS bias nCRM = number of CRM samples
Root Mean Square isCRM
i
biasn
bias RMS
2)(=
Mean value of )(Cref u =
Estimate from several CRM - 22)()( Cref u RMS biasu bias =

7/26/2019 NORDTEST TR 537 (2011-11) MN
http://slidepdf.com/reader/full/nordtest-tr-537-2011-11-mn 53/54
Nordtest Technical Report 537 edition 3 approved 2011-11
Page 45 of 46
Bias – method and laboratory bias from PTBias is a systematic error or mean difference from a nominal value.
Use one page for each matrix or concentration level where appropriate.(Here you have a choice to do the calculations in concentration (absolute) or relative in %.
Please fill in unit used for each column)
Concentration range:
Proficiency Testing (PT)Data from last 10 PT – minimum six! Appendix 4 in Nordtest handbook. Year Sample
¤
Own lab
value
PT value bias =Lab – PT
Relat ive bias =
(Lab-PT)/PT *100
n Lab s R
RMS bias Mean Number of PT, nPT =
Root Mean Square, PT
i
bias n
bias
RMS
2)(=
Uncertainty in nominal PT mean5 value u(Cref) =
Lab
R
n
s =…..
where nLab= mean value of participating laboratories and s R is the mean (or
pooled) standard deviation of the different PT rounds
Calculation of u(bias)See chapter 5 in Nordtest handbook.
From PT 22)()( Cref u RMS biasu bias =
5 If a median PT value is used in each round u(Cref) =
Lab
R
n
s23,1 according to ISO
13528
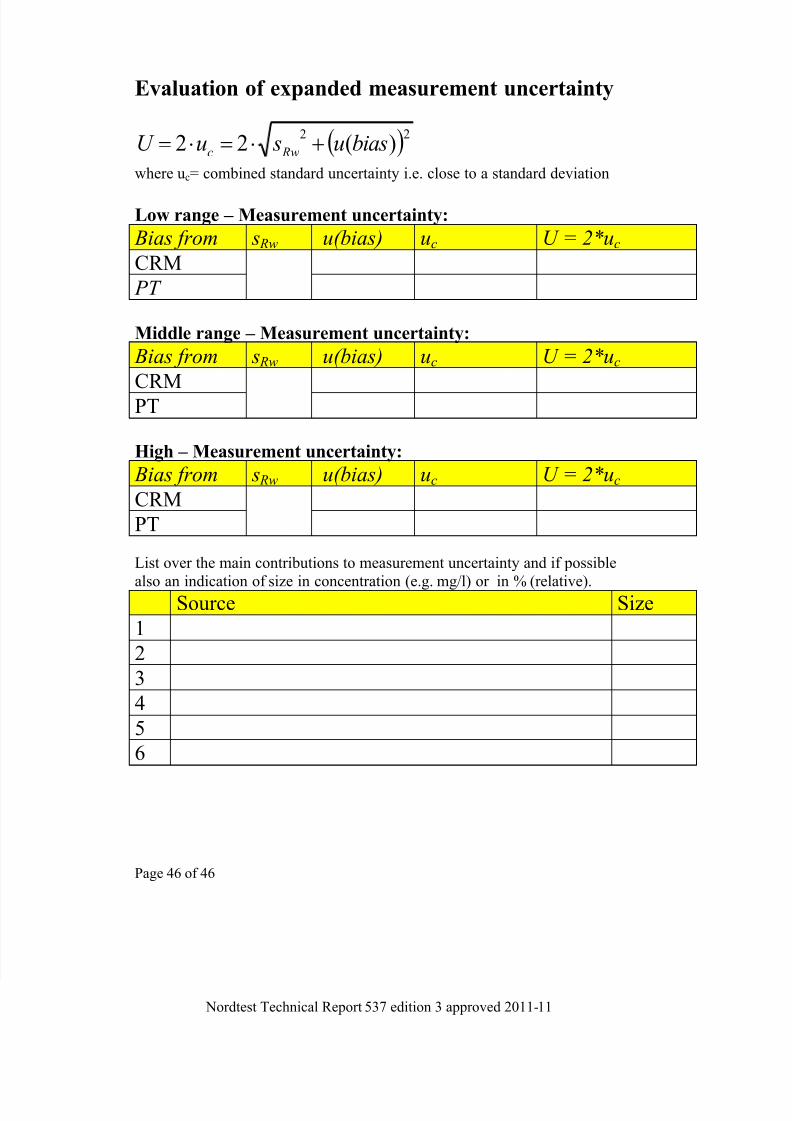
7/26/2019 NORDTEST TR 537 (2011-11) MN
http://slidepdf.com/reader/full/nordtest-tr-537-2011-11-mn 54/54
Page 46 of 46
Evaluation of expanded measurement uncertainty
22)(22 biasu suU Rwc
where uc= combined standard uncertainty i.e. close to a standard deviation
Low range – Measurement uncertainty:
Bias from s Rw u(bias) uc U = 2*uc
CRM
PT
Middle range – Measurement uncertainty:
Bias from s Rw u(bias) uc U = 2*uc
CRM
PT
High – Measurement uncertainty:
Bias from s Rw u(bias) uc U = 2*uc
CRM
PT
List over the main contributions to measurement uncertainty and if possible
also an indication of size in concentration (e.g. mg/l) or in % (relative).Source Size
1
2
3
4
5
6