normal coral growth rates on dying reefs
TRANSCRIPT

Normal Coral Growth Rates on DyingReefs: Are Coral Growth Rates GoodIndicators of Reef Health?EVAN N. EDINGER à*, GINO V. LIMMON 1,à , JAMALUDDIN JOMPA 2, §àà, WISNU WIDJATMOKO§§,JEFFREY M. HEIKOOPà± and MICHAEL J. RISKৠDepartment of Earth Sciences, Laurentian University, Ramsey Lake Road, Sudbury, Ont., Canada P3E 2C6àSchool of Geography and Geology, McMaster University, Hamilton, Ont., Canada L8S 4M1§Biology Department, McMaster University, Hamilton, Ont., Canada L8S 4K1 Faculty of Fisheries and Marine Science, Pattimura University, Ambon, IndonesiaààFaculty of Fisheries and Marine Science, Hasanuddin University, Ujung Pandang, Indonesia§§Faculty of Fisheries and Marine Science, Diponegoro University, Semarang, Indonesia±Earth and Environmental Sciences Division, Geology and Geochemistry Group (EES-1), MS D462, Los AlamosNational Laboratory, Los Alamos, NM 87545, USA
Massive coral growth rates may be poor indicators ofcoral reef health where coral reefs are subject to combinedeutrophication and sedimentation. Massive coral growth(vertical extension) rates on polluted reefs were not dif-ferent from extension rates on unpolluted reefs, while livecoral cover was low and bioerosion intensity high, leadingto net reef erosion and death of the polluted reefs. Thesecombined patterns of coral growth rates, coral cover andbioerosion were documented on reefs a�ected by land-based pollution in the Java Sea, South Sulawesi andAmbon, Indonesia. Acid-insoluble content in coral skele-tons re¯ected land-based pollution stress on reefs morereliably than did coral extension rates. Coral skeletaldensity was lower on polluted Java Sea reefs than onunpolluted reefs used as reference sites, but coral calci®-cation rates were not signi®cantly di�erent. The mosteutrophied Java Sea reefs had net carbonate loss, indi-cating net reef erosion, while a fringing reef adjacent tomangroves and two unpolluted coral cays both had posi-tive net carbonate production. Coral growth and reefgrowth were decoupled, in that coral growth rates did notreliably predict rates of reef accretion. The apparentlyparadoxical combination of normal to rapid coral growthand net reef erosion on polluted reefs illustrates the needfor a whole-reef perspective on coral reef health. Ó 2000Elsevier Science Ltd. All rights reserved.
Keywords: coral growth rates; eutrophication; sedimenta-tion; coral reef health; bioindicators; Indonesia.
Introduction
Coral growth rates, measured as vertical extension, arefrequently used as reef health indicators in environ-mental assessments of coral reefs (e.g., Cortes and Risk,1985; Eakin et al., 1993; Guzman et al., 1994), on theexpectation that physiological stress associated with reefdegradation should lead to decreased extension rates(e.g., Dodge et al., 1974; Cortes and Risk, 1985; Eakinet al., 1993). Several recent studies, however, have shownincreased extension rates adjacent to sewage outfalls(reviewed in Lough and Barnes, 1997) and stable iso-topic evidence has shown that corals can consume ter-rigenous organic matter (Risk et al., 1994; Mendes et al.,1997) or sewage-derived inorganic nitrogen (Muscatineand Kaplan, 1994; Eustice et al., 1995; Yamamuro et al.,1995; Heikoop et al, in press). These data, plus decreasesin extension rates with distance from land on the GreatBarrier Reef (Lough and Barnes, 1992, 1997) and inThailand (Sco�n et al., 1992) suggest that individualcorals may enhance their tissue and skeletal growth (i.e.,vertical extension) in response to moderate nutrientaddition. Corals subject to extremely high sedimentationtypically show a decline in extension rates (e.g., Dodgeet al., 1974; Hudson, 1981; Cortes and Risk 1985;Sco�n, 1986), mostly attributable to reduced lightpenetration (Rogers, 1990; Te, 1997). Thus corals onreefs subject to combined anthropogenic eutrophicationand sedimentation from such sources as sewage, agri-cultural/aquacultural runo� or riverine discharge may
Marine Pollution Bulletin Vol. 40, No. 5, pp. 404±425, 2000
Ó 2000 Elsevier Science Ltd. All rights reserved
Printed in Great Britain
0025-326X/00 $ - see front matterPII: S0025-326X(99)00237-4
* Corresponding author. Tel.: +1-905-525-9140; fax: +1-905-522-3141.
E-mail address: [email protected] Current address: Department of Cell and Molecular Biology, Hans
Knoell Institute for Natural Product Research, Beutenbergstrasse 11,D-07745 Jena, Germany.2 Current address: Department of Marine Biology, James Cook
University, Townsville, Qld 4812, Australia.
404

have normal extension rates, while other reef healthparameters such as live coral cover, coral mortality in-dices and bioerosion intensity suggest serious degrada-tion. Here, we describe this apparently contradictorypattern on modern reefs subject to land-based pollution,speci®cally, combined eutrophication and excessivesedimentation (Edinger et al., 1998).
The increased ¯ux of terrestrial nutrients and organicmatter associated with sewage (Pastorak and Bilyard,1985), agricultural runo� (Nixon, 1995) or aquaculturedevelopment (Briggs and Funge-Smith, 1994), is par-ticularly common in the coastal environments of south-east Asia (McManus, 1988). In this and other regions,coastal marine eutrophication is a serious pollutionproblem (Rosenberg, 1985; Bell, 1992; Nixon, 1995;Vitousek et al., 1997). The metabolic basis for rapidcoral growth under high nutrient conditions is uncer-tain. Individual corals on eutrophic reefs may growheterotrophically by feeding on dissolved and particu-late organic matter (Lewis, 1977; Tomascik and Sander,1985; Risk et al., 1994). Alternatively, these corals mayhave higher zooxanthellae and chloroplast densities andgrow autotrophically using enhanced zooxanthellarphotosynthesis fertilized by increased dissolved inor-ganic nutrients (Dubinsky and Jokiel, 1994; Steven andBroadbent, 1997).
Nutrients and sedimentation frequently covary as aconsequence of anthropogenic land-based pollution,particularly from complex sources such as sewage out-falls or aquacultural runo� (Chua et al., 1989; Philipset al., 1993). Where anthropogenic eutrophication andenhanced sedimentation occur together, nutrient load-ing may boost coral metabolism (Steven and Boadbent,1997) and skeletogenesis (Atkinson et al., 1995), com-pensating for reduced light penetration from high sedi-mentation, and yielding no net change in coral growth(extension) rates. Highly productive waters also favourgrowth of ¯eshy algae (Lapointe, 1997) and non-calci-®ed invertebrates (Birkeland, 1977, 1987; see also Lar-kum and Koop, 1997), and enhance the growth ofbioeroding organisms (Risk and MacGeachy, 1978;Rose and Risk, 1985; Hallock, 1988). These factorscombine to limit reef growth in nutrient-rich waters(Hallock and Schlager, 1986; Glynn, 1997).
From the above discussion, we see that coral reefsgrowing in nearshore eutrophied environments have thefollowing characteristics:
1. Individual coral extension rates are not signi®cant-ly lower than those on o�shore clearwater reefs inthe same region.
2. Total coral cover and coral species diversity onnearshore reefs are lower than on o�shore reefs,while cover of ¯eshy algae and invertebrates arehigher than on o�shore reefs.
3. Bioerosion intensity is higher on nearshore reefsthan on o�shore reefs. The combination of low livecoral cover, high algal and non-calci®ed inverte-
brate cover, and high bioerosion pushes carbonatebudgets toward negative net carbonate production(Sco�n et al., 1980), hence net reef erosion (Glynn,1997).
Here we report vertical extension rates of Porites lo-bata on dying coral reefs in nearshore eutrophic reefenvironments from three regions of Indonesia, andcompare them with extension rates obtained from coralsgrowing on relatively unpolluted reefs in each region.We then compare live coral cover, cover of algae andnon-calci®ed invertebrates, and bioerosion on pollutedand relatively unpolluted reefs in the same regions. Wecompare coral skeletal density and coral calci®cationrates among ®ve Java Sea reefs along a nutrient andsediment gradient. Finally, we calculate net carbonateproduction for those Java Sea reefs as a simple ap-proximation of carbonate budgets. Our results suggestthat the most polluted nearshore reefs are undergoingnet reef erosion and will eventually die completely unlessland-based pollution onto them ceases.
Methods
Study areas and environmental dataThirteen reefs were sampled from three regions of
Indonesia: the Java Sea, Ambon and South Sulawesi(Fig. 1; Table 1). More complete descriptions of eachsite are presented in Jompa (1996), Limmon (1996), andEdinger (1998). Environmental variables measured ateach reef included: water clarity (Secchi disk extinctiondepth) and maximum depth of coral growth (Table 1);sea surface temperature, salinity, chlorophyll A con-centration, nitrate and phosphate concentration, sus-pended particulate matter concentration (SPM), totaldownward sediment ¯ux into sediment traps (Table 2);and light intensity (Table 2). Ambon and Sulawesi en-vironmental data were measured biweekly from May1995±Aug. 1995; Java Sea environmental data weremeasured biweekly (mainland) or monthly (Karimunj-awa islands) in Nov. 1994±Jan. 1995, July±Dec. 1995and Aug.±Dec. 1996. Java Sea chlorophyll data are re-ported as averages of seasonal averages from wet season1994 (Nov. Õ94±Jan. Õ95), wet (Nov.±Dec.) and dry (Ju-ly±Oct) seasons 1995 and wet (Nov.±Dec.) and dry(July±Oct) seasons 1996. Full environmental data forSulawesi, Ambon and Java Sea sites are reported inJompa (1996), Limmon (1996) and Edinger, (1998).Ambon chlorophyll sampling was repeated in May±July1997.
Chlorophyll sampling and analysis followed Parsonset al. (1984) and Burnison (1980). Ambon and Sulawesisamples were analysed at UNHAS and UNPATTI, re-spectively, while Java Sea samples were analysed at theEnvironment Canada labs in Burlington, Ontario. Sus-pended particulate matter (SPM) was measured by ®l-tering 1 l of seawater onto a pre-weighed glass ®bre®lter, which was subsequently oven-dried and
405
Volume 40/Number 5/May 2000

re-weighed, following Cortes and Risk (1985). Totaldownward sediment ¯ux (net sediment deposition +sediment resuspension) was measured using sedimenttraps consisting of 30 cm long, 5 cm diameter PVCtubes, the most readily available diameter in Indonesia,and following Gardner (1980) and Cortes and Risk(1985). On Java Sea reefs, sediment traps were deployedon the reef surface at 3 m depth and changed biweeklyon nearshore reefs and monthly or bimonthly in Kari-
munjawa. Sediment traps at the Ambon and SulawesiReefs were deployed 25 cm above the reef surface at 3 mdepth and were changed weekly.
Downward irradiant light levels on Java Sea Reefswere measured using an Onset HoboTM light loggerdeployed in a waterproof case. Light measurements wererepeated on at least two days for each reef (Table 2). Thelight logger was placed on the reef for approximately 5min. each at four depths: 10 m, 5 m, 3 m, 1 m, and at the
Fig. 1 Map of Indonesia showing study regions and sties. (a) All In-donesia, showing regions studied. (b) Jepara: nearshore pol-luted Java Sea Reefs. (c) Karimunjawa islands: o�shorerelatively una�ected Java Sea Reefs. (d) South Sulawesi: a se-ries of coral cays across the Spermonde Archipelago. (e) Am-bon: a series of fringing reefs on the north coast of the island, inAmbon Bay and on the south coast.
TABLE 1
Study site regions, names, morphologies and summaries of stresses.a
Region Reef name Reef morphology Maximum depth (m) Water clarity (m) Source of stresses
Ambon Tanjung Setan Fringing reef/wall 40 > 20 Una�ected sites (10 m, 3 m)Hila Fringing, rubble bottom 20 20 Bombing, construction
Wayame Fringing reef 15 10 Harbour, sewage, sediment, oil terminalWailiha Fringing reef 6 < 5 Harbour, sediment, plywood factory
So. Sulawesi Kapoposan Coral Cay/wall 50 > 20 Una�ected (10 m), bombed (3 m)Barang Lompo Coral Cay Island 25 17 Bombing, local sewage pollution
Samalona Coral Cay Island 25 18 Anchor damage, minor pollution from cityKayangan Coral Cay Island 11 < 6 Harbour, industry, sewage, sediment
Karimunjawa Pulau Kecil Coral Cay Island 25 20 Una�ected(Central Java) Gosong Cemara Coral Cay, submerged 25 20 Una�ected
Lagun Marican Mangrove fringe 4 < 3 High turbidity (not anthropogenic)Jepara Pulau Panjang Coral Cay Island 8 < 3 Sewage, sediment, aquaculture(Central Java) Bondo Fringing reef 5 < 2 Sedimentation, agricultural runo�
aMaximum depth: maximum depth of coral growth. Water Clarity was measured as average Secchi disk extinction depth. Source of stressessummarizes impacts on each reef. More detailed descriptions of each reef can be found in Limmon (1996), Jompa (1996) and Edinger (1998).
406
Marine Pollution Bulletin
surface, and light extinction coe�cients (k) were calcu-lated, where (k) is the slope of the linear regression lineof log10 light intensity vs depth, following Bosscher(1992). On nearshore reefs where coral growth did notexceed 8 m depth, 10 m light measurements were omit-ted. Light extinction coe�cient was well predicted bysecchi disk extinction depth �r2 � 0:73; n � 5�, such thatkÕ could be estimated for the Ambon and Sulawesi sitesas 1.7/Ds, where Ds represents secchi disk extinctiondepth.
Coral growth rate (linear extension) measurementsAt least ®ve domal massive P. lobata heads were
collected at each reef. Corals were collected from adepth of 1 m below mean low water, such that coralgrowth would not be limited by low tide e�ects. Coralswere collected from the leeward sides of all coral cays(except Kayangan Reef, where they were absent: seebelow), and from the windward sides of fringing reefs.All corals were slabbed parallel to the maximumgrowth axis using an electric hand-held masonry saw.Axial slabs were cut to approximately 5 mm thicknessusing a diamond-blade rock saw. Annual density bandswere marked and annual linear extension rates weremeasured to a precision of 0.1 mm from X-ray imagesof the thin slabs, following Buddemeier et al. (1974). A
total of 73 corals were measured for this study. Skeletaldensity banding patterns revealed in X-rays were alsocompared with ¯uorescent banding (cf. Sco�n et al.,1989) and in selected corals, with d18O cyclicity, tocheck for subannual bands (cf. Barnes and Lough,1993). Stable isotopic and X-radiographic evidence in-dicated that most o�shore Karimunjawa corals hadstrong subannual banding (Sherwood, 1999), whilemost corals from nearshore Java Sea and eastern In-donesian sites did not show evidence of subannualbanding.
Line intercept transectsJava Sea coral cays were sampled on both windward
and leeward sides, while most Sulawesi coral cays wereall sampled on leeward sides only: leeward sites repre-sent the most diverse portions of reefs in the SpermondeArchipelago (Moll, 1983). Kayangan reef, the mostpolluted reef studied in Sulawesi, was sampled on thewindward side, because the leeward side, facing UjungPandang city, is entirely dead. Fringing reefs weresampled on their windward edges. At each reef, wemeasured 12 replicate 20 m line intercept transects, six at3 m depth, and six at 10 m depth. On three reefs wherecoral depth did not extend beyond 5 m (Wailiha, L.Marican, Bondo; see Table 1), we measured transects at
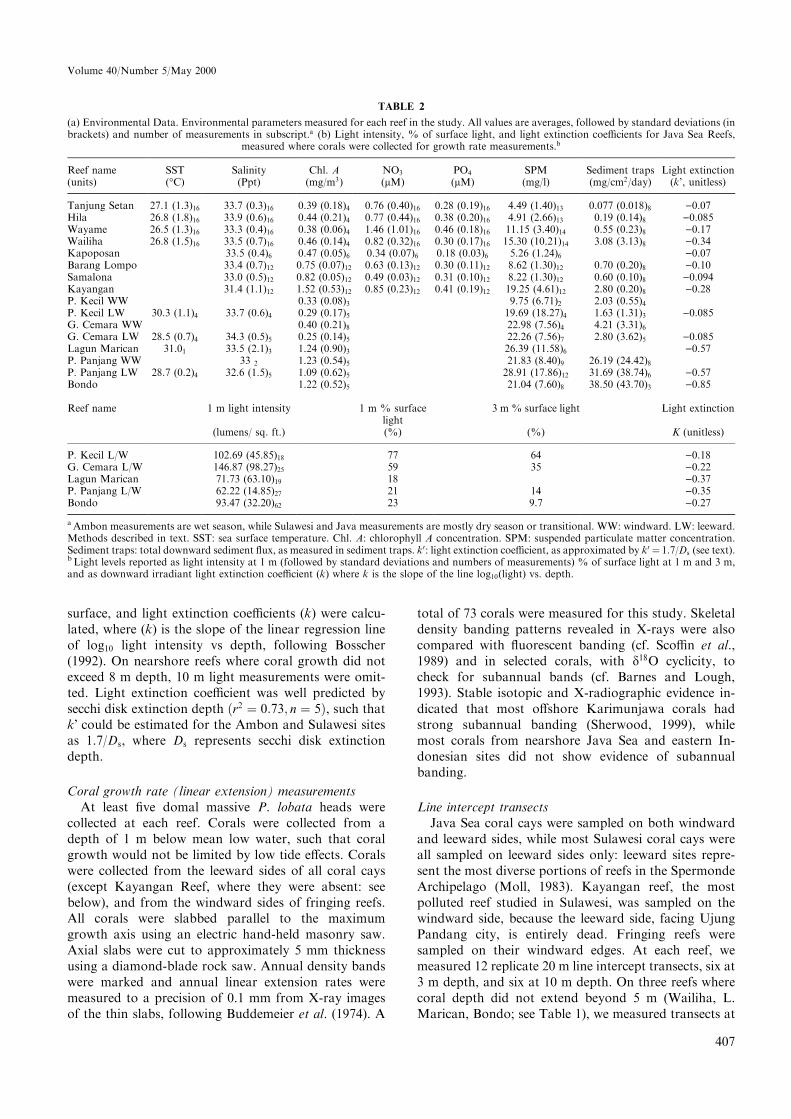
TABLE 2
(a) Environmental Data. Environmental parameters measured for each reef in the study. All values are averages, followed by standard deviations (inbrackets) and number of measurements in subscript.a (b) Light intensity, % of surface light, and light extinction coe�cients for Java Sea Reefs,
measured where corals were collected for growth rate measurements.b
Reef name SST Salinity Chl. A NO3 PO4 SPM Sediment traps Light extinction(units) (°C) (Ppt) (mg/m3) (lM) (lM) (mg/l) (mg/cm2/day) (k', unitless)
Tanjung Setan 27.1 (1.3)16 33.7 (0.3)16 0.39 (0.18)4 0.76 (0.40)16 0.28 (0.19)16 4.49 (1.40)13 0.077 (0.018)8 )0.07Hila 26.8 (1.8)16 33.9 (0.6)16 0.44 (0.21)4 0.77 (0.44)16 0.38 (0.20)16 4.91 (2.66)13 0.19 (0.14)8 )0.085Wayame 26.5 (1.3)16 33.3 (0.4)16 0.38 (0.06)4 1.46 (1.01)16 0.46 (0.18)16 11.15 (3.40)14 0.55 (0.23)8 )0.17Wailiha 26.8 (1.5)16 33.5 (0.7)16 0.46 (0.14)4 0.82 (0.32)16 0.30 (0.17)16 15.30 (10.21)14 3.08 (3.13)8 )0.34Kapoposan 33.5 (0.4)6 0.47 (0.05)6 0.34 (0.07)6 0.18 (0.03)6 5.26 (1.24)6 )0.07Barang Lompo 33.4 (0.7)12 0.75 (0.07)12 0.63 (0.13)12 0.30 (0.11)12 8.62 (1.30)12 0.70 (0.20)8 )0.10Samalona 33.0 (0.5)12 0.82 (0.05)12 0.49 (0.03)12 0.31 (0.10)12 8.22 (1.30)12 0.60 (0.10)8 )0.094Kayangan 31.4 (1.1)12 1.52 (0.53)12 0.85 (0.23)12 0.41 (0.19)12 19.25 (4.61)12 2.80 (0.20)8 )0.28P. Kecil WW 0.33 (0.08)3 9.75 (6.71)2 2.03 (0.55)4
P. Kecil LW 30.3 (1.1)4 33.7 (0.6)4 0.29 (0.17)5 19.69 (18.27)4 1.63 (1.31)3 )0.085G. Cemara WW 0.40 (0.21)8 22.98 (7.56)4 4.21 (3.31)6
G. Cemara LW 28.5 (0.7)4 34.3 (0.5)5 0.25 (0.14)5 22.26 (7.56)7 2.80 (3.62)5 )0.085Lagun Marican 31.01 33.5 (2.1)3 1.24 (0.90)3 26.39 (11.58)6 )0.57P. Panjang WW 33 2 1.23 (0.54)5 21.83 (8.40)9 26.19 (24.42)8P. Panjang LW 28.7 (0.2)4 32.6 (1.5)5 1.09 (0.62)5 28.91 (17.86)12 31.69 (38.74)6 )0.57Bondo 1.22 (0.52)5 21.04 (7.60)8 38.50 (43.70)3 )0.85
Reef name 1 m light intensity 1 m % surfacelight
3 m % surface light Light extinction
(lumens/ sq. ft.) (%) (%) K (unitless)
P. Kecil L/W 102.69 (45.85)18 77 64 )0.18G. Cemara L/W 146.87 (98.27)25 59 35 )0.22Lagun Marican 71.73 (63.10)19 18 )0.37P. Panjang L/W 62.22 (14.85)27 21 14 )0.35Bondo 93.47 (32.20)62 23 9.7 )0.27
aAmbon measurements are wet season, while Sulawesi and Java measurements are mostly dry season or transitional. WW: windward. LW: leeward.Methods described in text. SST: sea surface temperature. Chl. A: chlorophyll A concentration. SPM: suspended particulate matter concentration.Sediment traps: total downward sediment ¯ux, as measured in sediment traps. k0: light extinction coe�cient, as approximated by k0 � 1.7/Ds (see text).b Light levels reported as light intensity at 1 m (followed by standard deviations and numbers of measurements) % of surface light at 1 m and 3 m,and as downward irradiant light extinction coe�cient (k) where k is the slope of the line log10(light) vs. depth.
407
Volume 40/Number 5/May 2000

3 m only, and at Pulau Panjang, Jepara, we measuredtransects at 3 m and 6 m. Although coral mining occurson some reefs in the regions we studied, it is virtuallyalways limited to reef ¯ats, and is not re¯ected in ourtransect data. Life form categories (English et al., 1994)were summed to yield percent cover values for Acropora,other live corals, standing dead coral, algae, other faunaand abiotic substrates (e.g., sand and rubble, includingcoral rubble). Other fauna included sessile invertebratessuch as sponges, gorgonians, alcyonarian soft corals,zooanthids and ascidians. Coral mortality index (Gomezet al., 1994) was computed as MI� dead coral cover/(live coral cover+dead coral cover), with values rang-ing from 0 (all corals live) to 1 (all corals dead).
Coral bioerosionBioerosion of massive P. lobata heads was measured
from X-rays of parallel but non-adjacent 1 cm thickslabs through the same coral heads collected for growthrate measurements at the ®ve Java Sea sites and the fourAmbon sites (method follows Sammarco and Risk,1990). Cross-sectional area of each slab and the boringsin it were measured using a hand-held planimeter(method follows Edinger and Risk, 1997). Bioerosionintensity was reported as percentage of cross-sectionalarea removed by boring organisms.
Acid-insoluble residuesContent of acid-insoluble residues was measured in
P. lobata from three of the ®ve Java Sea sites (PulauPanjang, sewage polluted; Lagun Marican, mangrovefringing reef; Pulau Kecil, unpolluted Java Sea referencereef) and from all the Ambon sites, following Cortes andRisk (1985). Acid-insoluble residues were measured inupper portions of the same corals used for coral exten-sion rate measurements; these portions were selected tobe free of macroborings or pockets of sediment. Blocksof coral skeleton of roughly 2 cm3 were cut using a di-amond-bladed rock saw, rinsed in distilled water, dried,weighed, then dissolved in 10% HCl. Remaining un-dissolved material was collected in ®lter paper, rinsed,dried and weighed. Results are reported as weight per-cent acid-insoluble content and are presented as aver-ages for each coral.
Skeletal density measurements and calci®cation ratesVariations in skeletal density were measured in corals
from ®ve reefs in the Java Sea along an onshore-o�shorenutrient and sedimentation gradient. Methods followedRisk and Sammarco (1991). From each reef, three to ®vecorals were selected that had at least ®ve years of linearextension measurements. A total of 122 one-year incre-ments identi®ed from the X-ray images were cut fromslabs using a diamond-bladed rock saw. These blocks ofskeleton were oven-dried, weighed, then embedded inpara�n wax, and their volume measured as the mass ofdistilled water displaced from a specially designed pyc-
nometer. Density was calculated as mass per unit vol-ume. Calci®cation rates (g CaCO3/cm
2/yr) for eachcoral-year, were calculated as density (g/cm3) ´ linearextension rate (mm/yr). Data are presented as averagesfor each coral.
Net carbonate productionWe estimated net carbonate production of corals,
using these as a simple proxy for carbonate budgets forthe ®ve Java Sea reefs, according to Land (1979), wherenet carbonate production� gross coral carbonate pro-duction, minus carbonate destruction in corals frombioerosion (cf. Hubbard, 1997; Table 9). Gross car-bonate production (Pg, in units of kg CaCO3/m
2/year)by corals was estimated as
Pg � rc � Cl;
where rc represents mean calci®cation rate and Cl rep-resents percent live coral cover), assuming approxi-mately equal calci®cation rates for all coral species oneach reef (cf. Sco�n, 1997, Table 1). Carbonate de-struction (D, in units of kg CaCO3/m
2/year) was esti-mated as
D � ��B� T � q�=A� � �Cl � Cd�;where B represents mean cross-sectional area bioeroded,T represents thickness of P. lobata slabs (generally 1 cm),q represents average skeletal density, A represents av-erage age of corals sampled, Cl represents percent coverof live corals and Cd represents percent cover of deadcorals. Age of corals was calculated as the height of eachcoral slab divided by the average vertical extension rateof that coral. Reef averages of all values were used fornet carbonate production calculations. Estimates ofcarbonate destruction assumed approximately equalinternal bioerosion rates for live and standing deadcorals of all species. Our simplifying assumptions un-derestimate gross carbonate production on the unpol-luted reefs, where rapidly calcifying Acropora corals aremore abundant than on the polluted reefs (Edinger et al.,1998), and underestimate carbonate destruction on thepolluted reefs, because standing dead corals typicallyhave higher densities of macroborers than do live corals(McKenna, 1997). Rate of burial also controls bioero-sion, in that high sedimentation rates quickly bury deadcorals, isolating them from bioeroding organisms(Pandol® and Greenstein, 1997; Sco�n, 1997).
Data analysisTemporal variation in coral extension rates within
each site was assessed by measuring the average exten-sion rate in each calendar year for only the longest-livedcorals from each site. Corals from which a long growthchronology could not be measured were eliminated fromthis analysis, such that annual growth rates for each yearwere always averaged from the same subset of corals.The same individual corals were compared in each yearat a given site. At one site (Pulau Panjang, Jepara),
408
Marine Pollution Bulletin
average extension rates in each year were calculated fora second group of younger corals with short growthchronologies. Temporal trends in average extension ratewere tested for signi®cance using linear regression.
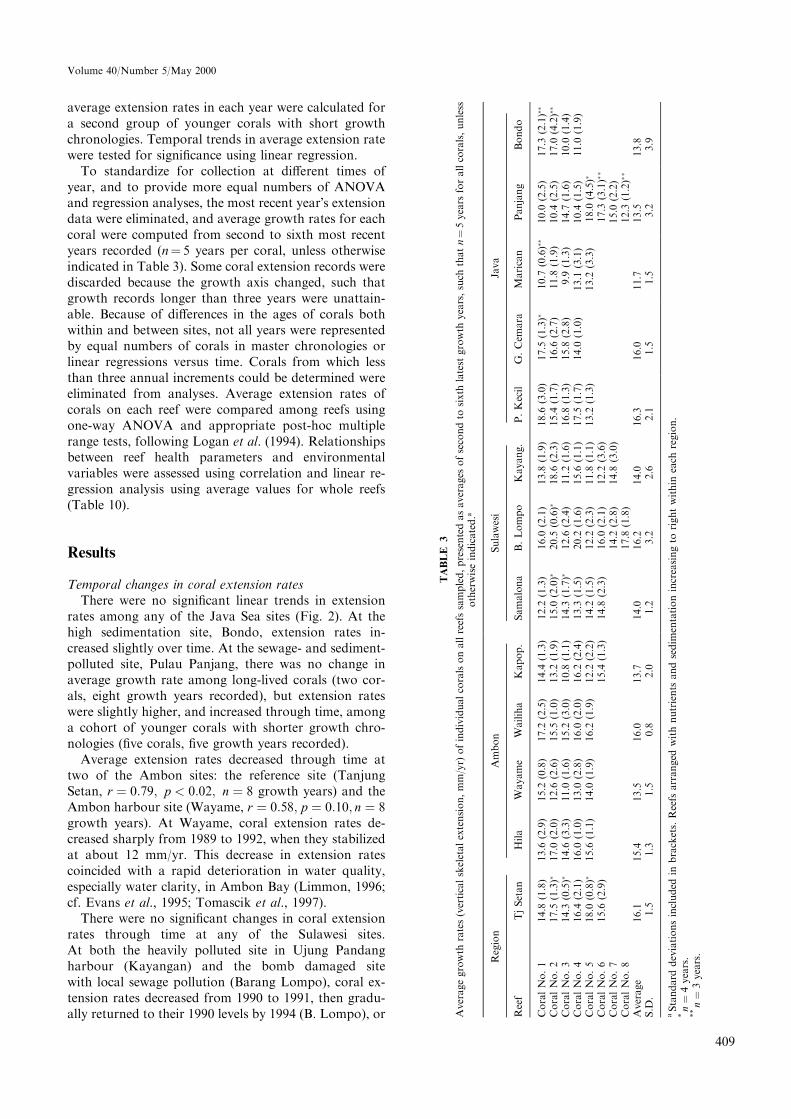
To standardize for collection at di�erent times ofyear, and to provide more equal numbers of ANOVAand regression analyses, the most recent yearÕs extensiondata were eliminated, and average growth rates for eachcoral were computed from second to sixth most recentyears recorded (n� 5 years per coral, unless otherwiseindicated in Table 3). Some coral extension records werediscarded because the growth axis changed, such thatgrowth records longer than three years were unattain-able. Because of di�erences in the ages of corals bothwithin and between sites, not all years were representedby equal numbers of corals in master chronologies orlinear regressions versus time. Corals from which lessthan three annual increments could be determined wereeliminated from analyses. Average extension rates ofcorals on each reef were compared among reefs usingone-way ANOVA and appropriate post-hoc multiplerange tests, following Logan et al. (1994). Relationshipsbetween reef health parameters and environmentalvariables were assessed using correlation and linear re-gression analysis using average values for whole reefs(Table 10).
Results
Temporal changes in coral extension ratesThere were no signi®cant linear trends in extension
rates among any of the Java Sea sites (Fig. 2). At thehigh sedimentation site, Bondo, extension rates in-creased slightly over time. At the sewage- and sediment-polluted site, Pulau Panjang, there was no change inaverage growth rate among long-lived corals (two cor-als, eight growth years recorded), but extension rateswere slightly higher, and increased through time, amonga cohort of younger corals with shorter growth chro-nologies (®ve corals, ®ve growth years recorded).
Average extension rates decreased through time attwo of the Ambon sites: the reference site (TanjungSetan, r � 0:79; p < 0:02; n � 8 growth years) and theAmbon harbour site (Wayame, r � 0:58; p � 0:10; n � 8growth years). At Wayame, coral extension rates de-creased sharply from 1989 to 1992, when they stabilizedat about 12 mm/yr. This decrease in extension ratescoincided with a rapid deterioration in water quality,especially water clarity, in Ambon Bay (Limmon, 1996;cf. Evans et al., 1995; Tomascik et al., 1997).
There were no signi®cant changes in coral extensionrates through time at any of the Sulawesi sites.At both the heavily polluted site in Ujung Pandangharbour (Kayangan) and the bomb damaged sitewith local sewage pollution (Barang Lompo), coral ex-tension rates decreased from 1990 to 1991, then gradu-ally returned to their 1990 levels by 1994 (B. Lompo), or
TABLE
3
Averagegrowth
rates(verticalskeletalextension,mm/yr)
ofindividualcoralsonallreefssampled,presentedasaverages
ofsecondto
sixth
latest
growth
years,such
thatn�5years
forallcorals,unless
otherwiseindicated.a
Region
Ambon
Sulawesi
Java
Reef
TjSetan
Hila
Wayame
Wailiha
Kapop.
Samalona
B.Lompo
Kayang.
P.Kecil
G.Cem
ara
Marican
Panjang
Bondo
CoralNo.1
14.8
(1.8)
13.6
(2.9)
15.2
(0.8)
17.2
(2.5)
14.4
(1.3)
12.2
(1.3)
16.0
(2.1)
13.8
(1.9)
18.6
(3.0)
17.5
(1.3)�
10.7
(0.6)��
10.0
(2.5)
17.3
(2.1)��
CoralNo.2
17.5
(1.3)�
17.0
(2.0)
12.6
(2.6)
15.5
(1.0)
13.2
(1.9)
15.0
(2.0)�
20.5
(0.6)�
18.6
(2.3)
15.4
(1.7)
16.6
(2.7)
11.8
(1.9)
10.4
(2.5)
17.0
(4.2)��
CoralNo.3
14.3
(0.5)�
14.6
(3.3)
11.0
(1.6)
15.2
(3.0)
10.8
(1.1)
14.3
(1.7)�
12.6
(2.4)
11.2
(1.6)
16.8
(1.3)
15.8
(2.8)
9.9
(1.3)
14.7
(1.6)
10.0
(1.4)
CoralNo.4
16.4
(2.1)
16.0
(1.0)
13.0
(2.8)
16.0
(2.0)
16.2
(2.4)
13.3
(1.5)
20.2
(1.6)
15.6
(1.1)
17.5
(1.7)
14.0
(1.0)
13.1
(3.1)
10.4
(1.5)
11.0
(1.9)
CoralNo.5
18.0
(0.8)�
15.6
(1.1)
14.0
(1.9)
16.2
(1.9)
12.2
(2.2)
14.2
(1.5)
12.2
(2.3)
11.8
(1.1)
13.2
(1.3)
13.2
(3.3)
18.0
(4.5)�
CoralNo.6
15.6
(2.9)
15.4
(1.3)
14.8
(2.3)
16.0
(2.1)
12.2
(3.6)
17.3
(3.1)��
CoralNo.7
14.2
(2.8)
14.8
(3.0)
15.0
(2.2)
CoralNo.8
17.8
(1.8)
12.3
(1.2)��
Average
16.1
15.4
13.5
16.0
13.7
14.0
16.2
14.0
16.3
16.0
11.7
13.5
13.8
S.D
.1.5
1.3
1.5
0.8
2.0
1.2
3.2
2.6
2.1
1.5
1.5
3.2
3.9
aStandard
deviationsincluded
inbrackets.Reefs
arranged
withnutrients
andsedim
entationincreasingto
rightwithin
each
region.
*n�
4years.
**
n�
3years.
409
Volume 40/Number 5/May 2000
1995 (Kayangan). Coral extension rates were approxi-mately constant at the other two Sulawesi sites.
Di�erences in coral extension rates among sites
Java Sea. Average P. lobata linear extension rates atthe two o�shore relatively unpolluted Java Sea reefs(Pulau Kecil, mean� 16.3 mm/yr; G. Cemara, mean�16.0; Table 4), were not signi®cantly di�erent from themost sewage-polluted site (Pulau Panjang, mean�13.5), or the high sedimentation site (Bondo, mean�13.8 mm/yr). P. lobata extension rates were signi®cantlyhigher on the two o�shore reefs than on the mangrovefringing reef (L. Marican, mean� 11.7; Table 4). Thevariance in coral extension rates on nearshore pollutedreefs was higher than on the o�shore reefs (Tables 4and 5), although the di�erences in variance were notstatistically signi®cant (F-tests).
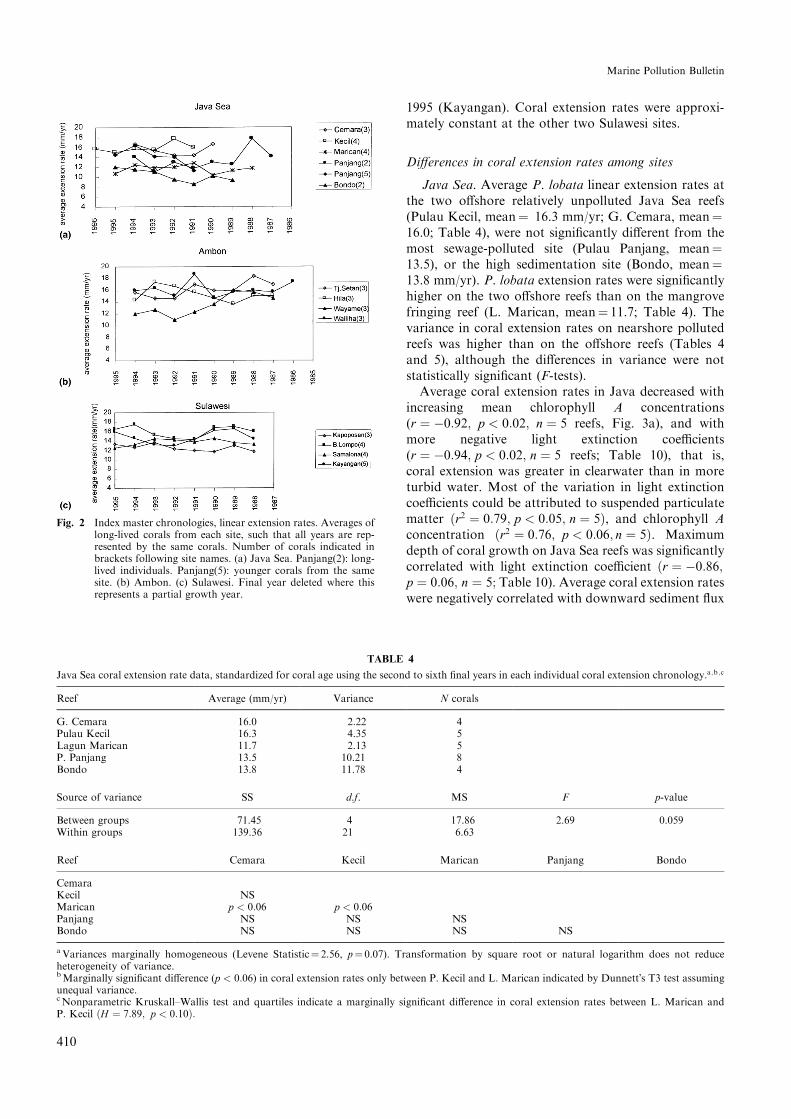
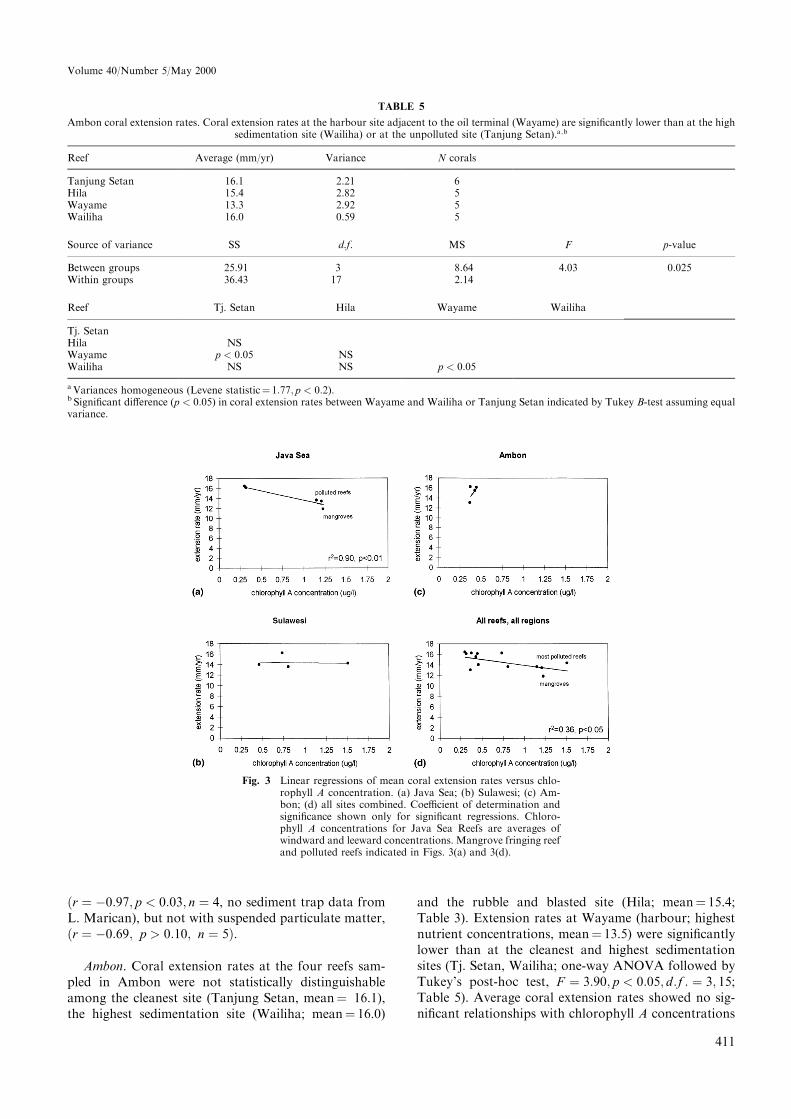
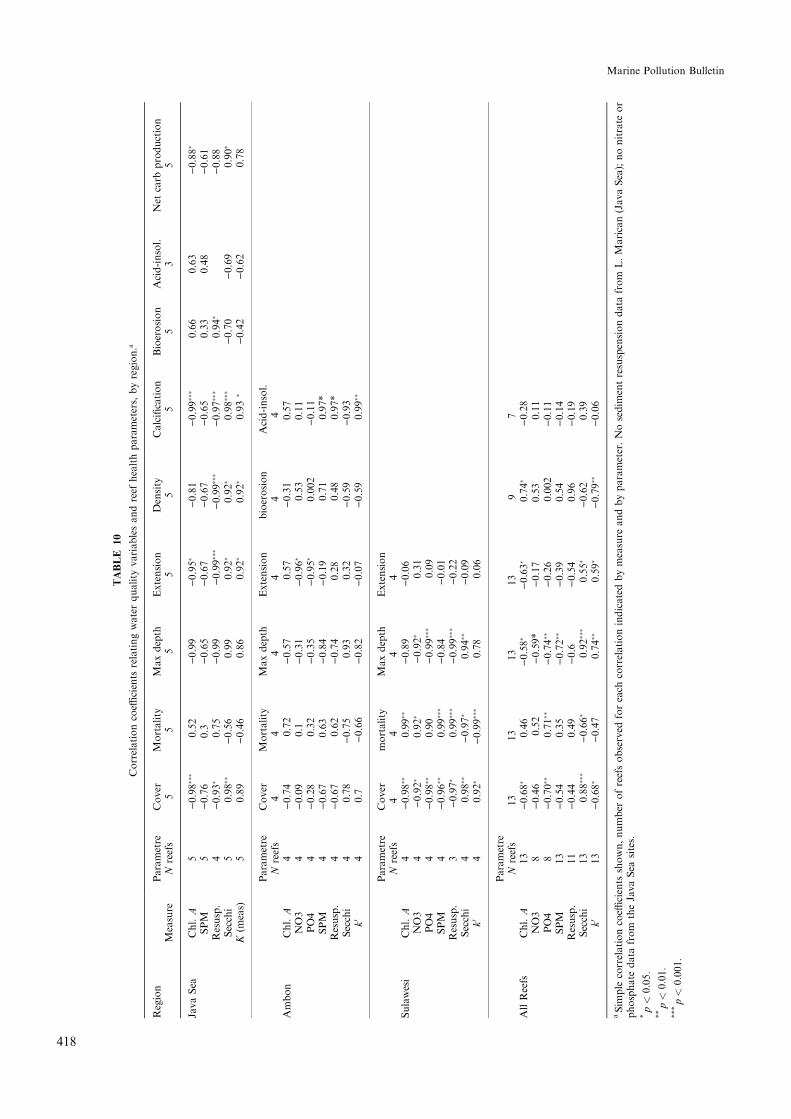
Average coral extension rates in Java decreased withincreasing mean chlorophyll A concentrations(r � ÿ0:92; p < 0:02; n � 5 reefs, Fig. 3a), and withmore negative light extinction coe�cients(r � ÿ0:94; p < 0:02; n � 5 reefs; Table 10), that is,coral extension was greater in clearwater than in moreturbid water. Most of the variation in light extinctioncoe�cients could be attributed to suspended particulatematter �r2 � 0:79; p < 0:05; n � 5�, and chlorophyll Aconcentration �r2 � 0:76; p < 0:06; n � 5�. Maximumdepth of coral growth on Java Sea reefs was signi®cantlycorrelated with light extinction coe�cient �r � ÿ0:86;p � 0:06; n � 5; Table 10). Average coral extension rateswere negatively correlated with downward sediment ¯ux
Fig. 2 Index master chronologies, linear extension rates. Averages oflong-lived corals from each site, such that all years are rep-resented by the same corals. Number of corals indicated inbrackets following site names. (a) Java Sea. Panjang(2): long-lived individuals. Panjang(5): younger corals from the samesite. (b) Ambon. (c) Sulawesi. Final year deleted where thisrepresents a partial growth year.
TABLE 4
Java Sea coral extension rate data, standardized for coral age using the second to sixth ®nal years in each individual coral extension chronology.a ;b ;c
Reef Average (mm/yr) Variance N corals
G. Cemara 16.0 2.22 4Pulau Kecil 16.3 4.35 5Lagun Marican 11.7 2.13 5P. Panjang 13.5 10.21 8Bondo 13.8 11.78 4
Source of variance SS d.f. MS F p-value
Between groups 71.45 4 17.86 2.69 0.059Within groups 139.36 21 6.63
Reef Cemara Kecil Marican Panjang Bondo
CemaraKecil NSMarican p < 0:06 p < 0:06Panjang NS NS NSBondo NS NS NS NS
aVariances marginally homogeneous (Levene Statistic� 2.56, p� 0.07). Transformation by square root or natural logarithm does not reduceheterogeneity of variance.bMarginally signi®cant di�erence (p < 0:06) in coral extension rates only between P. Kecil and L. Marican indicated by DunnettÕs T3 test assumingunequal variance.cNonparametric Kruskall±Wallis test and quartiles indicate a marginally signi®cant di�erence in coral extension rates between L. Marican andP. Kecil �H � 7:89; p < 0:10�:
410
Marine Pollution Bulletin
�r � ÿ0:97; p < 0:03; n � 4, no sediment trap data fromL. Marican), but not with suspended particulate matter,�r � ÿ0:69; p > 0:10; n � 5�.
Ambon. Coral extension rates at the four reefs sam-pled in Ambon were not statistically distinguishableamong the cleanest site (Tanjung Setan, mean� 16.1),the highest sedimentation site (Wailiha; mean� 16.0)
and the rubble and blasted site (Hila; mean� 15.4;Table 3). Extension rates at Wayame (harbour; highestnutrient concentrations, mean� 13.5) were signi®cantlylower than at the cleanest and highest sedimentationsites (Tj. Setan, Wailiha; one-way ANOVA followed byTukey's post-hoc test, F � 3:90; p < 0:05; d:f : � 3; 15;Table 5). Average coral extension rates showed no sig-ni®cant relationships with chlorophyll A concentrations
TABLE 5
Ambon coral extension rates. Coral extension rates at the harbour site adjacent to the oil terminal (Wayame) are signi®cantly lower than at the highsedimentation site (Wailiha) or at the unpolluted site (Tanjung Setan).a ;b
Reef Average (mm/yr) Variance N corals
Tanjung Setan 16.1 2.21 6Hila 15.4 2.82 5Wayame 13.3 2.92 5Wailiha 16.0 0.59 5
Source of variance SS d.f. MS F p-value
Between groups 25.91 3 8.64 4.03 0.025Within groups 36.43 17 2.14
Reef Tj. Setan Hila Wayame Wailiha
Tj. SetanHila NSWayame p < 0:05 NSWailiha NS NS p < 0:05
a Variances homogeneous (Levene statistic� 1:77; p < 0:2).b Signi®cant di�erence (p < 0:05) in coral extension rates between Wayame and Wailiha or Tanjung Setan indicated by Tukey B-test assuming equalvariance.
Fig. 3 Linear regressions of mean coral extension rates versus chlo-rophyll A concentration. (a) Java Sea; (b) Sulawesi; (c) Am-bon; (d) all sites combined. Coe�cient of determination andsigni®cance shown only for signi®cant regressions. Chloro-phyll A concentrations for Java Sea Reefs are averages ofwindward and leeward concentrations. Mangrove fringing reefand polluted reefs indicated in Figs. 3(a) and 3(d).
411
Volume 40/Number 5/May 2000
(Fig. 3b), SPM, or downward sediment ¯ux as measuredin sediment traps (Table 10). Coral extension rates werenegatively correlated with nitrate and phosphate con-centrations (NO3: r � ÿ0:98; p < 0:03; n � 4; PO4:r � ÿ0:94; p < 0:06; n � 4; Table 10).
Sulawesi. Although average coral extension rateswere slightly higher at the site subject to locally gener-ated sewage (Barang Lompo; mean � 16.1), than at theother sites (most polluted site, Kayangan, mean� 14.0;relatively unpolluted site, Samalona, mean� 13.95;cleanest site, Kapoposan, mean� 13.7; Table 3), coralextension rates were not statistically di�erent amongthese four sites. Mean coral extension rates showed nosigni®cant linear trends in relation to chlorophyllA concentration (Fig. 3c) or other environmentalvariables.
All sites combined. Coral extension rates on all siteswere within the average ranges for P. lobata on shallowwater Indo-Paci®c reefs (Lough and Barnes, 1997).Coral extenion rates on all reefs combined declined withincreasing chlorophyll A concentrations (Fig. 3d), al-though chlorophyll A concentrations accounted for lessthan half of the variation in extension rates�r2 � 0:36; p < 0:05; n � 13 reefs; Fig. 3d). Maximumdepth of coral growth was positively correlated withwater clarity �r � 0:88; p < 0:01�, and suspended par-ticulate matter (SPM, r � ÿ0:79; p < 0:02; Table 10).Water clarity was dominantly determined by SPM�r � ÿ0:75� and chlorophyll A concentration�r � ÿ0:72�.
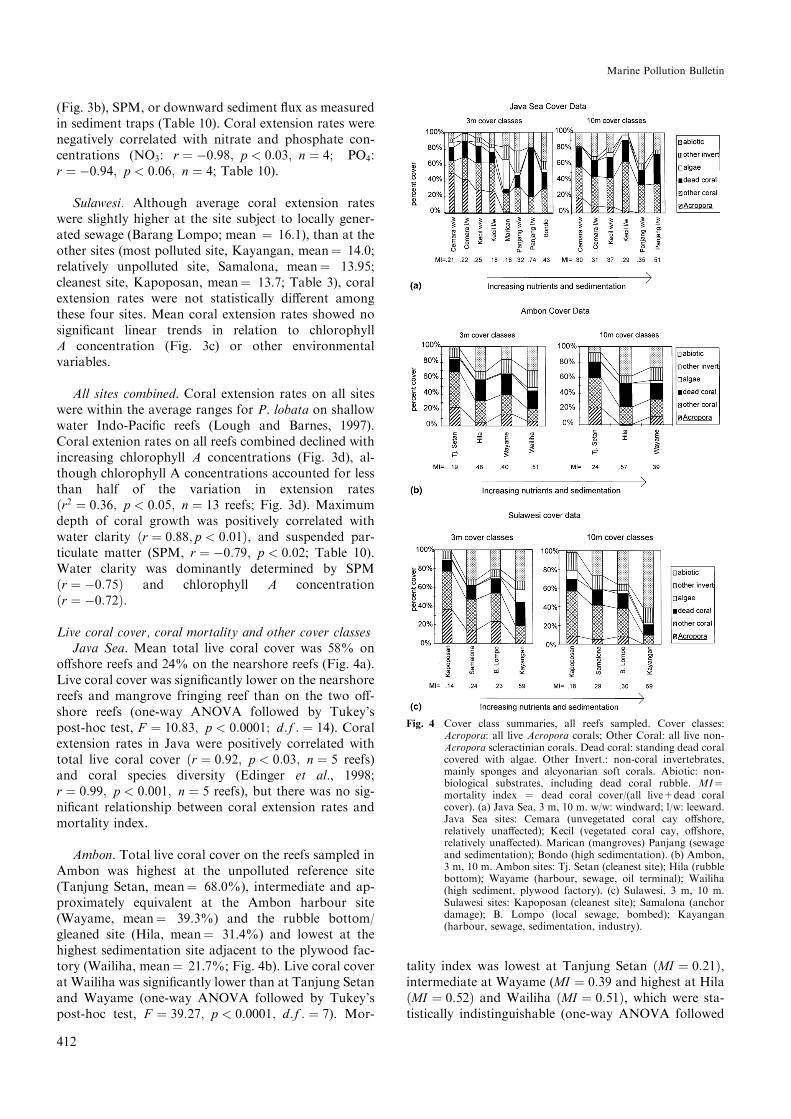
Live coral cover, coral mortality and other cover classesJava Sea. Mean total live coral cover was 58% on
o�shore reefs and 24% on the nearshore reefs (Fig. 4a).Live coral cover was signi®cantly lower on the nearshorereefs and mangrove fringing reef than on the two o�-shore reefs (one-way ANOVA followed by Tukey'spost-hoc test, F � 10:83; p < 0:0001; d:f : � 14). Coralextension rates in Java were positively correlated withtotal live coral cover �r � 0:92; p < 0:03; n � 5 reefs)and coral species diversity (Edinger et al., 1998;r � 0:99; p < 0:001; n � 5 reefs), but there was no sig-ni®cant relationship between coral extension rates andmortality index.
Ambon. Total live coral cover on the reefs sampled inAmbon was highest at the unpolluted reference site(Tanjung Setan, mean� 68.0%), intermediate and ap-proximately equivalent at the Ambon harbour site(Wayame, mean� 39.3%) and the rubble bottom/gleaned site (Hila, mean� 31.4%) and lowest at thehighest sedimentation site adjacent to the plywood fac-tory (Wailiha, mean� 21.7%; Fig. 4b). Live coral coverat Wailiha was signi®cantly lower than at Tanjung Setanand Wayame (one-way ANOVA followed by Tukey'spost-hoc test, F � 39:27; p < 0:0001; d:f : � 7). Mor-
tality index was lowest at Tanjung Setan �MI � 0:21�,intermediate at Wayame (MI � 0:39 and highest at Hila�MI � 0:52� and Wailiha �MI � 0:51�, which were sta-tistically indistinguishable (one-way ANOVA followed
Fig. 4 Cover class summaries, all reefs sampled. Cover classes:Acropora: all live Acropora corals; Other Coral: all live non-Acropora scleractinian corals. Dead coral: standing dead coralcovered with algae. Other Invert.: non-coral invertebrates,mainly sponges and alcyonarian soft corals. Abiotic: non-biological substrates, including dead coral rubble. MI�mortality index � dead coral cover/(all live+dead coralcover). (a) Java Sea, 3 m, 10 m. w/w: windward; l/w: leeward.Java Sea sites: Cemara (unvegetated coral cay o�shore,relatively una�ected); Kecil (vegetated coral cay, o�shore,relatively una�ected). Marican (mangroves) Panjang (sewageand sedimentation); Bondo (high sedimentation). (b) Ambon,3 m, 10 m. Ambon sites: Tj. Setan (cleanest site); Hila (rubblebottom); Wayame (harbour, sewage, oil terminal); Wailiha(high sediment, plywood factory). (c) Sulawesi, 3 m, 10 m.Sulawesi sites: Kapoposan (cleanest site); Samalona (anchordamage); B. Lompo (local sewage, bombed); Kayangan(harbour, sewage, sedimentation, industry).
412
Marine Pollution Bulletin

by Tukey's post-hoc test, F � 11:0; p < 0:0001;d:f : � 7). Wailiha and Wayame had signi®cantly greaterother invertebrate cover than Hila and Tanjung Setan(one-way ANOVA followed by Tukey's post-hoc test,F � 3:19; p < 0:05; d:f : � 7). Cover of algae and in-vertebrates combined was positively correlated withSPM (r � 0:97; p < 0:001; n � 7), but with neither ni-trate nor phosphate concentration.
Sulawesi. Total live coral cover was highest at thecleanest site (Kapoposan, 3 m mean� 74.4%), inter-mediate and approximately equivalent at Barang Lom-po (3 m mean� 54.2%) and Samalona (3 m mean�47.0 %) and lowest at Kayangan (harbour site, 3 mmean� 18.2, Fig. 5b; one-way ANOVA followed byTukey's HSD test, F � 47:27; p < 0:0001; d:f : � 8;Kayangan was distinct from all the other sites). Mor-tality index was lowest at Kapoposan �MI � 0:16�, in-termediate and approximately equivalent at BarangLompo �MI � 0:27� and Samalona �MI � 0:27� andhighest at Kayangan �MI � 0:59�. Mortality index wassigni®cantly higher at Kayangan than at the other threeSulawesi reefs (one-way ANOVA followed by Tukey'sHSD test, F � 6:87; p < 0:0001; d:f � 8). Mortality in-dex increased with all indicators of land-based pollution,including chlorophyll A, nitrate, phosphate, SPMand downward sediment ¯ux �r > 0:87 in all cases;p < 0:01; n � 7�. The average sum of ¯eshy algae plusother invertebrates cover at 3 m was 21.8% at Kayan-gan, signi®cantly higher than at any of the other threeSulawesi sites (Samalona: 5.9%; Barang Lompo, 8.4%;Kapoposan, 9.1%; one-way ANOVA followed byTukeyÕs post-hoc test, F � 11:81; p < 0:0002; d:f : � 4).Nitrate concentrations above suggested thresholds foralgal dominance on reefs (1 lM, Lapointe, 1997) werenot observed at any Sulawesi sites, but phosphate con-centrations were above threshold (0.1 lM, Lapointe,1997) at all sites.
All sites combined. Live coral cover cover was nega-tively correlated with chlorophyll A concentation amongall 13 sites studied (r � ÿ0:63; p < 0:02; n � 13;Fig. 5a) and positively correlated with water clarity
�r � 0:56; p < 0:06; n � 13�. Coral extension rates wereweakly positively correlated with total live coral coveron all reefs combined, (r � 0:46; p < 0:12; n � 13;Fig. 5b); when the mangrove fringing reef in Java wasdeleted from the analysis, this trend became muchweaker �r � 0:38; p > 0:22; n � 12�. There were nosigni®cant relationships between coral extension ratesand coral mortality index �r � 0:15; p > 0:6; n � 13� orcoral extension rates and within-site species diversity(r � 0:35; p > 0:2; n � 13; data from Edinger et al.,1998). Overall, coral extension rates were poor predic-tors of transect-based indicators of reef health.
Land-based pollution was the dominant source ofdegradation on the nearshore reefs we studied, speci®-cally, the combination of nutrient loading and excessivesedimentation. Average chlorophyll A and SPM con-centrations among all our study reefs were signi®cantlypositively correlated (r � 0:58; p < 0:05; n � 13 reefs).Chlorophyll A concentrations were above those foundat unpolluted reefs on the Great Barrier Reef (> 0:5 mg/m3, Bell, 1992) at all the polluted reefs in the Java Seareefs and Sulawesi reefs, but at neither of the pollutedAmbon reefs. Nitrate concentrations above suggestedthresholds for algal dominance on reefs (1 lM, Lapo-inte, 1997) were observed only at the Ambon harboursite (Wayame), but phosphate concentrations wereabove threshold (0.1 lM, Lapointe, 1997) at all Ambonand Sulawesi sites (Table 2). Algal cover was high at theSulawesi harbour site (Kayangan) and the high sedimentsite in Ambon (Wailiha), the mangrove fringing reef inJava (L. Marican), but not at the nearshore pollutedreefs in the Java Sea (P. Panjang, Bondo). In all casesexcept L. Marican and Kayangan, non-calci®ed inver-tebrate cover was higher than algal cover (Fig. 4).
Many of the Porites heads on eutrophied reefs hadmultilobate morphology, probably as a response to highsedimentation rates (Sco�n et al., 1992). The percentcover of submassive corals is roughly indicative of thefrequency of multilobate morphology on the reefs wesampled and re¯ects the degree of morphological changein response to high sedimentation and low light pene-tration. Submassive corals formed a signi®cantly higherproportion of the coral fauna on nearshore polluted
Fig. 5 Regressions. (a) Mean total live coral cover vs. chlorophyll Aconcentration, all reefs. (b) Mean total live coral cover versusmean coral extension rates, all reefs: extension rates are poorpredictors of coral cover.
413
Volume 40/Number 5/May 2000

reefs in the Java Sea and Sulawesi (24%) than ono�shore Java Sea Reefs (7.1%) or o�shore Sulawesireefs (10.8%; one-way ANOVA, F � 5:38; p < 0:02;d:f : � 28; Edinger, 1998). Submassive growth form mayhave contributed to linear extension values on nearshorecorals as a response to decreased light penetration ortoxic e�ects associated with sediments (cf. Dodge andBrass, 1984).
Acid-insoluble residues
Java Sea. Acid-insoluble residues were highest incorals from the sewage- and sedimentation-a�ected reef(Pulau Panjang, 0.029 wt%), intermediate in corals fromthe mangrove fringing reef (Lagun Marican, 0.011 wt%)and lowest in corals from one of the o�shore referencereefs (Pulau Kecil, 0.005 wt%). Concentrations of acid-insoluble residues were signi®cantly di�erent amongthese three sites (ANOVA followed by TukeyÕs test,F � 238; p < 0:0001; d:f : � 2; 6). Acid-insoluble resi-dues re¯ected the composition of the surrounding sedi-ment. Sediments on the nearshore polluted reefcontained 15% siliciclastic mud. While sediment fromthe mangrove fringing reef contained 18% acid-insolu-ble material, most of this was quartz and feldspar grainsfrom P. Karimunjawa, and there was relatively littlesiliciclastic mud. Sediments on the o�shore referencereefs contained less than 1% non-carbonate material.(Edinger and Risk, 1998). Coral extension rates werenegatively correlated with non-carbonate content�r � ÿ0:99; p < 0:02� and organic content �r � ÿ0:99;p < 0:02� of reef sediments (n � 4, no sediment datafrom Bondo).
Ambon. Acid-insoluble residues were highest at thehigh sedimentation site adjacent to the plywood factory(Wailiha, 0.47 wt%), followed by the Ambon harbour
site (Wayame, 0.19 wt%), the rubble bottom/gleanedsite (Hila, 0.05 wt.%), and lowest at the reference site(Tanjung Setan, 0.01 wt%). Acid-insoluble content wassigni®cantly higher at Wailiha and Wayame than at Hilaand Tj. Setan (Mann±Whitney U-test). Acid-insolublecontent in skeletons re¯ected the composition of sur-rounding sediments. Non-carbonate materials in bottomsediments were 46.9% at Wailiha, 42.9% at Wayame,7.5% at Hila and 4.7% at Tj. Setan; acid-insolublematerial in bottom sediments was signi®cantly higher atWailiha and Wayame than at Hila and Tj. Setan(Mann±Whitney U-test, 57>W> 52, p<0.05, n� 5 forall sites). Acid-insoluble content in coral skeletons wasstrongly correlated with acid-insoluble content of bot-tom sediments, �r � 0:87�, SPM (0.97) and downwardsediment ¯ux (r � 0:97, all n � 4; Table 10). Coral ex-tension rates were not correlated with acid-insolublecontent of coral skeletons (r � 0:04; n � 4) or bottomsediments �r � ÿ0:43; n � 4�.
All sites combined. Acid-insoluble residues in coralskeletons in Java and Ambon combined re¯ected theacid-insoluble content of surrounding reef sediments�r � 0:87; n � 7�, but were not strongly correlated withchlorophyll A concentration, SPM, or net downwardsediment ¯ux (r < ÿ0:29 in all cases, n � 7; Table 10).Acid-insoluble residues were not correlated with coralextension rates �r � 0:22�, but were negatively corre-lated with live coral cover �r � ÿ0:40; n � 7�.
Skeletal density and calci®cation ratesSkeletal density of P. lobata corals was lowest on the
nearshore sewage-polluted Java Sea Reef (P. Panjang,mean density� 1.08 g/cm3), intermediate on the highsediment reef (Bondo, mean density� 1.17 g/cm3) andthe reef adjacent to mangroves (LM, mean density�
TABLE 6
P. lobata coral skeletal density, Java Sea.a ;b
Reef Average (g/cm3) Variance N corals
Gosong Cemara 1.33 0.39 4Pulau Kecil 1.27 0.32 3Lagun Marican 1.21 0.28 3P. Panjang 1.08 0.26 4Bondo 1.17 0.22 4
Source of variance SS d.f. MS F p-value
Between groups 0.144 4 0.0359 3.80 0.03Within groups 0.123 13 0.00945
Reef Cemara Kecil Marican Panjang Bondo
CemaraKecil NSMarican NS NSPanjang p < 0:05 NS NSBondo NS NS NS NS
aVariance homogeneous (Levene statistic� 1:31; p > 0:3).b Signi®cant di�erence (p < 0:05) in skeletal density only between G. Cemara and P. Panjang, as indicated by Tukey's B-test.
414
Marine Pollution Bulletin

1.21 g/cm3), and highest on the unpolluted o�shore reefs(Cemara and P. Kecil, mean density� 1.31 g/cm3 and1.27 g/cm3, respectively; Table 6). There was a weakpositive relationship between average density and aver-age extension rate (r � 0:41; p � 0:07; n � 18 corals).Surprisingly, there were no signi®cant relationships be-tween density and extension within any given coral orsite, except within coral PPS 2, where density wasstrongly inversely related to extension rate(r � 0:91; p < 0:001; n � 8 years). Average skeletaldensity was negatively correlated with chlorophyll Aconcentration (r � ÿ0:79; p < 0:10; n � 5 reefs; Fig. 6a;Table 10) and acid-insoluble residues in coral skeletons(r � ÿ0:81; p < 0:01; n � 9 corals).
Java Sea calci®cation rates were signi®cantly higher atthe vegetated coral cay (P. Kecil) than at the mangrovefringing reef site (L. Marican), but did not di�er sig-ni®cantly among any of the other reefs. (One-wayANOVA followed by Tukey's post-hoc test,F � 10:32; p < 0:002; d:f : � 17; Table 7.) Average cal-ci®cation rates were signi®cantly negatively correlatedwith chlorophyll A concentration (r � ÿ0:98;p < 0:0002, Fig. 6b) and downward sediment ¯ux(r � ÿ0:98; p < 0:0002; Table 10).
Bioerosion
Java Sea. Bioerosion intensity of massive corals onthe Java Sites was highest at the nearshore reefs in
Jepara (8.54%) and Bondo (8.18%), intermediate atLagun Marican (2.95%), and lowest at the o�shore reefsPulau Kecil (2.54%) and Gosong Cemara (1.04%).Bioerosion intensity was signi®cantly higher on the twopolluted reefs (P. Panjang, Bondo) than on the twounpolluted o�shore reefs (G. Cemara, P. Kecil; Table 8;one-way ANOVA followed by Tukey's test,F � 9:65; p < 0:001, data square-root transformed tohomogenize variance). Average bioerosion at each reefwas positively correlated with average chlorophyll Aconcentration �r � 0:72; n � 5; Fig. 6c; Table 10). Whenthe mangrove site was removed from the regression,chlorophyll A concentration, indicative of land-basedpollution on the nearshore sites, accounted for 98% ofthe variance in bioerosion �r2 � 0:98; n � 4; p < 0:02�.Massive coral bioerosion was positively correlated withacid-insoluble residues in individual coral skeletons(r � 0:79; p < 0:06; n � 8 corals).
Ambon. Massive coral bioerosion intensity was low atall the study sites in Ambon. Bioerosion intensity waslowest at the rubble bottom site (Hila, 0.87%), followedby the reference site (Tj. Setan, 1.43%), the high sedi-ment site (Wailiha, 1.63%) and the Ambon Harbour site(1.67%). When both Ambon and Java Sea data werepooled, bioerosion was signi®cantly positively correlat-ed with chlorophyll A concentration �r � 0:74; p <0:03; n � 9�. Bioerosion data are treated more fully inEdinger (1998) and Holmes et al. (MS).
Fig. 6 Regressions. (a) Mean Java sea coral skeletal density vs.chlorophyll A concentrations. (b) Mean Java Sea coral calci-®cation rates vs. chlorophyll A concentrations. (c) Mean JavaSea bioerosion vs. chlorophyll A concentration. (d) Java seanet carbonate production vs. chlorophyll A concentrations.Chlorophyll A concentrations for Java Sea Reefs are averagesof windward and leeward concentrations. Mangrove fringingreef and polluted reefs indicated.
415
Volume 40/Number 5/May 2000

Net carbonate production, Java Sea ReefsGross carbonate production (Table 9) was highest at
the two unpolluted coral cays (G. Cemara: 14.3 kgCaCO3/m
2/yr; P. Kecil: 13.5 kg CaCO3/m2/yr), inter-
mediate at the high sediment fringing reef (Bondo, 4.3kg CaCO3/m
2/yr), and lowest at the sewage-pollutedreef (P. Panjang, 3.2 kg CaCO3/m
2/yr) and the man-grove fringing reef (L. Marican, 3.3 kg CaCO3/m
2/yr).Carbonate destruction (Table 9) was highest at thesewage-polluted reef (P. Panjang, 10.6 kg CaCO3/m
2/yr), intermediate at the high sediment fringing reef(Bondo, 5.1 kg CaCO3/m
2/yr), and lowest at the two
unpolluted coral cays (P. Kecil, 2.3 kg CaCO3/m2/yr; G.
Cemara: 2.7 kg CaCO3/m2/yr) and the mangrove
fringing reef (L. Marican, 0.9 kg CaCO3/m2/yr). Net
carbonate production (Fig. 7) was positive at the twoo�shore coral cays (G. Cemara: 11.7 kg CaCO3/m
2/yr;P. Kecil: 11.2 kg CaCO3/m
2/yr) and the mangrovefringing reef (L. Marican, 2.5 kg CaCO3/m
2/yr), andwas negative at the two nearshore polluted reefs (P.Panjang:)7.38 kg CaCO3/m
2/yr; Bondo:)0.79 kgCaCO3/m
2/yr). These results match qualitative obser-vations suggesting that the nearshore sewage-pollutedreef is undergoing net reef erosion.
TABLE 7
P. lobata calci®cation rates, Java Sea.a
Reef Average (g/cm2/yr) Variance N corals
Gosong Cemara 2.09 0.67 4Pulau Kecil 2.19 0.48 3Lagun Marican 1.39 0.51 3P. Panjang 1.51 0.40 4Bondo 1.54 0.60 4
Source of variance SS d.f. MS F p-value
Between groups 1.82 4 0.46 4.58 0.016Within groups 1.30 13 0.10
Reef Cemara Kecil Marican Panjang Bondo
CemaraKecil NSMarican NS p < 0:05Panjang NS NS NSBondo NS NS NS NS
aTukey's-B test indicated the only signi®cant di�erence was between P. Kecil (o�shore) and L. Marican (mangrove). Variance homogeneous (LeveneStatistic� 1:61; p > 0:2).
TABLE 8
Java Sea massive coral bioeorosion intensity.a ;b
Reef Raw average % Transformed average Raw variance Transformed variance N corals
Gosong Cemara 1.06 1.006 0.20 0.06 5Pulau Kecil 1.62 1.25 0.59 0.09 3Lagun Marican 1.74 1.22 2.36 0.32 5P. Panjang 9.09 2.91 26.18 0.76 5Bondo 7.92 2.72 25.70 0.67 4
Source of variance SS d.f. MS F p-value
Between groups 15.36 4 3.84 9.65 < 0:001Within groups 6.76 17 0.40
Reef Cemara Kecil Marican Panjang Bondo
CemaraKecil NSMarican NS NSPanjang p < 0:001 p < 0:02 p < 0:005Bondo p < 0:006 p < 0:05 p < 0:02 NS
aUntransformed variance not homogeneous. (Levene statistic� 5:47; p < 0:005). Data square-root transformed to homogenize variance, Levenestatistic� 2:08; p > 0:12). ANOVA and Tukey's test calculated on square-root transformed data.b Signi®cant di�erences (p < 0:05) in coral bioerosion rates indicated by Tukey post-hoc test.
416
Marine Pollution Bulletin

Net carbonate production was positively correlatedwith coral extension rates on the Java Sea Reefs, but thistrend was not statistically signi®cant �r � 0:69; p >0:15; n � 5�. Net carbonate production was moreclosely correlated with skeletal density �r � 0:98; p <0:02; n � 5�, calci®cation �r � 0:84; p < 0:10; n � 5�and acid-insoluble residues in coral skeletons(r � ÿ0:97; p < 0:05; n � 3 reefs: P. Kecil, L. Marican,P. Panjang). Among environmental variables, net car-bonate production was negatively correlated with chlo-rophyll A concentration (r � ÿ0:88; p < 0:05; n � 5,Fig. 6d), suspended particulate matter �r � ÿ0:72;ns; n � 5�, downward sediment ¯ux (r � ÿ0:88; p <0:05; n � 4, no data from L. Marican), and light ex-tinction coe�cient (r � ÿ0:78; p � 0:12; n � 5; Table
10). The mangrove fringing reef had the highest lightextinction coe�cient �k � ÿ0:37� and the lowest coralextension rates (11.7 mm/yr) of the ®ve Java Sea sites,but net carbonate production there was positive, andwas intermediate between o�shore clearwater reefs andnearshore polluted reefs. When the mangrove fringingreef was excluded, most of the variation in net carbonateproduction could be explained by light extinction coef-®cients �r2 � 0:85; p < 0:08; n � 4�.
Discussion
Reduced live coral cover and high mortality indicesindicate severe degradation of reefs a�ected by land-based pollution in each region that we studied. These
TABLE 9
Net carbonate production calculations for Java Sea Reefs. Net carbonate production� gross carbonate production less carbonate destruction. Allcalculations based on leeward reef values.a ;b
Reef (units) Calci®cation rate(g CaCO3/cm
2/yr)% live coral cover
(%)Gross carbonate
production(kg CaCO3/m
2/yr)
Pulau Panjang 1.51 (0.63)4 21.2 (11.5)3 3.2Bondo 1.54 (0.77)4 28.0 (8.2)5 4.3Lagun Marican 1.39 (0.71)3 23.8 (5.9)3 3.4Pulau Kecil 2.19 (0.69)3 61.7 (17.8)5 13.5Gosong Cemara 2.09 (0.82)4 68.5 (5.1)3 14.3
Reef (units) Bioerosion (cm2) Density (g/cm3) Mean age (years) Live cover (%) Dead cover (%) Carbonate destruction(kg CaCO3/m
2/yr)
Pulau Panjang 9.09 (5.11)5 1.08 (0.51)4 7.8 (1.18)5 21.2 (11.5)3 58.9 (2.5)3 10.08Bondo 7.34 (7.14)4 1.17 (0.47)4 8.3 (3.37)4 28.0 (8.2)5 21.2 (6.5)5 5.09Lagun Marican 2.87 (2.85)5 1.21 (0.53)3 11.4 (2.27)5 23.8 (5.9)3 5.4 (4.9)3 0.89Pulau Kecil 2.54 (0.88)3 1.27 (0.57)3 10.5 (3.22)3 61.7 (17.8)5 13.6 (5.0)5 2.31Gosong Cemara 2.10 (1.22)5 1.33 (0.63)4 9.4 (0.95)5 68.5 (5.1)3 19.8 (5.4)3 2.62
aA: Gross carbonate production. Gross carbonate production by corals is estimated as mean calci®cation rate of Porites lobata ´ percent live coralcover of all corals, assuming approximately equal calci®cation rates for all coral species on each reef. Standard deviations indicated (in brackets);number of corals indicated in subscript.b B: Carbonate destruction. Carbonate destruction is estimated from cross-sectional area bioeroded from 1 cm thick Porites slabs, skeletal density,average age of corals sampled, total live coral cover, and total standing dead coral cover, assuming approximately equal internal bioerosion rates forlive and standing dead corals of all species. Standard deviations indicated (in brackets); numbers indicated in subscript. Calculations as in text.
Fig. 7 Gross carbonate production, carbonate destruction and netcarbonate production for Java Sea Reefs. Increasing nutrientsand sedimentation to right.
417
Volume 40/Number 5/May 2000
TABLE
10
Correlationcoe�
cients
relatingwaterquality
variablesandreef
healthparameters,byregion.a
Region
Parametre
Cover
Mortality
Maxdepth
Extension
Density
Calci®cation
Bioerosion
Acid-insol.
Net
carb
production
Measure
Nreefs
55
55
55
53
5
JavaSea
Chl.A
5)0.98���
0.52
)0.99
)0.95�
)0.81
)0.99���
0.66
0.63
)0.88�
SPM
5)0.76
0.3
)0.65
)0.67
)0.67
)0.65
0.33
0.48
)0.61
Resusp.
4)0.93�
0.75
)0.99
)0.99���
)0.99���
)0.97���
0.94�
)0.88
Secchi
50.98��
)0.56
0.99
0.92�
0.92�
0.98���
)0.70
)0.69
0.90�
K(m
eas)
50.89
)0.46
0.86
0.92�
0.92�
0.93�
)0.42
)0.62
0.78
Parametre
Cover
Mortality
Maxdepth
Extension
bioerosion
Acid-insol.
Nreefs
44
44
44
Ambon
Chl.A
4)0.74
0.72
)0.57
0.57
)0.31
0.57
NO3
4)0.09
0.1
)0.31
)0.96�
0.53
0.11
PO4
4)0.28
0.32
)0.35
)0.95�
0.002
)0.11
SPM
4)0.67
0.63
)0.84
)0.19
0.71
0.97*
Resusp.
4)0.67
0.62
)0.74
0.28
0.48
0.97*
Secchi
40.78
)0.75
0.93
0.32
)0.59
)0.93
k04
0.7
)0.66
)0.82
)0.07
)0.59
0.99��
Parametre
Cover
mortality
Maxdepth
Extension
Nreefs
44
44
Sulawesi
Chl.A
4)0.98��
0.99��
)0.89
)0.06
NO3
4)0.92�
0.92�
)0.92�
0.31
PO4
4)0.98��
0.90
)0.99���
0.09
SPM
4)0.96��
0.99���
)0.84
)0.01
Resusp.
3)0.97�
0.99���
)0.99���
)0.22
Secchi
40.98��
)0.97�
0.94��
)0.09
k04
0.92�
)0.99���
0.78
0.06
Parametre
Nreefs
13
13
13
13
97
AllReefs
Chl.A
13
)0.68�
0.46
)0.58�
)0.63�
0.74�
)0.28
NO3
8)0.46
0.52
)0.59*
)0.17
0.53
0.11
PO4
8)0.70��
0.71��
)0.74��
)0.26
0.002
)0.11
SPM
13
)0.54
0.35
)0.72��
)0.39
0.54
)0.14
Resusp.
11
)0.44
0.49
)0.6
)0.54
0.96
)0.19
Secchi
13
0.88���
)0.66�
0.92���
0.55�
)0.62
0.39
k013
)0.68�
)0.47
0.74��
0.59�
)0.79��
)0.06
aSim
ple
correlationcoe�
cients
shown,number
ofreefsobserved
foreach
correlationindicatedbymeasure
andbyparameter.Nosedim
entresuspensiondata
from
L.Marican(JavaSea);nonitrate
or
phosphate
data
from
theJavaSea
sites.
*p<
0:05:
**
p<
0:01:
***
p<
0:001:
418
Marine Pollution Bulletin

patterns are accompanied by reduced coral speciesdiversity on the same reefs (Edinger et al., 1998) and byelevated d15N, indicating a contribution of anthropo-genic nitrogen to coral nutrition (Heikoop et al., inpress). Of the ®ve reefs most a�ected by land-basedpollution in this study, only one, Wayame, exhibited adecrease in coral extension rates through time and loweraverage coral growth rates than reference reefs in thesame region. On the other four severely polluted reefs,normal coral extension rates were observed with low livecoral cover, high cover of non-calci®ed invertebrates,high mortality indices and high bioerosion intensity.
On the polluted Java Sea Reefs, coral extension rateswere not signi®cantly lower than on o�shore clearwaterreefs, yet these reefs experienced net reef erosion. Simi-larly, normal coral extension rates coincided with lowlive coral cover and high other invertebrate cover on themost degraded reef in Ambon (Wailiha, high sediment,next to plywood factory). Although massive coralbioerosion was not signi®cantly di�erent among theAmbon reefs, branching coral rubble bioerosion inten-sities were higher on polluted than unpolluted Ambonreefs (Edinger, 1998; Holmes et al., MS). Likewise, therewere no statistically signi®cant di�erences in coral ex-tension rates among the four Sulawesi reefs, but themost polluted reef in Sulawesi (Kayangan) had lowcoral cover, high coral mortality, and high cover of¯eshy algae and invertebrates. Linear regression showedthat coral extension rates decreased with increasingproductivity, both within the Java Sea and for all reefscombined, but not within Sulawesi or Ambon alone.
Our Java Sea coral extension rate results resemble thevariation in coral extension rates reported from thePulau Seribu (Thousand Islands) island chain, wherecoral extension rates decrease with proximity to Jakarta(Sco�n, 1986). As on our Java Sea sites, coral extensionrates from Pulau Seribu were positively correlated withwater clarity. Although e�uent from Jakarta containsvast quantities of untreated sewage and inorganic nu-trients, nearshore reef degradation in Jakarta Bay wasapparently sediment dominated, as evidenced by theabsence of algae, and the scarcity of sediment-sensitiveboring sponges among the bioeroding fauna on near-shore reefs (Tomascik et al., 1993).
Onshore to o�shore decreases in extension rates havebeen described from Thailand (Sco�n et al., 1992) theGreat Barrier Reef (Lough and Barnes, 1992), Mayotte(Priess et al., 1995), and elsewhere (reviewed in Loughand Barnes, 1997). In this study, coral extension rates atKapoposan, the unpolluted reef at the edge of theSpermonde shelf in Sulawesi, were as low as those on themost severely polluted reefs in all three regions (P.Panjang, Bondo, Wayame, Kayangan). By contrast,coral extension rates at the Java Sea and Ambon refer-ence sites and at Barang Lompo, Sulawesi, were thehighest we observed. All the reefs in Ambon receivesome in¯ux of terrigenous nutrients and organic matter,and chlorophyll A concentrations are similar at all four
Ambon sites, although inorganic nutrient concentra-tions are much higher within Ambon Bay than else-where (Table 2). The Java Sea reference reefs are close toa forested high island, Karimunjawa, which may con-tribute some natural land-derived nutrients. BarangLompo, Sulawesi, experiences locally generated sewagepollution, with mesotrophic phytoplankton productivity(chlorophyll A� 0.75 mg/m3) and relatively high waterclarity (kÕ�)0.1). These small increases in ¯ux of in-organic nutrients and organic matter may stimulatecoral metabolism without signi®cantly decreasing waterclarity.
High coral extension rates have been observed adja-cent to sewage outfalls (Van Woesik, 1992; Risk et al.,1993; Dollar, 1994; reviewed in Lough and Barnes,1997). Whole colony Montastrea annularis extensionrates ®rst increased, then decreased along a eutrophi-cation gradient in Barbados (Tomascik and Sander1985). Similar patterns were observed in small coloniesof Porites porites, (F. Marubini, pers comm., 1997), andjuvenile corals were larger, but less abundant and lessdiverse, on eutrophied reefs than on nearby non-eutro-phied Barbados reefs (Wittenberg and Hunte, 1992). Aswith our data from Indonesia, these patterns suggestthat coral extension rates may respond positively tomoderate increases in productivity (cf. Tomascik andSander, 1985; Lough and Barnes, 1992). Coral coverand diversity was lower, and algal cover was higher, oneutrophied Barbados reefs than on unpolluted reefs(Tomascik and Sander, 1987). Coral rubble bioerosionalong the Barbados eutrophication gradient also in-creases with eutrophication and SPM (Holmes, 1997).Likewise, on the Indonesian reefs in this study, land-based pollution, principally eutrophication, greatly de-creased coral species diversity and coral cover (Edingeret al., 1998), and increased coral bioerosion.
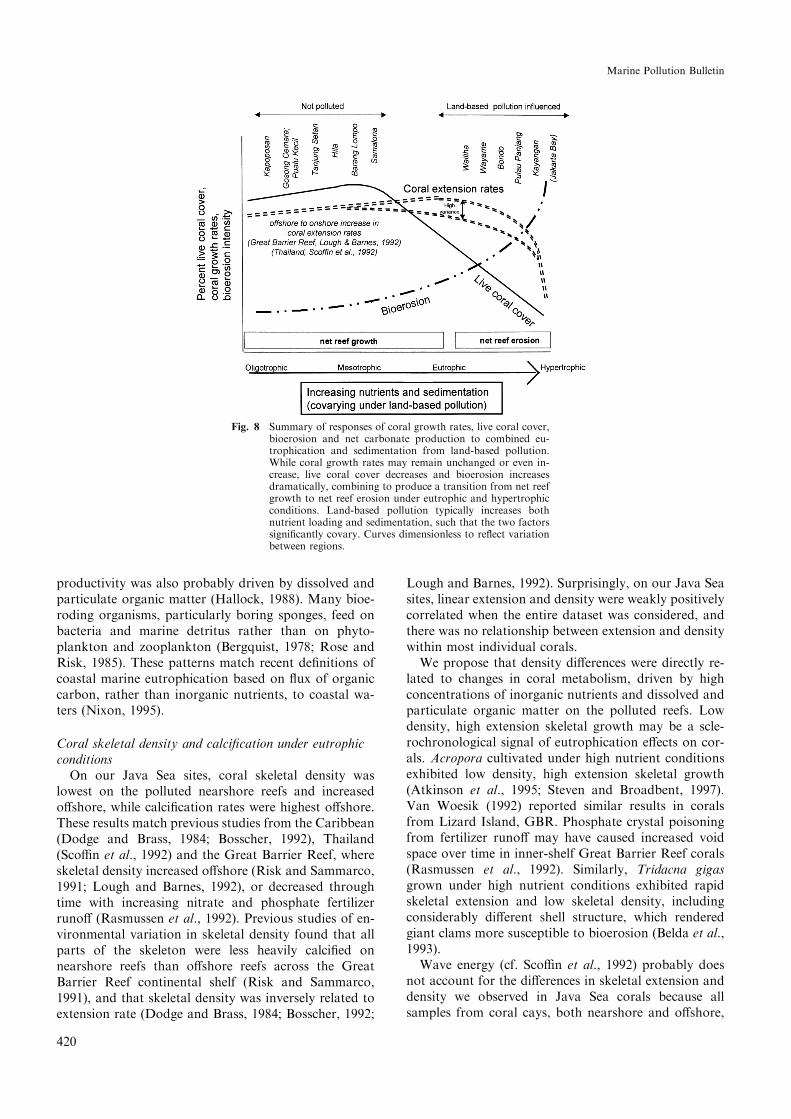
Our results, and the patterns observed in Barbados,Australia, and elsewhere, can be summarized diagram-matically as a series of curves along a gradient of nu-trients and sedimentation (Fig. 8). Coral extension ratesincreased from oligotrophic to mesotrophic conditions,then decreased again toward eutrophic and hypertrophicconditions as turbidity from sediments and phyto-plankton reduced light penetration to corals. Highvariance in extension rates was observed on the pollutedJava Sea reefs. Live coral cover decreased, and bioero-sion increased, from mesotrophic to eutrophic and hy-pertrophic conditions. The sum of these three e�ects wasa change from net reef growth to net reef erosion, asexempli®ed by our net carbonate production calcula-tions from the Java Sea.
Non-calci®ed invertebrates had higher cover valuesthan algae on most of the polluted reefs, suggesting thatdissolved and particulate organic matter had more in-¯uence on benthic cover than did inorganic nutrients,and that sedimentation reduced light penetration en-ough to hinder the growth of algae on many pollutedreefs. Increased bioerosion intensity with phytoplankton
419
Volume 40/Number 5/May 2000
productivity was also probably driven by dissolved andparticulate organic matter (Hallock, 1988). Many bioe-roding organisms, particularly boring sponges, feed onbacteria and marine detritus rather than on phyto-plankton and zooplankton (Bergquist, 1978; Rose andRisk, 1985). These patterns match recent de®nitions ofcoastal marine eutrophication based on ¯ux of organiccarbon, rather than inorganic nutrients, to coastal wa-ters (Nixon, 1995).
Coral skeletal density and calci®cation under eutrophicconditions
On our Java Sea sites, coral skeletal density waslowest on the polluted nearshore reefs and increasedo�shore, while calci®cation rates were highest o�shore.These results match previous studies from the Caribbean(Dodge and Brass, 1984; Bosscher, 1992), Thailand(Sco�n et al., 1992) and the Great Barrier Reef, whereskeletal density increased o�shore (Risk and Sammarco,1991; Lough and Barnes, 1992), or decreased throughtime with increasing nitrate and phosphate fertilizerruno� (Rasmussen et al., 1992). Previous studies of en-vironmental variation in skeletal density found that allparts of the skeleton were less heavily calci®ed onnearshore reefs than o�shore reefs across the GreatBarrier Reef continental shelf (Risk and Sammarco,1991), and that skeletal density was inversely related toextension rate (Dodge and Brass, 1984; Bosscher, 1992;
Lough and Barnes, 1992). Surprisingly, on our Java Seasites, linear extension and density were weakly positivelycorrelated when the entire dataset was considered, andthere was no relationship between extension and densitywithin most individual corals.
We propose that density di�erences were directly re-lated to changes in coral metabolism, driven by highconcentrations of inorganic nutrients and dissolved andparticulate organic matter on the polluted reefs. Lowdensity, high extension skeletal growth may be a scle-rochronological signal of eutrophication e�ects on cor-als. Acropora cultivated under high nutrient conditionsexhibited low density, high extension skeletal growth(Atkinson et al., 1995; Steven and Broadbent, 1997).Van Woesik (1992) reported similar results in coralsfrom Lizard Island, GBR. Phosphate crystal poisoningfrom fertilizer runo� may have caused increased voidspace over time in inner-shelf Great Barrier Reef corals(Rasmussen et al., 1992). Similarly, Tridacna gigasgrown under high nutrient conditions exhibited rapidskeletal extension and low skeletal density, includingconsiderably di�erent shell structure, which renderedgiant clams more susceptible to bioerosion (Belda et al.,1993).
Wave energy (cf. Sco�n et al., 1992) probably doesnot account for the di�erences in skeletal extension anddensity we observed in Java Sea corals because allsamples from coral cays, both nearshore and o�shore,
Fig. 8 Summary of responses of coral growth rates, live coral cover,bioerosion and net carbonate production to combined eu-trophication and sedimentation from land-based pollution.While coral growth rates may remain unchanged or even in-crease, live coral cover decreases and bioerosion increasesdramatically, combining to produce a transition from net reefgrowth to net reef erosion under eutrophic and hypertrophicconditions. Land-based pollution typically increases bothnutrient loading and sedimentation, such that the two factorssigni®cantly covary. Curves dimensionless to re¯ect variationbetween regions.
420
Marine Pollution Bulletin

were collected from the leeward sides of reefs. In addi-tion, corals from the most protected reef sampled, L.Marican, had the lowest extension rates, intermediatedensity and lowest calci®cation rates.
Coral nutrition under eutrophic conditionsDissolved inorganic nutrients and organic matter
from sewage or aquacultural e�uent may have con-tributed to coral metabolism and indirectly to skeletalextension at the polluted sites in Java, Sulawesi, andAmbon (P. Panjang, Bando, Kayangan, Wayame &Wailiha; cf. Tomascik and Sander, 1985; Risk et al.,1993, Risk et al., 1994), partially counteracting thenegative e�ect of increased turbidity on coral extension.Sewage-derived inorganic nutrients and DOM/POMwould not have been present at the mangrove fringingreef. Tomascik and Sander (1985) suggested thatthe organic fraction of SPM may be an importantfood source for corals (Lewis, 1977), and mayincrease skeletal extension rates, up to moderate SPMconcentrations.
Corals subject to anthropogenic eutrophication mayfeed heterotrophically on dissolved and particulate or-ganic matter (e.g., Lewis, 1977; Risk et al., 1994), or mayexperience inorganic nutrient stimulation of zooxan-thellae growth, i.e., fertilized autotrophy (e.g., Atkinsonet al., 1995; Stephen and Broadbent, 1997). Nitrogenand carbon stable isotope data can identify terrigenousin¯uence on diet (Heikoop, 1997; Samamarco et al.,1999; Heikoop et al., in press) and help to distinguishbetween increased heterotrophy and fertlized autotro-phy. Analysis of d13C values in coral tissue can indicatethe extent to which corals in eutrophic environments arefeeding heterotrophically or autotrophically (Muscatineet al. 1989, Risk et al. 1994). Within each region westudied, coral tissue d15N isotope ratios on polluted reefsshowed enrichment in the heavy isotope (Dunn, 1995;Jompa, 1996; Limmon, 1996, Lazier, 1997), and wereconsistent with utilization of sewage-derived wastewaterDIN (Heikoop et al., in press). Coral tissue d13C onpolluted reefs suggested nutrient stimulation of thezooxanthellae, and that autotrophic nutrition stilldominated in the sewage-a�ected P. lobata. The isotopicpatterns, however, do not preclude lesser reliance onheterotrophy as an additional nutritional strategy.
Light, sedimentation and acid-insoluble residuesCoral extension rates are usually positively correlated
with light availability until corals are light-saturated(Buddemeier and Kinzie, 1976; Highsmith, 1979). Cor-als generally become light-saturated with respect togrowth and calci®cation above 10±15% of surface levelsof photosynthetically active radiation (PAR; Buddeme-ier et al., 1974; Dustan, 1975; Huston, 1985; Bosscher,1992). At 1 m, the depth at which the corals in this studywere collected, coral extension rates were almost cer-tainly not limited by light. Nonetheless, more than 88%of the variation in Java Sea coral extension rates could
be explained by turbidity. Suspended sediment andphytoplankton were the dominant contributors to tur-bidity, followed by sediment resuspension (downwardsediment ¯ux).
The high light extinction coe�cients observed on thenearshore Java Sea Reefs (P. Panjang South, )0.35;Bondo, )0.27) and the mangrove fringing reef (L. Ma-rican, )0.37) were all well beyond the averages for wa-ters around healthy coral reefs (Bosscher, 1992). On themost heavily polluted Java Sea Reefs, light intensity at 3m depth was already less than 15% of surface light(Table 2), suggesting that corals growing at depthsgreater than 3 m on turbid nearshore Java Sea Reefs arecritically light-limited (cf. Tomascik et al., 1993). Simi-larly, we found a strong positive correlation betweenwater clarity, as measured by Secchi disk extinctiondepth, and maximum depth of coral growth in all threeregions sampled. The decline in coral extension rates atWayame, in Ambon Harbour, can probably be attrib-uted to a dramatic increase in turbidity around 1990(Limmon, 1996). Oil pollution and sediment resuspen-sion from construction of the adjacent oil terminal mayalso have contributed to reef degradation at Wayame.
Reductions in coral extension rates associated withsiltation are usually attributed to reduced light pene-tration, metabolic stress associated with sediment re-jection and abrasion (reviewed by Rogers, 1990;Hubbard, 1997). Suspended terrigenous sediments (siltand clay) reduce light penetration and coral photosyn-thesis more than equal concentrations of reef-derivedcarbonate silt (Te, 1997), implying that the nature of thesediment may be as important to corals as the sedi-mentation rate. Sediments at the Java Sea mangrove site(L. Marican) were dominantly carbonate mud, withsome quartz and feldspar grains, but very little silici-clastic mud. Sediments on the nearshore polluted reefscontained up to 15% siliciclastic mud (Edinger andRisk, 1998).
Acid-insoluble residues indicate terrigenous in¯uenceon corals and coral reefs, where the hinterland is com-posed of volcanic or siliciclastic rocks (Cortes and Risk,1985). Acid-insoluble residues in our Java Sea sites werenot signi®cantly correlated with coral extension rates,but were strongly negatively correlated with massivecoral bioerosion and net carbonate productivity. Thispattern is hardly surprising: terrigenous sediments, nu-trients, and organic matter typically covary, particularlyadjacent to islands with high runo�. While moderateincreases in terrigenous nutrient and organic matter ¯uxmay increase coral extension rates, these increased ¯uxeswill likely lead to decreased coral cover and increasedbioerosion.
Carbonate budgets and reef healthCarbonate budgets are important for understanding
reef health, particularly in the face of land-based pol-lution (Glynn, 1997; Hubbard, 1997; McClanahan,1997): a reef that cannot maintain a positive carbonate
421
Volume 40/Number 5/May 2000

budget will eventually die. Qualitative and quantitativeevidence suggests that the most pollution-stressed reefswe studied had negative carbonate budgets, i.e., wereundergoing net erosion. At the Java Sea sewage-pollutedreef (P. Panjang), the Holocene raised reef visible alongmost of the island's shore is being eroded on all sides,and comparison with 1944 US Army maps and a 1972LandSat image shows that the size of the island is de-creasing (Kamiludin et al., 1991). Likewise, the leewardside of the most polluted reef we sampled in Sulawesi,Kayangan reef, is now entirely dead, and the island iseroding. The death of the leeward side of Kayangan reefpost-dates Dutch accounts from the 1930s (Umbgrove,1947), and probably coincided with the rapid growth ofUjung Pandang as a population and industrial centre inthe 1970s and 1980s (Jompa, 1996).
We used net carbonate production as a simple proxyfor carbonate budgets. Positive net carbonate produc-tion predicts a positive carbonate budget and net reefaccretion, while negative net carbonate productionpredicts negative carbonate budgets, net reef erosionand eventual reef death. Our gross carbonate produc-tion, carbonate destruction and net carbonate produc-tion values are in the same range as results of morecomplex models from other regions (Stearn et al., 1977;Sco�n et al., 1980; Hubbard et al., 1990; Conand et al.,1997; Sco�n, 1997). The mean P. lobata linear extensionrates, density and calci®cation rates from the nearshoreJava Sea Reefs (Pulau Panjang; 13.5 mm/yr; 1.08 g/cm3;1.51 g/cm2/yr; Bondo: 13.8 mm/yr, 1.17 g/cm3, 1.54g/cm2/yr) were similar to the average of 8 massive coralspecies reported from a nearshore environment inThailand (13.1 mm/yr; 1.10 g/cm3; 1.45 g/cm2/yr; Scof-®n, 1997), as was the gross carbonate production rate ofapproximately 3 kgCaCO3/m
2/yr.On the Java Sea Reefs we studied, coral extension
rates and net carbonate production were not signi®-cantly correlated, although coral calci®cation rates weresigni®cantly positively correlated with net carbonateproduction. Net carbonate production decreased withincreasing productivity and turbidity, as predicted byHallock and Schlager (1986). Our net carbonate pro-duction calculations suggest that reef growth was largelydecoupled from individual coral growth as measured bylinear extension rates, in that individual coral growthrates were not accurate predictors of net carbonateproduction (cf. Davies, 1977; Schlager, 1981; Hubbardet al., 1990; Schlager, 1999). Reef growth (net carbonateproduction) was controlled mostly by pollution e�ectson live coral cover and coral mortality, on cover of non-calcifying algae and invertebrates, and on bioerosion.
Implications for reef management: what do coral growthrates tell us about reef health?
Dying coral reefs subject to land-based pollution canhave individual coral vertical extension rates equal tothose on o�shore unpolluted reefs, while undergoing netreef erosion. This pattern has important implications for
the use of coral extension rates as indicators of coral reefhealth. The patterns described here can help explain thelack of a coral extension rate response on coral reefsa�ected by combined eutrophication and sedimentation(e.g., Dodge and Brass, 1984; Changsang, et al., 1992),even while such reefs undergo net reef erosion, andeventually die (Glynn, 1997).
The most severely degraded reefs in each region thatwe studied ± Pulau Panjang and Bondo in Java, Way-ame and Wailiha in Ambon, and Kayangan in Sulawesi± are all probably beyond hope for restoration unlessland-based pollution onto them is eliminated (Edingeret al., 1998). These reefs may soon die completely, as didmost of the reef islands in Jakarta Bay (Tomascik et al.,1993), some of which have since subsided below sea level(Tomascik et al., 1993; Uneputty and Evans, 1997).High coral mortality indices on the reefs we studiedsuggested that anthropogenic degradation had recentlyturned environmental conditions for the worse (cf. VanWoesik and Done, 1997), but in only one case was highcoral mortality accompanied by a decrease in coral ex-tension rates through time. Likewise, in only one casewere average coral growth rates lower than averagecoral growth rates on reference reefs in the same region.Absence of a coral extension rate response, through timeor by comparison with reference reefs, does not indicatelack of impact on a reef. The con¯icting metabolic andgrowth rate responses of corals to nutrients and sedi-mentation may help explain other cases in which coralgrowth (extension) rates remained unchanged despitesevere reef degradation (e.g., Dodge and Brass, 1984;Changsang et al., 1992).
Combined study of coral extension rates and otherattributes of reef health can help to distinguish di�erenttypes of reef degradation. Normal to high extension, lowdensity skeletal growth may be a typical result of coralgrowth under eutrophic conditions (cf. Atkinson et al.,1995; Steven and Broadbent, 1997). The combination ofnormal coral extension rates, low coral skeletal density,low live coral cover and high bioerosion typi®ed theeutrophied reefs in our study and matched trends inthese variables documented separately in other parts ofthe world (e.g., Lough and Barnes, 1997; Risk andSammarco, 1991; Rose and Risk, 1985). Tissue stableisotope data suggested that on these reefs, sewage-de-rived inorganic nutrients and possibly organic mattermay have stimulated coral metabolism and skeleton-ization to partially compensate for the e�ect of reducedlight penetration from higher turbidity (Heikoop et al.,in press). Agricultural and aquacultural sources of eu-trophication on reefs in particular are often non-pointsources that are di�cult to control, and may requirecomprehensive watershed or coastal zone managementprograms (Chua et al., 1989; Rasmussen et al., 1992;Yap, 1996; Hodgson, 1997; Paez-Osuna et al., 1998).
Reefs subject to high sediment loads without atten-dant increases in nutrients or dissolved and particulateorganic matter should typically show reduced coral ex-
422
Marine Pollution Bulletin

tension rates, along with reduced live coral cover(Rogers, 1990) and low bioerosion intensity. Examplesinclude reefs a�ected by long term deforestation (Cortesand Risk, 1985; Hodgson and Dixon, 1988), mine tail-ings, construction (e.g., Eakin et al., 1993) or dredgingoperations (Dodge and Vaisnys, 1977; Dodge and Brass,1984). On these reefs, reduced light penetration fromsuspended sediment and metabolic stress associated withsediment rejection cause decreases in coral extensionrate (Rogers, 1990), without a compensating nutrientstimulation of coral metabolism. Likewise, oil pollutionand related toxins may lead to reduced coral extensionrates (Eakin et al., 1993; Guzman et al., 1994).
Our results suggest that coral growth (extension) ratesalone are poor indicators of coral reef health, particu-larly where anthropogenic eutrophication may play arole in reef degradation. This study documented normalcoral growth rates on reefs undergoing net reef erosion.High extension, low density coral growth may provide askeletal indicator of eutrophication on reefs, but tissuestable isotopes (Heikoop et al., in press) and bioeroderorganism counts (Scott and Cope, 1986; Holmes, 1997)may be more reliable. Other indicators of reef health willlikely respond to eutrophication before coral growthrates (see Jamieson et al., 1998), and a decline in growthrates may only be evident long after the reef is seriouslydegraded, if at all. The apparent paradox of normalcoral growth on dying coral reefs suggests that reefhealth is best considered at the scale of reef growth andcarbonate budgets (cf. McClanahan, 1997; Hubbard,1997). The patterns described here illustrate the need fora whole-reef perspective on coral reef health: if we donot see the reef for the corals, we do so at our peril.
We are grateful for the logistic support provided by the marine labs ofUNPATTI, UNHAS, and UNDIP, by the sta� of the Natural Re-sources Conservation District in Semarang and in Karimunjawa, tomany volunteer and student ®eld assistants who participated in variousaspects of ®eld work, too numerous to name here, and to the people inwhose villages and on whose islands we worked. N. Utama, H.R.Sunoko, and M. Kereliuk assisted with radiography at the UNDIPKariadi Hospital and at the McMaster University Medical Centre,respectively. M. Knyf and I. Guerrero and performed stable isotopeanalyses. M. Bennett performed acid-insoluble residue analyses for theJava Sea corals. J. Garrett designed and built the pycnometer for coralskeletal density measurements. D. Browne, A. Childs, and K. Holmesassisted with statistical analyses. A. Rao assisted with drafting maps.D. Browne, P. Copper, K. Holmes, H. Lescinsky, J. Rendell, J. Rink,P. Sammarco, and anonymous reviewers made helpful comments onearlier versions of this paper. This research was suppored by anNSERC operating grant to MJR, by the UNDIP-McMaster CoastalEcodevelopment Project (CIDA Partnerships in Cooperation andDevelopment grant # 098/S47074-(0-99)), and by the Marine ScienceEducation Project of the IndonesianMinistry of Higher Education. EEthanks the Geology Department, St. Francis Xavier University forcomputing and library support.
Atkinson, M. J., Carlson, B. and Crow, G. L. (1995) Coral growth inhigh nutrient, low-pH seawater: a case study of corals cultured atthe Waikiki Aquarium, Honolulu, Hawaii. Coral Reefs 14, 215±233.
Barnes, D. J. and Lough, J. M. (1993) On the nature and causes ofdensity banding in massive coral skeletons. Journal of ExperimentalMarine Biology and Ecology 167, 91±108.
Belda, C. A., Cu�, C. and Yellowlees, D. (1993) Modi®cation of shellformation in the giant clam Tridacna gigas at elevated nutrientlevels in sea water. Marine Biology 117, 251±257.
Bell, P. R. F. (1992) Eutrophication and coral reefs ± some examples inthe Great Barrier Reef lagoon. Water Research 26, 553±568.
Bergquist, P. R. (1978) Sponges. University of California Press,Berkeley, 268 p.
Birkeland, C. E. (1977) The importance of biomass accumulation inearly successional stages of benthic communities to the survival ofcoral recruits. Proceedings of the Third International Coral ReefSymposium 1, 15±21.
Birkeland, C. E. (1987) Nutrient availability as a major determiningfactor in di�erences among coastal hard-substratum communities indi�erent regions of the tropics. In Comparison Between Atlantic andPaci®c Tropical Marine Coastal Ecosystms: Community Structure,Ecological Processes, and Productivity, ed. C. E. Birkeland, UNE-SCO/COMAR.
Bosscher, H. (1992) Growth Potential of Coral Reefs and CarbonatePlatforms, p. 160. Free University, Utrecht.
Briggs, M. R. P. and Funge-Smith, S. J. (1994) A nutrient budget ofsome intensive marine shrimp ponds in Thailand. Aquaculture andFisheries Management 25, 789±811.
Buddemeier, R. W. and Kinzie, R. A. (1976) Coral Growth.Oceanography and Marine Biology Annual Review 14, 183±225.
Buddemeier, R. W., Maragos, J. E. and Knutson, D. K. (1974)Radiographic studies of reef coral exoskeletons: rates and patternsof coral growth. Journal of Experimental Marine Biology andEcology 14, 179±200.
Burnison, B. K. (1980) Modi®ed dimethyl sulfoxide (DMSO) extrac-tion for chlorophyll analysis of phytoplankton. Canadian Journal ofFisheries and Aquatic Sciences 37, 729±733.
Changsang, H., Phongsuwan, N. and Boonyanate, P. (1992) Growthof corals under e�ect of sedimentation along the northwest coast ofPhuket Island, Thailand. Proceedings of the Seventh InternationalCoral Reef Symposium 1, 241±248.
Chua, T. E., Paw, J. N. and Guarin, F. Y. (1989) The environmentalimpact of aquaculture and the e�ects of pollution on coastalaquaculture development in Southeast Asia. Marine PollutionBulletin 20, 335±343.
Conand, C., Chabanet, P., Cuet, P. and Letourneur, Y. (1997) Thecarbonate budget of a fringing reef in La Reunion Island (IndianOcean): sea urchin and ®sh bioerosion and net calci®cation.Proceedings of the Eighth International Coral Reef Symposium 1,953±958.
Cortes, J. and Risk, M. J. (1985) A coral reef under siltation stress:Cahuita, Costa Rica. Bulletin of Marine Science 36, 339±356.
Davies, P. J. (1977) Modern reef growth ± Great Barrier Reef.Proceedings of the Third International Coral Reef Symposium 2,325±330.
Dodge, R. E., Aller, R. C. and Thomson, J. (1974) Coral growthrelated to resuspension of bottom sediments. Nature 247, 573±577.
Dodge, R. E. and Vaisnys, J. R. (1977) Coral populations and growthpatterns: response to turbidity and sedimentation associated withdredging. Journal of Marine Research 35, 715±730.
Dodge, R. E. and Brass, G. W. (1984) Skeletal extension, density andcalci®cation of the reef coral, Montastrea annularis: St. Croix, USVirgin Islands. Bulletin of Marine Science 34, 288±307.
Dollar, S. (1994) Sewage discharge on coral reefs: not always pollution.Coral Reefs 13, 224.
Dubinsky, Z. and Jokiel, P. L. (1994) Ratio of energy and nutrient¯uxes regulates symbiosis between zooxanthellae and corals. Paci®cScience 48, 313±324.
Dunn, J. J. (1995) Application of nitrogen isotopes and other tracers ofanthropogenic input to modern reefs. M.Sc. thesis, McMasterUniversity, 108 pp. Hamilton, Ont., Canada.
Dustan, P. (1975) Growth and form in the reef-building coralMontastrea annularis. Marine Biology 33, 101±107.
Eakin, C. M., Feingold, J. S. and Glynn, P. W. (1993). Oil re®neryimpacts on coral reef communities in Aruba, N. A. In GlobalAspects of Coral Reefs: Health, Hazards and History, ed. R. N.Gibsburg, pp. 139±145. University of Miami.
Edinger, E. N. (1998). E�ects of land-based pollution on Indonesiancoral reefs: biodiversity, growth rates, bioerosion, and taphonomy,Ph.D. dissertation, 307 p. McMaster University, Hamilton,Canada.
Edinger, E. N. and Risk, M. J. (1997) Sponge borehole size as arelative measure of bioerosion and paleoproductivity. Lethaia 29,275±286.
Edinger, E. N. and Risk, M. J. (1998). Oceanography, sedimentology,and reef zonation of modern and ancient epeiric seas: the Java Sea,
423
Volume 40/Number 5/May 2000

Appalachian and Michigan Basins, 10 p. Abstract, Eighth Cana-dian Paleontology Conference.
Edinger, E. N., Jompa, J., Limmon, G. V., Widjatmoko, W. and Risk,M. J. (1998) Reef degradation and biodiversity in Indonesia: e�ectsof land-based pollution, destructive ®shing practices, and changesthrough time. Marine Pollution Bulletin 36, 617±630.
English, S., Wilkinson, C. and Bakert, V. (1994) Survey Manual forTropical Marine Resources, 368 p. Australian Institute of MarineScience.
Eustice, R. A., Land, L. S. and Lang, J. (1995) Nitrogen and carbonisotope ratios of marine organisms, Discovery Bay, Jamaica:Implications for nitrogen and carbon cycling. In Geological Societyof America Abstracts and Program, Annual Meeting, p. A-254.
Evans, S. M., Dawson, M., Day, J., Frid, C. L. J., Gill, M. E.,Pattisina, L. A. and Porter, J. (1995) Domestic waste and TBTpollution in coastal areas of Ambon Island (Eastern Indonesia).Marine Pollution Bulletin 30, 109±115.
Gardner, W. D. (1980) Field assessment of sediment traps. Journal ofMarine Research 38, 41±52.
Glynn, P. W. (1997) Bioerosion and coral reef growth: a dynamicbalance. In Life and Death of Coral Reefs, ed. C. Birkeland, pp. 69±95. Chapman & Hall, New York.
Gomez, E. D., Alino, P. M., Yap, H. T. and Licuanan, W. Y. (1994) Areview of the status of Philippine reefs.Marine Pollution Bulletin 29,62±68.
Guzman, H. M., Burns, K. A. and Jackson, J. B. C. (1994) Injury,regeneration and growth of Caribbean reef corals after a major oilspill in Panama. Marine Ecology Progress Series 105, 231±241.
Hallock, P. (1988) The role of nutrient availability in bioerosion:consequences to carbonate buildups. Paleogeography, Paleoclima-tology, Paleoecology 63, 389±398.
Hallock, P. and Schlager, W. (1986) Nutrient excess and the demise ofcoral reefs and carbonate platforms. Palaios 1, 389±398.
Heikoop, J. M. (1997) Environmental signals in coral tissue andskeleton: examples from the Caribbean and the Indo-Paci®c. Ph.D.dissertation, Geology, McMaster University, Hamilton, Ont.,Canada.
Heikoop, J. M., Risk, M. J., Lazier, A. V., Edinger, E. N., Jompa, J.,Limmon, G. V., Dunn, J. J., Browne, D. R. and Schwarcz, H. P. (inpress) Nitrogen-15 Signals of Anthropogenic Nutrient Loading inReef Corals. Marine Pollution Bulletin.
Highsmith, R. C. (1979) Coral growth rates and environmental controlof density banding. Journal of Experimental Marine Biology andEcology 37, 105±125.
Holmes, K. E. (1997) Eutrophication and its e�ects on bioerodingsponge communities. Proceedings of the Eighth International CoralReef Symposium 2, 1411±1416.
Holmes, K. E., Edinger, E. N., Limmon, G. V., Hariyadi and Risk, M.J. (in preparation). Bioeroding organism frequency in branchingcoral rubble: a non-destructive low-cost reef health indicator.Marine Ecology Progress Series.
Hodgson, G. (1997) Resource use: con¯icts and management solu-tions. In Life and Death of Coral Reefs, ed. C. Birkeland, pp. 386±410. Chapman & Hall, New York.
Hodgson, G. and Dixon, J. A. (1988) Logging versus ®sheries in thePhilippines. The Ecologist 19, 139±143.
Hubbard, D. K. (1997) Reefs as dynamic systems. In Life and Death ofCoral Reefs, ed. C. Birkeland, pp. 43±67. Chapman & Hall, NewYork.
Hubbard, D. K., Miller, A. I. and Scaturo, D. (1990) Production andcycling of calcium carbonate in a shelf-edge reef syste (St. Croix, USVirgin Islands): applications to the nature of reef systems in thefossil record. Journal of Sedimentary Petrology 60, 335±360.
Hudson, J. H. (1981) Growth rates of Montastrea annularis: a recordof environmental change in Key Largo Coral Reef MarineSanctuary, Florida. Bulletin of Marine Science 31, 444±459.
Huston, M. (1985) Variation in coral growth rates with depth atDiscovery Bay, Jamaica. Coral Reefs 4, 19±25.
Jamieson S. C., Erdmann M. V., Gibson G. R. and Potts, K. W.(1998). Development of biological criteria for coral reef ecosystemassessment. Atoll Research Bulletin, September 1998, No. 450, 102pp. Smithsonian Institution, Washington, DC.
Jompa, J. (1996) Monitoring and assessment of coral reefs inSpermonde archipelago, South Sulawesi, Indonesia. M.Sc. thesis,Biology, 81 pp. McMaster University, Hamilton, Ont..
Kamiludin, U., Wahib, A., Ermadi, Y., Hardjawidjaksana, K.,Wahyudi, Budiman and Hartono (1991) Coastal environmental
geology and nearshore water conditions, Jepara and surroundings,Central Java. Open ®le report # PPGL GI. 0.291. Institute ofMarine Geology, Bandung, Indonesia.
Land, L. S. (1979) The fate of reef-derived sediment on the northJamaican island slope. Marine Geology 29, 55±71.
Lapointe, B. E. (1997) Nutrient thresholds for bottom-up control ofmacroalgal blooms on coral reefs in Jamaica and southeast Florida.Limnology Oceanography 42, 1119±1131.
Larkum, A. W. D. and Koop, K. (1997) ENCORE, algal productivityand possible paradigm shifts. Proceedings of the Eighth InternationalCoral Reef Symposium 1, 881±884.
Lazier, A. V. (1997) Stable isotopes as indicators of coral reef stress.B.Sc. Thesis, Biology, pp. 38. McMaster University, Hamilton,Ont..
Lewis, J. B. (1977) Suspension feeding in Atlantic reef corals and theimportance of suspended particulate matter as a food source.Proceedings of the Third International Coral Reef Symposium 1,405±408.
Limmon, G. V. (1996) An assessment of coral reefs in Ambon,Indonesia. M.Sc. thesis, Geology, McMaster University, 80 pp.Hamilton, Ont., Canada.
Logan, A. Lang, L. Tomascik, T. (1994) Linear skeletal extension ratesin two species of Diploria from high-latitude reefs in Bermuda.Coral Reefs 13, 225±230.
Lough, J. M. and Barnes, D. J. (1992) Comparisons of skeletal densityvariations in Porites from the Central Great Barrier Reef. Journal ofExperimental Marine Biology and Ecology 155, 1±25.
Lough, J. M. and Barnes, D. J. (1997) Several centuries of variation inskeletal extension, density and calci®cation in massive Poritescolonies from the Great Barrier Reef: a proxy for seawatertemperature and a background of variability against which toidentify unnatural change. Journal of Experimental Marine Biologyand Ecology 211, 29±67.
McClanahan, T. M. (1997) Reef monitoring ± the state of our science.Reef Encounter 20, 9±11 March 1997.
McKenna, S. A. (1997) Interactions between the boring sponge, Clionalampa, and two hermatypic corals from Bermuda. Proceedings ofthe Eighth International Coral Reef Symposium 2, 1369±1374.
McManus, J. W. (1988) Coral reefs of the ASEAN region: status andmanagement. Ambio 17, 188±193.
Mendes, J. M., Risk, M. J., Schwarcz, H. P. and Woodley, J. D. (1997)Stable isotopes of nitrogen as measures of marine pollution: apreliminary assay of coral tissue from Jamaica. Proceedings of theEighth International Coral Reef Symposium 2, 1869±1872.
Moll, H. (1983) Zonation and diversity of scleractinia on reefs o� S.W.Sulawesi, Indonesia. Ph. D. dissertation, University of Leiden,O�setdrukkerij Kanters, 107 p. Amsterdam.
Muscatine, L. and Kaplan, I. R. (1994) Resource partitioning by reefcorals as determined from stable isotope composition: II. d15N ofzooxanthellae and animal tissue versus depth. Paci®c Science 48,304±312.
Muscatine, L., Porter, J. W. and Kaplan, I. R. (1989) Resourcepartitioning by reef corals as determined from stable isotopecomposition: I. d13C of zooxanthellae and animal tissue versusdepth. Marine Biology 100, 185±195.
Nixon, S. W. (1995) Coastal marine eutrophication: a de®nition, socialcauses, and future concerns. Ophelia 41, 199±219.
Paez-Osuna, F., Guerrero-Galvan, S. R. and Ruiz-Fernandez, A. C.(1998) The environmental impact of shrimp aquaculture and thecoastal pollution in Mexico. Marine Pollution Bulletin 36, 65±75.
Pandol®, J. M. and Greenstein, B. J. (1997) Taphonomic alteration ofreef corals: e�ects of reef environment and coral growth form. I: theGreat Barrier Reef. Palaios 12, 82±95.
Parsons, T. R., Maita, Y., and Lalli, C. M. (1984) A Manual ofChemical and Biological Methods for Seawater Analysis, 171 p.Pergamon, Toronto.
Pastorak, R. A. and Bilyard, G. R. (1985) E�ects of sewage pollutionon coral-reef communities. Marine Ecology Progress Series 21, 175±189.
Philips, M. J., Kwei Lin, C. and Beveridge, M. C. M. (1993) Shrimpculture and the environment: lessons from the worldÕs most rapidlyexpanding warmwater aquaculture sector. In Environment andAquaculture in Developing Countries, ed. R. S. V. Pullin, H.Rosenthal, J. L., MacLean, pp. 171±197. International Centre forLiving Aquatic Resources Management, Manila.
Priess, K., Thomassin, B. A., Heiss, G. A., Dullo, W-C. and Camoin,G. (1995) Variabilite de la croissance de Porites massifs dans les
424
Marine Pollution Bulletin
recifs coralliens de Mayotte. C. R. Acad. Sci. Paris, Sciences de lavie, Ecologie 318, 1147±1154.
Rasmussen, C. E., Cu�, C. and Hopley, D. (1992) Evidence ofanthropogenic disturbances retained in the skeleton of massivecorals from AustraliaÕs Great Barrier Reef. Proceedings of theSeventh International Coral Reef Symposium 1, 201±210.
Risk, M. J. and MacGeachy, J. K. (1978) Aspects of erosion of modernCaribbean reefs. Revista de Biologia Tropical 2, 85±105.
Risk, M. J. and Sammarco, P. W. (1991) Cross-shelf trends in skeletaldensity of the massive coral Porites lobata from the Great BarrierReef. Marine Ecology Progress Series 69, 195±200.
Risk, M. J., Dunn, J. J., Allison, W. R. and Horrill, C. (1993) Reefmonitoring in Maldives and Zanzibar: low-tech and high-techscience. In Global Aspects of Coral Reefs: Health, Hazards andHistory, ed. R. N. Gibsburg, pp. M36±M42. University of Miami.
Risk, M. J., Sammarco, P. W. and Schwarcz, H. P. (1994) Cross-continental shelf trends in d13C in coral on the Great Barrier Reef.Marine Ecology Progress Series 106, 121±130.
Rogers, C. S. (1990) Responses of coral reefs and reef organisms tosedimentation. Marine Ecology Progress Series 62, 185±202.
Rose, C. S. and Risk, M. J. (1985) Increase in Cliona delitrixinfestation of Montastrea cavernosa heads on an organicallypolluted portion of the Grand Cayman fringing reef. MarineEcology 6, 345±363.
Rosenberg, R. (1985) Coastal marine eutrophication ± the futuremarine coastal nuisance. Marine Pollution Bulletin 16, 227±231.
Sammarco, P. W. and Risk, M. J. (1990) Large-scale patterns ininternal bioerosion of Porites: cross-continental shelf trends in theGreat Barrier Reef. Marine Ecology Progress Series 59, 145±156.
Samamarco, P. W., Risk, M. J., Schwarcz, H. P. and Heikoop, J. M(1999) Cross continental shelf trends in coral d15N on the GreatBarrier Reef: further consideration of the reef nutrient paradox.Marine Ecology Progress Series 180, 131±138.
Schlager, W. (1981) The paradox of drowned reefs and carbonateplatforms. Geological Society of America Bulletin 92, 197±211.
Schlager, W. (1999) Scaling of sedimentation rates and drowning ofreefs and carbonate platforms. Geology 27, 183±186.
Sco�n, T. P (1986) Banding of coral skeletons from Pulau Seribu asrevealed by X-ray and U/V light values. In Human-Induced Damageto Coral Reefs, ed. B. E. Brown, UNESCO reports in MarineScience 40, 126±134.
Sco�n, T. P. (1997) Preservation and CaCO3 budget of reef-¯atcorals, Phuket, South Thailand. Proceedings of the Eighth Interna-tional Coral Reef Symposium 2, 1795±1800.
Sco�n, T. P., Stearn, C. W., Boucher, D., Frydl, P., Hawkins, C. M.,Hunter, I. G. and MacGeachy, J. K. (1980) Calcium carbonatebudget of a fringing reef on the west coast of Barbados. Part II:erosion, sediments, and internal structure. Bulletin of MarineScience 30, 475±480.
Sco�n, T. P., Tudhope, A. W. and Brown, B. E. (1989) Fluorescentand skeletal density banding in Porites lobata from Papua NewGuinea and Indonesia. Coral Reefs 7, 169±178.
Sco�n, T. P. Tudhope, A. W. Brown, B. E. Chansang, H. Cheeney, R.F. (1992) Patterns and possible environmental controls of skeleto-genesis of Porites lutea South Thailand. Coral Reefs 11, 1±11.
Scott, P. J. B. and Cope, M. (1986) Tolo revisited: a resurvey of coralsin Tolo Harbour and Channel six years and half a million peoplelater. In Proceedings of the Second International Marine BiologyWorkshop: the Marine Flora and Fauna of Hong Kong and SouthernChina, pp. 1203±1220.
Sherwood, O. A. (1999) Isotopic Smoke Signals and El NIno RelatedStress in Jave Sea Corals. B.Sc. thesis, Geology, McMasterUniversity, 54 p. Hamilton, Ontario, Canada.
Stearn, C. W., Sco�n, T. P. and Martindale, W. (1977) Calciumcarbonate budget of a fringing reef on the west coast of Barbados.Part I: zonation and productivity. Bulletin of Marine Science 27,479±510.
Steven, A. D. L. and Broadbent, A. D. (1997) Growth andmetabolic responses of Acropora palifera to long term nutrientenrichment. Proceedings of the International Coral Reef Sympo-sium 1, 867±872.
Te, F.T. (1997) Turbidity and its e�ect on corals: a model using theextinction coe�cient (K) of photosynthetic active radiance (PAR).Proceedings of the Eighth International Coral Reef Symposium 2,1899±1904.
Tomascik, T. and Sander, F. (1985) E�ect of eutrophication on reef-building corals, I. Growth rates of the reef-building coral Montast-raea annularis. Marine Biology 87, 143±155.
Tomascik, T. and Sander, F. (1987) E�ect of eutrophication on reef-building corals, II. Structure of scleractinian coral communities onfringing reefs, Barbados, West Indies. Marine Biology 94, 53±75.
Tomascik, T. Suharsono, and Mah, A. J. (1993) Case histories: ahistorical perspective of the natural and anthropogenic impacts inthe Indonesian archipelago with a focus on the Kepuluauan Seribu,Java Sea. In Global Aspects of Coral Reefs: Health, Hazards andHistory, ed. R. N. Gibsburg, pp. J 26±31. University of Miami.
Tomascik, T., Mah, A. J., Nontji, A., Moosa, M. K. (1997) Theecology of the Indonesian seas, 1752 p. Periplus, Hong Kong.
Umbgrove, J. H. F. (1947) Coral reefs of the East Indies. Bulletin of theGeological Society of America 58, 729±778.
Uneputty, P. A. and Evans, S. M. (1997) Accumulation of beach litteron Islands of the Pulau Seribu Archipelago, Indonesia. MarinePollution Bulletin 34, 652±655.
Van Woesik, R. (1992). Ecology of coral communities on continentalislands in the southern section of the Great Barrier Reef, Australia.Ph.D. Thesis, 227 p. James Cook University, Townsville, Australia.
Van Woesik, R. and Done, T. J. (1997) Coral communities and reefgrowth in the southern Great Barrier Reef. Coral Reefs 16, 103±115.
Vitousek, P. M., Aber, J. D., Howarth, R. W., Likens, G. E., Matson,P. A., Schinler, D. W., Schlesinger, W. H. and Tilman, D. G. (1997)Human alteration of the global nitrogen cycle: sources andconsequences. Ecological applications 7, 737±750.
Wittenberg, M. and Hunte, W. (1992) E�ects of eutrophication andsedimentation on juvenile corals, I. Abundance, mortality, andcommunity structure. Marine Biology 112, 131±138.
Yamamuro, M., Kayanne, H. and Minagawa, M. (1995) Carbon andnitrogen stable isotopes of primary producers in coral reefecosystems. Limnology Oceanography 40, 617±621.
Yap., H. T. (1996) Attempts at integrated coastal management in adeveloping country. Marine Pollution Bulletin 32, 588±591.
425
Volume 40/Number 5/May 2000