normal data tests with jump - frontier homepage...
TRANSCRIPT

Normal Data Tests with JUMP Steve Brainerd
1
Normal Data Tests• Question: How do I tell if my data is normally
distributed?• 1. Graphical Methods• Histogram• Normal probability plot• 2. Numeric Methods• Kurtosis and Skewness• 2a. Statistical tests for Goodness of Fit?• Jump uses Shapiro Wilks W • There are many others.

Normal Data Tests with JUMP Steve Brainerd
2
Normal Data Tests:2. Numeric Methods Kurtosis and Skewness

Normal Data Tests with JUMP Steve Brainerd
3
Normal Data Tests:2a. Numeric Methods Statistical tests for Goodness of Fit Jump uses Shapiro Wilks W
There are many others.
Normal Data Tests with JUMP Steve Brainerd
4
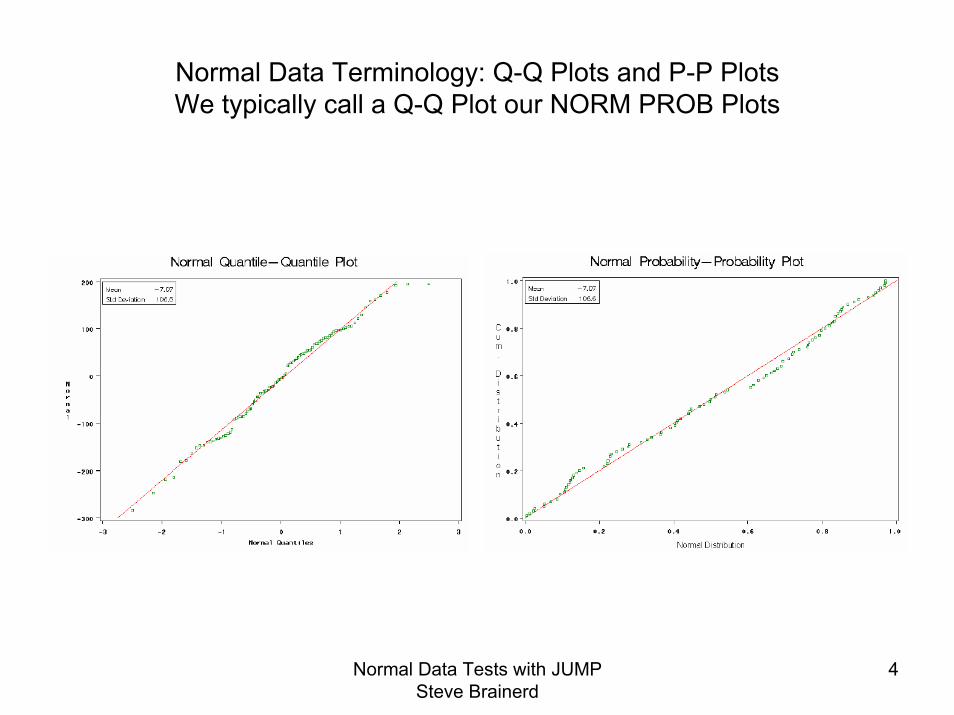
Normal Data Terminology: Q-Q Plots and P-P PlotsWe typically call a Q-Q Plot our NORM PROB Plots

Normal Data Tests with JUMP Steve Brainerd
5
Normal Data Tests with JUMPExample: Defect data analysis

Normal Data Tests with JUMP Steve Brainerd
6
Normal Data Tests with Jump
Normal Data Tests with JUMP Steve Brainerd
7
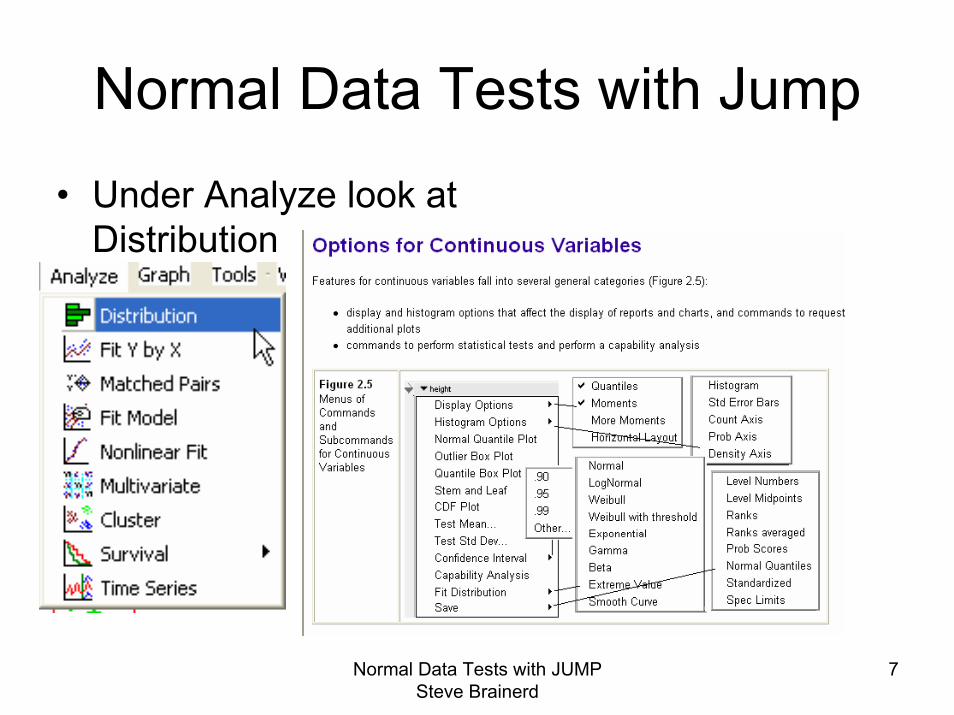
Normal Data Tests with Jump
• Under Analyze look at Distribution

Normal Data Tests with JUMP Steve Brainerd
8
Normal Data Tests with Jump
• Under Analyze look at Distribution

Normal Data Tests with JUMP Steve Brainerd
9
Normal Data Tests with Jump• Under Analyze look at Distribution

Normal Data Tests with JUMP Steve Brainerd
10
Normal Data Tests with Jump• Under Analyze look at Distribution Menu

Normal Data Tests with JUMP Steve Brainerd
11
Normal Data Tests with Jump• Under Analyze look at Distribution Menu Fit
Distribution: Normal

Normal Data Tests with JUMP Steve Brainerd
12
Normal Data Tests with Jump• Under Analyze look at Distribution Menu Fit
Distribution: Normal• Click on red triangle• Fitted Normal
Normal Data Tests with JUMP Steve Brainerd
13
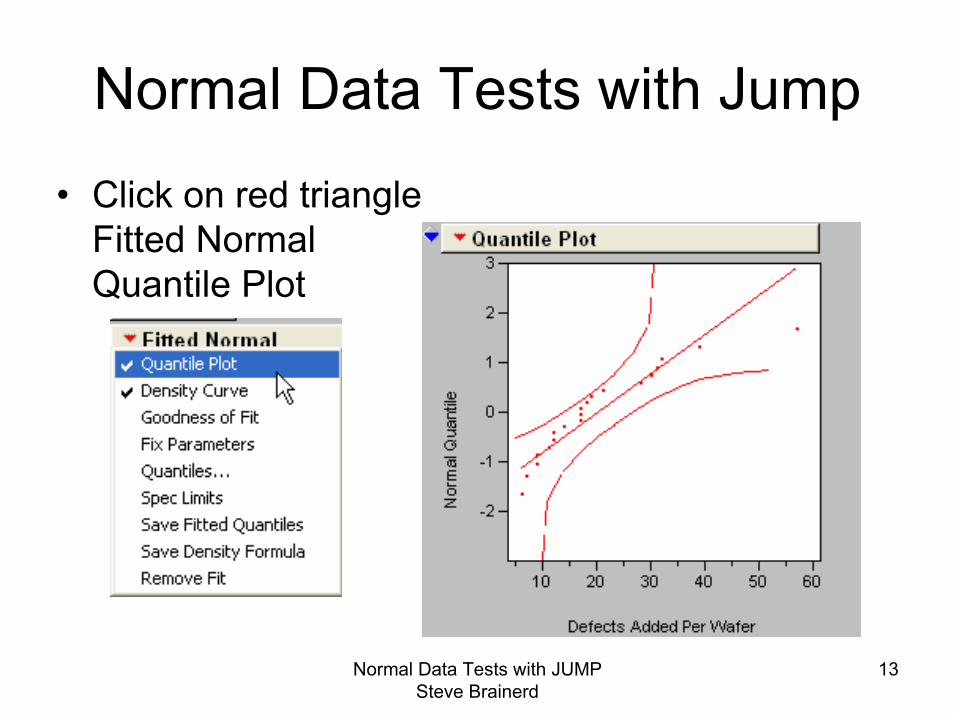
Normal Data Tests with Jump
• Click on red triangle Fitted Normal Quantile Plot

Normal Data Tests with JUMP Steve Brainerd
14
Normal Data Tests with Jump
• JUMP Distribution: Click on red triangle Fitted Normal Quantile Plot and then Goodness of Fit

Normal Data Tests with JUMP Steve Brainerd
15
Normal Data Tests with Jump
• Click on red triangle Quantile Plot and Fitted Normal Goodness of Fit
• SiN Bay19 1x4SiN wFlwr 1300A: Adders >0.2um
• Shapiro-Wilk W Test:• If Prob<W value greater than
0.05 data is reasonably normal

Normal Data Tests with JUMP Steve Brainerd
16
Normal Data Tests with Jump
• Click on red triangle Quantile Plot and Fitted Normal Goodness of Fit
• SiN 5AT ES1150:Adders >0.2

Normal Data Tests with JUMP Steve Brainerd
17
Normal Data Tests with Jump
• Click on red triangle Quantile Plot and Fitted Normal Goodness of Fit
• SiN 14A 420C 1300A: Adders >0.2um

Normal Data Tests with JUMP Steve Brainerd
18
Normal Data Tests with JumpExample 2: New data SEMs

Normal Data Tests with JUMP Steve Brainerd
19
Normal Data Tests with JumpShapiro-Wilk W test for Normal data
Example 2: New data SEMs : Data is reasonably normal

Normal Data Tests with JUMP Steve Brainerd
20
Normal Data Tests with JumpShapiro-Wilk W test for Normal data
Example 3 SiN Thickness DataNormal or Not so Normal?
Normal Probability Plot - Thin Nitride Measurements
-3
-2.5
-2
-1.5
-1
-0.5
0
0.5
1
1.5
2
2.5
3
410.00 420.00 430.00 440.00 450.00 460.00 470.00 480.00
Thickness A
NO
RM
SIN
V
UV 1050 SiN
OPTIPROBE 2600
99.9%
99.4%
97.7%
93.2%
84.1%
69.2%
50%
30.9%
15.9%
6.7%
2.3%
0.6%
0.1%

Normal Data Tests with JUMP Steve Brainerd
21
Normal Data Tests with JumpShapiro-Wilk W test for Normal data
Example 3 SiN Thickness Data :Outliers!

Normal Data Tests with JUMP Steve Brainerd
22
Normal Data Tests with JumpShapiro-Wilk W test for Normal data
Example 3 SiN Thickness Data :Outlier box Plot

Normal Data Tests with JUMP Steve Brainerd
23
Normal Data Tests with JumpShapiro-Wilk W test for Normal data
Example 3 SiN Thickness Data :Outlier box Plot

Normal Data Tests with JUMP Steve Brainerd
24
Normal Data Tests with JumpShapiro-Wilk W test for Normal data
Example 3 SiN Thickness Data : Eliminated Outliers!
OPTIPROBE 2600
UV1050

Normal Data Tests with JUMP Steve Brainerd
25
Normal Data Tests with JumpShapiro-Wilk W test for Normal data
Example 3 SiN Thickness Data :No Outliers!
OPTIPROBE 2600
UV1050

Normal Data Tests with JUMP Steve Brainerd
26
Normal Data Tests with JumpExample 3 SiN Thickness Data Capability: Optiprobe
Sorted data

Normal Data Tests with JUMP Steve Brainerd
27
Normal Data Tests with JumpShapiro-Wilk W test for Normal data
Example 4 SiN RI Data
Normal Probability Plot - Thin Nitride
-3
-2.5
-2-1.5
-1
-0.5
0
0.5
11.5
2
2.5
3
1.92 1.94 1.96 1.98 2.00 2.02 2.04 2.06 2.08
Refractive Index
NO
RM
SIN
V
RI UV1050
RI OPTIPROBE 2600
99.9%
99.4%
97.7%
93.2%
84.1%
69.2%
50%
30.9%
15.9%6.7%
2.3%
0.6%
0.1%

Normal Data Tests with JUMP Steve Brainerd
28
Normal Data Tests with JumpShapiro-Wilk W test for Normal data
Example 4 SiN RI Data Optiprobe 2600: only 3 values bined causes an issue!

Normal Data Tests with JUMP Steve Brainerd
29
Normal Data Tests with JumpShapiro-Wilk W test for Normal data
Example 4 SiN RI Data UV1050

Normal Data Tests with JUMP Steve Brainerd
30
Shapiro-Wilk Normal testreference: http://www.itl.nist.gov/div898/handbook/prc/section2/prc213.htm

Normal Data Tests with JUMP Steve Brainerd
31
Shapiro-Wilk Normal test