normal-mode-analysis-guided investigation of crucial
TRANSCRIPT

Normal-Mode-Analysis-Guided Investigation of Crucial Intersubunit Contacts in the cAMP-Dependent Gating in HCN Channels
Farzana Marni, Shengjun Wu, Gaurav M. Shah, Xin-ping Xu, Amber R. Hackett, Changan Xie, Sabisha Shrestha, Lin Liu, Qinglian Liu, and Lei Zhou
Department of Physiology and Biophysics, School of Medicine, Virginia Commonwealth University, Richmond, Virginia

1
21
21
N
1
222N
1
222
N
1,
k k
kj
kj
kj
k k
ki
ki
ki
k k
kj
ki
kj
ki
kj
ki
ji
ZYXZYX
ZZYYXX
C
Supplemental Methods
NMA based on all-atom (united) force field or anisotropic network model (ANM)
The PDB file for the mHCN2 CL-CNBD structure (PDB ID: 1Q5O) was cleaned
up by removing crystal water molecules and ions (23). Missing atoms and residues were
added by Modeller (63). Based on the GROMOS96 43a1 force field, the PDB2GMX
program from GROMACS package was used to generate the protein topology file (64).
The PRODRG server was used to generate the structure and topology files for cAMP
molecules (65). Partial charges for the atoms near the cyclic phosphate group in cAMP
were adjusted in reference to each atom’s local chemical environment, with the total
charge to be -1. For all-atom NMA, we maintained a 5Å layer of explicitly treated water
molecules on protein surface (66). To ensure the starting structure at a local energy
minimum, three energy minimization steps were sequentially applied at double numerical
precision: steepest descent (SD), conjugate gradient (CG), and limited-memory Broyden-
Fletcher-Goldfarb-Shanno (L-BFGS). The electrostatic energy was described by a switch
function with the distance for normal treatment set at 15Å and the cut-off distance set at
18Å (67). Programs of mdrun_d and g_nmeig_d were used to generate and diagonalize
the Hessian matrix, respectively. For ANM-based NMA, C- atom coordinates were
extracted from the energy minimized structure. The Anisotropic Network Model (ANM)
program was used with the unified force constant set as 1 kcal/mol/Å2 and the cutoff
distance set as 13Å (68).
After obtaining eigenvectors and corresponding eigenvalues of the Hessian
system, we used the following equation to calculate the normalized covariance factor
between each pair of atoms (i, j):
, where X, Y, Z represent projections in the eigenvector for each atom, k is the index for
eigenvector, ω is the corresponding eigenvalue, and N is the number of eigenvectors
involved in the calculation (9, 68). To better suit the goal of systematically surveying all
contacts, normalized covariance factor rather than the absolute value of covariance was

2
used. Normalized covariance factor is also called cross-correlation (16). For NMA based
on the all-atom force field (AANMA), the unit of eigenvalue is kJ/mol/nm2/amu
according to the GROMACS definition. The eigenvalue generated from ANM calculation
was converted to the Gromacs format by a factor of 32.2 (66).
MD simulation of the WT and mutant mHCN2 C-terminal proteins
A triclinic simulation box was generated around the protein molecule with a gap
of 10Å on three dimensions. Point mutations were introduced using Modeller. The
simulation box was filled with SPC216 water molecules. The whole system was
neutralized by exchanging solvent water molecules with either Na+ or Cl- ions. After
energy minimizations, a position-restrained MD simulation (500 ps) was used to relax
and equilibrate the whole simulation system before the standard MD simulation. The
following settings were applied: timestep, 2 fs; cut-off distance for short-range
neighboring list, 0.9 nm; cut-off distance for Coulomb interactions, 0.9 nm; long-range
electrostatics treatment, PME; cut-off distance for VDW interactions, 1.4 nm; constant
temperature, 300K by Berendsen coupling with a time constant of 0.1 ps; constant
pressure, 1 bar by Berendsen coupling with a time constant of 0.5 ps; bond constraint-
algorithm, Lincs.
Protein purification and biochemical binding assays
Construction of pSMT3-mHCN2C plasmid and protein purification of mHCN2
CL-CNBD fragment was described previously (42, 46). QuickChange Site-Directed
mutagenesis kit (Stratagene) was used to introduce point mutations. BL21 competent cell
was used for protein expression. Protein samples were purified through HisTrap column
(affinity chromatography), HiTrap Q and HiTrap S columns (ion exchange
chromatography), and HiLoad 16/60 Superdex 75 column (size exclusion
chromatography) (GE Healthcare). Finally protein samples were concentrated to >10
mg/ml in a buffer containing 5 mM MES-NaOH and 50 mM NaCl (pH 6.0).
Two equilibrium methods, isothermal titration calorimetry (ITC) and fluorescence
anisotropy (FA), were used to measure the cAMP binding affinity. For ITC experiments,
40 l of cAMP at 1.25 mM was sequentially injected into the sample cell containing the
protein sample at 75 M (iTC200 Microcalorimeter by Microcal). ITC experiments were
carried out at 37oC, because at 25oC the binding process involves both heat release and
3
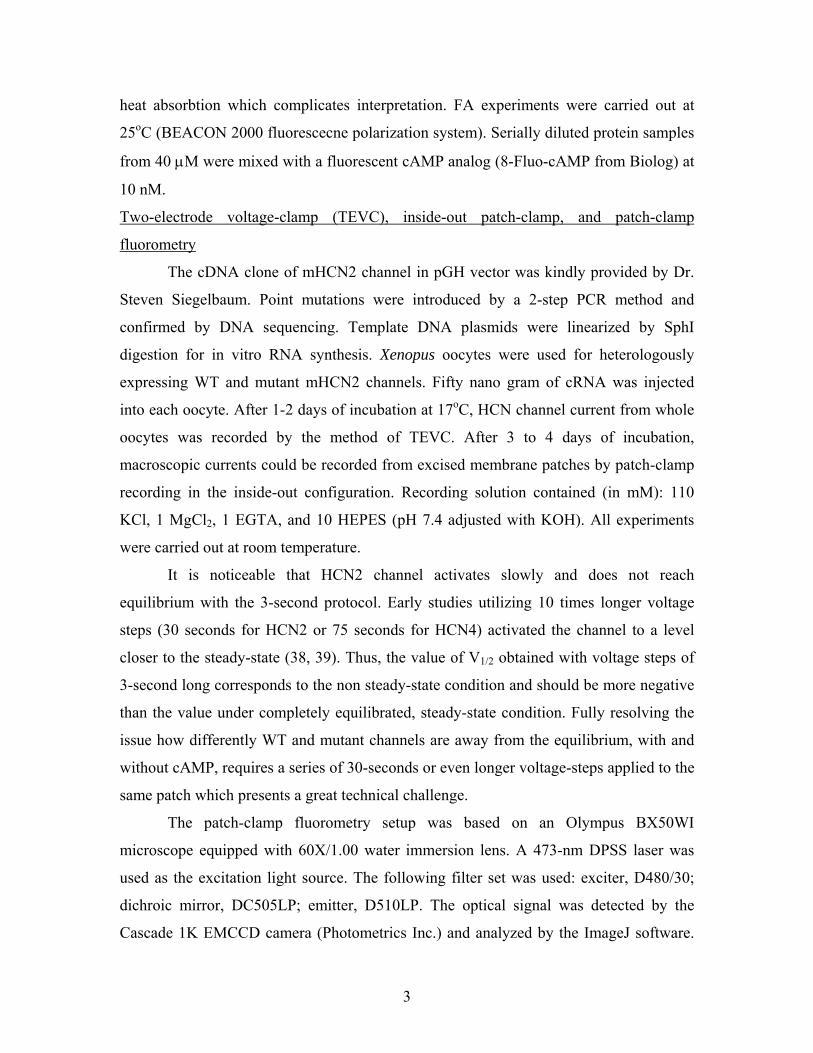
heat absorbtion which complicates interpretation. FA experiments were carried out at
25oC (BEACON 2000 fluorescecne polarization system). Serially diluted protein samples
from 40 M were mixed with a fluorescent cAMP analog (8-Fluo-cAMP from Biolog) at
10 nM.
Two-electrode voltage-clamp (TEVC), inside-out patch-clamp, and patch-clamp
fluorometry
The cDNA clone of mHCN2 channel in pGH vector was kindly provided by Dr.
Steven Siegelbaum. Point mutations were introduced by a 2-step PCR method and
confirmed by DNA sequencing. Template DNA plasmids were linearized by SphI
digestion for in vitro RNA synthesis. Xenopus oocytes were used for heterologously
expressing WT and mutant mHCN2 channels. Fifty nano gram of cRNA was injected
into each oocyte. After 1-2 days of incubation at 17oC, HCN channel current from whole
oocytes was recorded by the method of TEVC. After 3 to 4 days of incubation,
macroscopic currents could be recorded from excised membrane patches by patch-clamp
recording in the inside-out configuration. Recording solution contained (in mM): 110
KCl, 1 MgCl2, 1 EGTA, and 10 HEPES (pH 7.4 adjusted with KOH). All experiments
were carried out at room temperature.
It is noticeable that HCN2 channel activates slowly and does not reach
equilibrium with the 3-second protocol. Early studies utilizing 10 times longer voltage
steps (30 seconds for HCN2 or 75 seconds for HCN4) activated the channel to a level
closer to the steady-state (38, 39). Thus, the value of V1/2 obtained with voltage steps of
3-second long corresponds to the non steady-state condition and should be more negative
than the value under completely equilibrated, steady-state condition. Fully resolving the
issue how differently WT and mutant channels are away from the equilibrium, with and
without cAMP, requires a series of 30-seconds or even longer voltage-steps applied to the
same patch which presents a great technical challenge.
The patch-clamp fluorometry setup was based on an Olympus BX50WI
microscope equipped with 60X/1.00 water immersion lens. A 473-nm DPSS laser was
used as the excitation light source. The following filter set was used: exciter, D480/30;
dichroic mirror, DC505LP; emitter, D510LP. The optical signal was detected by the
Cascade 1K EMCCD camera (Photometrics Inc.) and analyzed by the ImageJ software.
4
TurboReg was used to align the stack of image series. A region of interest (ROI) was
selected surrounding the arc of the membrane patch in the recording pipette. F was
defined as the mean fluorescence intensity of the ROI with the background intensity
subtracted. F values collected along a single voltage step were normalized by the value
measured at -40 mV when most channels stay in closed state. Normalized F (F)
reflects the dynamic change in cAMP binding during channel activation. The fluorescent
cAMP analog, 8-NBD-cAMP, was obtained from Biolog.
Supplemental Figures
Figure S1 Covariance matrix based on different pools of eigenvectors.
ANM analysis and covariance matrix construction were processed the same as before.
(A) Covariance matrix based on the first five eigenvectors of the lowest vibration
frequencies. This plot is the same as shown in Fig. 1D.
(B) Covariance matrix based on the eigenvectors 6 – 10.
(C) Covariance matrix based on the eigenvectors 11 – 15.
Figure S2 Comparing the contact map of C- atoms and the NMA-based covariance
matrix.
(A) PROTMAP-2D was used to generate the contact map. The cut-off distance was
set as 8Å (http://genesilico.pl/protmap2d.htm). Notice that the results contain
only two values, 0 (no contact, black) and 1 (contact, white).
(B) Contact map generated with the cut-off distance set as 13Å, the same setting as
used in ANM analysis.
(C) Covariance matrix based on ANM analysis. Colors represent different values of
covariance factor: red (1 - 0.775), orange (0.775-0.55), yellow (0.55-0.325), and
green (0.325-0.1).
Figure S3 Location of K452 and R590 in the crystal structure of CL-CNBD.

5
(A) K452 is located in the A’-helix in C-linker. R590 is located in the loop between
P-helix and -7 in CNBD. Both residues are in direct contact with residues from
neighboring subunits but not with cAMP.
(B) A zoomed view over K452 and E494. The atomic distance between the NZ atom
of K452 and the CD atom of R590 is 5.8Å.
(C) A zoomed view over the R590 and E617. The atomic distance between the CZ
atom of R590 and the backbone carbonyl oxygen atom of E617 is 3.6Å. The
distance between the CZ atom of R590 and the CD atom of E617 is 5.0Å.
Figure S4. Further testing the salt bridge between K452 and E494 by charge
swapping.
(A) Representative TEVC traces of mHCN2/R591E and WT mHCN2 channels.
Because the R591E mutation abolished cAMP binding, the difference between
R591E and WT traces reflect the cAMP-dependent regulation of channel gating.
(B) TEVC traces of K452E mutant channel and K452E+E494R double mutant
channel.
(C) Summary of resting V1/2 values. The positive shift of about +11mV in V1/2
between R591E and WT channels reflects the contribution from the cAMP-
dependent gating. Independent t-test shows that the K452E channel is
significantly different from WT channel (p<0.001). The channel carrying double
point mutation K452E+E494R is not different from WT channel (p=0.31).

B-A B-B B-C
Subunit A Subunit B Subunit C
Subu
nit B
B-A B-B B-C
Subunit A Subunit B Subunit C
Subu
nit B
B-A B-B B-C
Subunit A Subunit B Subunit C
Subu
nit B
Fig. S1A ANM analysis (eigenvector 1 to 5)
B ANM analysis (eigenvector 6 to 10)
C ANM analysis (eigenvector 11 to 15)

B-A B-B B-C
Subunit A Subunit B Subunit C
Subu
nit B
Fig. S2A Contact map (cut-off 8Å)
B Contact map (cut-off 13Å)
C ANM analysis (cut-off 13Å)

Fig. S3A
B C
K452
K452 – E494
R590
R590 – E617

10
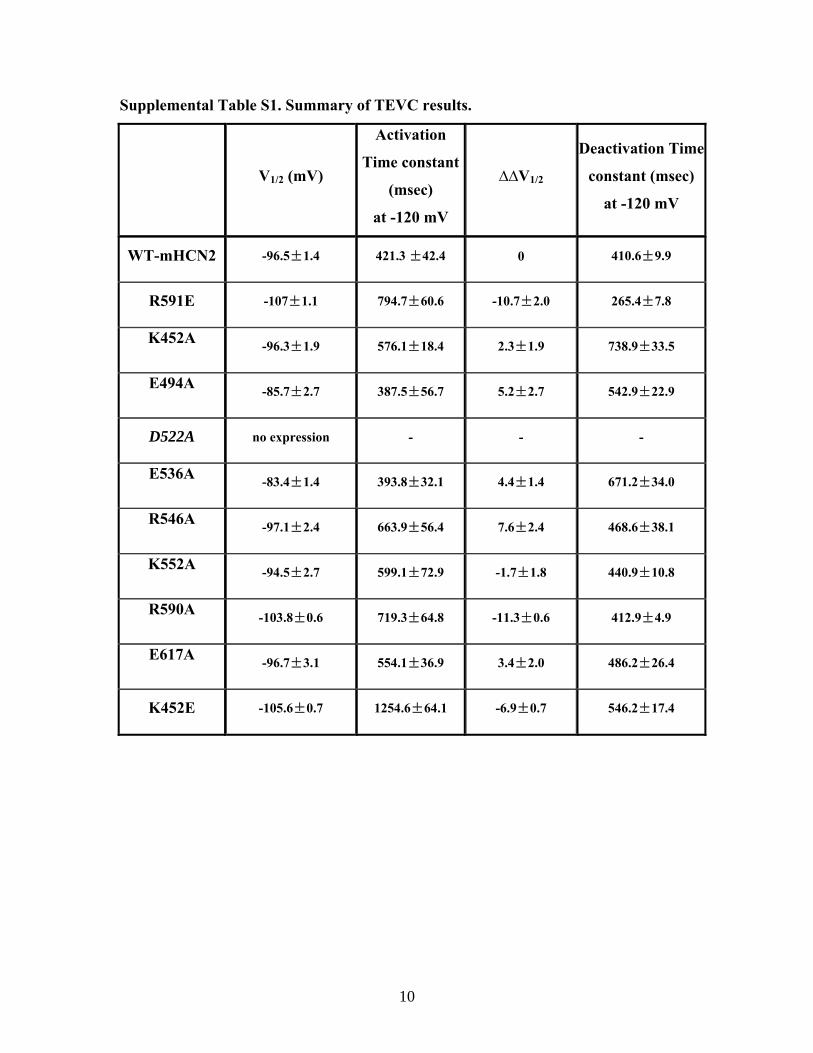
Supplemental Table S1. Summary of TEVC results.
V1/2 (mV)
Activation
Time constant
(msec)
at -120 mV
∆∆V1/2
Deactivation Time
constant (msec)
at -120 mV
WT-mHCN2 -96.5±1.4 421.3 ±42.4 0 410.6±9.9
R591E -107±1.1 794.7±60.6 -10.7±2.0 265.4±7.8
K452A -96.3±1.9 576.1±18.4 2.3±1.9 738.9±33.5
E494A -85.7±2.7 387.5±56.7 5.2±2.7 542.9±22.9
D522A no expression - - -
E536A -83.4±1.4 393.8±32.1 4.4±1.4 671.2±34.0
R546A -97.1±2.4 663.9±56.4 7.6±2.4 468.6±38.1
K552A -94.5±2.7 599.1±72.9 -1.7±1.8 440.9±10.8
R590A -103.8±0.6 719.3±64.8 -11.3±0.6 412.9±4.9
E617A -96.7±3.1 554.1±36.9 3.4±2.0 486.2±26.4
K452E -105.6±0.7 1254.6±64.1 -6.9±0.7 546.2±17.4

11
Supplemental Table S2. Summary of PCF results measured with a -150 mV
activation step.
Construct ∆∆F τactivation
(+150mV)
τdeactivation
(-40 mV)
Mean SE Mean
(sec) SE
Mean
(sec) SE
WT-mHCN2 0.66 0.05 2.80 0.33 1.01 0.23
K452A 0.58 0.05 2.58 0.16 1.18 0.31
E494A 0.19 0.03 3.17 0.91 1.13 0.14
D522A - - - - - -
E536A 0.31 0.05 4.72 1.64 1.06 0.26
R546A 0.60 0.09 7.08 5.27 0.82 0.15
K552A 0.64 0.08 3.30 0.46 0.84 0.15
R590A 0.18 0.05 1.72 0.65 0.55 0.09
E617A 0.10 0.03 3.17 1.63 1.75 0.47
K452E 0.12 0.03 0.44 0.02 1.68 0.29

12
References: 1. Zagotta, W. N., N. B. Olivier, K. D. Black, E. C. Young, R. Olson, and E. Gouaux.
2003. Structural basis for modulation and agonist specificity of HCN pacemaker channels. Nature 425:200-205.
2. Sali, A., L. Potterton, F. Yuan, H. van Vlijmen, and M. Karplus. 1995. Evaluation of comparative protein modeling by MODELLER. Proteins 23:318-326.
3. Lindahl, E., B. Hess, and D. van der Spoel. 2001. GROMACS 3.0: a package for molecular simulation and trajectory analysis. Journal of Molecular Modeling [online computer file] 7:306-317.
4. Schuttelkopf, A. W., and D. M. van Aalten. 2004. PRODRG: a tool for high-throughput crystallography of protein-ligand complexes. Acta Crystallogr D Biol Crystallogr 60:1355-1363.
5. Zhou, L., and S. A. Siegelbaum. 2008. Effects of surface water on protein dynamics studied by a novel coarse-grained normal mode approach. Biophys J 94:3461-3474.
6. van der Spoel, D., and P. J. van Maaren. 2006. The Origin of Layer Structure Artifacts in Simulations of Liquid Water. Journal of Chemical Theory and Computation 2:1-11.
7. Atilgan, A. R., S. R. Durell, R. L. Jernigan, M. C. Demirel, O. Keskin, and I. Bahar. 2001. Anisotropy of fluctuation dynamics of proteins with an elastic network model. Biophys J 80:505-515.
8. Van Wynsberghe, A. W., and Q. Cui. 2006. Interpreting correlated motions using normal mode analysis. Structure 14:1647-1653.
9. Ichiye, T., and M. Karplus. 1991. Collective motions in proteins: a covariance analysis of atomic fluctuations in molecular dynamics and normal mode simulations. Proteins 11:205-217.
10. Xu, X., Z. V. Vysotskaya, Q. Liu, and L. Zhou. 2010. Structural basis for the cAMP-dependent gating in the human HCN4 channel. J Biol Chem 285:37082-37091.
11. Wu, S., Z. V. Vysotskaya, X. Xu, C. Xie, Q. Liu, and L. Zhou. 2011. State-dependent cAMP binding to functioning HCN channels studied by patch-clamp fluorometry. Biophys J 100:1226-1232.
12. Seifert, R., A. Scholten, R. Gauss, A. Mincheva, P. Lichter, and U. B. Kaupp. 1999. Molecular characterization of a slowly gating human hyperpolarization-activated channel predominantly expressed in thalamus, heart, and testis. Proc Natl Acad Sci U S A 96:9391-9396.
13. Santoro, B., S. Chen, A. Luthi, P. Pavlidis, G. P. Shumyatsky, G. R. Tibbs, and S. A. Siegelbaum. 2000. Molecular and functional heterogeneity of hyperpolarization-activated pacemaker channels in the mouse CNS. J Neurosci 20:5264-5275.