normal values and chromium-induced changes in … · normal values and chromium-induced changes in...
TRANSCRIPT
NORMAL VALUES AND CHROMIUM-INDUCED CHANGES IN BLOOD
PHYSIOLOGY OF RAINBOW TROUT, SALMO GAIRDNERII
By
ROBERT HARRY SCHIFFMAN
A THESIS
Subm itted to the School fo r A dvanced G raduate S tudies of M ichigan State U niversity of A g r icu ltu re and A pplied
Science in p a r t ia l fu lfillm ent of the re q u ire m e n tsfo r the d eg ree of
DOCTOR OF PHILOSOPHY
D ep artm en t of Physio logy and P h arm aco log y
1957
ProQuest Number: 10008615
All rights reserved
INFORMATION TO ALL USERS The quality o f this reproduction is dependent upon the quality of the copy submitted.
In the unlikely event that the author did not send a complete manuscript and there are m issing pages, these will be noted. Also, if material had to be removed,
a note will indicate the deletion.
uestProQuest 10008615
Published by ProQuest LLC (2016). Copyright of the Dissertation is held by the Author.
All rights reserved.This work is protected against unauthorized copying under Title 17, United States Code
Microform Edition © ProQuest LLC.
ProQuest LLC.789 East Eisenhower Parkway
P.O. Box 1346 Ann Arbor, Ml 4 8 1 0 6 - 1346
A B S T R A C T
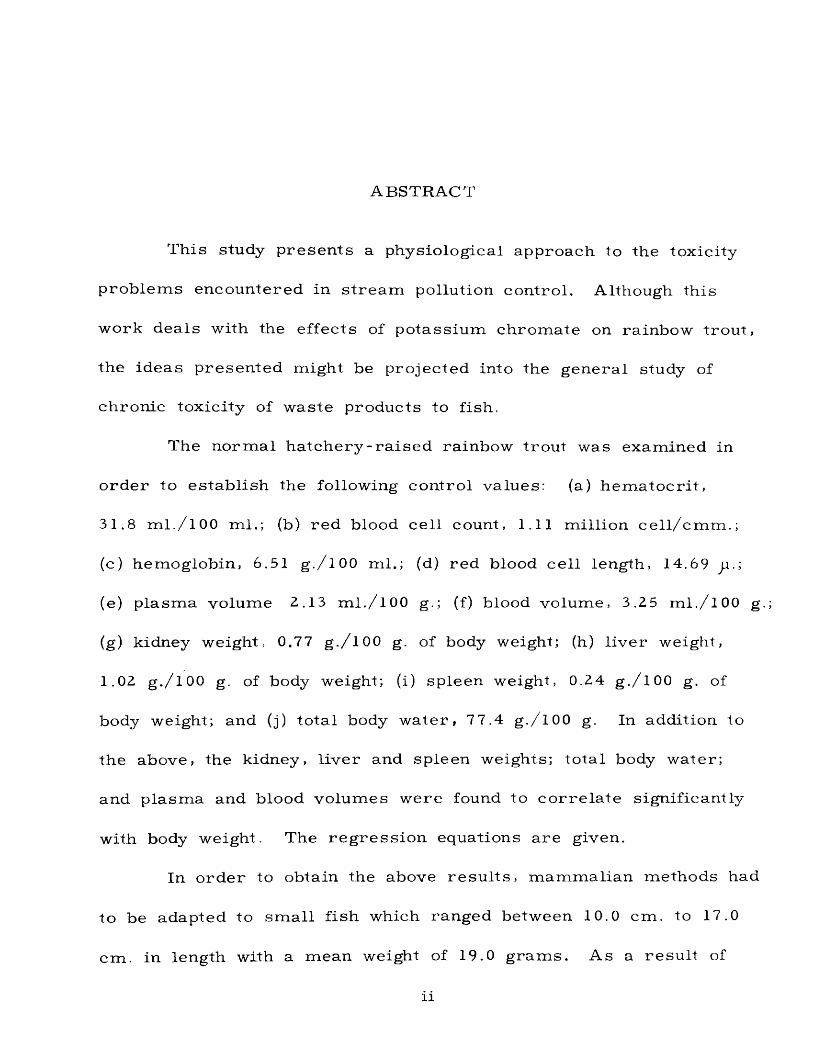
T his study p re s e n ts a physio logical app ro ach to the toxicity
p ro b le m s enco un te red in s t r e a m pollution con tro l. A lthough th is
w ork dea ls with the effects of po ta ss iu m ch ro m a te on ra inbow tro u t ,
the id e a s p re se n te d m ight be p ro jec ted into the g en e ra l study of
ch ron ic tox ic ity of w aste p roducts to fish .
The n o rm a l h a tc h e ry - r a i s e d rainbow tro u t was exam ined in
o r d e r to e s ta b l ish the following co n tro l va lues: (a) h e m a to c r i t ,
31.8 m l./lO O m l.; (b) r e d blood ce ll count, 1.11 m illion c e l l /c m m .;
(c) hem oglobin , 6.51 g./lOO ml.; (d) re d blood ce ll length, 14.69 p . ;
(e) p lasm a volum e 2.13 m l./lOO g.; (f) blood volum e, 3.25 ml./lOO g.
(g) kidney weight, 0.77 g./lOO g. of body weight; (h) l iv e r weight,
1.02 g./lOO g. of body weight; (i) sp leen weight, 0.24 g./lOO g. of
body weight; and (j) to ta l body w a te r , 7 7.4 g./lOO g. In addition to
the above, the k idney, l iv e r and sp leen weights; to ta l body w ater;
and p la sm a and blood vo lum es w ere found to c o r r e la te s ign ificantly
with body weight. The r e g r e s s io n equations a re given.
In o rd e r to obtain the above r e s u l t s , m am m alian m ethods had
to be adap ted to sm a l l f ish which ran g ed between 10.0 cm . to 17.0
cm . in length with a m ean weight of 19.0 g ra m s . A s a re s u l t of
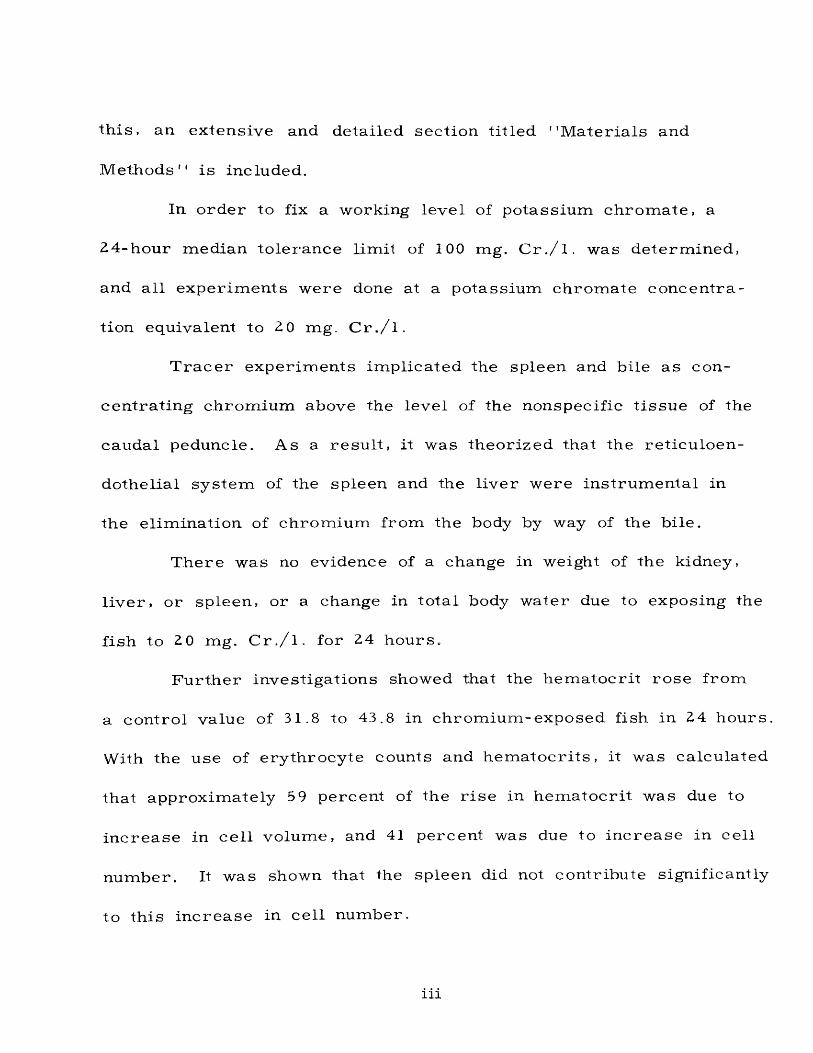
th i s , an ex tensive and d e ta iled sec tion t i t led ' 'M a te r ia ls and
M e th o d s" is included.
In o rd e r to fix a working leve l of p o ta ss iu m c h ro m a te , a
2 4 -h o u r m ed ian to le ra n c e lim it of 100 mg. C r . / l . was d e te rm in ed ,
and a l l e x p e r im en ts w ere done at a p o ta ss ium ch ro m a te c o n c e n tr a
tion equivalent to 2 0 mg. C r . / l .
T r a c e r ex p e r im en ts im p lica ted the sp leen and b ile a s con
c e n tra t in g ch ro m iu m above the level of the nonspecific t i s s u e of the
cauda l peduncle. As a r e s u l t , it was th e o r iz e d that the re t ic u lo e n
d o the lia l sy s te m of the sp leen and the l iv e r w ere in s tru m e n ta l in
the e lim ina tion of ch ro m iu m fro m the body by way of the b ile .
T h e re was no evidence of a change in weight of the kidney,
l iv e r , o r sp leen , or a change in to ta l body w ate r due to exposing the
f ish to 2 0 mg. C r . / l . for 24 h o u rs .
F u r th e r investiga tions showed tha t the h em a to c r i t ro s e f ro m
a co n tro l value of 31.8 to 43.8 in ch ro m iu m -ex p o sed fish in 2 4 h o u rs .
With the use of e ry th ro c y te counts and h e m a to c r i t s , it was ca lcu la ted
tha t ap p rox im ate ly 5 9 pe rcen t of the r i s e in h e m a to c r i t was due to
in c re a s e in c e l l vo lum e, and 41 pe rcen t was due to in c re a s e in ce ll
n um ber. It was shown tha t the sp leen did not con tribu te s ignifican tly
to th is in c re a s e in ce l l num ber.
When the h e m a to c r i t r i s e s , th e re m u st be an in c re a s e d blood
vo lum e a n d /o r d e c re a s e in p la sm a volum e. N e ith e r of th e se events
could be shown to take place under the ex p e r im en ta l conditions.
Due to the fact that po ta ss iu m ch ro m a te con ta ins a c o n s id
e ra b le am ount of p o ta ss iu m ions , the influence of th is ion was in
v es tig a ted . It was a s su m e d on the b a s is of the ex p e r im en ta l data
tha t the p o ta ss iu m ion, in addition to the ch ro m iu m , is a po ten tia l
in fluence upon the r e s u l t s obtained at po ta ss iu m ch ro m a te c o n c e n tra
tions equivalent to 2 0 mg. C r . / l .
A ssu m in g the r i s e in h e m a to c r i t was an index of chron ic
tox ic ity , it was d e te rm in ed tha t the h e m a to c r i t ro s e to i ts g re a te s t
d eg ree a t co n cen tra tio n s equivalent to between 2 mg. to 4 mg. C r . / l .
T h is fac t was of in te r e s t b ecause , although the 2 4 -h ou r T im , a
s ta n d a rd index of tox ic ity , was 100 mg. C r . / l . ; the above data in d i
ca te d physio log ical changes take p lace at a fa r low er concen tra tion .
With the use of sp lenec to m ized f ish , it was found that the
sp leen h as a tendency to a c t , in a l im ited capac ity , a s a buffer
m e ch an ism aga in s t sudden hem oconcen tra tion . This was ev idenced
by a s ign ifican t r i s e in h e m a to c r i t of sp len ec to m ized fish in tap
w a te r when exposed to ten m inu tes of opera tive and an es th e tic s t r e s s .
AC KNOWLE DG ME NT S
The w r i te r w ishes to e x p re s s h is g ra ti tu d e to D r. P au l O.
F ro m m , D ep artm en t of Physio logy and P harm aco log y , M ichigan State
U n iv e rs ity , fo r h is generous offering of la b o ra to ry fa c i l i t ie s and
con tinual guidance throughout th is study. The w r i te r would a lso
like to e x p re s s h is s in c e re ap p rec ia t io n to the State of M ichigan
D ep ar tm en t of C o n se rv a tio n fo r i ts constan t supply of fish throughout
a l l the sea so n s of the y e a r .
v
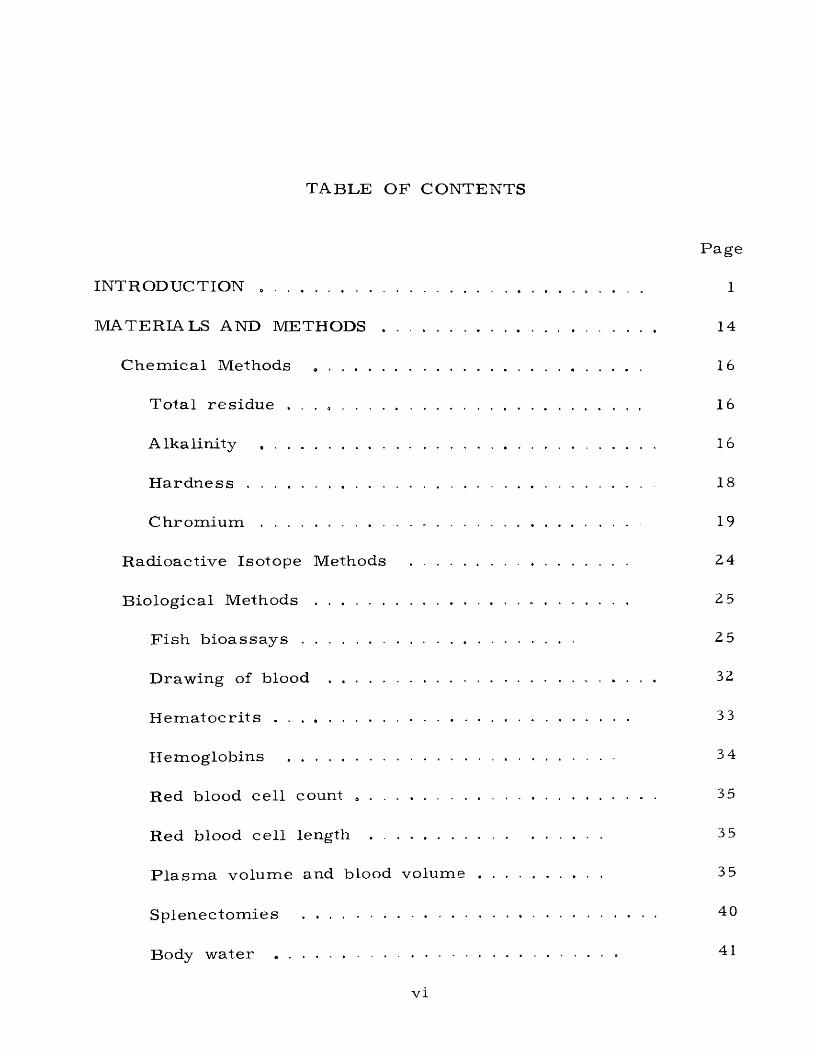
T A B L E O F C O N T E N T S
P a g e
INTRODUCTION .................................................................................... . . . . 1
MATERIALS AND M E T H O D S .......................................................................... 14
C h em ica l M ethods ..................................................................................... 16
T o ta l re s id u e . . . ................................................................................. 16
A lkalin ity ................................................................................. 16
H a r d n e s s ............................................................................................................ 18
C h r o m i u m ................................................................................................... 19
R ad ioactive Isotope M ethods ............................. 24
B io log ical M ethods ......................... 25
F ish b i o a s s a y s .......................................................................... 2 5
D rawing of blood ........................................................................................ 32
H e m a t o c r i t s ................................................................................................ 33
H em oglobins ......................................................................................... 3 4
Red blood ce l l count ................................. 35
Red blood ce l l length ............................................. 35
P la s m a volum e and blood v o l u m e ................................. 3 5
S p lenec tom ies ............................................................................................... 40
Body w a te r ......................................................................................... .... 41
v i
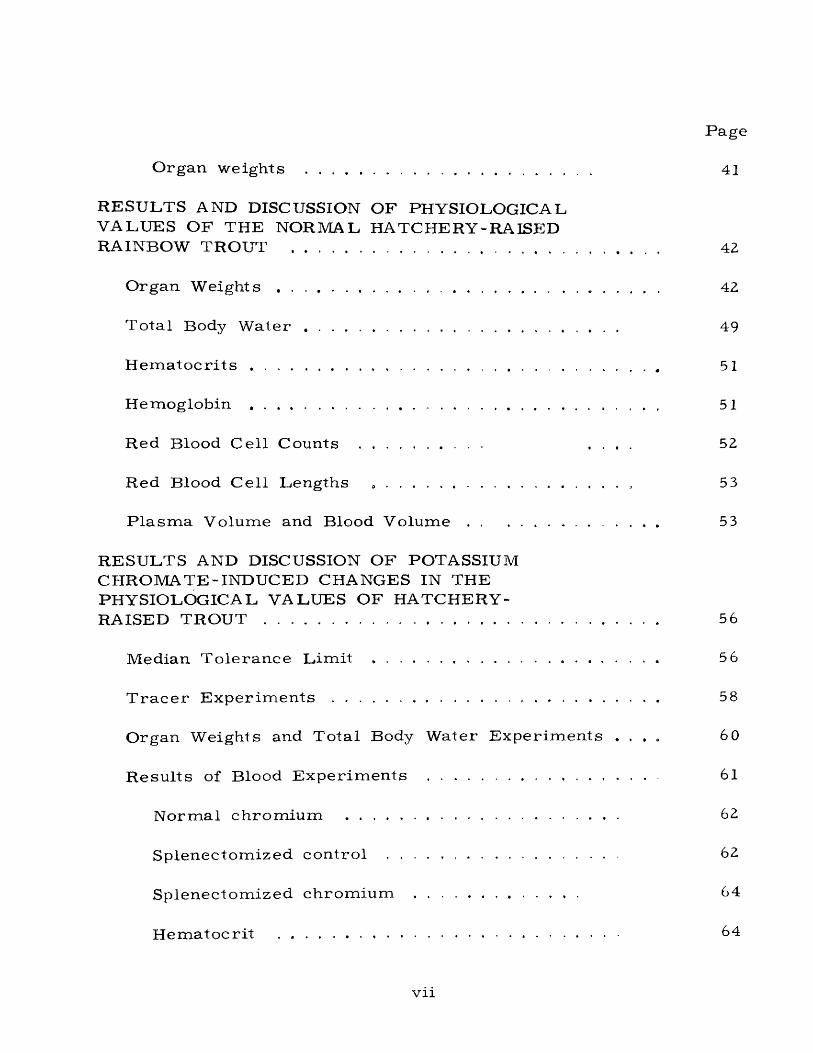
Page
O rgan w eights .............................................................................. 41
RESULTS AND DISCUSSION OF PHYSIOLOGICALVALUES OF THE NORMAL HATCHERY-RAISEDRAINBOW TROUT .................................................................................................... 42
O rgan W e i g h t s ..................................................................................... 42
T o ta l Body W ater ...................................................................... 49
H e m a to c r i ts ............................. 51
H em oglobin ............................................ 51
Red Blood C e ll Counts ................................. . . . . 52
Red Blood C e ll Lengths .................................................................. 53
P la s m a Volume and Blood V o l u m e .................................................... 53
RESULTS AND DISCUSSION OF POTASSIUMCHROMATE-INDUCED CHANGES IN THEPHYSIOLOGICAL VALUES OF HATCHERY-RAISED T R O U T ........................................................................................................... 56
M edian T o le ran ce L im it .......................................................................... 5 6
T r a c e r E x p e r im e n ts ..................................................................................... 58
O rgan W eights and T o ta l Body W ater E x p e r im en ts . . . . 60
R esu lts of Blood E x p e r im e n ts ........................................................... 61
N orm al ch ro m iu m .......................................................................... 62
S p lenec tom ized con tro l ............................................ 62
S p lenec tom ized ch ro m iu m ............................. 64
H e m a to c r i t ............................................................................................. 64
v i i
Page
H em oglobin ..............................................’ ...................................................... 64
R ed blood c e l l c o u n t ............................................................................. . 67
Red blood c e l l length ....................................................................... 67
P la s m a volum e and blood v o l u m e ............................................. 67
D iscu ss io n of the In c re a s e in H em ato c r i t . 67
D iscu ss io n of the C au ses of the R ed C e llVolume Change ..............................................................................................., 69
D isc u ss io n of the Role of the Spleen in the In c re a s ein C e ll N um ber under P o ta s s iu m C h ro m ate S t r e s s . . . . 70
D iscu ss io n of the P a r t P lay ed by the P o ta s s iu mIon in P o ta s s iu m C h ro m a te Toxicity « ............. .... .......................... 71
The H e m a to c r i t a s an Index of Toxicity . , . . , 74
Spleen Function ......................................................................................................... 77
CONC L U S IO N S ........................................................................................................................ 80
B IB L IO G R A P H Y .................................................................................................................... 83
A PPEND IX L REVIEW O F TOXICITY LITERATURE . . . . 88
A PPEND IX I I ........................................................................................................................... 95
P a r t A. D ata f ro m N orm al T rou t ................................. 96
P a r t B. Data f ro m C h ro m iu m -E x p o sed andS p lenec tom ized T ro u t ............................................................................... 107
v i i i
L IS T O F T A B L E S
T A B L E P a g e
1. A B r ie f S um m ary of the Toxicity L i te r a tu re . . . . 6
2. P h y s io lo g ica l R eac tio ns of the F ish to theSalt Solution ............................................................................................. 9
3. The R ela tionsh ip of the T h ree Types ofA lka lin ity to the T o ta l and PhenolphthaleinA lkalin ity ............................................................................................ . 18
4. R esu lts of T e s ts to D e te rm in e the A ccuracyof the C h ro m iu m M e t h o d ............................................................... 23
5. M eans and S tandard D eviations of T e s ts toD e te rm in e the A ccu racy of the C hrom iumM ethod ............................................................................................................ 23
6. R esu lts of T e s ts to D e te rm in e W hetherF i l t r a t io n o r A e ra tio n Had an Effect onthe C h ro m iu m C o n c e n t r a t i o n .................................................... 2 9
7. R esu lts of T e s t s to D e te rm in e W hetherF i l t r a t io n o r A e ra t io n Had an Effect onA lkalin ity .............................................................................................. 3 0
8. A v erag e P e rc e n ta g e of T o ta l Weight of StableT is s u e s C on tr ibu ted by E ach T issu e D is se c tedf ro m Individual of E ight Species of F is h f ro mWnite Oak L a k e ...................................................................................... 48
9. R e su l ts of T r a c e r E x p e r im en ts .............................................. 5 9
10. R e su l ts of Blood E x p e r im e n ts .................................................. 63
11. R esu lts of P o ta s s iu m C h lo rid e E x p e r im en ts . . . . 73
i x
T A B L E P a g e
12. The M ean H e m a to c r i ts of F ish Exposed to V ario u s C o n cen tra tio n s of P o ta s s iu mC h ro m a te .................................................................................................... 7 6
13. R esu lts of E x p e r im en ts P e r fo rm e d toInvestiga te Spleen Function ................................. 78
14. P h ys io lo g ica l V alues of the N orm al H a tc h e ry -R a is e d Rainbow T r o u t ............................................ 8 0
x
L IS T O F F I G U R E S
F IG U R E P a g e
1. E x p e r im e n ta l aq u a r ia in constan tte m p e ra tu re roo m .............................................................................. 15
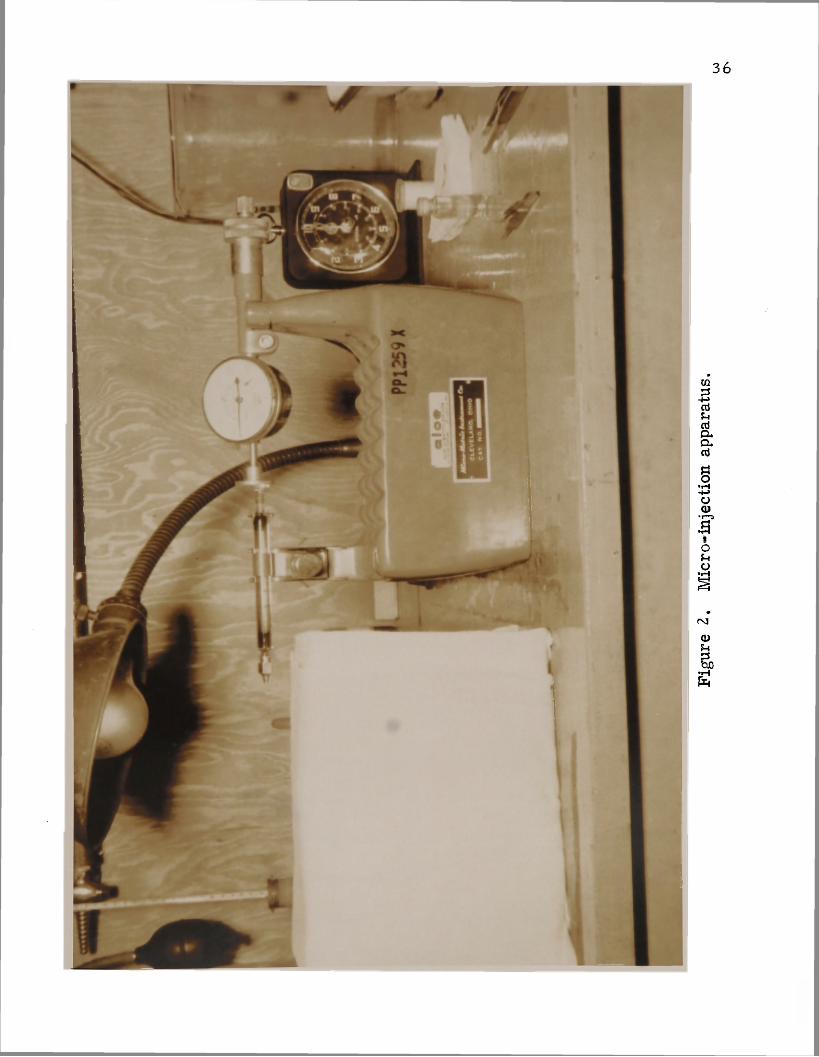
2. M ic ro - in jec tio n ap p a ra tu s ............................... 36
3. A r t i f ic ia l r e s p i ra t io n ap p a ra tu s .............................................. 3 8
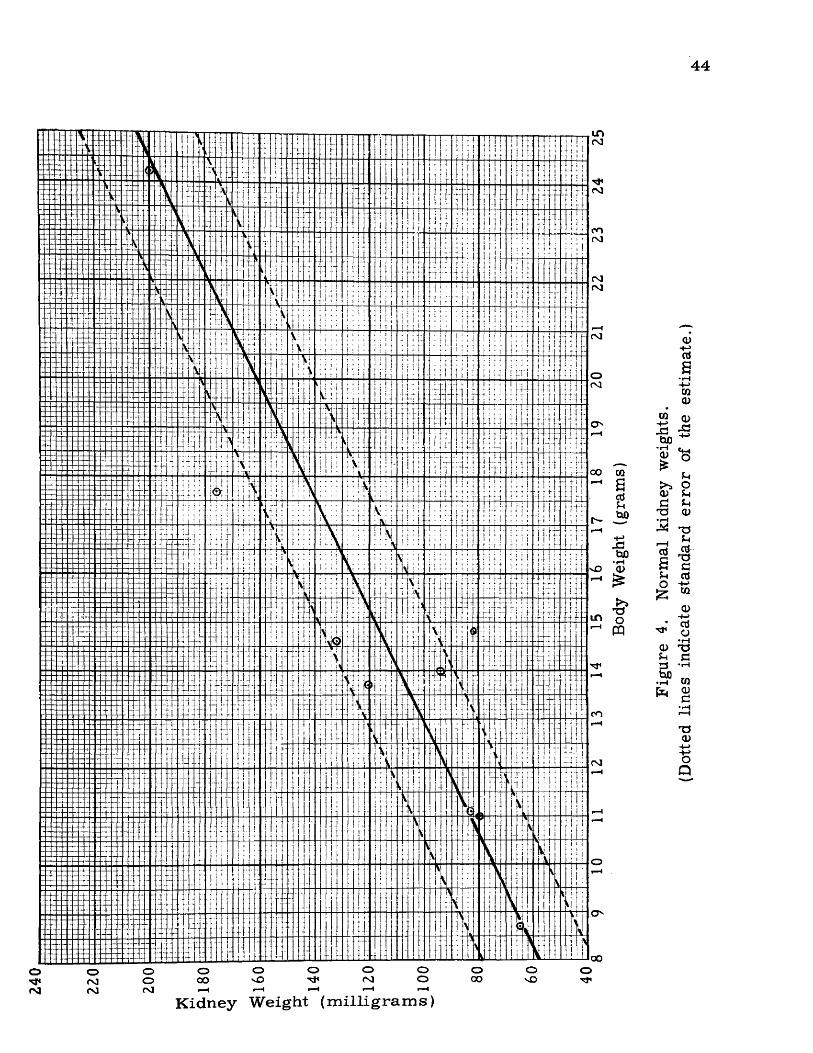
4. N o rm a l kidney weights ..................................................................... 44
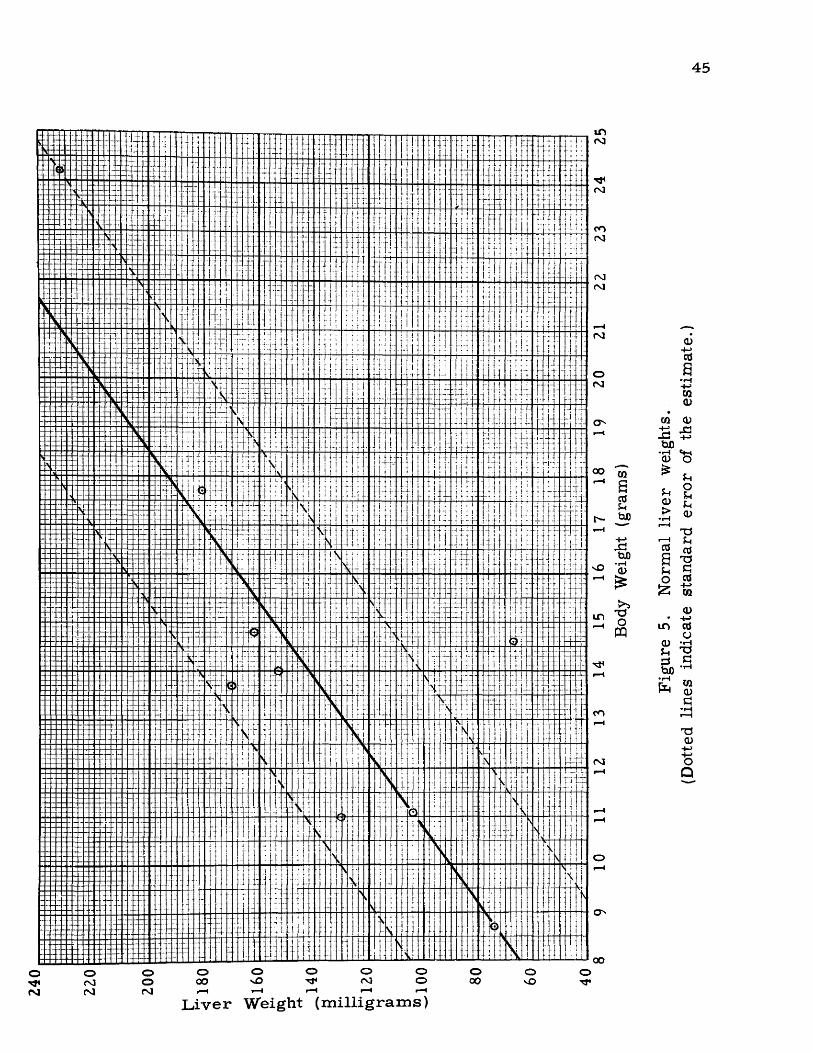
5. N o rm a l l iv e r weights * .................................................................... 45
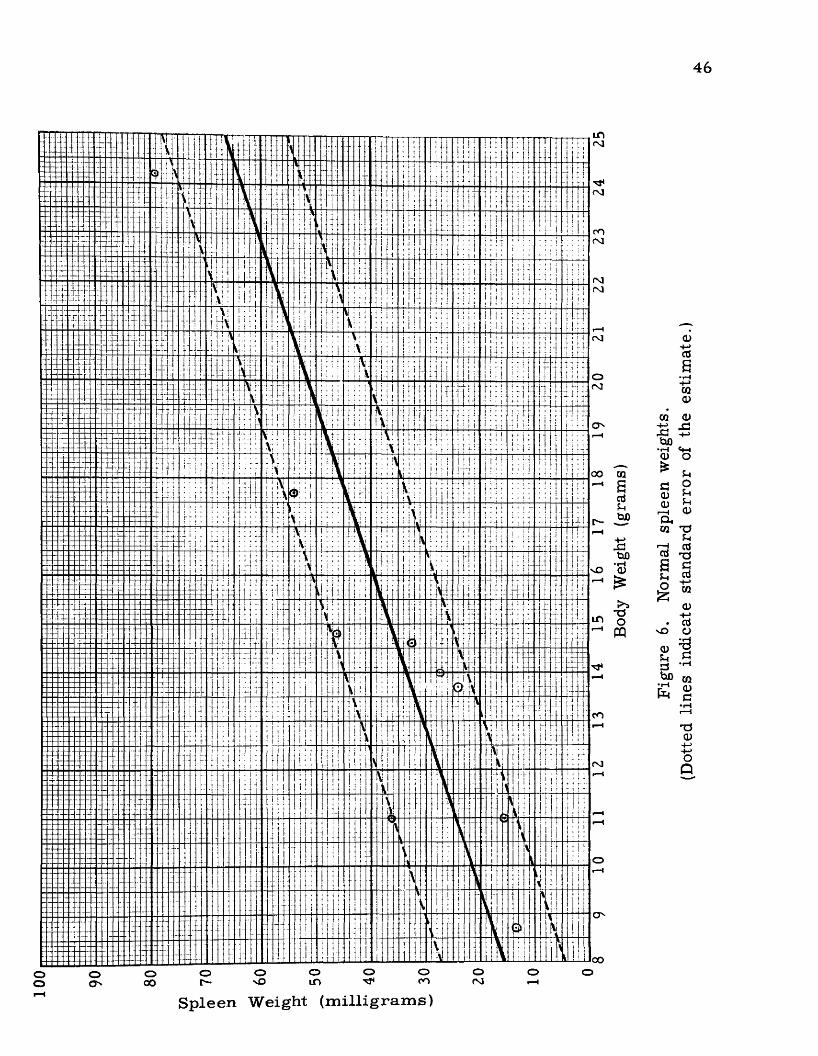
6. N o rm al sp leen w eights .......................................... 46
7. Body weight plotted aga in s t body w a t e r ............................ 5 0
8. E s t im a t io n of 2 4 hour m edian to le ran celim it by s t ra ig h t- l in e g rap h ica l in te rpo la tio n . . . . 57
9. C o m p ariso n of p lasm a vo lum es ............................... 65
10. C o m p ariso n of to ta l blood volum es ................................... 66
11. In c re a se in h em a to c r i t in re la tio n top o ta ss iu m ch ro m a te con cen tra tio n .................. 75
x i
I N T R O D U C T I O N
The p ro b lem of s t r e a m and lake pollution co n tro l i s a d iv e rse
one touching upon m any face ts of the b io log ical and physica l sc ie n c e s .
The p rev a i l in g d isc ip line is a im ed at the de tec tion of pollution a l
re a d y in the w a te rs with co n tro l com ing a f te r legal p roceed ings . A s
w a te r r e s o u r c e s becom e u ti l ized to th e i r fu lles t extent by m u n ic i
p a l i t ie s and in d u s tr ie s a s well a s fo r th e i r r e c re a t io n a l and es the tic
v a lu e s , the a ttitude is changing rap id ly to one of co n tro l b e fo re
pollution o c c u rs . This a sp ec t of co n tro l b r in g s fo rth many new
ques tions such a s , ''How m uch of a w aste can be d isc h a rg e d into a
p a r t ic u la r s t r e a m b efo re it will ad v e rse ly affect the aquatic life ? ' '
T h is is a question in d u s try is ask ing the reg u la to ry agency m o re
and m ore ; the an sw er to which, if slightly wrong, can cau se e i th e r
lo s s in value of a s t r e a m o r a v e ry r e a l m one tary lo ss to the
ind us try .
C ontem plation upon th is question will r e v e a l th re e in te ra c t in g
v a r ia b le s . The w aste , the s t r e a m , and the fo rm of aquatic life ,
each of which m u st be given con s idera tion . F i r s t the w aste:
Ignoring the pure ly ch em ica l d ilem m a which a r i s e s f rom an a t tem p t
to d e te rm in e i t s ionic and m o lecu la r con s ti tuen ts and focusing
1

2
a tten tion on i ts b io log ica l im p lic a tio n s , we find that v a r ia t io n in
t e r m s of co n ce n tra tio n is fu r th e r com plica ted by the an tagon is tic
and sy n e rg is t ic ac tion of v a r io u s m e ta ll ic ca tions . It has long been
known tha t the tox ic ity of som e m e ta l ca tions to aquatic o rg a n ism s
is co u n te rac ted , o r an tagonized , by o th e r m e ta l ca tions in m ixed
sa lt so lu tions (Heilbrunn, 1938). An exce llen t exam ple of th is is
R in g e r 's so lu tion in which the sod ium , ca lc ium , and p o ta ss iu m ions
a r e ba lanced in such p ro po rtio ns tha t the specific toxicity of each is
n eu tra l iz e d .
Loeb and W asteneys (1911, 1915) re p o r te d som e of the e a r ly
s tud ie s of an tagon ism of the p rinc ip le ca tions of sea w ate r re la t in g
to fish . G a r re y (1916) followed im m ed ia te ly with h is w ork on the
a v e ra g e longevity of minnows of the genus N otropis in v a r io u s m ix
tu r e s of sodium , p o ta ss iu m , ca lc iu m , and m agnesium ch lo r id e s in
d is t i l le d w a te r . He found tha t m innows in 9,000 mg. N aC l/ l . would
live two d ays , but the addition of the sodium ch lo ride to 0.001 M.
ca lc iu m ch lo rid e o r m o re , pro longed the pe riod to eight to ten
days. In tu rn , he found the ca lc iu m ion to be an tag on is tic to p o ta s
s ium and m agnesium . A high co n cen tra tion of sodium ch lo ride
co u n te rac ted the tox ic ity of ca lc ium ch lo ride and p o ta ss iu m ch lo rid e ,
and m ag n es iu m ch lo rid e was an tagon is tic to po ta ss iu m ch lo ride .
3
O th er w o rk e rs (P o w ers , 1921; K ru g e r , 1928; G uey lard , 1923,
1924; R a m u lt , 1928a 1928b; Young, 1938) in vestig a ted the tox ic ity
re la t io n s h ip s of these ions upon s t ic k le b a c k s , m innow s, and o ther
sp e c ie s including sa lm o n eggs and found the sam e o v e r - a l l r e s u l t s .
In addition , E l l i s (1937) showed that sodium n i t r a te d e c re a se d
the tox ic ity of cup ric su lfa te and the com bination of sodium n i t ra te
and ca lc iu m ch lo rid e was even m o re an tagon is tic . Much work has
b een done on an tagon ism (E llis and L ad n e r , 1935; Jo n es , 1938), but
in re a l i ty it i s not g rea t ly con ce rned with the p rob lem at hand and
th u s , it is c o n s id e re d only b r ie f ly h e re .
S y n erg ism betw een v a r io u s ca tions likew ise has been shown
to ex is t . Bandt (1946) d em o n s tra ted that m ix tu re s of the su lfa tes of
n ickel and zinc , copper and zinc, and of copper and cadm ium w ere
up to five t im e s m o re toxic than they would have been if the toxic
effect of the m e ta ls w ere sim ply additive , Doudoroff (1952) su b
s tan t ia te d the evidence on the sy n e rg is t ic ac tion between copper and
zinc.
We can p ro jec t the ideas b rought out in th is b r ie f d iscu ss io n
of the in te ra c t io n s of the com ponent p a r ts of the w aste and see tha t
the s t r e a m w a te r i t s e l f i s a v a r ia b le in any co n s id e ra tio n of tox ic ity
le v e ls . C a lc iu m , fo r exam ple , i s an im p o rtan t ion in n a tu ra lly
o c c u r r in g w a te rs ; i t s p re se n c e in la rg e and sm a ll d e g re e s depends
4
upon the geo log ical fo rm a tio n of the w a te rsh ed . It co n tr ib u te s
la rg e ly to the h a rd n e s s of the w a te r , which in tu rn is d irec tly r e
la ted to the a lka lin i ty , each being im p o r tan t to the potency of a
w as te . In addition , the pH, o ther ion sp e c ie s , suspended so lid s ,
d is so lv ed g a s e s , and , if the s t r e a m is ex tensively u ti l ized by in
d u s try , w aste p rod uc ts d isch a rg e d u p s tre a m con tribu te to the c o m
plexity of d isp o sa l p ro b lem s .
Not the le a s t to be co n s id e re d in toxicity p ro b lem s is the
am azing ly com plex biodynam ic cycle o ccu rr in g within the w ate r
i ts e lf . I ts in te r re la t io n s h ip s cau se potom olog is ts to co m p are a
s t r e a m to a living o rg an ism . W ater, a m ost im p ortan t
susta in ing fa c to r of life , holds confined within i t s n a tu ra l b as in s
m any f lo r i s t ic and faun is tic phyla. The sp o r tsm a n , an in fluentia l
f a c to r in s t r e a m co n tro l , th inks in te r m s of fish production , while
the aquatic b io log is t m ust co n s id e r the v a s t in te r digit a ting food
cha in which eco lo g is ts t e rm the "food w e b ." E ven though fish m ay
live th rough som e ca ta s tro p h ic changes in th e ir env iron m en t, the
d e lica te ly ba lanced re la t io n sh ip s betw een trophic leve ls may be upse t
su ffic ien tly to m ake the hab ita t unsu itab le for them and o ther fo rm s
long a f te r the d i s a s te r has passed . Not only is the p rob lem
v iew ed f ro m a negative a ttitude in which im p o rtan t sp ec ie s d isap p ea r
f ro m one o r m o re troph ic le v e ls , but it can be a positive s itua tion .
The d eg rad a tio n of the s t r e a m m ay becom e a favo rab le fac to r fo r a
p a r t ic u la r sp e c ie s which in tu rn in c re a s e s i ts n u m b e rs co n s id e rab ly
out of p ro p o r tio n fo rm in g a c a r i c a tu r e of the o r ig ina l b iodynam ic
p ic tu re .
Having b r ie f ly d is c u s se d the p rob lem of s t r e a m pollution in
g e n e ra l , we sh a ll co n s id e r the p re se n t approach to the question:
1 'How much of a w aste can be d isch a rg ed into a p a r t ic u la r s t r e a m
b e fo re it w ill ad v e rse ly affect the aquatic l i f e ? ' 1 This question is
being an sw ered , f ro m an in d u s tr ia l w aste a sp ec t , by the toxicity
b io a ssay . Doudoroff et a l . (1951), co m m iss io n ed by the F e d e ra t io n
of Sewage and In d u s tr ia l W astes A sso c ia t io n s , have a t tem p ted tjo
s tan d a rd ize the p e rfo rm an ce of th ese te s ts ; how ever, the l i te ra tu re
at p re se n t is f il led with as m any m ethods as re s u l t s .
The m ost obvious fau lts in the b ioassay m ethods a r e (1) they
a r e c a r r i e d out under c r i t i c a l con cen tra tion s of the w as tes without
c o n s id e ra t io n of chron ic leve ls ; (2) the m a jo r ity of the work is
done on fish , and the effect of the w as tes on low er fo rm s is i g
nored; and (3) they d isp lay a com plete lack of co n ce rn fo r s ite of
en try and the mode of ac tion of the toxic ions w ithin the fish.
Due to the v a r ia b le s d isc u sse d , the l i te r a tu r e shows a wide
v a r ia t io n in the to le ra n c e of fish to ch rom ium . A su m m a ry of th is
l i t e r a tu r e is in T ab le 1. In o rd e r not to confuse th is d iscu ss io n

6
T A B L E 1
A B R IEF SUMMARY OF THE TOXICITY LITERATURE
A nim al Com pound R esu lts R efe ren ce
B lueg illSunfish
Na2 C r 0 4
Na2C r 2 ° 7
Z 4 -h r .. T L m -- 93 0 mg. Na2C r 0 4/ l .
2 4 -h r . TLm- - 7Z 8 mg. N a^C r^O ^/l .
A begg, 1950
S tick le b ack s
C r 2 (S04 )3 L etha l co n e . l i m i t - - 1 .Z mg. C r . / l .
Jo n e s , 1939
RainbowT rou t
K2C r ° 4
K X r O , Z 4
Toxicity [100 x ( l / t im e )] --0.050^+0*66 min. Z000 mixi. te s t , at 50 mg. C r / l .
T oxicity- - 0.05 1_+0.044 m in , - ^; 1946 m in. tex t, at 50 mg. C r / l .
G r in d le y , 1946
YoungE e ls
K C r2 (S04 )2
K2C r ° 4
K2C r 2(')7
Surv ival t im e at 5.Z mg. C r / l . av e rag ed 18.7 h o u rs
Surv ival t im e at 5Z0 mg. C r / l . av e rag ed 1Z.4 h o u rs
Surv ival t im e at 5Z0 mg. C r / l . av e rag ed 5.35 h o u rs
O shim a, 1931
Minnows T r iv a le n t C r as su lfa te
40 mg. C r / l . i s a m in im um fa ta l con cen tra tion in 6 hours
L eC le rc and D ev lam in ck , 1950
T ro u t KZC r Z<̂>7 6 h o u rs ' exposure to 100 mg. K ^ C r^ C ^ /l . fa ta l w ithin 1Z h o u rs a f te r rem o v a l
R ushton, 1921
L a rg e -mouthB a ss
K2C r ° 4 48 h r . TLm ; 195 mg. C r / l .
F ro m m and Schiff man t 1958
7
T A B L E 1 (C o n t in u e d )
A nim al Compound R esu lts R efe ren ce
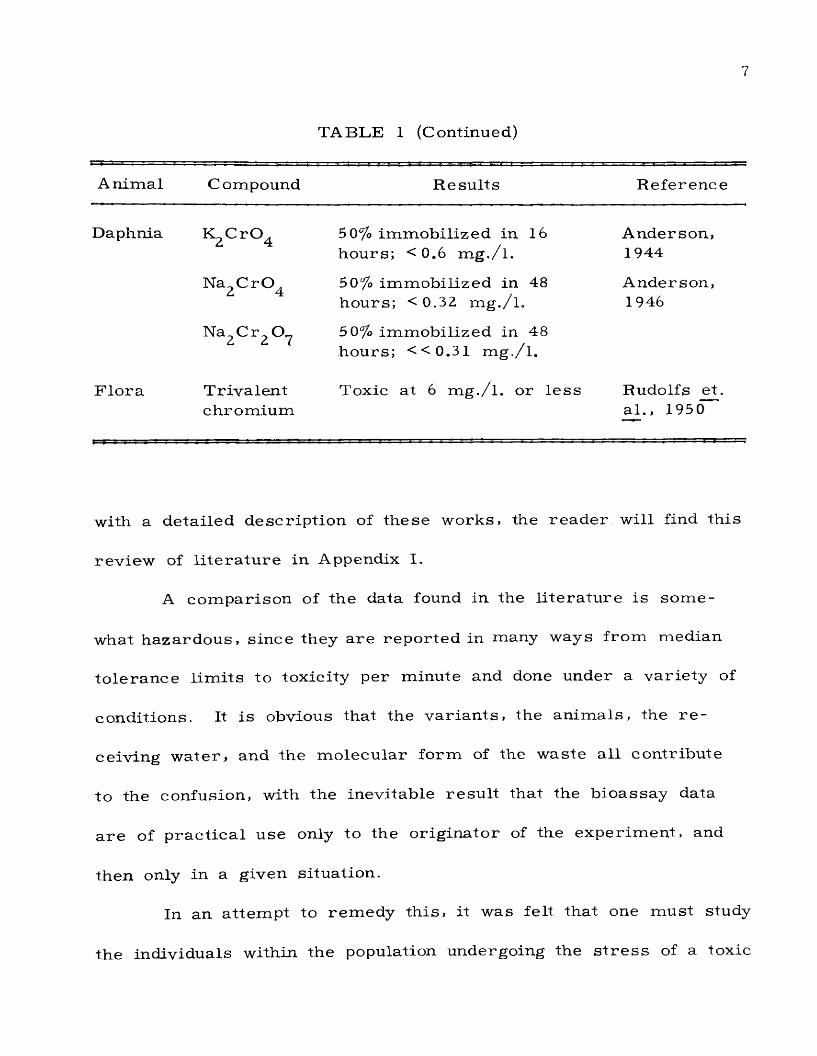
Daphnia K2C l-°4 5 0% im m o b il ized in 16 h o u rs ; <0 .6 m g . / l .
A n d erso n ,1944
N a^CrO ^ 50% im m o b il ized in 48 h ou rs ; < 0.32 m g ./ l .
A n d erso n ,1946
Na^Cr^O? 5 0% im m o b il ized in 48 hours ; <<0.31 m g ./ l .
F lo ra T r iv a len tch ro m iu m
Toxic a t 6 m g . / l . o r le s s Rudolfs et. a l . , 1950
with a de ta iled d e sc r ip t io n of th e se w orks, the r e a d e r w ill find th is
rev iew of l i t e r a tu r e in Appendix I.
A co m p ariso n of the data found in the l i te r a tu re is s o m e
what h aza rd o u s , s ince they a re re p o r te d in many ways f ro m m edian
to le ra n c e l im its to tox ic ity per m inute and done under a v a r ie ty of
conditions. It is obvious tha t the v a r ia n ts , the a n im a ls , the r e
ceiv ing w a te r , and the m o lecu la r fo rm of the w aste a l l con tribu te
to the confusion, with the inevitab le r e s u l t tha t the b io assay data
a r e of p ra c t ic a l u se only to the o r ig in a to r of the ex p e r im en t, and
then only in a given s itua tion .
In an a t tem p t to rem ed y th is , it was felt tha t one m u st study
the indiv iduals w ithin the population undergoing the s t r e s s of a toxic

8
env iro nm en t. T h is ap p ro ach , of n e c e s s i ty , led d ire c t ly to the fie ld
of physiology.
The l i t e r a tu r e dealing with changes in the physiology of f ish
u nder ch ro m iu m s t r e s s is a lm o s t com plete ly lacking. Abegg (1950),
u n d er conditions d e sc r ib e d in Appendix I, studied changes in t i s s u e
flu ids and blood specific g rav ity of b lueg ills b rought on by exposu re
to so lu tions of sodium ch ro m a te and sodium dichr ornate. By r e
m oving a s t r ip of d o r s a l m usc le t i s s u e , weighing i t , d es icca tin g i t
in an oven at a te m p e ra tu re of 110° C. for 24 h o u rs and rew eighing
the d ry t i s s u e , he d e te rm in ed the t i s s u e fluid volum e. This was
e x p re s s e d a s percen tag e of w a te r of the w e t- t i s su e weight.
Blood specific g rav ity was d e te rm in ed by use of the falling-
drop d e n s io m e te r . This m ethod com bines the m e r i t s of sm a ll
sam p le s ize , 0.01 c m m ., with speed and accu racy .
Blood for the d e te rm in a tio n was obtained f ro m a pithed f is h 's
bulbus a r t e r io s u s . By in se r t in g a 3 /4 - in c h needle tube b ro ken fro m
a 2 3 -gauge hypoderm ic needle in the b u lb u s , it was found tha t the
ac tion of the h e a r t pum ped the blood out the tube so that it could be
co l le c ted on a p ara ffin block. The data a r e re p o r te d in Table 2.
A begg felt tha t the v a r io u s physio logical r e a c t io n s of the fish
to the sa lt so lu tion was difficult to explain u n le ss one a ssu m ed

9
T A B L E 2
PHYSIOLOGICAL REACTIONS O F THE FISH TO THE SALT SOLUTION
H ours X %Standard P P e t .C h e m ic a l No. of F ish E x T issu e
V alueaposed F lu id D eviation Change^3
T issu e F lu ids
N a?C rO 10 C on tro l 24 81.22 0.826710 T e s t 24 81.63 0.6610 N.S. N.S
Na2C r 2 °7 1011
C on tro lT e s t
1313
80.30 82 .24
0,74571.4419 0.01 + 2 .
Blood Specific G ravity
N a ,C rO . 10 C on tro l 24 1.0441 0.001451c* 4
10 T e s t 24 1.0452 0,006406 N.S. N.S.
Na Cr~ O 10 C on tro l 13 1 .0399 0.0113619 T est 13 1.0372 0.003501 0„05 -0.375
a P ro b ab il i ty b a sed on F i s h e r 's t - t e s t v a lu es . N.S. denotes no sign ifican t change.
^C a lcu la ted on the b a s is of the con tro l va lu es equaling 100
tha t the ions e n te r the f i s h 's body. This is possib le through s e v e ra l
pathways: the skin , g il ls and o ra l m e m b ra n e s , and by ingestion .
A begg (1949) m ade a study of the effect of sa lt so lu tions on
the m ucous co v erin g of b lu eg ills . The sa lt co n cen tra tio n s u sed w ere
the sam e a s those re p o r te d in h is 195 0 paper. Phenol r e d was
10
added to the te s t so lu tions to a co ncen tra tion of 1:10,000. The fish
w e re rem o v e d a f te r one h o u r 's exposu re and r in s e d off under
running tap w a te r fo r th re e m inu tes . The body s u r fa c e s of a l l ex
p e r im e n ta l ly t r e a te d f ish w ere s ta ined with the dye. The u n tre a te d
co n tro ls re m a in e d unchanged. He felt th is showed an a l te ra t io n of
the m ucous cov er which m ight then have p e rm it te d the ions to p en e
t r a t e the skin. Abegg found that both sodium ca rb o na te and sodium
d ic h ro m a te cau sed an in c re a s e in t i s su e fluid content of the m u s
c u la tu re , and in both c a s e s they cau sed the p rec ip ita t io n of the
m ucous covering of the body*
In the sam e p ap er , u s ing H. W. S m ith 's phenol r e d techn iq ue ,
A begg d em o n s tra te d that the f r e s h -w a te r s tenohaline te le o s t d rinks
w a te r under n o rm a l conditions as w ell as in so lu tions of h igh e r
o sm otic p r e s s u r e s .
In addition to the conclusions that sodium d ich ro m ate caused
an in c re a s e in t i s s u e flu ids, Abegg s ta te d the s ize of f ish u sed in a
tox ic ity study is an im p o rtan t fa c to r in the in te rp re ta t io n of the
data; fo r he found tha t the la rg e r fish (2 0 gm. to 35 gm .) w ere m o re
to le ra n t than the s m a l l fish (4 gm. to 10 gm .),
F ro m m and Schiffm an (1938), in th e ir w ork with la rgem ou th
b a s s , concluded that exposu re to 94 mg. C r / l . c au sed in itia lly a
s lig h t , but not highly s ign ifican t in c re a s e , in the oxygen consum ption

11
of the animal. This was followed by a gradual decline to 27 percent
below normal after 68 hours' exposure.
A lso, they found, by microscopic examination of the intestine,
severe pathological changes immediately posterior to the pyloric
caeca, which in all probability completely destroyed its digestive
functions.
In add ition , coagu la ted s t r in g s of m ucus f ro m the anus of a l l
e x p e r im e n ta l f ish w ere o b se rv ed p r io r to death. It was th e o r iz e d
th a t c h ro m iu m e n te re d the g il ls and was e x c re te d , in p a r t , by the
l iv e r v ia the b ile . T h is c h ro m iu m -la d e n bile cau sed the in te s t in a l
dam age.
It i s in te re s t in g to note tha t no dam age to the g ill t i s s u e was
re p o r te d , although the com m on c r i t e r io n is tha t the heavy m e ta ls
k i l l by p re c ip ita t io n of the m ucus covering of the g il ls . They did
no te a coughing re f le x in the f ish befo re death , but the exact s ig
n if icance of th is is not known.
B ea r in g in m ind the l i t e r a tu r e a s rev iew ed h e re in , the in d i
v idu a l in te r e s te d in the e ffec ts of ch ro m iu m w astes on f ish , o r o the r
aquatic o rg a n is m s , can obtain li t t le help with the p ro b lem s at hand,
s ince the w ork done applied to a p a r t ic u la r se t of conditions and not
to g e n e ra l i t ie s . To r e i t e r a t e , i t w as fe lt that a physio log ical-
p h a rm a co lo g ic a l app ro ach to the p ro b lem s of s t r e a m pollution would
12
produce a b e t te r u nd ers tan d in g of the m any influencing fa c to r s . F o r
ex am p le , if we u n d e rs to o d how ch ro m iu m e n te r s the f ish , and if we
knew the d is tr ib u tio n and the mode of ac tion of the toxic ion once
i t i s within the o rg a n ism , we could b e t te r u n d e rs tan d the l im its of
toxic s t r e s s .
T h is p ro jec t was app roached with th e se ideas in mind* not as
an a n sw e r to tox ic ity p rob lem s as a whole, but as one p iece in a
com plex puzzle . Like the conventional b io a ssay , th is exp erim en t
f ixes the v a r ia b le s ; one w a te r , one w aste , and one sp ec ie s of an im al
is used . Unlike the b io a ssa y , it is designed to p rom ote an u n d e r
stand ing of the s t r e s s the individual f ish is experienc ing . A nother
d i f f e re n c e - -p e rh a p s the m ost im portan t - - i s the fact tha t th is e x p e r i
m ent dea ls not with c r i t i c a l c o n ce n tra t io n s , but sub le tha l doses of
ch ro m iu m .
To o rien t th is w ork with the l i te r a tu r e and to use a s a b a s e
line fo r the p ro jec t as a whole, a 24-hour m edian to le ra n c e l im it
was d e te rm in ed . The subsequent ex p e r im en ts w ere a l l p e r fo rm ed
at one-fif th of th is l im it . Once the w orking co n cen tra tio n level was
51d e te rm in e d , pilot e x p e r im e n ts using the rad io iso tope C r im p lica ted
the c i rc u la to ry sy s te m and the l iv e r as a path of the ch ro m iu m
w ith in the tro u t . It is safe to a ssu m e that the blood is in s t ru m e n ta l
in the t r a n s p o r t of the toxic agent f ro m its en tra n ce into the an im a l
until i t s f ina l exit. T h e re fo re , it would be the f i r s t t i s s u e that
m ight exhibit changes due to the s t r e s s . Under th is a ssu m p tio n ,
th is th e s i s is p redom inan tly d ire c te d a t ch ro m iu m -in d u ced change
in blood, and inc ludes d e te rm in a tio n s of h e m a to c r i t s , hem oglobins
c e l l co u n ts , p la sm a v o lu m es , and blood v o lu m es , am ong o th e rs .
MATERIALS AND METHODS
The ra inbow tro u t u sed throughout th is w ork w ere obtained
f ro m the M ichigan D ep artm en t of C o n se rv a tio n th rough the c o o p e ra
tion of M e s s r s . E d w ard Bacon and Ralph M arks . The fish w ere
t r a n s p o r te d in p lastic bags in lo ts of one hundred f ro m the Wolf
Lake H a tch e ry to the la b o ra to ry . F ifty tro u t w ere placed in a sm a l l
am ount of w a te r in each bag , a f te r which the bag was in fla ted with
oxygen and sea le d . Ice was p laced around the outside of the bags*
when the te m p e r a tu r e s w a rra n te d i t , to keep the fish at 15° C.
In the la b o ra to ry the f ish w ere held in four 2 6 -gallon g la ss
aq u a r ia kept in a cons tan t te m p e ra tu re ro om (F igu re 1). This room
w as i l lu m in a ted continually by f lu o rescen t lights overhead and on
each holding tank. C onstan t i l lum ina tion was u ti l iz ed becau se each
t im e the ligh ts w ere tu rn e d on over the holding tanks the fish would
b ecom e ex ce ss iv e ly excitab le , thus in troducing a v a r ia b le tha t might
a ffec t the fina l r e s u l t s .
The w a te r u sed throughout the ex p e r im en ts was he ld at 14° C.
to 15° C. in the holding tanks and in the ex p e r im en ta l tan ks , and
w as tap w a te r which had a h a rd n e s s of 334 mg. of C a C O ^ /l . , a to ta l
a lka lin i ty of 204 mg. of C a C 0 3/ l . and a pH of 8.5 to 8.8.
14

15
Figu
re
1. E
xper
imen
tal
aqua
ria
in co
nsta
nt
tem
pera
ture
ro
om,
16
On each Monday, Wednesday, and Friday the fish were fed
dried trout pellets developed by the Michigan Department of Conser
vation for use in their hatcheries.
Chemical Methods
Total residue (Standard Methods> 1955)
Total residue, or total solids, was done by evaporation.
Fifty m illiliters of sample were placed in a weighed dish and
evaporated to dryness at temperatures between 95° C. and 105" C.
The dish was reweighed and the difference calculated. The total
residue in m g./l. was found by the following equation:
mg. total residue/l. = (difference x 1000)/(ml. of sample)
Alkalinity (Standard Methods, 1955)
Alkalinity was done by titration. Fifty m illiliters of sample
were titrated to pH 8.3, using phelolphthalein indicator, with 0.02
N. hydrochloric acid, after which it was further titrated using
Fleisher Methyl Purple Indicator to a purple endpoint at a pH of 4.8.
The phenolphthalein alkalinity was calculated as mg. of
CaC03/ l . by the following formula:
mg. CaCO^/l. = (ml. standard acid x 1000)/(mlo of sample)
17
The to ta l a lkalin ity was a lso e x p re s s e d in mg. of C aC O ^/l.
and was ca lcu la ted in the sam e m ann er using the to ta l m i l l i l i t e r s
of s ta n d a rd to b r in g the solu tion to a pH of 4.8.
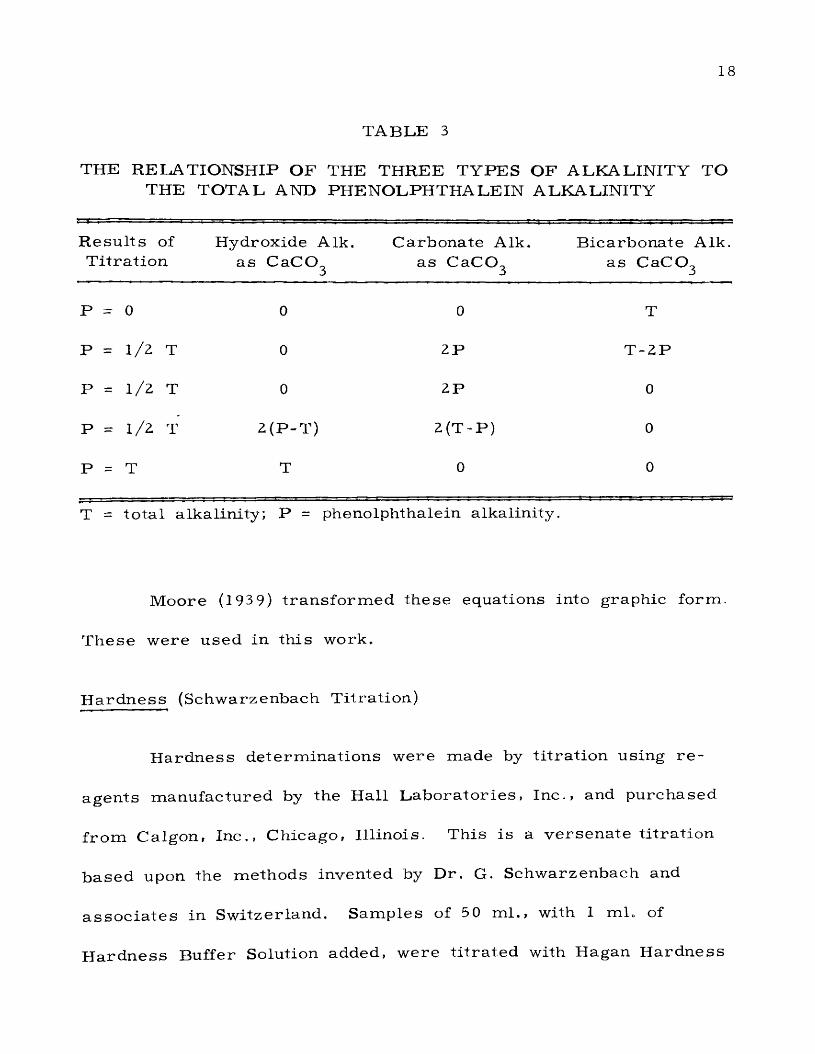
The to ta l a lkalin ity of a w a te r is m ade up of th re e types;
n am ely , the hydrox ide , ca rb o n a te , and b ica rb o n a te a lkalin ity found in
the ap p ro x im ate re la t io n sh ip s a s i l lu s t r a te d in Table 3, taken from
S tan d a rd M ethods (1955).
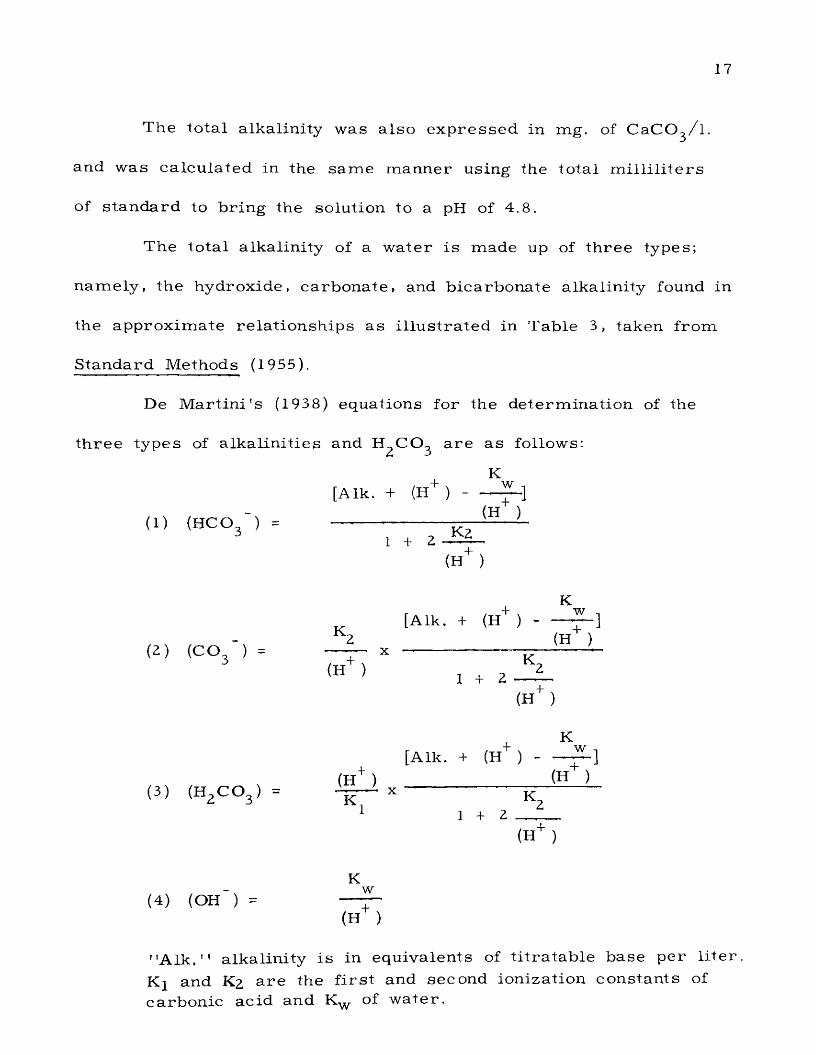
De M a r t in i 's (1938) equations fo r the de te rm in a tio n of the
th re e ty pes of a lk a lin i t ie s and H^CO^ a re as follows:
[Aik. + (H+ ) - -2-SL]
(1) (HCO j = (H }3 1 + 2 K Z
(H+ )
K[Aik. + (H+ ) --------~ ~ ]
( 2 ) ( c o ^
« > 1 . 2 2(H+ )
K[Aik. + (H+ ) -
(H+ ) (H )(3) (h 2c o 3 ) = " k ~ x k I
1 1 + 2 _ j _(H+ )
(4) (OH~) =K
W
(H+ )
" A ik ." a lka lin ity is in equivalen ts of t i t r a ta b le base p e r l i te r Kj and Kz a r e the f i r s t and second ion iza tion co ns tan ts of ca rbo n ic ac id and Kw of w a te r .
18
T A B L E 3
THE RELATIONSHIP O F THE THREE TYPES OF ALKALINITY TO THE TO TA L AND PHENOLPHTHALEIN ALKALINITY
R e su lts of T i t ra t io n
H ydroxide Aik. a s CaCO^
C arbo na te Aik. as CaCO^
B icarbona te Aik. as CaCCh
5
P =■ 0 0 0 T
P = 1/2 T 0 2P T -2 P
P = l /Z T 0 2P 0
P - 1/2 T 2 (P -T ) 2 (T -P ) 0
u T 0 0
T = to ta l a lkalin ity ; P = phenolphthalein alkalin ity .
M oore (193 9) t r a n s fo rm e d th e se equations into g raphic form .
T h ese w ere u se d in th is work.
H a rd n e s s (Schw arzenbach T itra tion )
H a rd n e ss d e te rm in a tio n s w ere m ade by t i t r a t io n using r e
agen ts m anu fac tu red by the H all L a b o ra to r ie s , Inc ., and p u rch ased
f ro m C algon , Inc., C hicago , Illino is . This is a v e rse n a te t i t r a t io n
b a s e d upon the m ethods invented by D r. G. Schwarz enbach and
a s s o c ia te s in S w itzerland . Sam ples of 5 0 m l. , with 1 m l. of
H a rd n e ss B uffer Solution added, w ere t i t r a te d with H agan H a rd n e ss
19
T i t ra t io n Solution (l m l, = ZO mg. C aC O ^/l .) using the h a rd n e s s in
d ic a to r which changes f ro m r e d to blue a t the endpoint. H a rd n e ss
w as ca lcu la ted a s follows:
T o ta l ha rd , a s mg. C aC O ^/l . = ZO x b u re tte read in g in m l.
C h ro m iu m (Saltzm an, 195Z)
S am ples f ro m the aq u a r ia w ere diluted, when n e c e s s a ry , so
tha t the am ount ana lyzed , 1 to 10 m l. , would contain f ro m 5 to 15
m ic r o g r a m s of ch ro m iu m . This was ash ed in a lZ 5 -m l. P h il l ip s
b e a k e r by adding 0.5 m l, g la ss d is ti l led reagen t g rade co n cen tra ted
n i t r ic ac id , and 0.Z5 m l. of 40 p e rcen t sodium b isu lfa te , then
ev ap o ra ted to d ry n e s s on a L indberg type hot p late. At th is point
S a ltzm an re c o m m e n d s rep ea t in g the addition of ac id and ash ing
again , but it was found tha t th is was u n n e c e ssa ry under the condi
t ion s ex is tin g during th e se te s t s . T en m i l l i l i t e r s of 0.5 N. su lfu ric
ac id , m ade up with double d is t i l le d w a te r , w ere added and sw ir led
to d isso lv e the ash . When the ac id was added to the hot ash it went
in to solution with m uch le s s difficulty than did the cooled ash .
Any w a te r , including re ag en ts m ade up with w a te r , added to
the sam p le s a t th is point o r a f te rw a rd s , m ust be double g la ss d i s
t i l le d . T h is p rev en ts redu c tion of the hexavalent ch ro m iu m which is
fo rm e d by the ash ing and subsequent s tep s . Only the hexavalent
2 0
c h ro m iu m w ill develop the c o lo r of the s -d ip h en y lca rb az id e r e
agent .
To the ac id so lu tion of the ash is added 0.5 ml. of 0.1 N„
p o ta ss iu m p erm ang an a te ; it i s then c o v e re d and h ea ted on the hot
p la te at ap p ro x im ate ly 100° C. fo r 2 0 m inu tes . S a ltzm an 's m ethod
c a l ls fo r the add ition of m o re perm anganate if the pink co lo r d is a p
p e a r s , but once aga in th is s tep was found u n n e c e ssa ry . At the end
of th is t im e the p erm an g an a te i s d eco lo rized by the addition of 5
p e rc e n t sodium az ide a t the r a te of 1 drop every 10 seconds, s w i r l
ing a f te r each drop. T h ree to 5 d rops w ere usually enough to
d e s tro y any b row nish t in t , and any ex ce ss was avoided s ince th is
would red u ce the ch rom ium . With the sam p les once again c o lo r le s s ,
they w e re re m o v e d im m ed ia te ly f ro m the heat and p laced in a t r a y
of co ld w a te r . The sam p les now may be f i l te re d , if n e c e s s a ry , or
t r a n s f e r r e d d ire c t ly into 2 5 m l. v o lu m etr ic f la sk s using double d i s
t i l le d w ate r a s a wash liquid. Once the sam p les a r e in the v o lu m e t
r ic f la sk s , co lo r developm ent can proceed .
C o lo r was developed by adding 1.0 ml. of s -d ip h en y lca rb az id e
re a g e n t . T h is re ag en t was m ade up by d isso lv ing 10 g ra m s of
phtalic anhydride in 175 m l. of r e d is t i l le d 95 percen t ethyl alcohol,
w arm ing to effect solution. To th is is added 0,625 g ra m s s-
d ypheny lcarbaz ide d is so lv ed in 5 0 m l. of r e d is t i l le d alcohol, F in a lly ,
21
th is com bina tion i s m ade up to 25 0 m l. with alcohol. This reag en t
is quite s tab le and w as s to re d in a brow n bottle under r e f r ig e ra t io n
fo r 8 m onths . Only occas io n a l re s tan dard iza tio n was n e c e s s a ry .
One m inute a f te r the developer was added, 2.5 m l. of 4 M.
sod ium d ihydrogen phosphate was added as a buffer and the sam ple
m ade up to 25 m l. If i ro n was p re se n t , the buffer could be added
b e fo re the s -d ip h en y lca rb az id e and allow ed to stand 15 m inu tes b e
fo re read in g . This would e lim in a te in te r fe re n c e due to sm a ll am ounts
of iro n .
T he pink co lo r was r e a d at a wavelength of 540 mg. within
3 0 m inu tes on a B ausch and Lomb Spectronic 2 0 c o lo r im e te r .
A p o ta ss iu m ch ro m a te solution was used to s tan d a rd ize the
d e te rm in a t io n and was m ade by d isso lv ing 0.3734 g ra m s of p o ta ss ium
c h ro m a te in 1 l i t e r of r e d is t i l l e d w a te r . T his contained 100 jjg. of
ch ro m iu m p er m i l l i l i te r . S tandard cu rv es of m ic ro g ra m s hexavalent
ch ro m iu m v e r s u s p e rcen t t r a n s m is s io n w ere m ade up approx im ate ly
ev e ry two w eeks when many an a ly se s w ere being m ade, but if
c h ro m iu m d e te rm in a t io n s w ere done p e rio d ica lly , a cu rve was made
with each s e r i e s of d e te rm in a tio n s .
H exavalen t ch ro m iu m was d e te rm in ed by p rocu rin g a p ro p e r ly
d ilu ted sam ple in a 25 m l. v o lu m e tr ic f lask and adding the s-
d iph eny lcarb az id e reag en t and buffer as above. The sam p les w ere

22
th e n d ilu ted to 2 5 m l. with double d is t i l le d w a te r and re a d c o lo r im e t-
r ic a l ly u s ing the sam e s ta n d a rd s a s above.
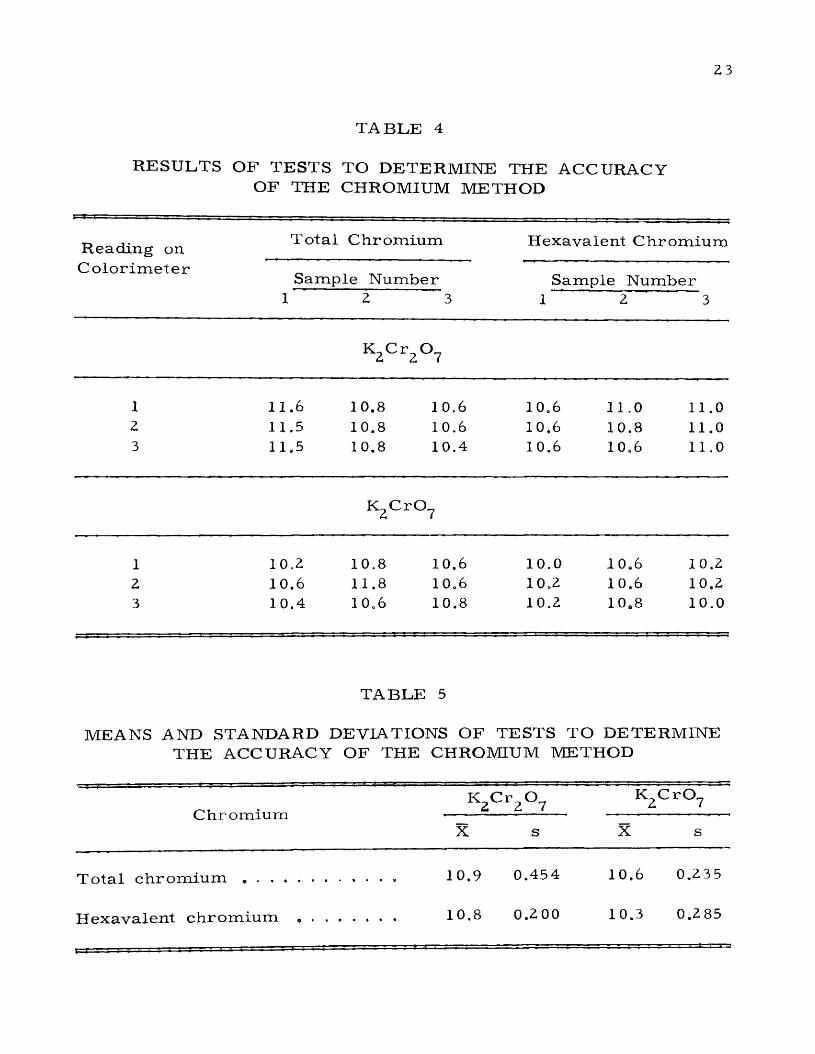
The a c c u ra c y of the te s t was d e te rm in ed by m aking up 2 ^ug.
-J-C r /m l , s ta n d a rd s using both p o ta ss iu m ch ro m a te and po tass ium
d ic h ro m a te . T h ree 10 jag. s a m p le s fro m each so lu tion w ere analyzed
fo r to ta l ch ro m iu m and hexavalen t ch ro m iu m , each sam ple being
r e a d in the c o lo r im e te r th re e t im e s . The r e s u l t s of th e se an a ly se s
a p p ea r in Tab le 4. The m eans and s tan d a rd dev iations of these
te s t s a r e shown in Table 5.
Due to the fact tha t the sam p les a g re e well within th e m se lv e s ,
it w as felt tha t the deviation fro m the s ta n d a rd of 10 jag. was due to
the d ilu tion and m e a su re m e n t m ethods and not the an a ly tic a l p r o
c e d u re . Taking 10 y x g . a s the m ean of the population (p) and using
2 —
the s e r i e s of sam p le s with the g re a te s t v a r ia t io n (s = 0.2 06, X =
10.9) it was found that the s ta n d a rd e r r o r of th is group is
Jx +. 0.37. M aking the a ssu m p tio n , which is not su b s tan tia ted by ex
p e r im e n ta l d a ta , tha t th is e r r o r would not change ap p rec ia te ly with
g r e a te r d ilu tions, i t was felt tha t th is accu racy was sufficient fo r
te s t in g a l l w a te r sam p les .
It was a lso found by us ing ja = 10 and the r e s u l t s of the
p o ta ss iu m c h ro m a te sam p le s tha t a F is h e r " t " te s t showed no
ev idence of a d iffe ren ce betw een to ta l and hexavalent ch ro m iu m
23
T A B L E 4
RESULTS OF TESTS TO DETERMINE THE ACCURACY OF THE CHROMIUM METHOD
R eading on T o ta l C hrom iu m H exavalent C h rom ium
C o lo r im e te rSam ple N um ber Sample N um ber
1 2 3 1 2 3
K2G r2° 7
1 11.6 10.8 10.6 1 0o6 11.0 11.02 11.5 10.8 10,6 10.6 10.8 11.03 11.5 10.8 10.4 10.6 10.6 11.0
K ^CrO ?
1 10.2 2 10.6 3 10.4
10.8 10.6 10.0 11.8 10.6 10.2 10.6 10,8 10.2
10.6 10.6 1 0o8
10.210.210.0
TABLE 5
MEANS AND STANDARD DEVIATIONS OF TESTS TO DETERMINE THE ACCURACY OF THE CHROMIUM METHOD
C hro m iu m K2C r 2 °7K2C r ° 7
X s X s
T o ta l c h r o m i u m ................... .................. 10.9 0.454 10.6 0.235
H exavalen t ch ro m iu m . . ............... 10.8 0.200 10.3 0.285
2 4
m eth o d s . Upon th is b a s i s , it was a s su m e d tha t the ch ro m iu m added
to the a q u a r ia re m a in e d for the m ost p a r t in the hexavalen t fo rm ,
and la te r ex p e r im e n ts upheld th is theo ry .
R ad ioactive Isotope Methods
The rad io iso to p e C h ro m iu m 51 was u sed in the t r a c e r e x
p e r im e n ts . T h is e lem en t was supplied by the N ational L ab o ra to ry ,
Oak R idge , T e n n e sse e , in the fo rm of C rC l^ in HC1 solution with a
co n ce n tra tio n of 22,85 4, 10 p e rcen t m g ./m l , and a specific activ ity
of 1760 m c /g . T h is , the t r iv a le n t fo rm , had to be oxidized to the
hexava len t fo rm fo r use in th is p rob lem . T h is tra n s fo rm a tio n was
c a r r i e d out in the following m ann er . A sam ple of app rox im ate ly
515 0 pg. of C r was m ade b as ic with 2 m l. of 6 N. Sodium hydrox
ide and 1 m l. of 3 p e rcen t hydrogen peroxide was added. This was
h e a te d at 110° C. fo r 5 m in u te s , a f te r which it was boiled for one
hour to d r iv e off the e x c e ss peroxide . At the end of the boiling
p e r io d , while the so lution was s t i l l w a rm , 0.2 m l. m o re of the NaOH
w as added and sw ir led . If bubbles w ere given off, the solution was
b o iled aga in un til no bubbling was evident. When no bubbling
o c c u r re d , the solu tion was n eu tra l iz e d with 2 m l. of 6 N. h y d ro
c h lo r ic ac id , coo led , and used .
25
The te s t a n im a ls w ere alw ays exposed to the rad io ac tiv e
iso to pe by m aking a d ilu tion of th e ir env ironm en ta l w a te r . W ater
s a m p le s of 1 m l. w ere analyzed fo r activ ity by evapora ting them in
p o rc e la in p lanchets with a d ia m e te r of 3 5 m m . G am m a ra y counts
of th e se p re p a ra t io n s w ere m ade with a N uclear In s tru m en t and
C h em ica l C o rp o ra tio n Model 183 S ca le r equipped with a T ra c e r la b
tube of the sc in t i l la tio n type.
O rgan counts w ere m ade by weighing the f r e s h t i s s u e on a
R o l le r -S m ith ba lance and dry ash ing them on the p o rce la in p lanchets
in a m uffle fu rn ace at 5 00° C. When the re s id u e tu rn ed white or
light g ray , the p lanchets w ere rem ov ed f ro m the oven and cooled.
C o n c e n tra te d n i t r ic ac id was added to d isso lve a n d /o r suspend the
a sh , the r e s u l ta n t so lution being evap o ra ted slowly on a hot plate.
This left a th in f ilm of the a sh evenly d is tr ib u ted on the p lanchet,
which was counted a s above.
Both w a te r and o rgan counts w ere made e i th e r a s counts per
five m in u te s , o r a s m inu tes p e r 400 coun ts , c o r r e c te d fo r decay and
r e p o r te d a s counts p e r m inute .
B io logical M ethods
F is h b io a ss a y s (Doudoroff et a l ., 1951)
T h is m ethod se t up by the C om m ittee on R e s e a rc h , Subcom
m itte e of T oxic ity , Section III of the F e d e ra t io n of Sewage and
2 6
In d u s tr ia l W astes A ss o c ia t io n s , was followed a s c lo se ly a s p r a c t i
cab le; dev ia tions w ere m ade only when the r e s e a r c h e r felt th e m to
be of no effect on the final r e s u l t s .
Since th is is a s ta n d a rd p ro ced u re in the fie ld ot toxic w aste
co n tro l , but unknown in pure physio logical w ork, it is felt that a
b r ie f outline of the m ethod is ju s tif iab le in th is work.
F i s h . F is h being used in b io a ssay te s t s should be native to
the w a te rsh ed rece iv in g the w a s te s , and should be n e i th e r a to le ra n t
n o r a highly in to le ran t sp e c ie s , but r a th e r , one with a r e c o rd of
m ed ian to le ra n c e . The following fam ilie s a r e recom m ended:
C e n tra rc h id a e (sunfishes , b a s s e s , c rap p ie s )
Salm onidae (trou t, c h a r r s , sa lm ons)
C yp rin idae (true minnows) exclusive of ca rp and goldfish
C ato stom idae (su ck ers)
T e s t an im a ls should be obtained f ro m any single so u rce and
brough t to th e la b o ra to ry at about the sam e t im e . The length of the
la rg e s t f ish should not be m o re than 1.5 t im e s the length of the
s m a l le s t . Doudoroff reco m m en d ed fish averag ing le s s than th re e
in c h e s , but th is w as not ad h e red to b ecau se of the difficulty that
would be en co un te red in p e rfo rm in g o th e r physiological te s t s . F ish
u sed th roughout the work av e rag ed 13.6 cm . in length with a ran g e
of f ro m 10.0 to 17.0 cm . and a m ean weight of 19.0 g ra m s .
2 7
The t e s t an im a ls should be a c c l im a tiz e d to la b o ra to ry co nd i
t io n s fo r at le a s t one w eek, p re fe rab ly ten days o r longer. D uring
th is t im e they a r e to be fed at r e g u la r in te rv a ls a t le a s t th r e e
t im e s a week. F is h should not be fed two days b e fo re , nor during
the te s t .
The p e rcen tag e of f ish dying o r se r io u s ly d ise a se d during the
a c c l im a t iz a t io n p e rio d should not exceed 10 percen t.
The e x p e r im en ta l w a te r (d iluent). W ater f ro m the s t r e a m
re c e iv in g the w aste o r a r t i f ic ia l s t r e a m w ater of s im i la r quality
w ith r e s p e c t to the ca lc iu m , m ag n es iu m , su lfa te , to ta l d isso lved
so lid s , and to ta l a lka lin ity is recom m ended . Since the r e s e a r c h
p ro je c t r e p o r te d h e re in is not a p rob lem specific to a p a r t ic u la r
s t r e a m , tap w a te r was decided upon a s the diluent.
O ther e x p e r im en ta l co n d ition s . The te s t should be p e rfo rm ed
at un ifo rm te m p e ra tu re s betw een 68° F . and 77° F . (2 0° C .-25° C.)
fo r w arm w a te r fish and 54° F . to 64° F . (12° C .-18° C .) when
co ld w a te r fish a r e used . The rang e should not exceed 2° F. o r
1° C. above or below the chosen te m p e ra tu re .
The te s t co n ta in e r o r aq u ar ia should be of g la ss and of such
a s ize tha t depth of w ate r is n ev e r le s s than 6 inches. The d i s
so lved oxygen content of the w a te r should n ev e r be le s s than 4 ppm
2 8
fo r w a rm w a te r f ish o r 5 ppm for co ld w a te r fish . A e ra tio n , under
som e conditions, i s not reco m m en d ed due to the fact tha t th is may
d r iv e out g aseo u s o r v o la tile com ponents of a w aste .
At le a s t te n a n im a ls should be te s te d fo r each dilution; the
to ta l weight of a l l f ish in a te s t con ta iner should not exceed 2 g ra m s
p e r l i t e r , and 1 g ra m p e r l i t e r o r le s s being p re fe r re d .
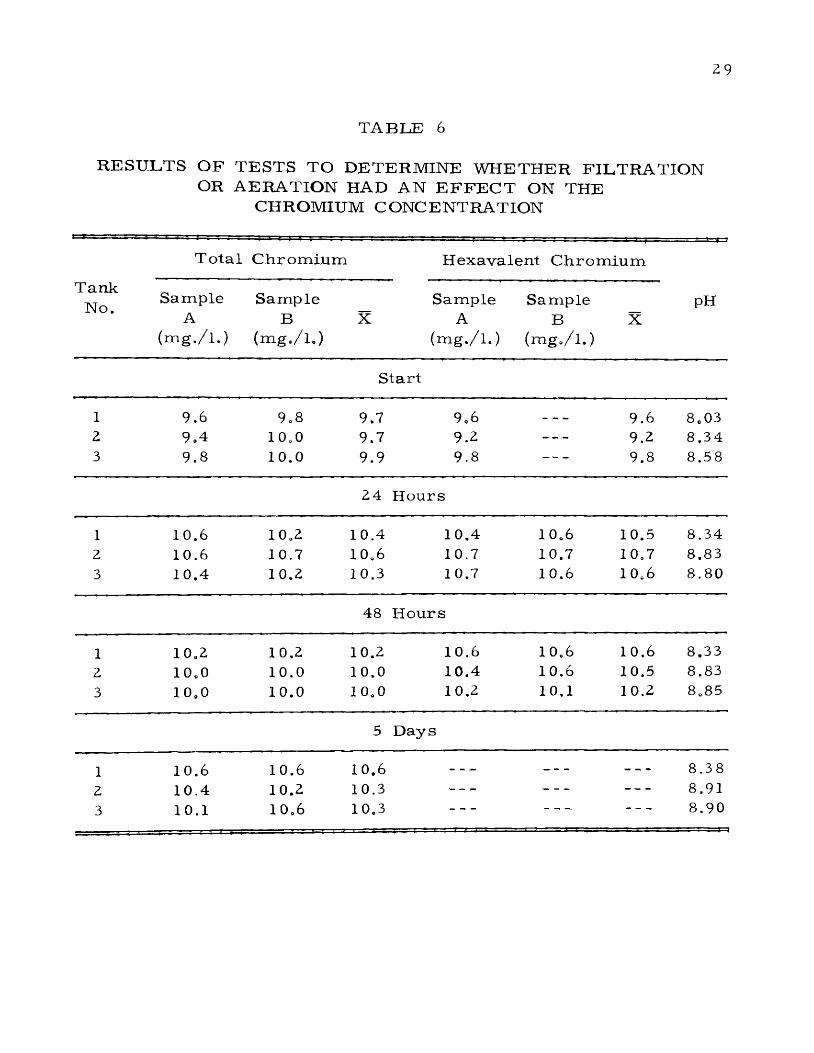
A e ra t io n and f i l t ra t io n w ere both used in th ese ex p e r im en ts
a f te r due exam ination of th e i r effect on the d isso lv ed ch rom ium .
A e ra t io n was acco m p lish ed by c o m p re s s e d a i r in trod uced into the
tan ks v ia a s tone a i r b r e a k e r . A quarium f i l te r s of g la s s wool and
g ra v e l w ere u sed to c le a r the w a te r of suspended so lid s . B efore
u s in g th e se a p p a ra tu s , which w ere c o n tra ry to recom m en d ed p r o
c e d u re , th r e e aq u a r ia w ere se t up as follows:
A qu ariu m 1 No f i l t e r , no a e ra t io n
A qu ariu m 2 No f i l t e r , a e ra t io n
A quarium 3 F i l t r a t io n , a e ra t io n
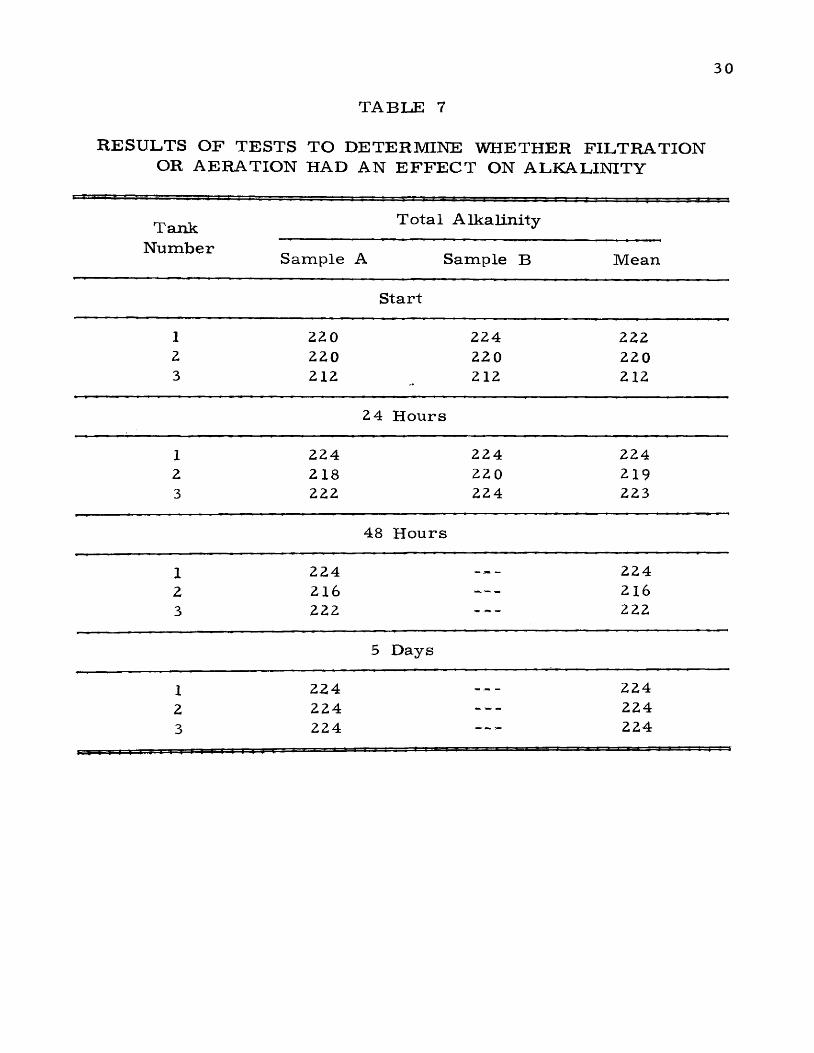
+ 6 /The w ate r in each of th e se tanks contained 10 mg. C r / l . The
to ta l and hexalen t ch ro m iu m , and to ta l a lkalin ity m e a su re d at
the s t a r t of the exp erim en t and 24 h o u rs , 48 h o u rs , and 5 days
a f te r the add ition of ch rom ium . The r e s u l t s of th e se te s t s a r e
shown in T ab le s 0 and 7.
2 9
T A B L E 6
RESULTS OF TESTS TO DETERMINE WHETHER FILTRATION OR AERATION HAD AN E F F E C T ON THE
CHROMIUM CONCENTRATION
TankNo.
T ota l C h ro m ium H exavalent C h rom ium
PHSam pleA
( m g . / l . )
Sam pleB
(m g ./ l .)
Sample X A
(m g ./ l .)
Sam pleB
(m g ./ l .)X
S tart
1 9.6 9,8 9.7 9.6 — — 9.6 8.03Z 9,4 10.0 9.7 9.2 ----- 9.2 8.343 9.8 10.0 9.9 9.8 ------------- 9.8 8.58
Z4 H ours
1 10.6 10.z 10.4 10.4 10.6 10.5 8.34Z 10.6 10.7 10.6 10.7 10.7 10.7 8.833 10.4 10.Z 10.3 10.7 10.6 10.6 8.80
48 H ours
1 10.Z 10.Z 10.Z 10.6 10.6 10.6 8.33Z 10.0 10.0 10.0 10.4 10.6 10.5 8.833 10.0 10.0 10.0 10.2 10.1 10.2 8.85
5 Days
1 10.6 10.6 10.6 ------ ------------- 8.38Z 10.4 10.Z 10.3 ----- -------------- 8.913 10.1 10.6 10.3 ----- — — — 8.90
3 0
T A B L E 7
RESULTS OF TESTS TO DETERMINE WHETHER FILTRATION OR AERATION HAD AN E F F E C T ON ALKALINITY
T ank T ota l A lkalin ity
N um berSam ple A Sample B M ean
S ta rt
1 220 224 2222 220 22 0 2203 212 212 212
2 4 H ours
1 224 224 2242 218 220 2193 222 224 223
48 H ou rs
1 224 - — - 2242 216 ----- 2163 222 ----- 222
5 Days
1 224 ----- 2242 224 ----- 2243 224 —— 224
31
It can be concluded re ad ily f ro m these da ta , even without
benefit of s ta t i s t ic a l a n a ly s i s , tha t n e i th e r f i l t ra t io n nor a e ra t io n
a l te r e d the c h ro m iu m content o r to ta l a lka lin ity of the w a te r . As a
re s u l t it was fe lt tha t ten fish could be kept in each 4 0 - l i te r aq u ariu m
without a l te r in g the final r e s u l t s of the b io a ssay , even though th is
g re a t ly exceeded the reco m m en d ed num ber. The d isso lv ed oxygen
content w as a lw ays above 5 ppm and av e rag ed 8 ppm.
E x p e r im e n ta l p ro c e d u re . C o ncen tra tio ns to be te s te d w ere
m ade up by adding po ta ss ium ch ro m a te c ry s ta l s (M allinckrodt A n
a ly t ic a l R eagent) d ire c tly to the filled aquaria ; the re s u l ta n t so lution
was then analyzed fo r hexavalent ch rom ium . E x p e r im en ta l c o n c e n tra
tio ns s e lec ted w ere b a sed on p ro g re s s iv e b isec tion of in te rv a ls on a
lo g a ri th m ic s ca le . P ilo t te s t s with few fish and a wide range of
co n ce n tra t io n s w ere done to e s tab l ish the approx im ate to le ran ce
l im i ts b e fo re the b io assay began* A con tro l tank of ten fish under
the e x p e r im en ta l conditions was te s te d s im ultaneously with the b io
a s s a y . If the co n tro l tank had a m o rta l i ty of h ig he r than 10 p e rcen t ,
the te s t r e s u l t s w ere co n s id e re d u n re liab le . The fish w ere handled
with s m a l l d ipnets and m e a s u re d and weighed p rev ious to the s ta r t
of the te s t . The t e s t s w ere ru n for both 2 4 and 48 ho u rs .
The data a re re p o r te d a s a 24 -h ou r or 48-hour m ed ian t o l e r
an ce l im it (TLm ). This i s e s t im a te d by s t ra ig h t- l in e g rap h ica l
in te rp o la t io n u s ing p e rc e n t su rv iv a l on the o rd ina te and log., dose
(e x p re s s e d in mg. C r / l . ) on the a b s c is s a . In o rd e r to do th is ,
it i s n e c e s s a r y to have two te s t co n ce n tra t io n s , one in which the
su rv iv in g f ra c t io n is above 0.5 0 but below 0.90, and the o ther with
a su rv iv in g f ra c t io n below 0.5 0 but above 0.10. It can read ily be
seen tha t the c lo s e r th e se f rac t io n s a r e to 0.50 the m o re a c c u ra te
the e s t im a te w ill be. By extending a s tra ig h t line between these
+ 6two po in ts , the T L m i s re a d in mg. C r / l . at the point the line
c r o s s e s the 50 p e rcen t su rv iv a l ax is .
F o r the b io log is t in te r e s te d in s ta t ing a p resu m ab ly h a rm le s s
co n ce n tra t io n (C) of a w aste , H a r t , Doudoroff, and G reenback (1945)
su g g es ted the following equation with re se rv a t io n s :
C = (48 h r . T L m x 0 .3)/(S2 )
S = (24 h r . T L m )/(48 h r . TLm )
D raw ing of blood
It was found e a r ly in th is work that the p ro cu rin g of a valid
sam ple of blood f ro m sm a ll f ish would prove to be a difficult p ro
c e d u re . The cutting off of the ta i l at the caudal peduncle and c o l
le c tin g the blood as it flowed f ro m the caudal ve in is a popular
m ethod in fish r e s e a r c h . It was t r ie d in the e a r l i e r pilot e x p e r i
m e n ts . The high v a r ia n c e of the sam p le s obtained by th is m ethod
33
in d ica ted the blood was being con tam in a ted , probably by sp ina l and
in t e r s t i t i a l flu ids. A fte r p ra c t ic e , blood was obtained by h e a r t
punctu re f ro m f ish a n e s th e s iz e d with 3 00 mg. M S-222/l. (T rica ine
m ethane su lfonate). It was v ir tu a l ly im p o ss ib le to m ake a su ccess fu l
h e a r t punctu re th ro ug h the skin in these sm a ll fish; th us , a v e n tra l
in c is io n was m ade to expose the h e a r t , and the p e r ic a rd iu m was
s tr ip p e d off to f re e the v e n tr ic le . Next a 0.25 m i l l i l i te r sy r in g e ,
r in s e d in 1000 U S P /m l. h ep a r in so lution, and fitted with a 27 gauge
need le , was in s e r t e d s tra ig h t down into the v e n tr ic le at i t s base n ea r
the junction of the t ru n c u s a r t e r i o s u s . By keeping a slightly n eg a
tive p r e s s u r e within the sy ringe each h e a r t beat would pump blood
into i t . No blood sam ple of le s s than 0.1 ml. was u sed in these
d e te rm in a t io n s , s ince it was felt tha t the re s id u e of h ep a r in , although
as m uch as p oss ib le had been expelled before taking the sam ple ,
would cau se a s e r io u s dilution e r r o r . The av e rag e sam ple was b e
tw een 0*1 and 0.2 m i l l i l i te r .
H e m a to c r i ts
The blood draw n by h e a r t puncture was e x p re s s e d out of the
sy rin g e onto a wax su rface tak ing c a re to avoid a i r bubbles which
m ight get into the blood p ipe ttes . A van A llen h e m a to c r i t tube was
f i l led up to the 100 m a rk f ro m the pool of blood, a f te r which it was
3 4
d ilu ted with a 0.6 pe rcen t sodium ch lo ride until the bulb of the
h e m a to c r i t tube was th re e - fo u r th s full. The tube was sea led with
a sp r in g clip and cen tr ifu ged at 25 00 RPM for twenty m inu tes . The
a c c u ra c y of th is t e s t was d e te rm in ed by taking four d iffe ren t h e m a
to c r i t s f ro m a single blood sam ple f ro m one fish . The re s u l ta n t
s ta n d a rd e r r o r was 0.72 m l./lO O ml.
H em oglobins
H em oglobin content of the blood was d e te rm in ed as acid
h em a tin as outlined in the B ausch and Lom b S pectron 2 0 C lin ica l
Technique M anual. Twenty cubic m i l l im e te rs w ere added to 5 m i l l i
l i t e r s of 1 p e rc e n t HC1 and allow ed to s tand one hour. Since fish
blood is nu c lea ted , the re su l ta n t so lution was slightly t u r b i c , which
in t e r f e r e d with the c o lo r im e tr ic m ethod. The nuclei w ere rem o v ed
by cen tr ifu g ing at 2500 R PM fo r 10 m inu tes , and the supernatan t
was r e a d on the c o lo r im e te r at 52 5 rnp wavelength. The s tan d a rd s
fo r hum an blood prov ided with the m achine w ere u sed , and the r e
su l ts w ere re p o r te d in g ra m s of hem oglobin per 100 g ra m s of blood.
Like the h e m a to c r i t d e te rm in a tio n , the acc u ra cy of th is
m e thod was e s ta b l ish e d by taking six hem oglobin sam p le s f ro m a
s ing le blood sam p le . The s ta n d a rd e r r o r was 0.32 g ra m s hem o-
g lob in /100 g ra m s blood.
35
R ed b lood c e l l count
A s ta n d a rd r e d blood pipette was f illed f ro m the puddled
blood, and a 1:200 dilution was made using 0.6 p ercen t sodium
ch lo r id e a s the d ilu tant. A re d blood ce l l count was m ade in the
acc ep ted c l in ic a l m an n er us ing a Levy h e m o c y to m e te r .
R ed blood c e l l length
C e ll lengths w ere d e te rm in ed f ro m a i r - d r i e d blood s m e a rs
which w ere s ta in ed five m inu tes with W righ t 's blood s ta in . Random
m ic ro sc o p ic f ie ld s w ere brought into focus and a l l c e l ls that would
a line p ro p e r ly , a s the m ic ro m e te r was revo lved through a 180° a r c ,
w ere m e a su re d . T h is was a slow p ro c e s s as often no c e l ls would
be in line in a given fie ld , but since ran d o m n ess was a d e s ira b le
fa c to r , th is m ethod was faithfully pursued . C e ll lengths a r e r e
p o r ted in m ic ro n s .
P l a sm a volum e and blood volum e
P la s m a volum e was done by the dye dilution m ethod using
E a s tm a n 's T-1824 (Evans Blue). The dye was in jec ted d irec tly into
the exposed v e n tr ic le of an an e s th e s iz e d fish by m eans of a 1 ml.
tu b e rc u la r sy r in g e m an ipu la ted by a m ic ro b u re t m an ufac tu red by the
M ic r o - m e t r ic In s tru m en t Company (F igu re 2). A num ber 3 0
3 6
Figu
re
2. M
cro-
inje
ctio
n ap
para
tus.
37
gauge in jec tio n need le was needed to in troduce the dye with no leak-
age of blood during or a f te r the in jec tion . Using a 6,0 m g . /m l .
so lu tion of dye, 0.074 mg. w ere in jec ted into the fish in a to ta l
vo lum e of 0.012 m l. If b leed ing due to the in c is io n , o r during or
a f te r the in jec tion was unusually p rev a len t , the fish was discarded*
Of c o u r s e , th e re was always a sm a ll amount of seepage of blood,
but due to the fas t coagulation t im e of fish b lo o d --a m a t te r of a
few s e c o n d s - - th is w as at a m in im um . It was fe lt that to co u n te rac t
th is e r r o r due to b leeding , the volum e of dye, 0.012 m l. , would not
be su b tra c te d f ro m the final r e s u l t s . The needle was not w ith
draw n fro m the v e n tr ic le until a l l v is ib le co ncen tra tio n of dye was
rem o v e d f ro m the h e a r t . T h is p reven ted leakage of the dye, and
a lso helped sea l the puncture quickly due to the action of undiluted
blood. It was found b es t to rem o v e the needle at the peak of
sy s to le o r beginning of d ia s to le , so the blood would not be squeezed
out of the f r e s h hole*
The in jec ted f ish w ere p laced on th e ir backs in a V -shaped
tro u g h lined with wet gauze , and a r t i f ic ia l r e s p i ra t io n was induced
by m eans of w a te r flowing over th e i r g ills . (F igure 3). W ater f ro m
an a q u a r iu m r e s e r v o i r was led to the f ish by m eans of ru b b e r
tubing and a g la ss tube which was p laced in the f i s h 's mouth.
W ater flowed at the r a te of 15 0 d rops p e r minute* The fish , u n le ss

3 8
Figu
re
3. A
rtifi
cial
re
spir
atio
n ap
para
tus.

39
fit w as deeply a n e s th e s iz e d , would pump the w ate r over the g ills
with r e la t iv e ly n o rm a l o p e rc u la r m ovem ents . If o p e rc u la r m ov e
m en ts w ere a b se n t , s light s t im u la tion on the v e n tra d of the mouth
would c au se a spasm od ic m ovem ent and has ten the r e tu r n of the
r e s p i r a to r y r e f le x e s .
The fish would re m a in in th is position for ten m inu tes ,
although they would usua lly have to be rem o v ed to be re a n e s th e s iz e d
at le a s t once during the period . Ten m inu tes was co n s id e re d suffi-
c ien t t im e to com plete the e n t ire mixing of dye even though the
c i rc u la t io n t im e of the fish was unknown. The ca lcu la ted c irc u la t io n
t im e of O psanus tau was two m inu tes (Brown, 1957), which, if the
tro u t w ere app ro x im ate ly equal, would ind ica te five com plete c i r c u la
tions of the dye w ithin the period allowed.
At the end of the ten m inu tes blood was draw n from the fish
a s d e sc r ib e d above. The blood was then e x p re s se d into a 1 m l, c e n t r i
fuge tube f ro m which a h e m a to c r i t sam ple was rem oved . The r e
m ain ing blood w as cen tr ifug ed at 25 00 RPM for ten m inu tes . The
p la sm a was d ilu ted by adding 40 c m m s of it to 0.5 m l. of d is ti l led
w a te r in a cuvette . This d ilution was re a d in the Spectronic 2 0 at
a w avelength of 65 0 mq. The concen tra tio n of the dye in the un
d ilu ted p la sm a was then d e te rm in ed f ro m a s tan d a rd cu rve m ade
previously by read in g known dilu tions in the c o lo r im e te r .

40
The a c c u ra c y of th is t e s t is unknown since two o r m o re d e
te rm in a t io n s could not be m ade on the sam e f ish , and th e re a r e no
known data of th is type fo r th is sp ec ie s which could be co m p ared .
S p lenec tom ies
F is h to be sp e len ec to m ized w ere a n es th e s ized a s p rev iously
d e s c r ib e d , p laced in the V -sh ap ed trough and a d m in is te re d a r t i f ic ia l
r e s p i r a t io n . A sm a l l in c is io n , about 1.5 cm . long, was m ade by
m eans of a pointed s ca lp e l in the v e n t ra l abdom en slightly p o s te r io r
to a m idpoint betw een the p ec to ra l and pelvic g ird le s . The sp leen
would usually lie beneath th is location . By m eans of a pointed
fo rc e p s , the sp leen w as w ithdraw n through the in c is io n and cut off.
It was found tha t the v e s s e ls se rv in g the sp leen w ere sm a l l , and
th e re was no need of ty ing them off. With the sp leen rem o v ed , the
in c is io n was c lo sed with one su tu re , and the a r e a d r ied with a
sponge and co v e red with collodion. By th is t im e the fish would be
out of the an es th e tic enough to r e tu r n i t to an aquarium . This o p e r
a tion did not ap p ea r to unduly h a rm the fish. F if te en m inu tes a f te r
being re tu rn e d to the tank they showed no signs of ab n o rm a l b e
h av io r and would feed on tro u t p e lle ts .
41
Body w a te r
T o ta l body w a te r , in g ra m s p er 100 g ra in s of body weight,
was d e te rm in e d on f ish whose l i v e r , gall b la d d e r , sp leen , kidney,
and im m a tu re gonads w ere rem o v ed . The fish w ere w eighed to the
n e a r e s t ten th of a g ra m and d r ie d in an oven 95° C. to 105° C. fo r
48 hours* They w e re cooled in a d e s ic c a to r and again weighed, the
lo s s in weight be ing c o n s id e re d as to ta l body w a te r .
The m a in objection to the m ethod would be the fact tha t the
o rg an s w ere rem o v e d p rev io us to the d e te rm in a tio n . The g re a te s t
e r r o r in tro d u ced by th is p ro ced u re would s t i l l be sm all . Using the
m ean weight of the fish without organs as 15.6 g ra m s and the
av e ra g e body w a te r weight as 12.2 g ra m s , it can be d e te rm in ed tha t
the w a te r would co n s ti tu te 7 8 p e rcen t of the body weight. By adding
the w eight of the ex c ised o rg an s , the m ean weight of the wet fish
b eco m es 16.0 g ra m s ; and assu m in g the o rgans to be 90 to 100 p e r
cent w a te r - - a n e x tre m e e s t im a te - - th e to ta l body w a te r would becom e
79 p e rcen t of the body weight. This m eans the e r r o r in troduced by
re m o v a l of th e se o rg an s would be 1.4 pe rcen t at the v e ry m ost.
O rgan w eights
F re s h ly rem o v e d o rgans w ere weighed on a R o lle r -S m ith
b a lan ce and the r e s u l t s r e p o r te d in m i l l ig ra m s .

RESULTS AND DISCUSSION OF PHYSIOLOGICAL VALUES OFTHE NORMAL HATCHERY-RAISED RAINBOW TROUT
The paucity of physio log ical data p erta in ing to fish in g en e ra l ,
and ra inbow tro u t in p a r t i c u la r , m ade it im p e ra tiv e to e s ta b l ish
n o rm a l physio log ica l va lu es th rough the use of la rg e con tro l
g rou ps . To obtain th is physio logical data f ro m sm a l l fish , it was
n e c e s s a ry to d ra s t ic a l ly adapt m ethods em ployed in m am m alian
physiology to the p ro b lem s encoun tered . T hese m odifica tions a r e
p re se n te d in the ex tensive and d e ta iled sec tion en titled ' 'M a te r ia ls
and M ethods.
The data and th e i r s ta t i s t ic a l evaluation p e rta in in g to th is
sec tio n can be found in Appendix II, P a r t A.
O rgan W eights
The a n a ly s is of th e se data on the kidney, l iv e r , and sp leen
w as ap p ro ach ed in the following ways: (1) a s a l in e a r r e g r e s s io n
of o rgan weight on body weight, and (2) organ weights e x p re s s e d as
p e rcen t of body weight.
A ll r e g r e s s io n and c o r re la t io n coeffic ien ts w ere s ta t is t ic a l ly
te s te d , and they p roved to be highly significant. The s tra ig h t l in e s ,
42

43
f i t ted by the le a s t sq u a re s m ethod, v e rify ing th is c o r re la t io n of o r
gan weight on body weight a r e i l lu s t r a te d in F ig u re 4, fo r the kidney;
F ig u re 5, fo r the l iv e r ; and F ig u re 6, fo r the sp leen.
T h us , having p roved the p re m is e tha t o rgan w eights a r e
d ire c t ly r e la te d to body w eight, the p red ic tion equations, including
the s ta n d a rd e r r o r of the e s t im a te , can be s ta ted a s follows:
Kidney:
Y T, 20,43 mg. = -10.50 4- 8.75 x g ram s
L iv e r :
Y +, 40.46 mg, = -38.93 + 12.89 x g ra m s
Spleen:
Y +, 11.53 mg. = -7.93 + 2.97 x g ra m s
Y is the p re d ic te d weight of the organ and x is the given body
weight.
T h e re is no evidence that ex trapo la tion of the data beyond
the ran g e d e te rm in e d ex p e r im en ta lly would be valid; th e re fo re , the
use of th e se equations beyond the range of the g raphs should be
questioned .
When e x p re s s e d in te rm s of o rgan weight as a percen tage of
body w eight, the m ean s of th e se data co llec ted on ten fish a re as
fo llo w s :
240
4 4
LOrv]
oo
OO
m
CO
00oro OOoTt<ovO o
OOoo
00o
CO
aOJtuo
X !tuo•»—II-cjoPQ
Csj rv]K i d n e y W e i g h t ( m i l l i g r a m s )
Figu
re
4, N
orm
al
kidn
ey
wei
ghts
,(D
otte
d lin
es
indi
cate
sta
ndar
d er
ror
of the
es
tim
ate.
)
240
4 5
COrxj
OO
in
CO
ooo oo
vOooo ovOo
00ort*
toscdbJO
X !OJD• H<D£
oPQ
04 CML i v e r W e i g h t ( m i l l i g r a m s )
Figu
re
5. N
orm
al
liver
w
eigh
ts.
(Dot
ted
lines
in
dica
te
stand
ard
erro
r of
the
esti
mat
e.)
100
4 6
00
o
ooo o
COoo
m ooooooO ' *
GQ
scdShtoo
too*<u£
OPQ
S p l e e n W e i g h t ( m i l l i g r a m s )
Figu
re
6. N
orm
al
splee
n w
eigh
ts.
(Dot
ted
lines
in
dica
te
stand
ard
erro
r of
the
esti
mat
e.)
4 7
Kidney:
°*77 g/lOO g. of body weight £ the standard error
of 0.0034 g . / 100 g.
Liver:
1.02 g./lOO g. of body weight +, the standard error
of 0.08 g./lOO g.
Spleen:
0.24 g./lOO g. of body weight +, the standard error
of 0.023 g . / 100 g.
No information on organ weights pertaining to rainbow trout
or members of the family Salmonidae was found in the literature,
although Krumholz (1956) reported data for eight species of warm
water fish which had been exposed to low level radioactive wastes.
His data can be found in Table 8 of this section.
Krumholz's results on the kidney range from 0.11 to 0.98
percent, and on the liver from 0.84 to 3.65 percent. The results
presented herein fall well within the ranges for these organs. The
data on spleen weight reported by Krumholz ranged from 0.06 to
0.14 percent, which is well below that found for the trout, 0.24 per*
cent.
There are two points that should be emphasized in this com
parison of data. F irst, there are definitely species differences
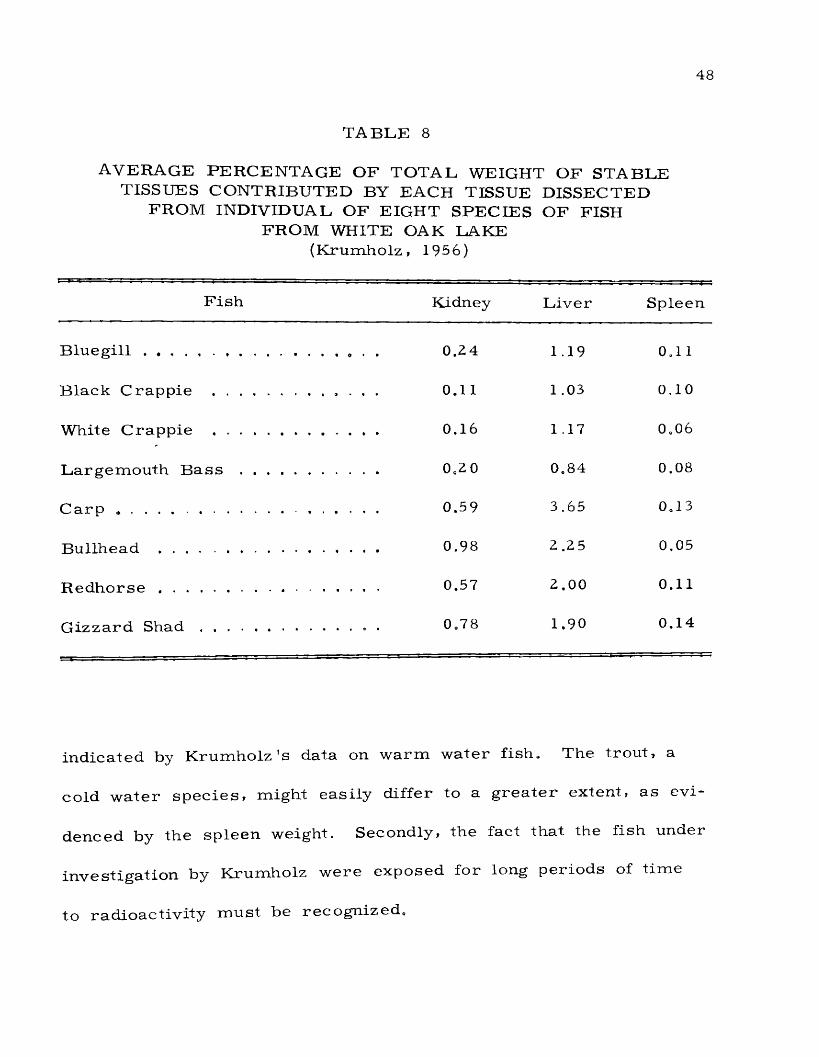
48
T A B L E 8
AVERAGE PERCENTAGE OF TOTAL WEIGHT OF STABLE TISSUES CONTRIBUTED BY EACH TISSUE DISSECTED
FROM INDIVIDUAL OF EIGHT SPECIES OF FISH FROM WHITE OAK LAKE
(K rum holz, 1956)
Fish Kidney Liver Spleen
B lu e g ill ................. .............................. 1.19 0.11
Black Crappie ........................... . . . . 0.11 1.03 0.10
White Crappie ............................... . . . 0.16 1.17 0,06
Largemouth B a s s ........................ . . . 0.20 0.84 0.08
Carp <,...................................... . . . 0.59 3.65 0.13
Bullhead ............................................, . . . 0.98 2 .25 0.05
Redhorse ............................................ , . . . 0.57 2.00 0.11
Gizzard S h a d ................................... . . . 0.78 1 . 9 0 0.14
in d ica ted by K ru m h o lz 's data on w arm w ate r fish . The tro u t , a
cold w a te r s p e c ie s , m ight eas ily d iffer to a g re a te r extent, as ev i
denced by the sp leen weight. Secondly, the fact tha t the fish under
in v es tig a tio n by K rum holz w ere exposed fo r long periods of tim e
to rad io a c tiv i ty m u s t be re c o g n iz e d 0

4 9
Data were obtained on gall bladder and gonad weights, a l
though they were found to be too variable to be of use in this work.
The gall bladder was weighed full of bile, and its weight reflected
the secretion and expulsion of bile which are variables that may or
may not be logically correlated with body weight. Gonad weights
were extremely variable in these young fish due to their being in
various stages of sexual development. Both the gall bladder and
gonad results are presented in Appendix II.
T ota l Body W ater
These data, obtained from ten fish, are handled in the same
manner as the organ weights. Once again the regression and cor
relation coefficients proved to be highly significant, and the following
regression equation was calculated:
Y i . 0,47 g. = -0.62 + 0.82 x
F ig u re 7 i l lu s t r a t e s th is c o r re la t io n betw een to ta l body w a te r on
body w eigh t.
When e x p re s s e d in t e r m s of p e rcen t of body weight, the m ean
of the r e s u l t s d e te rm in e d on ten fish is:
77.4 g./lOO g. of body weight ± , the s tan d a rd e r r o r
of 1,02 g./lOO g.
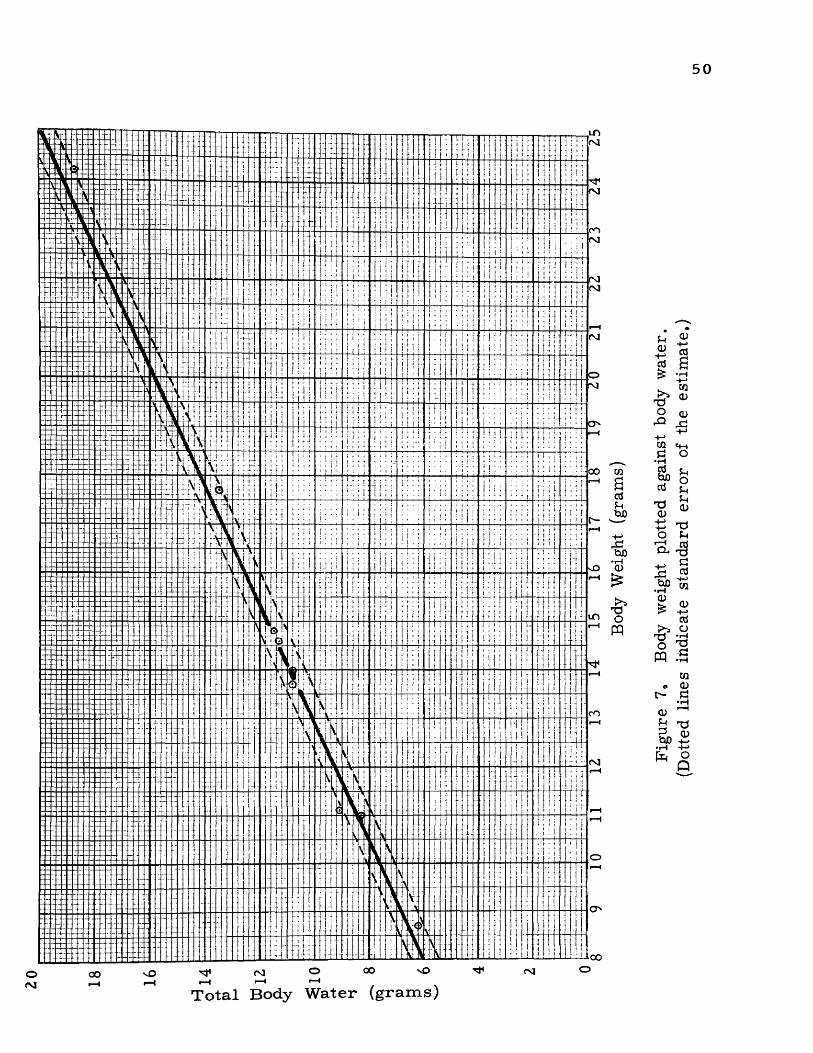
5 0
mt
00
lD
CO
o
00o00n* m o
<— I I— I >— I
T o t a l B o d y W a t e r ( g r a m s )00
01
scdubJO
•I—t <1)
TDOm
Figu
re
7, Bo
dy
wei
ght
plot
ted
agai
nst
body
w
ater
. (D
otte
d lin
es
indi
cate
st
anda
rd
erro
r of
the
esti
mat
e,)
51
Brown (1957), in her recent compilation of published work,
states that the results of water determinations are difficult to com
pare due to the widely differing techniques used by various authors.
After a complete review of the literature* she came to the con
clusion that 1 'fish in general contain about 80 to 85% water, extreme
values ranging from 53 to 89.3%l" These data on the trout, although
below 80 percent, still fall well within the range.
H e mat oc r it s
Hematocrits were found to be 31,8 i, a standard error of
1,39 ml. of red blood cells per 100 ml. of blood, Spector (1956),
in his Handbook of Biological Data, a complete review of all litera
ture, reported an average hematocrit for rainbow trout of 27.2 ml,
R.B.C./lOO ml. of blood with a range in data between 22 ml. to
36 ml./lOO ml.
Hemoglobin
The mean of the hemoglobin determinations on ten fish were
found to have a value of 6.51 ± the standard error of 1.27 g./lOO ml.
of blood. '“Spector (1956) reports for trout a hemoglobin value of
8,5 g ,/l0 0 ml. with a range of 6.2 g. to 11.5 g./lOO ml. Prosser
52
etjal. (1950) gives a range from 8.7 g. to 17.6 g./lOO ml. for fish
in general.
The data reported in this work fall in the lower part of the
range reported by Spector (1956). This may be due in part to the
general adoption of mammalian techniques without the adaptations
necessary for nucleated blood. The usual methods call for a
colorimetric analysis of hemolyzed blood at some point during the
procedure. If the interfering nuclei are not removed prior to this
manipulation, the results will be high. The author made a few
determinations of hemoglobin on nucleated samples and found these
values agreed quite well with the upper range published by Spector.
They also agreed very well with Black's (1955) values of 11.0 g ./
100 ml.
Red Blood Cell Counts
The red blood cell counts on ten fish averaged 1.11 «±, 0.098
million cells/cm m . This agrees very well with Spector's (1956)
value for trout of 1.01 million cells/cm m . with a range of 0,74 to
1.5 million cells/cm m . Prosser et a l. (1950) reports a range for
fish in general of 0.585 to 2.685 million/cmm.

53
Red Blood Cell Lengths
By taking an average length of ten cells/fish and using ten
fish, a value of 14.69 p the standard error of 0.24 was determined.
Prosser et a l. (195 0) gives a value of 16.7 ju for trout. It is inter*
esting to note at this point that Brown (1957) published data on the
eel, 14.6 p. in length and 1.10 million cells/cm m . in number, which
agree closely with the trout data reported here. This is , of course,
no more than an interesting observation.
Plasma Volume and Blood Volume
The regression and correlation coefficients relating plasma
and blood volume to total body weight were found to be highly sig
nificant. The following prediction equations, including the standard
error of the estimate, were calculated*.
Plasma volume:
Y ±. 0,07 ml. = 0.094 + 0.0154 x grams
Blood volume:°. 15
Y 0.08 ml. = frTOS O + 0.023 x grams
When expressed in m illiliters per 100 grams of body weight,
the mean of ten determinations is.
P la s m a volum e:
2.13 m l./lO O g. i , the s ta n d a rd e r r o r of 0.14 ml./lOO
Blood volum e:
3.25 m l . / 100 g. ± the s tan d a rd e r r o r of 0.16 ml./lOO
A lthough no p la sm a o r blood volum e data spec if ica lly r e la te d
to t ro u t could be found in the l i t e r a tu r e , P r o s s e r et a h (1950) r e
p o rted a blood vo lum e fo r te le o s t f ish es in g e n e ra l of 1.5 to 3 p e r
cen t of body w eight. Brow n (1957), in h e r com pila tion of data on
A c tin o p te ry g ii , r e p o r te d a range of 1.4 to 2.8 percen t of the body
w eigh ts .
V a r io u s w o rk e rs have a l l r e p o r te d blood volum e values
low er th an th o se o b se rv ed by th is au thor. The m o st p lausib le ex
p lanation of th is d isc rep an cy is tha t, until th is r e p o r t , blood volum e
e x p e r im e n ts had been p e r fo rm e d on la rg e fish , a l l over 100 g ra m s .
A lso , spec if ic a v e ra g e s w ere ca lcu la ted f ro m sm a ll n um bers of
f ish , usua lly one, two, o r th re e . T h ere is no evidence that young
f ish , such as u se d in th is study, have a la rg e r blood volum e than
adult f ish , although th is poss ib il ity m ust be co n s id e re d in viewing
th e se data . In add ition , the m ethods u sed to obtain the published
r e s u l t s v a r y f ro m d ire c t w ashing to dilution techn iques em ploying a
v a r ie ty of v i ta l dyes . F u r th e r , s ince sp ec ie s d iffe ren ces have been
in d ica ted in o th e r physio log ical data , th e re is r e a s o n to be lieve th is
55
m ay be a cau se of the d isc rep an cy betw een th is work and the
p ub lished data .
RESULTS AND DISCUSSION OF POTASSIUM CHHOMATE- INDUCED CHANGES IN THE PHYSIOLOGICAL VALUES
OF HATCHERY-RAISED TROUT
Median Tolerance Limit
To e s ta b l ish a w orking co n cen tra tio n of p o ta ss ium c h ro m a te ,
e x p re s s e d in t e r m s of the hexavalen t ch rom ium ion , a tw enty-four
h o u r m ed ian to le ra n c e l im it (TLm) was d e te rm in ed . F ig u re 8 i l
lu s t r a te s the l in e a r in te rp o la t io n of the b io a ssay data with a r e s u l t
ing tw en ty -fou r hour T L m of 100 mg. C r / l . G rindley (1946) r e p o r ts
a tox ic ity to ra inbow tro u t us ing po ta ss iu m c h ro m a te , but h is r e
su lts a r e such tha t they a r e im p o ss ib le to in te rp re t in light of th is
e x p e r im e n t. F ro m m and Schiffm an (1958) found a T L m for la rg e -
m outh b a s s of 195 mg. C r / l . using p o ta ss ium ch ro m ate . O shim a
(1931) found tha t young ee ls would su rv ive in co ncen tra tion s of
p o ta ss iu m ch ro m ate equal to 52 0 mg. C r / l . for an av e rag e of 12,4
h o u rs . We can conclude f ro m the above tha t t ro u t , an in to le ran t
s p e c ie s , a r e m o re su scep tib le to the toxic effects of p o tass ium
c h ro m iu m than ee l o r la rg e m outh b a s s .
The b io a ssay produced a leve l at which 5 0 pe rcen t of the
t ro u t die w ithin tw en ty -fou r hours ; but s ince th is work is p r im a r i ly
5 6
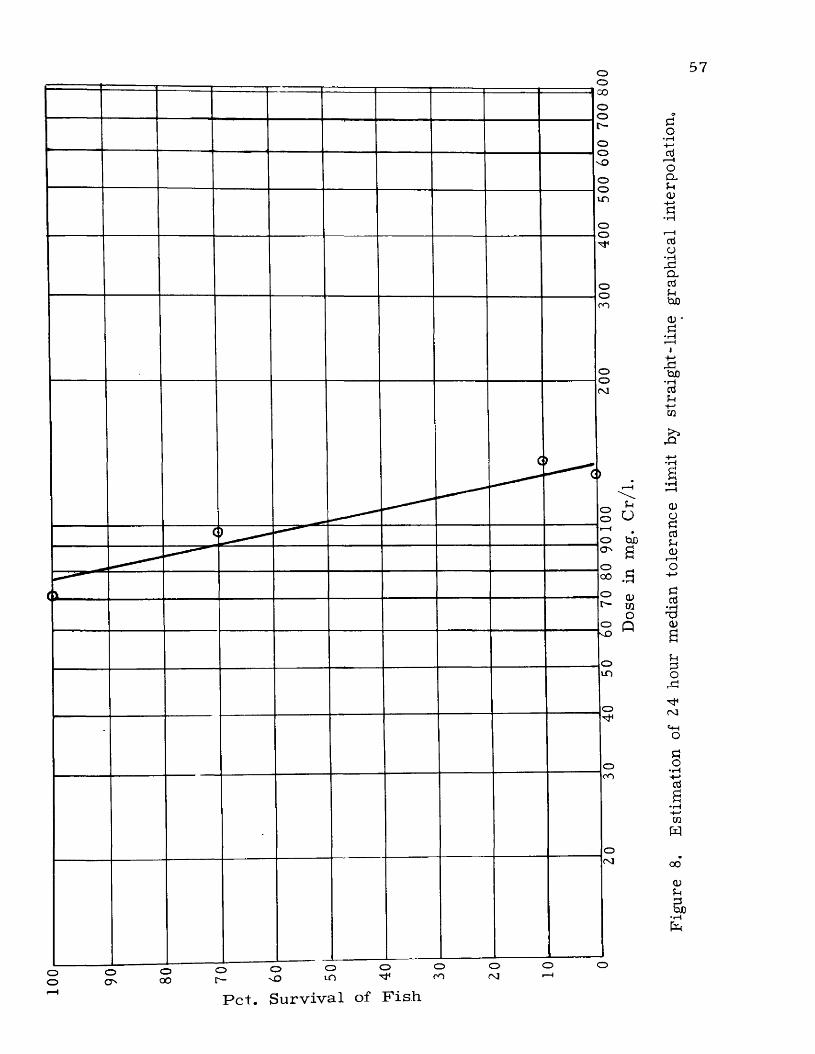
oGOoor-
ooO')
Oo
ooCO
oorvi
oo
o
o
. ° QvO
o
o0O
ooorOoo
mo o[— vDP e t. S u rv iva l of F ish
oC T '
OOO
Figu
re
8. Es
timat
ion
of 24
hour
m
edia
n to
lera
nce
limit
by st
raig
ht-li
ne
grap
hica
l in
terp
olat
ion.

58
a im ed at le v e ls of ch ron ic tox ic ity , a co n cen tra tio n of 2 0 p e rcen t of
the T L m , o r 2 0 m g. C r / l . was a r b i t r a r i ly chosen.
Tracer Experiments
Once th e w orking le v e l was e s tab l ish ed , t r a c e r ex p erim en ts
w ere done to find the ta rg e t t i s s u e s . A q uaria w ere se t up using
51both the s tab le ch ro m iu m and the rad io ac tiv e C r , so that each
m i l l i l i t e r of w a te r conta ined 18.6 jig of ch rom ium with an activ ity
of tw elve counts p e r m inute . T h ree fish w ere exposed to th is con
c e n tra t io n fo r tw en ty -fo u r h o u rs , a f te r which they w ere sa c r if ic e d ,
and the sp leen , l iv e r , ga ll b la d d e r , and a sec tion of the caudal
peduncle w ere ana lyzed . The caudal peduncle was u sed as a co n tro l,
s ince i t i s p redom inan tly m u sc le t is su e ; th u s , th e re was no re a so n
to su sp e c t it to co n ce n tra te the ch rom ium .
E x p re s s e d in t e r m s of m ic ro g ra m s of ch rom iu m /10 0 mg, of
t i s s u e and a s a m ean count per m inu te /100 g ra m s of t i s s u e , the r e
su lts a r e shown in Table 9.
A n a ly s is of v a r ia n c e m ethods showed tha t the sp leen and gall
b la d d e r w ere s ign ifican tly m o re active than the caudal peduncle,
w h e rea s the kidney and l iv e r did not d iffer f rom the con tro l.
B ased upon the above in fo rm atio n , the path of the ch ro m iu m
ion th rough the f ish was postu la ted . The ch rom ium ion, having
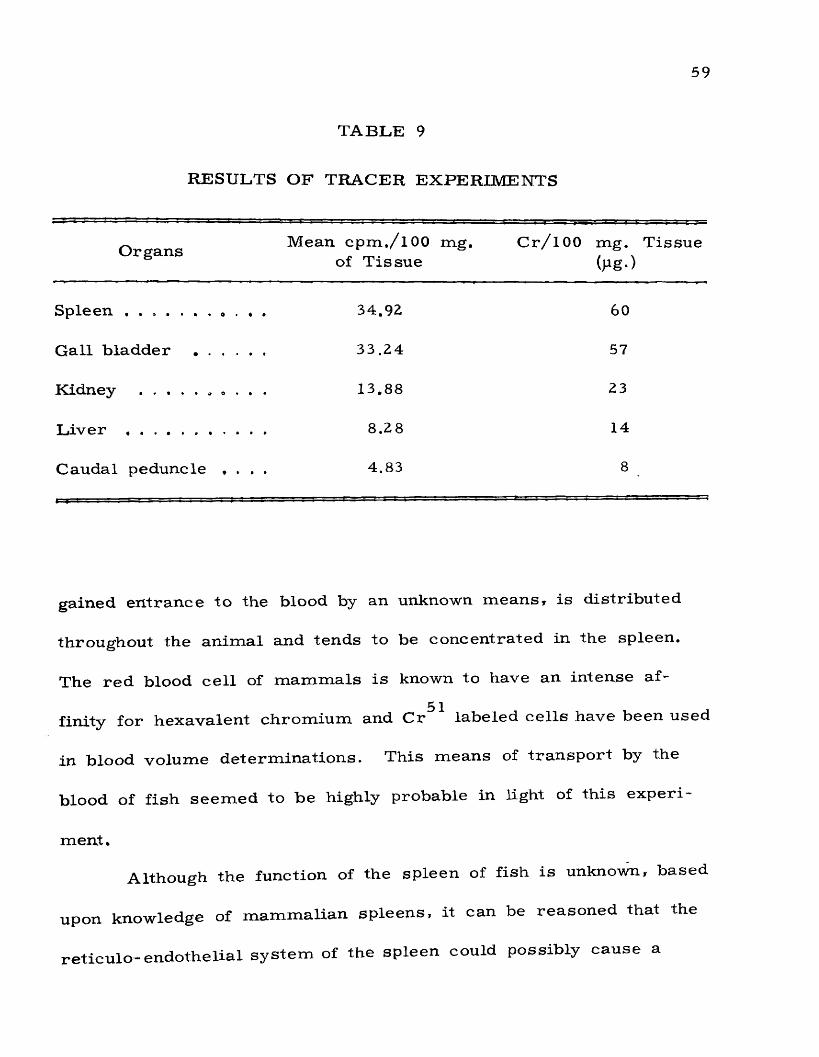
59
T A B L E 9
RESULTS OF TRACER EXPERIMENTS
Organs Mean cpm./lOO mg. of Tissue
C r /l 00 mg. Tissue
Spleen ............................ 34.92 60
Gall bladder . . . . . . 33.24 57
Kidney ............... „ . 13.88 23
Liver ........................ ... 8.28 14
Caudal peduncle . ,» • • 4.83 8
gained entrance to the blood by an unknown means, is distributed
throughout the animal and tends to be concentrated in the spleen.
The red blood cell of mammals is known to have an intense af-
51finity for hexavalent chromium and Cr labeled cells have been used
in blood volume determinations. This means of transport by the
blood of fish seemed to be highly probable in light of this experi
ment.
Although the function of the spleen of fish is unknown, based
upon knowledge of mammalian spleens, it can be reasoned that the
reticulo-endothelial system of the spleen could possibly cause a
60
breakdow n of the c h ro m iu m -la d e n c e l ls with a r e le a s e of ch ro m iu m
p ro d u c ts into the e ffe ren t sp len ic v e s s e l which leads d irec tly to the
l iv e r . The l iv e r could then e lim in a te th is ch ro m iu m product by way
of the b ile . A lthough th e re was no evidence tha t the l iv e r concen
t r a t e d c h ro m iu m above the level found in the nonspecific m uscle
t i s s u e , the ga ll b la d d e r , including the b ile , im p lica ted th is organ as
a path of e l im in a tio n of ch ro m iu m , F ro m m and Schiffman (1958)
th e o r iz e d tha t i t w as th is c h ro m iu m -la d en b ile which cau sed the
ex tensive in te s t in a l dam age that w as o bserved in the la rg e mouth b a s s .
Although the kidney was not a s so c ia te d with ch rom ium r e
m oval by ev idence g a th e red in th is ex p e r im en t, n e i th e r did the ev i
dence om it it a s a pathway. P o ss ib ly , like the l iv e r , it is an
ac tive ro u te , but does not co n cen tra te the ch ro m ium within i ts t i s
su es . A n a ly s is of u r in e could be done to enlighten th is hypothesis.
Org a n W eights and T o ta l Body W ater E x p e r im en ts
T h us , having defin ite ly im p lic a te d the spleen and liv e r and
possib ly the kidney, s tu d ie s on th e se o rg an s and the to ta l body w ater
w ere done to d e m o n s tra te changes in the weight of th ese o rgans and
changes in w a te r co m position due to exposure to approx im ate ly
2 0 m g, C r / l . It was found in co m p arin g the data f ro m five fish so
exposed with the r e g r e s s io n lin es of the n o rm a l rainbow tro u t ,
61
that no differences could be detected under the experimental con
ditions .
Results of Blood Experiments
H e m a to c r i ts w e re d e te rm in ed on four of the above five fish ,
and the r e s u l t s av e ra g e d 54 m l./lO O m l. a s co m p ared to the 31.8
mlo/lOO m l. of the n o rm a l tro u t . In light of the foregoing, it was
decided to study the blood in g en e ra l and the cau se s fo r the r i s e in
h e m a to c r i t in p a r t ic u la r . Since the m am alian sp leen ac ts a s a
r e s e r v o i r fo r r e d blood c e l l s , r e le a s in g those ce l ls in tim e of
s t r e s s , a study of the sp lenic re la t io n sh ip s to the h e m a to c r i t was in
o rd e r . The following ex p e r im en t was designed to an sw er the q u es
tions posed above.
In tac t and sp len ec to m ized fish w ere kept in tap w ate r fo r
tw en ty -fo u r h o u rs . This was done to allow op era ted fish to r e
c u p e ra te . A f te r th is tw en ty -fo u r ho u r pe riod (1) ten n o rm a l fish
w ere exposed to app ro x im ate ly 2 0 mg, C r / l . (norm al ch ro m iu m
group); (2) ten sp len ec to m ized fish w ere kept in tap w a te r (sp len ec
to m ized c o n tro l group); and (3) ten sp lenec tom ized co n tro ls w ere
exposed to app ro x im ate ly 2 0 mg. C r / l B (spelenectom ized ch rom iu m
group). S am ples w ere obtained fo r a l l th re e groups a f te r twenty -
four h o u rs fo r the following d e te rm in a tio n s : (1) length , (2) weight,
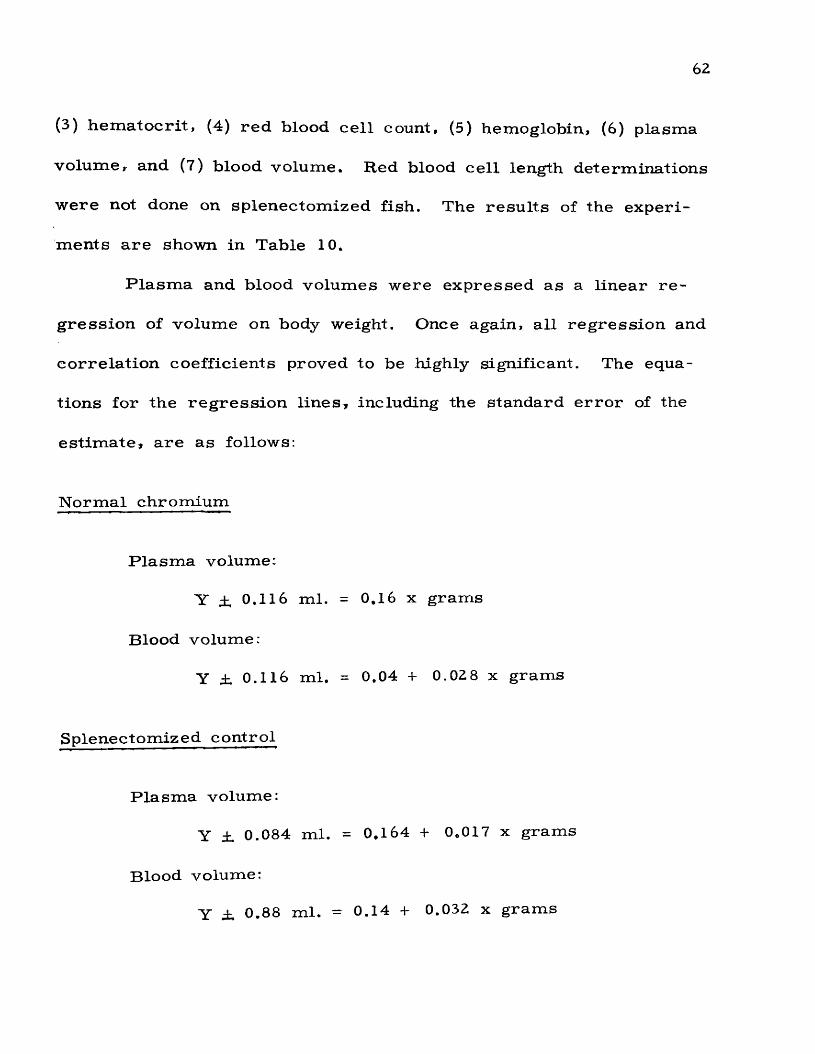
62
(3) hematocrit, (4) red blood cell count, (5) hemoglobin, (6) plasma
volume, and (7) blood volume. Red blood cell length determinations
were not done on splenectomized fish. The results of the experi
ments are shown in Table 10.
Plasma and blood volumes were expressed as a linear re
gression of volume on body weight. Once again, all regression and
correlation coefficients proved to be highly significant. The equa
tions for the regression lines, including the standard error of the
estimate, are as follows:
Normal chromium
Plasma volume:
Y ±, 0.116 ml. = 0.16 x grams
Blood volume:
Y i, 0.116 ml. = 0.04 + 0.02 8 x grams
S p lenectom ized c o n tro l
Plasma volume:
Y i 0.084 ml. = 0.164 -1* 0.017 x grams
Blood volum e:
Y i. 0.88 ml. = 0.14 + 0.032 x grams
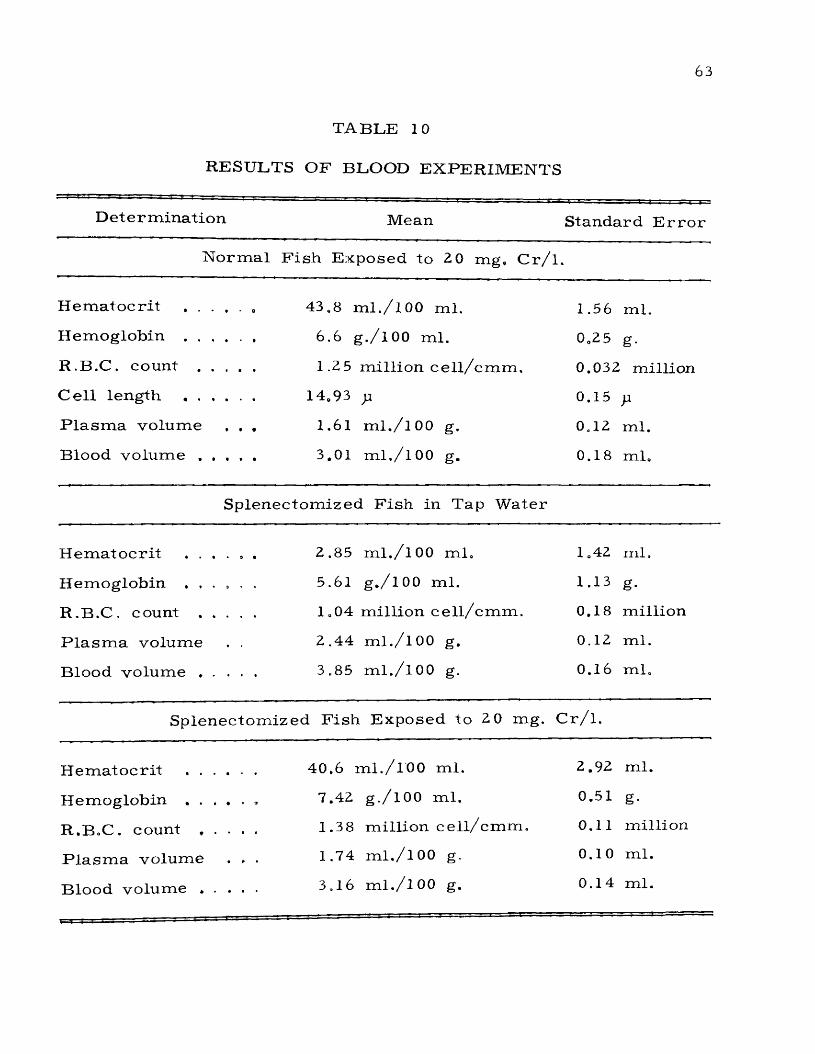
63
TABLE 10
RESULTS OF BLOOD EXPERIMENTS
D ete rm in a tio n Mean S tandard E r r o r
N o rm a l F is h E xposed to 2 0 mg, C r / l ,
H e m a to c r i t . . . . . .
H em oglobin ...................
R .B .C . count ...............
C e l l length ...................
P la s m a vo lum e . , .
Blood vo lum e . , . , .
43.8 m l . / 100 ml.
6.6 g./lOO ml.
1.25 m illion c e l l /c m m .
14,93 yx
1.61 ml./lOO g.
3.01 m l . / 100 g.
1.56 ml.
0.25 g.
0.032 m illion
0.15 ) i
0,12 ml.
0.18 m l.
Sp lenectom ized F ish in Tap W ater
H e m a to c r i t . . . . . .
H em oglobin . . . . . .
R .B .C . count . . . . .
P la s m a volum e . .
2.85 ml./lOO m l.
5.61 g . / 100 m l.
1.04 m illion c e l l /c m m .
2.44 ml./lOO g.
1.42 ml.
1.13 g.
0.18 m illion
0.12 ml.
Blood v o l u m e ............... 3.85 m l./lOO g. 0.16 m l,
S p lenectom ized F ish E xposed to 2 0 mg. C r / l .
H e m a to c r i t . . . . . . 40,6 ml./TOO m l. 2,92 ml.
H em oglobin ............... ... 7.42 g./lOO m l. 0.51 g.
R .B .C . count ............... 1.38 m illion c e l l /c m m . 0.11 m illion
P la s m a vo lum e . , . 1.74 ml./lOO g. 0.10 m l.
B lood v o l u m e ............... 3.16 ml./lOO g. 0.14 m l.
64
Splenectomized chromium
P la s m a volum e:
Y i , 0.069 m l. = 0.05 + 0.015 x g ra m s
Blood volum e:
Y ± , 0o077 = 0.18 + 0.022 x g ram s
The r e g r e s s io n lines fo r the p la sm a volum e data a r e plotted
in F ig u re 9* and fo r the blood volum e data in F ig u re 10.
The r e s u l t s of th e se ex p e r im en ts w ere com p ared among th e m
se lv es and with the n o rm a l tro u t da ta . A nalys is of v a r ia n c e , co-
v a r ia n c e , and t - t e s t s w ere u sed with the following r e s u l t s .
H em a to c r i t
The sp len ec to m ized and in tac t an im als exposed to ch rom ium
had h e m a to c r i t s s ignificantly h igher than those f ish , both sp len ec to
m ized and in tac t, not exposed to ch rom ium .
H em oglobin
The sp len ec to m ized an im a ls exposed to ch ro m iu m had a s ig
n ifican tly h igh e r hem oglobin content than did those sp lenec tom ized
figti tha t w ere not exposed. T h ere was no evidence of d iffe ren ces
b e t w e e n o t h e r g r o u p s .
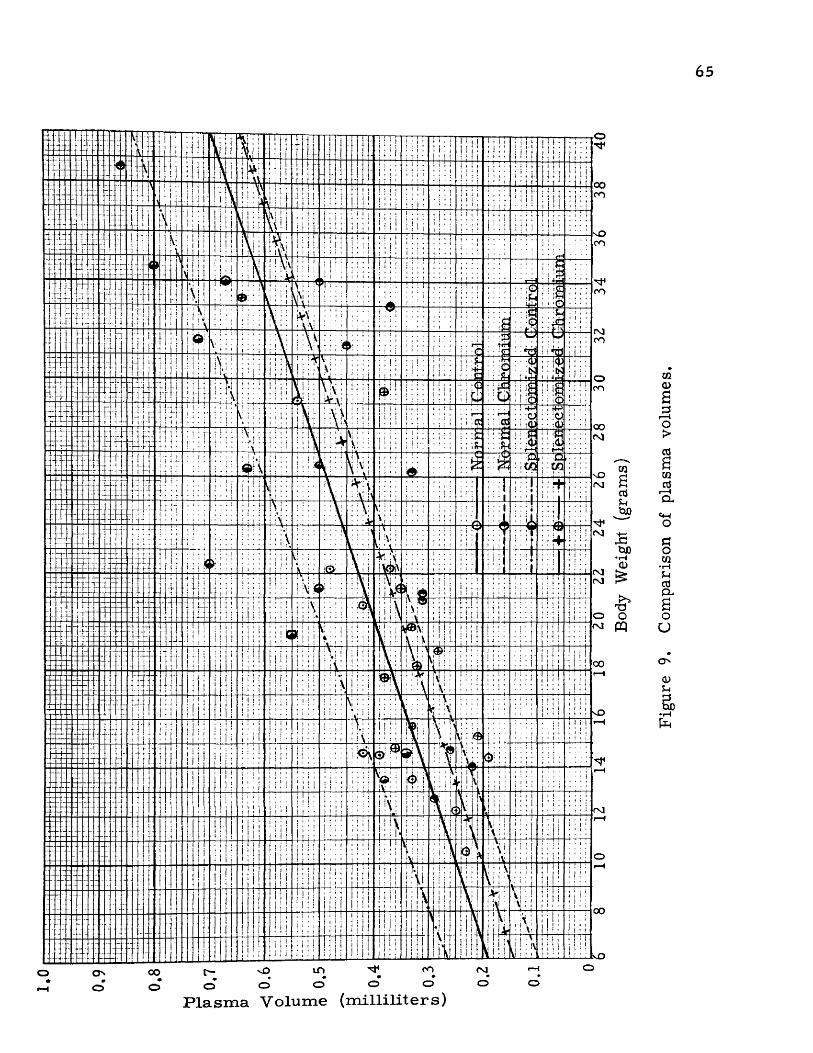
65
o
00on
sOon
jrH
oon
r-H
00
o
00
ovO lD ^o o o o o
P l a s m a V o l u m e ( m i l l i l i t e r s )
on00o
EdanjShtuo
tuo•rH
CD
t3^ PQ
Figu
re
9. C
ompa
riso
n of
plas
ma
volu
mes
.
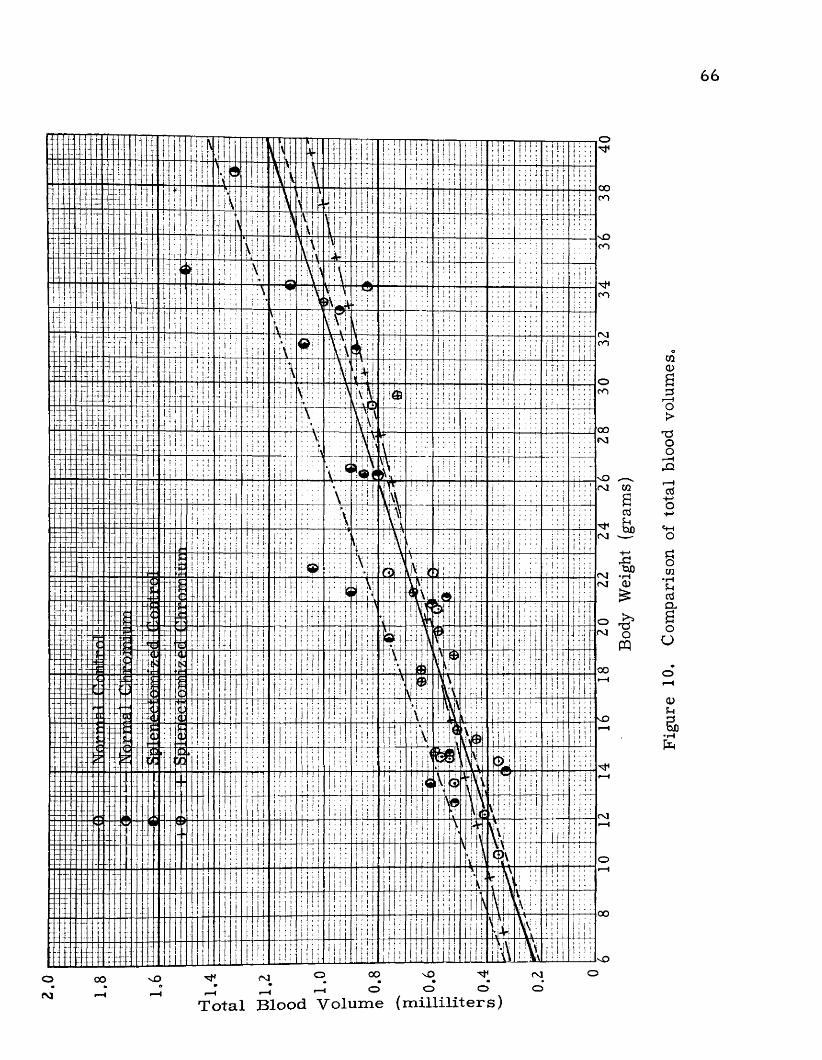
6 6
It i
- O O OO vT> fM
, - H - H O o O O
T o t a l B l o o d V o l u m e ( m i l l i l i t e r s )
Figu
re
10.
Com
pari
son
of to
tal
bloo
d vo
lum
es.

6 7
Ked b lood c e l l count
A cco rd in g to the a n a ly s is of v a r ia n c e , the sp lenec tom ized
a n im a ls exposed to ch ro m iu m had sign ificantly h ig h e r blood ce l l
counts th an the in tac t and sp len ec to m ized co n tro ls . By " t " t e s t ,
the n o rm a l a n im a l exposed to ch ro m iu m a lso had a h igher blood
count th an the n o rm a l count.
R ed b lood c e l l length
By " t " te s t , the n o rm a l an im a l exposed to ch rom ium had
s ign ifican tly l a r g e r blood c e l ls than the n o rm a l tro u t in tap w ater .
No m e a s u re m e n ts w ere m ade on sp lenec tom ized fish .
P la s m a vo lum e and blood volum e
By c o v a r ia n c e , the sp lenec to m ized fish in tap w ater had a
s ign ifican tly h ig h e r p la sm a and blood volum e than the sp lenec tom ized
f ish exposed to ch ro m iu m . The ex p e r im en ta l evidence did not show
a d iffe ren ce in the o th e r g roups .
D iscu ss io n of the In c re a s e in H em ato crit
The highly s ign ifican t in c re a s e in h e m a to c r i t s of n o rm a l tro u t
exposed to ch ro m iu m could be b rought about in th re e g en e ra l ways:
68
(1) by an in c re a s e in c e l l s iz e , (2) by an in c re a s e in ce ll nu m b er,
and (3) by a d e c re a s e in p lasm a volum e. Since th e re was a highly
s ign if ican t in c re a s e in c e l l s iz e , th is m a t te r will be d iscu ssed f i r s t .
/LIf n o rm a l t ro u t have a r e d blood c e l l count of 1.11 x 10
c e l l /c m m . and a h e m a to c r i t of 31.8, then (1) th e re a r e 1.11 x 10¹¹
c e l ls /1 0 0 m l. of blood and (2) each m i l l i l i te r of the packed re d
9blood c e l ls con ta ins 3.5 0 x 10 ce l ls . In the n o rm a l trou t exposed
to ch ro m iu m , u s ing the sam e m a th e m a tic s , it was found that (1) th e re
a r e 1.25 x 10*1 ce l l /1 0 0 m l . , and (2) tha t each m i l l i l i te r of the
9packed r e d blood c e l ls con ta ins 2.85 x 10 c e l ls . A ssum ing that the
change in n u m b e rs of packed c e l ls was due to change in volum e only,
the 1.11 x 10¹¹ ce l ls in the n o rm a l tro u t , if changed in volum e like
those in the ch ro m iu m -ex p o sed fish , would cause a r i s e in h em a to c r it
f ro m 31.8 to 3 8.9. T h e re fo re , the in c re a s e in ce ll volum e accounts
for 5 9 p e rcen t of the to ta l r i s e in h em a to c r i t . If the c e l l num ber
in c re a s e d by 1.40 x 10*° ce l l /1 0 0 m l. of blood and, a s ca lcu la ted
9above, th e re a r e 2.85 x 10 ce l l per m i l l i l i te r of packed c e l ls , then
the in c re a s e in nu m b er would account fo r 4.9 m i l l i l i te r s of packed
c e l ls , o r 41 p e rcen t of the in c re a s e in h em a to c r i t . Since th ese p e r
cen tag es w ere ca lcu la ted f ro m m e an s , the s tan dard e r r o r of th e se
m e a n s m u s t be kept in m ine when contem plating th e se r e s u l t s .

69
When the h e m a to c r i t of an an im al in c re a s e s s ignifican tly , the
blood, vo lum e m u st in c re a s e a n d /o r the p lasm a volum e m ust d e
c r e a s e , U nfortunate ly , n e i th e r of th ese events could be shown to
o ccu r by s ta t i s t i c a l exam ination of the blood and p lasm a volum e r e
su lts . T h e r e fo r e , although changes m u s t occu r , they a re too sm all
to be m e a s u re d by the m ethod u sed h e re in .
In light of the above ev idence , it can be concluded that a p
p ro x im ate ly 59 p e rcen t of the in c re a s e in h em a to c r i t due to exposure
to p o ta ss iu m c h ro m a te is due to an in c re a s e in ce l l volume and ap
p rox im ate ly 41 pe rcen t of the in c re a s e is due to in c re a s e in n um
b e r of c e l ls . No evidence of a change in p lasm a or blood volum e
could be de tec ted .
D iscu ss io n of the C au ses of the Red C ell Volume Change
The r e a s o n s fo r the r e d ce l l volum e change w ere not con
s id e re d ex p e r im en ta lly in th is study. T h eo re tic a l ly , th is in c re a se
in vo lum e could be cau sed by a s t r e s s re a c t io n such a s postu la ted
by Irv ing , B lack , and Safford (1941). They found, using tw enty-five
ra inbow tro u t , e ry th ro c y te s would sw ell 1 to 21 p e rcen t , with an
a v e ra g e sw elling of 10 p e rcen t , when subjected to tensions of carbon
dioxide above 10 m m B Hg. The sw elling of the re d blood ce l ls was
70
found to be m o re in ten se than would be expected if the CO^ tension
was the only v a r ia b le which d e te rm in ed volum e change.
In the ch ro m iu m e x p e r im en ts h e re in , ca rbo n dioxide was
not a fa c to r . Using M o o re 's (193 9) g raph s in connection with the
a lka lin i ty and pH of the so lu tions , ca rb on dioxide was never d e
te c te d in m e a su ra b le am oun ts .
A n o ther cau se of in c re a s e in volum e could be due to the
affinity of the e ry th ro c y te s for ch rom ium . If the ch rom ium
e n te r s the r e d c e l l , the osm otic co ncen tra tio n m ight be a l te re d
su ffic ien tly to cau se w a te r to be d raw n into the ce ll . Since the
m o le c u la r fo rm of the ch ro m iu m com plex in the blood and in the
r e d blood c e l l is unknown, ca lcu la tion of the am ount of ch rom ium
n e c e s s a ry to change the osm otic p r e s s u re in such a way as to
cause th is in c re a s e in volum e was not undertaken .
D iscu ss io n of the Role of the Spleen in the In c rea se in C e ll N um ber under P o ta s s iu m C hrom ate S t re s s
The m a m m alian sp leen is known to s to re e ry th ro c y te s for
r e le a s e into the c i rc u la t in g blood during t im e s of s t r e s s . The
sp len ec to m ized f ish ex p e r im en ts w ere designed to d em o n s tra te
w hether the f ish sp leen added e ry th ro c y te s to the c i rc u la tin g blood
u n d e r p o ta ss iu m ch ro m a te s t r e s s . The sp lenec tom ized fish under
71
c o n tro l conditions did not show a d ifference in h e m a to c r i t , h em o
globin, o r c e l l count when co m p ared to n o rm a l con tro l fish . The
sp len ec to m ized fish under p o ta ss iu m ch ro m a te s t r e s s (20 mg. C r / l . )
did show a s ign ifican t in c re a s e in h e m a to c r i ts and re d ce l l count
above the sp len ec to m ized and in tac t co n tro ls . The hem oglobin in
c r e a s e d s ign if ican tly above the leve l of the sp lenec tom ized con tro l
f ish , but not of tha t of the in tac t con tro ls . None of the va lues d e
te rm in e d on ch ro m iu m -e x p o se d sp lenec tom ized fish deviated s t a t i s
t ic a l ly f ro m th o se of the ch ro m iu m -ex p o sed n o rm a l fish.
It can be concluded f ro m the foregoing evidence tha t the
p re se n c e of the sp leen is not n e c e s s a ry to in c re a s e the h em a to c r i t
under c h ro m iu m s t r e s s , since th e re was no d ifference in effects
w hether the e x p e r im e n ts w ere p e rfo rm ed on sp lenec tom ized or in
ta c t fish .
D iscu ss io n of the P a r t P layed by the P o ta s s iu m Ion in P o ta s s iu m C h ro m a te Toxicity
The r e s u l t s so f a r have been e x p re s se d in te rm s of m i l l i
g ra m s of c h ro m iu m ion p e r l i te r of w ate r even though the compound
u sed throughout th is work was po ta ss ium ch ro m a te , Since po tass ium
ch ro m a te does con ta in co n s id e rab le am ounts of po tass ium ion, a
f u r th e r study was un d ertak en to co n s id e r i t s effect on the foregoing
r e s u l t s .
72
The group of fish u sed in th is exp erim en t was kept in con
c re te tan k s and fed t ro u t p e l le ts p r io r to the tim e of i ts a r r iv a l at
the la b o r a to r y , w h e re a s a l l o th e r f ish u sed throughout th is study
w e re tak en f ro m holding ponds; thus* they w ere dependent on n a t
u r a l food. T h is fac t ca l led fo r the d e te rm in a tio n of new con tro l and
ch ro m iu m ^ ex p o sed v a lu es of the h em a to c r i t . In addition, ten fish
w ere exposed to a po ta ss iu m ch lo ride solution of a co ncen tra tion
equal to 29.8 m g. K /l , The co ncen tra tio n of the p o ta ss iu m ion in
the p o ta ss iu m ch lo rid e solution was equal to i ts concen tra tion in the
p o ta ss iu m c h ro m a te solution. The r e s u l t s a r e shown in Table 11.
f,T fr te s t s fa iled to show any evidence of a d ifference b e
tw een the p o ta ss iu m ch lo rid e -ex p o sed fish and the con tro l and
ch ro m iu m -e x p o se d fish . The v a r ia n c e (85.55) of the po tass ium
ch lo r id e -ex p o sed sam p le s w ere s ignificantly h igher than the n o rm al
sam ples* and it was a s su m e d that th is was an indication of a s ta te
of change. It is in te re s t in g to note tha t a sam ple of fish exposed
to 6.6 mg. C r / l . , the low est co n cen tra tion of ch rom ium m e a su re d
that would in c re a s e the h e m a to c r i t to 43.8 ml./lOO m l., a lso had a
highly s ign ifican t v a r ia n c e (258.75). P e rh a p s th is in c re a s e in v a r i
ance of s a m p le s can be expec ted at concen tra tions which a re ju s t
s tro n g enough to cau se an in c re a s e in h em a to c r i t in only p a r t of the
f ish . If th is a ssu m p tio n is t ru e , then the p o ta ss iu m ion, in addition
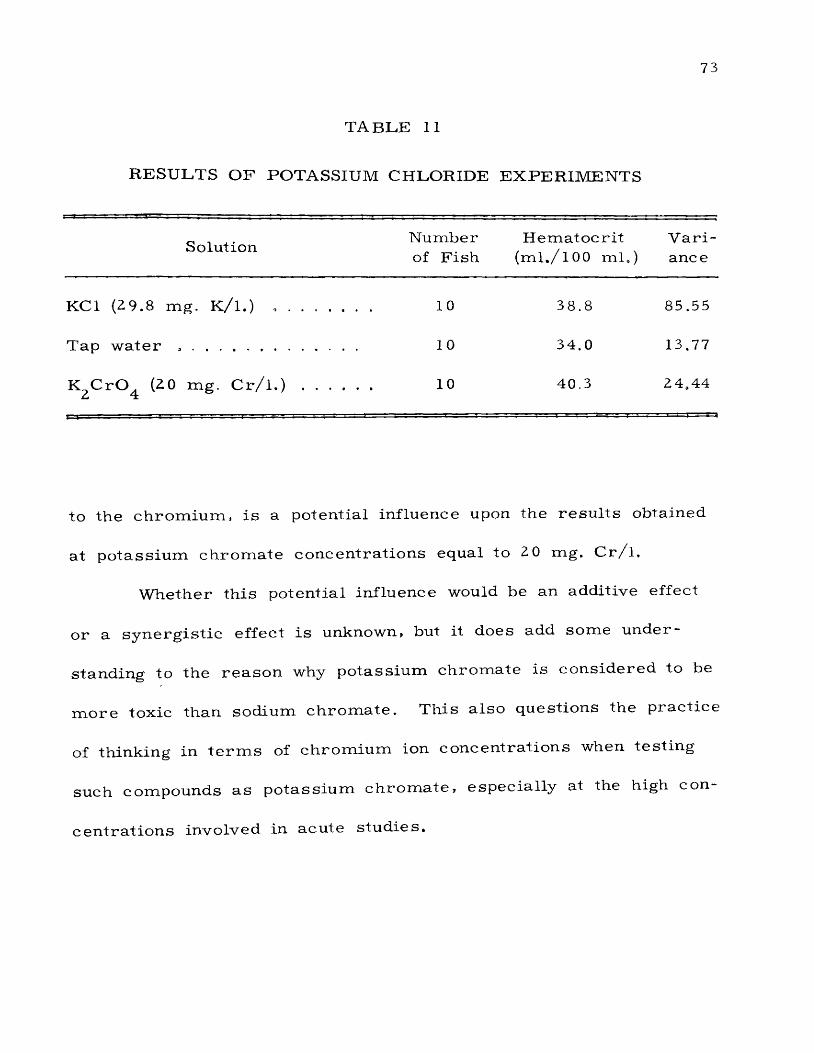
73
T A B L E 11
RESULTS OF POTASSIUM CHLORIDE EXPERIM ENTS
SolutionN um ber H em ato c r i t V a r i of F ish ( m l . / 100 m l . ) ance
KC1 (29.8 mg. K /l .) , ...................... 10 38.8 85.55
Tap w a te r ................................................. 10 34.0 13.77
K C r O . (20 mg. C r / l . ) ...................
T1 r-BT ii i— ■ » 1 ■ 1 ■ !— . 1 1 i ■—■ ■
10 40.3 24,44
to the ch ro m iu m , is a po tentia l influence upon the r e s u l t s obtained
at p o ta ss iu m ch ro m a te co n cen tra tio n s equal to 2 0 mg, C r / l ,
W hether th is potentia l influence would be an additive effect
o r a s y n e rg is t ic effect i s unknown, but it does add som e u n d e r
s tanding to the r e a s o n why p o ta ss ium ch ro m ate is co n s id e red to be
m o re toxic than sodium c h ro m a te . T h is a lso questions the p rac tice
of th inking in t e r m s of ch ro m iu m ion con cen tra tion s when te s t in g
such com pounds as p o ta ss iu m c h ro m a te , espec ia lly at the high con
c e n tra t io n s involved in acute s tud ies .
7 4
The H em a to c r i t a s an Index of T oxicity
Once having d e m o n s tra te d tha t the h e m a to c r i t in c re a se d in
f ish exposed to p o ta ss iu m ch ro m a te , it was then undertaken to d e
te rm in e the low est co n cen tra tio n of ch rom ium at which th is change
took p lace . The in fo rm atio n in Table 12, including the r e s u l t s of the
n o rm a l co n tro l group and the n o rm a l ch ro m iu m group, a r e plotted
in F ig u re 11.
The length of the lines extending above and below the points
p lo tted in F ig u re 11 a r e equal to two t im e s the s tan d a rd e r r o r of
the m ean. By co m p arin g th ese l in e s , a rough e s t im a te of s ta t is t ic a l
d if fe ren ces can be m ade.
F r o m th is g raph we can conclude that the h em a to c r i t value
is in c re a s e d a t 1.4 mg. C r / l . and re a c h e s i t s m ax im um r i s e in
value a t a point betw een 2 and 4 mg. C r / l .
T h is in fo rm atio n is in te re s t in g to the s t r e a m pollution b io lo
g is t b e c a u se , a lthough the 24 -ho u r T L m is 100 mg, C r / l . , in
r e a l i ty , co n cen tra tio n s betw een 2 and 4 mg. C r / l . c au se ac tua l
p h ys ica l change to occur w ithin the tro u t .
Since the d e te rm in a tio n of the h em a to c r i t i s a s im p le p ro
ce d u re re q u ir in g a m in im um of equipm ent, it would be well worth
the in v es tig a tio n to d e te rm in e w hether th is r i s e in h em a to c r i t could
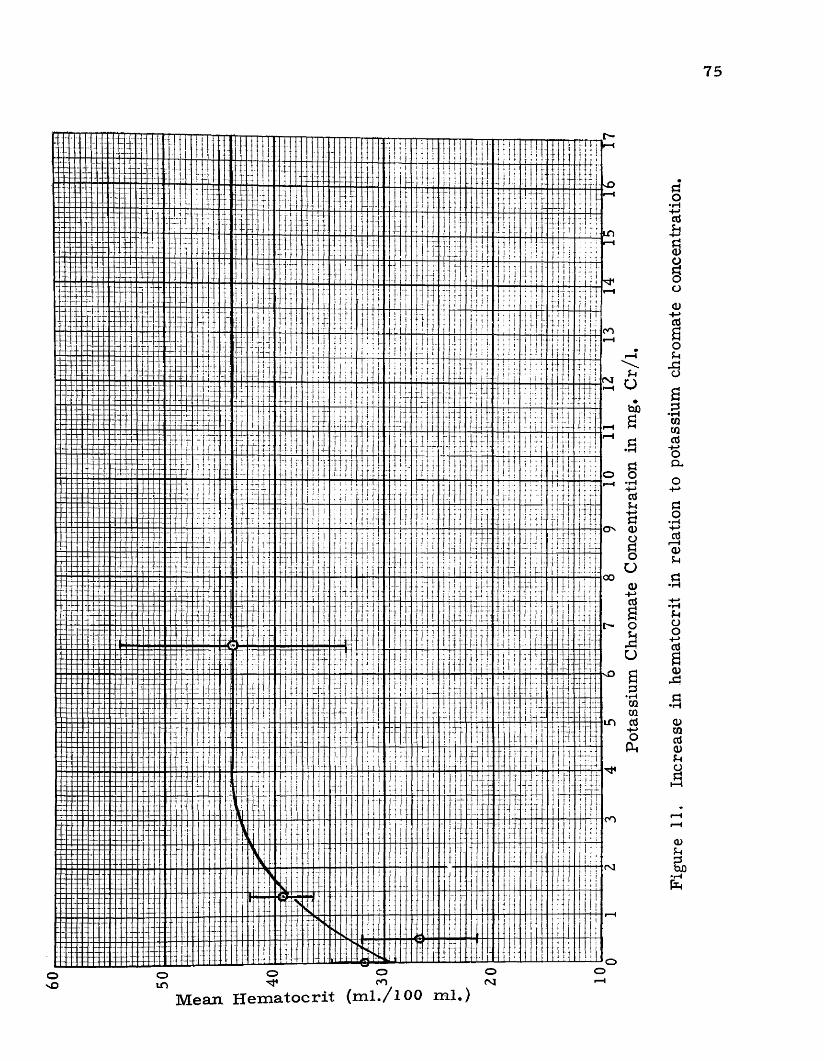
7 5
M ean H em a to c r i t (ml./lOO m l.
Figu
re
11.
Incr
ease
in
hem
atoc
rit
in re
latio
n to
pota
ssiu
m
chro
mat
e co
ncen
trat
ion.
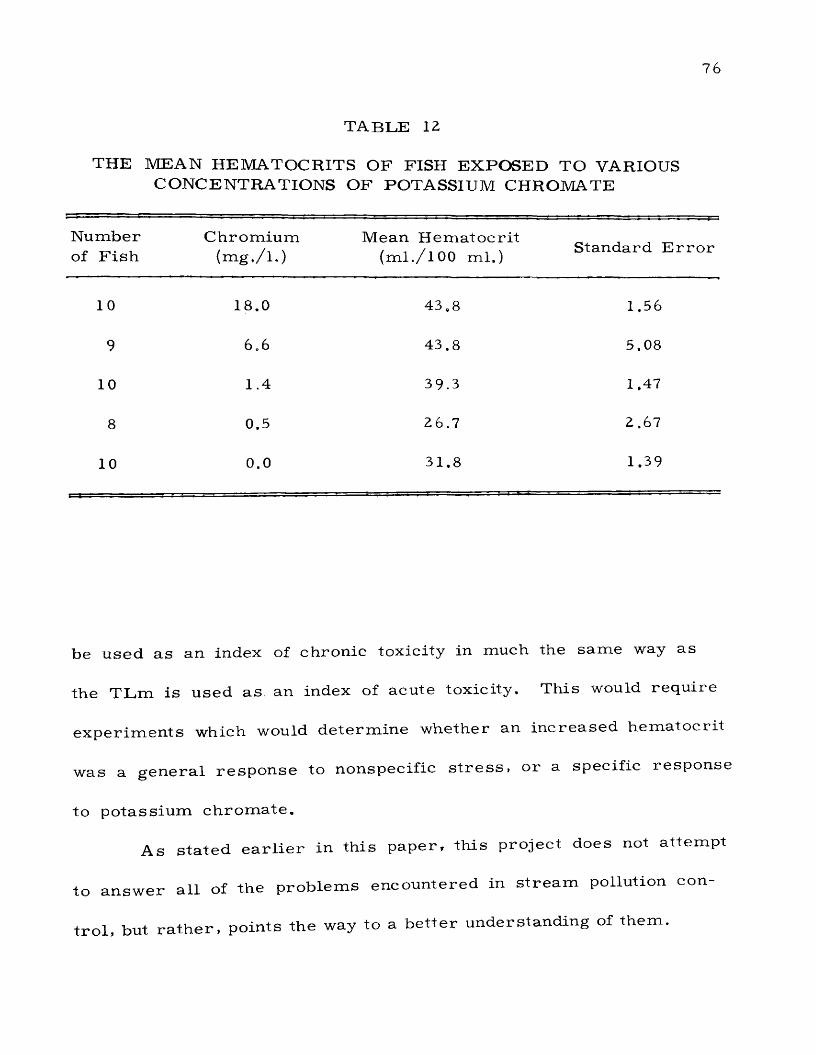
76
T A B L E 12
THE MEAN HEMATOCRITS OF FISH EXPOSED TO VARIOUS CONCENTRATIONS OF POTASSIUM CHROMATE
N um ber of F is h
C h ro m iu m(m g ./ l .)
M ean H em a to c r i t (ml./lOO m l.) S tandard E r r o r
10 18.0 43,8 1.56
9 6 *6 43.8 5.08
10 1.4 39.3 1.47
8 0,5 26.7 2.67
10 0.0 31.8 1.39
be u se d a s an index of ch ron ic tox icity in much the sam e way as
the T L m is u sed a s an index of acu te toxicity . This would re q u ire
ex p e r im en ts which would d e te rm in e w hether an in c re a se d h em ato c r i t
was a g e n e ra l re s p o n s e to nonspecific s t r e s s , o r a specific re sp o n se
to p o ta ss iu m c h ro m a te .
A s s ta te d e a r l i e r in th is p a p e r , th is p ro jec t does not a ttem pt
to a n sw er a l l of the p ro b lem s encoun tered in s t r e a m pollution con-
t r o l , but r a th e r , points the way to a b e t te r understand ing of them .

77
Spleen Function
D uring the c o u rs e of the ex p e r im en ts co nce rn ed with blood
s tu d ie s , two s e r i e s of h e m a to c r i t s w ere taken on each group of fish
(see T ab le 13), one s e r i e s in connection with the blood volum e d e
te rm in a t io n s and one s e r i e s with the o ther blood t e s t s . The d if fe r
en ces in the m ethods of running th ese two s e r ie s were: (1) the blood
fo r the h e m a to c r i t s and o th e r blood te s t s was draw n im m ed ia te ly
a f te r the f ish was an e s th e s iz e d , and (2) the blood fo r the h em a to c r i ts
and blood vo lum e t e s t s was draw n ten m inutes a f te r the fish was
a n e s th e s iz e d and a f te r 0.012 m l. of 6.0 mg. T-182 4 /m l. was in jected .
D esignating tho se h e m a to c r i t s taken im m edia te ly as h e m a to c r i ts at
t im e q> and th ose taken a f te r ten m inutes a s h e m a to c r i ts at t im e
the av e rag e r e s u l t s a r e tab u la ted in Table 13.
When the highly significan t d ifference between the two sp len ec
to m ized co n tro l h e m a to c r i t s was noticed , i t was decided to e lim inate
the po ss ib il i ty of the T-182 4 and the opera tive p ro ced u re as a po s
s ib le cau se of th is in c re a s e during the ten minute period . Those
sp len ec to m ized fish in which no T-1824 was in jec ted during the ten
m inute pe r iod s t i l l showed a significant in c re a se in h e m a to c r i t ,
while th ose th a t w ere sham o pera ted showed no evidence of an
in c re a s e .

78
T A B L E 13
RESULTS O F EXPERIM ENTS PERFORM ED TO INVESTIGATE SPL E E N FUNCTION
G roup H e m a to c r i ts (tim e Q)
H em a to c r i ts (time ) D ifference
S p lenec tom ized c o n t r o l . 28.5 36.6 8.1
S p lenectom ized c h r o m ium . ...................................... 40.6 44.9 4.3
S p lenectom ized co n tro lno. T -1824 .................... . 28.5 34,9 6.4
N o rm al co n tro l ............... 31.8 35.0 3.2
N o rm al c h ro m iu m . . . 43.8 46.3 2.5
Sham o p e ra tedc o n tro l .......................... ... 33.6 35.8 2.2
The above evidence in d ica te s tha t the sp leen of tro u t a c ts as
a bu ffe r to sudden hem oconcen tra tion . This function is l im ited , a s
ev idenced by the tendency of the h e m a to c r i t to in c re a s e in every
in s tan ce even though th is in c re a s e cannot be v e r if ied by s ta t i s t ic a l
m e thods . O ther evidence of the lim ited na tu re of th is function i s
the s ign ifican t in c re a s e in h em a to c r i t in both in tac t and sp len ec to
m ized f ish exposed to ch ro m iu m , which would ind icate the com plete

79
overw helm ing of the buffer capacity of the sp leen due to prolonged
p o ta ss iu m c h ro m a te s t r e s s .
M ore ev idence , g a th e red f ro m ex p er im en ts spec if ica lly d e
signed to in v e s t ig a te the tendency of the sp leen to act as a buffer,
i s needed b e fo re defin ite conclusions can be m ade. Since th is
w ork was p r im a r i ly a im ed at a n sw e rs to toxicity in vestig a tio ns , and
since th is l im ite d buffer action of the sp leen did not influence the
r e s u l t s under ch ro m iu m s t r e s s , fu r th e r investiga tion into splenic
function w as not undertaken .
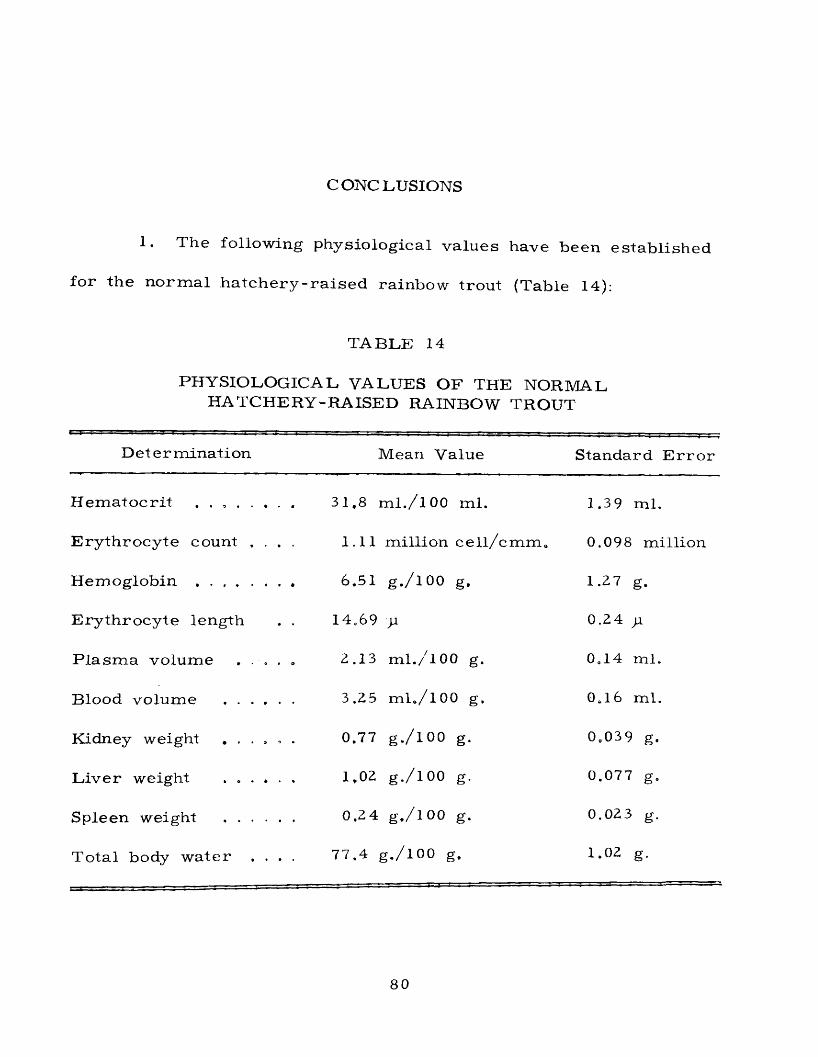
CONCLUSIONS
I, The following physio log ical v a lues have been es tab lished
fo r the n o rm a l h a tc h e ry - r a i s e d ra inbow tro u t (Table 14):
TABLE 14
PHYSIOLOGICAL VALUES OF THE NORMAL HATCHERY-RAISED RAINBOW TROUT
D ete r m ina t i on Mean Value S tandard E r r o r
H em a to c r i t 31,8 ml./lOO ml. 1.39 ml.
E ry th ro c y te count . . . . 1.11 m illion c e l l /c m m . 0.098 m illion
H em oglobin .......................... 6.51 g./lOO g. 1.27 g.
E ry th ro c y te length . . 14.69 0.24 ) i
P la s m a volum e . . . » 2.13 ml./lOO g. O014 ml.
Blood volum e ................... 3.25 m l . / 100 g. 0al6 ml.
Kidney weight . . . . . . 0.77 g./lOO g. 0o039 g.
L iv e r weight ................... 1.02 g./lOO g. 0.077 g„
Spleen weight ................... 0.24 g./lOO g. 0.02 3 g.
T o ta l body w a te r . . . . 77.4 g./lOO g. 1.02 g.
80
81
2. K idney, l iv e r , and sp leen weight; and to ta l body w ate r and
p la sm a and b lood vo lum es w ere found to c o r r e la te highly significantly
with body w eight,
3. The 2 4 hour m ed ian to le ra n c e lim it of trou t to po tass ium
c h ro m a te in a co n ce n tra t io n e x p re s s e d in mg, C r / l . i s 100 mg, C r / l .
4. T r a c e r e x p e r im en ts ind ica ted that the sp leen and the gall
b la d d e r , inc luding the b i le , accu m u la ted ch ro m iu m above the level of
a sec tio n of the cauda l peduncle , w h ereas th e re was no evidence that
kidney o r l iv e r did.
5. T h e re w as no evidence that the weights of the kidney,
l iv e r , sp leen , and to ta l body w a te r of f ish exposed to po tass ium
ch ro m a te w ere d iffe ren t f ro m those of f ish in tap w ater .
6. The h e m a to c r i t s of both sp lenec tom ized and in tac t fish
w ere s ign ifican tly h ig he r than co n tro l fish in tap w a te r . This r i s e
in h e m a to c r i t w as found to be due to an in c re a s e in ce ll num ber and
c e l l vo lum e.
7. T h e re was no evidence that the p lasm a o r blood volum e
in c re a s e d o r d e c re a s e d in f ish exposed to po tass ium ch rom ate ,
8. The p re se n c e of the sp leen is not n e c e s s a ry to in c re a se
the h e m a to c r i t under ch ro m iu m s t r e s s , s ince th e re was no d iffer
ence in e ffec ts w hether the ex p e r im en ts w ere p e rfo rm ed on s p le n e c
to m ized o r in tac t fish .
82
9. It w as a s su m e d , on the b a s is of ex p erim en ta l da ta , that
the p o ta ss iu m ion, in addition to the ch ro m ium , is a potential in flu
ence upon the r e s u l t s obtained at p o ta ss iu m ch ro m ate concen tra tions
equal to 2 0 mg. C r / l .
10. It w as found tha t the h e m a to c r i t re a c h e s i t s m axim um
r i s e in value a t a point betw een 2 and 4 mg. C r / l . It is hoped that
fu tu re ex p e r im en ta tio n m ight prove tha t the in c re a s e in h em a to c r i t
is an index of ch ro n ic tox icity .
11. D ata ind ica ted tha t the sp leen may act as a lim ited
buffer m e c h a n ism to sudden hem oconeen tra tion .
BIBLIOGRAPHY
Abegg, R . , 1949, Some Im p lica tion s f ro m the C hanges of the Mucous C o v er in g of K ish Subjected to Salt Solutions. P ro c , Louisiana A cad . S c i. , 12:7-10.
Abegg, R . , 195 0, Some E ffec ts of Inorganic S alts on the Blood Specific G rav ity and T issu e F lu ids of the B luegill, L epom is m a c ro c h iru s R a f . P hysio l. Zool., 23:124-134. ' ’
A n d e rso n , B. G ., 1944, The Toxicity T h resh o ld s of V arious Substances Found in In d u s tr ia l W astes as D ete rm in ed by the Use of Daphnia m a g n a . Sewage W orks Jo u rn a l , 16 (6): 1156- 1163,
A n d erso n , B. G.» 1946, The Toxicity T h resh o ld of V ariou s Sodium S a lts D e te rm in ed by the Use of Daphnia magna. Sewage W orks Jo u rn . 18(l):82-90 .
^ B an d t, H. J . , 1946, U eber r e r s t a r k e Schadwir Kungen auf F isch e , in se b e so n d e re liber erhoh te Giftwirkung durch Kombination von A b w asse rg if ten . B e itrag e W a s s e r - , A b w a sse r-u . F i s c h e r e i c h e m ie , 1:15-23,
B lack , E . C . , 1955, Blood L eve ls of H em oglobin and L actic A cid in Some F re s h w a te r F is h e s Following E x e rc is e . J . F ish . R es .Bd. C anada , 12(6):917-929.
B row n, M. E . , 1957, The Physiology of F ish . VoL 1, M etabolism , A cadem ic P r e s s , Inc ., P u b l i s h e r s , New Y ork.
De M artin i , F . E . , 1938, C o r ro s io n and the L an ge lie r C a lc ium C a r bonate S a tu ra tion Index, Jo u rn . A.W.W.A. 30:85-92.
D oudoroff, P . , 1952, Some R ecen t D evelopm ents in the Study of Toxic In d u s tr ia l W astes , P ro c . F o u rth Pacific N orthw est In d u s tr ia l W aste Conf., State Coll. of W ashington, P u llm an , W ash., 21- 25.
83
84
D oudoroff, P . , A n d erso n , B, G ., B urd ick , G. E . , G altsoff , P . S.,H a r t , We B 0, P a t r ic k , f t . , S trong, E . R ., S u rb e r , E . W., and V an H orn , W. M ., 1951, B io -A ssay M ethods fo r the E v a lu a tion of A cute Toxicity of In d u s tr ia l W astes to F ish . Sewage and In d u s tr ia l W as te s , 23 (l 1): 1380-1397.
Doudoroff, P . , and K atz , M ,, 1953, C r i t ic a l Review of L i te r a tu re on the T oxicity of In d u s tr ia l W astes and T h e ir C om ponents to F ish . II, The M eta ls As S a lts . Sewage and In d u s tr ia l W a s te s , 25(7):802 - 839.
E l l i s , M. M ., 1937, D etec tion and M easu rem en t of S tream Pollu tion . Bull. No. 22, U.S. B ur. of F is h e r ie s ; Bull. B ur, F i s h e r ie s , 48:365-437.
E l l i s , M. M . , and L a d n e r , G. C . , 1935, A ttacking the N ation 's W ater P o llu tion M enace. T ra n s . T w en ty -f irs t A m e r . G am e. Conf0, 135-148,
F ro m m , P . O . , and Schiffm an, R. H ., 1958, Toxic A ction of H exa-valen t C h ro m iu m on L argem ou th B ass . Jo u rn . Wildlife M anagem en t. J a n , (In P r e s s )
G a r re y , W. E . , 1916, The R es is ta n ce of F r e s h W ater F ish toC hanges of O sm otic and C h em ica l Conditions. A m er. Jo u r . P h y s io l . , 3 9:313-329.
G rin d ley , J , , 1945, T re a tm e n t and D isposa l of W aste W aters C on ta in ing C h ro m a te . J o u r . Soc. C hem . Inc. (London) 64:33 9-344.
G rind ley , J . , 1946, Toxicity to Rainbow T rou t and Minnows of Some S ubstances Known To Be P re s e n t in W aste W ater D ischarged to R iv e r s . Ann. Appl. B io l. , 33:103-112.
G u ey la rd , F . , 1923, R e s is ta n c e des Epinoches aux V aria t io n s de sa l in i te . C om pt, Rend. Soc. B io l. , 89:78-80.
G u ey la rd , F . , 192 4, De l 'ad ap ta tio n aux changem ents de sa lin ite .R e c h e rc h e s bio logiques et physico -ch im iques su r l 'E p inoche . A rch . P h y s . B iologique, 3:79-197.
85
* B ., D oudoroff, P . , and G reenbank , J . r 1945, The Evaluation of the Toxicity of In d u s tr ia l W aste s , C h em ica ls , and O ther Substances to F r e s h W ater F ish e s . The A tlan tic Refining C o ., P h i la d e lp h ia , P a .
H e ilb ru n n , L . V ., 1938, An Outline of G en era l Physiology. W. B. S au nd ers C o ., P h ilad e lp h ia , Pa.
Irv ing , L . , B lack , E . C . , and Safford , V.» 1941, T e m p e ra tu re and O^ Affinity of F is h Blood. Biol. Bull. 80:1-17.
J o n e s , J . R , E 0 , 1938, The R ela tive Toxicity of Salts of Lead, Z inc , and C o pp er to the S tick leback , G a s te ro s te u s acu lea tus L ., and th e E ffec t of C a lc ium on the Toxicity of Lead and Z inc Salts. J o u rn . Exp. B io l . , 15:394-407.
J o n e s , J . R. E . , 1939, The R ela tion betw een the E lec tro ly tic Solution P r e s s u r e s of the M etals and T h e ir Toxicity to the S tick leback , G a s te ro s te u s acu lea tu s L. Jo u rn . Exp. B iol., 16:425-437.
K la ssen , C. W ., H a s fu r th e r , W. A ., and Young, M. K . , 1949, The Toxic ity of H exavalent C h ro m iu m to Sunfish and B lueg ills . P ro c . F o u r th In d u s tr ia l Waste Conf., Purdue Univ. Eng.B u ll . , E x t . S e r ie s . , 68:229-237.
K ru g e r , F . , 1928, U ntersuchungen iiber die U rsachen des Todes des S tich lings , G a s te ro s te u s acu lea tu s L . , in re in en C h lo rn a tr iu m Losungen, Z e i ts . v e rg l . P h y s io l. , 7:696-735.
K rum holz , Louis A ., 1956, O b serva tio ns on the F ish Population of a Lake C on tam inated by R adioactive W aste s , Bull. Am. M useum W at. H is t . , 110(4):277-368.
* L e C le rc , E . , and D ev lam inck , F . , 1950, C o nsid era tion s p re l im in a ir e s a la d e te rm in a tio n de la dose m in im a m o r te l le , pour le p o isso n , de quelques su bstan ces a c a r a c te r e nocif. Bull. C e n tre Beige E tude et Document. Equx, 8:483-485.
Loeb, J . , and W asteneys , H ., 1911, Die Entgiftung von N a tr iu m ch lo r id du rch K alium ch lo rid . B iochem . Z e i ts . , 33:480-488.

86
Loeb, J , , and W asteneys , H ., 1915, On the Influence of B alanced and N o n-B alanced Salt Solutions upon the O sm otic P r e s s u r e of the Body L iquids of Fundulus, Jo u rn , Biol. C h e m ,, 21:223-238,
M oore, E . W ., 1939, G raphic d e te rm in a t io n of C arbon Dioxide and the T h ree F o r m s of A lkalin ity . Jo u rn , A m . W ater W orks A ss o c , 31(1 ):51 -65.
* O sh im a , S.* 1931, On the Toxic A ction of D isso lved Salts and Their Ions upon Young E e l s , A nguilla japonica. Jo u rn , Im p eria l F i s h e r ie s Exp, Sta. (Japanese) 2:139-193.
P o w e rs , E , B ., 1921, A ntagonism and i t s P o ss ib le Utility in Po llu ted W a te rs , T ra n s , A m e r , F is h e r ie s Soc. 50:293-296,
P r o s s e r , C. L . , Bishop* D. W„, B row n, F. A ., J r . , Jahn , T, L . , and Wulff, Y. J . , 1950, C om para tive A nim al Physio logy , W, B, S aunder C o . , P h ilad e lph ia , P a ,
*R am ult, R ,, 192 8a, Influence of C e r ta in Salts upon the Hatching and D evelopm ent of Salm on F r y , Salmo t r u t t a 0 Bull, In te rna t. A cad , P o lo na ise ScL , C la sse Sci. Math. N at., S erie B, Sci. N a t. , 1927, 45-62.
*Ram ult, R ., 192 8b, The Influence of C e r ta in Salts upon the Developm en t of Young S tick lebacks, G as te ro s teu s acu lea tu s . Bull, In te rn a t . A cad , P o lo na ise Sci., C la s s e Sci. Math. N at., SerieB. Sci. N a t. , 1927, 63-66,
R udolfs , W ., B a rn e s , G. E„, E dw ard , G. P H e u k e l e k i a n , H»,H urw itz , E . , Renn, C. E .* S te inberg , S ., and Vaughan, W. E . r 1950, Review of L i te r a tu re on Toxic M ate r ia l Affecting Sewage T re a tm e n t P r o c e s s e s , S tre a m s , and B.O.D. D e te rm in a t io n s . Sewage and Indust. W astes , 22(9):1157-1191.
*Rushton, W., 1921, B io log ical N otes. Salm on and T rou t M ag., 25:101-117.
S a ltzm an , B. E . , 1952, M ic ro d e te rm in a tio n of C hrom ium withD iph en y lca rb az ied by P e rm an g a n a te Oxidation, Anal. C hem . %
24:1016-1024.
87
S p ec to r , W. S ., 1956, Handbook of B io log ical Data. W. B, Saunders C o ., P h ilad e lp h ia , Pa .
S tandard M ethods of W ater and Sewage A n a ly s is , 1955, U.S. Public H ealth S e rv ice .
Young, R. T . , 1938, The E ffec t of B alanced V e rsu s Unbalanced Solutio n s of H ydrogen Ion C on cen tra tio ns and D is ti l led W ater on F is h . Ecology, 19:136-140.
*This a r t i c l e w as not seen in i t s o r ig in a l fo rm .

APPENDIX I
REVIEW OF TOXICITY LITERATURE
A begg (1950)* us ing b lueg ill sunfish , L epom is m acroch irus*
weighing 2 0 to 35 g r a m s , te s te d both Na2CrC>4 and Na2C r2 0 ? . Under
cond itions a s se t fo r th by H a r t , Doudoroff, and G reenbank (1945),
Abegg u sed w a te r with a to ta l a lkalin ity a s C a C 0 3 of 60 to 12 0
m g , / l . , to ta l h a rd n e s s a s CaCO^ of 75 to 150 m g . / l . , su lphates a s
S 0 4 of 2 0 to 5 0 m g . / l . and m axim um d isso lv ed so lids of le s s than
500 m g . / l . He r e p o r te d th is w ate r not wholly sa t is fa c to ry a s a
dilution w a te r fo r s tu d ie s pe rta in ing to the effects of chem ica l com*
pounds on the physiology of f ishes .
T he f ish w e re te s te d in 5 gallon round g la ss b a t te ry ja rs*
E ach j a r con ta ined 12 l i t e r s of solution and was kept at 22°+ 0.2
C. by a cons tan t te m p e r a tu r e bath . Using a e ra t io n Abegg te s te d six
f ish in each co n ta in e r . He r e p o r te d h is data in 24 hour m edian
to le ra n c e l im i ts (TLm); th a t is* concen tra tions le tha l to 5 0 percen t
of t e s t a n im a ls in 24 h o u rs , and found them to be 93 0 mg. N a^ C rC ^ /
1. and 728 m g. Na2C r 2C>7/ l . T hese te s t so lu tions had the following
c h a r a c te r i s t i c s:
88

89
C h em ica l M o ls . / l .C al. O sm otic P r e s s u r e in L i te r A tm os.
Specific R es is tan ce (ohms at 22.2° C .)
PH
N a^C rO ^ 0.0073 0.19 520 8.1
Na2C r 2 ° 7 0o0044 0e12 105 5.9
Jo n e s (1939) did w ork on a s e r i e s of m e ta ll ic ions which
w ere added to v e ry soft tap w a te r "of a high deg ree of purity
The ca lc iu m ion con cen tra tion was about 1 m g . / l . The fish w ere
s t ic k le b a c k s , G a s te ro s te n s a c u le a tu s , usually 3 0 to 5 0 m m . in length.
F o u r to five f ish w ere exposed in 2 l i t e r s of each te s t so lu tion, and
the so lu tions ren ew ed at daily in te rv a ls . A s e r ie s of ten to twenty
d iffe ren t co n cen tra tio n s of each sa lt w as te s te d at 14 C. to 15 C.
Jo n e s r e p o r te d h is data in su rv iv a l t im e s of 1 day (14-30
h o u rs ) , 2 days (38-60 h o u rs ) , 4 days (76-120 h o u rs ) , and 1 week
(140-2 00 h o u rs ) and in le tha l co ncen tra tion l im its , or the c o n ce n tra
tion of the m e ta ls a t which the av e rag e su rv iva l t im e nearly equaled
that of the c o n tro ls , about 10 days.
F o r t r iv a le n t ch ro m iu m in the fo rm of C r z (SC>4 )3 Jo n es found
the following co n cen tra tio n s in re la t io n to su rv iva l t im es : 1 day,
5.0 m g . / l . i 2 d a y s , 2.0 m g . / l . ; 4 days , 1.4 m g ./ l . ; and 1 week, 1.3
90
m g./l* with a f inal le th a l co ncen tra tion l im it of 1.2 m g . / l . o r 2.30 x
10 g ra m a to m s / l i te r*
G rind ley (1945), in h is p ap er on d isposa l of ch ro m a te w as te s ,
r e p o r te d of t e s t s m ade on ch rom ium using a e ra te d , d is ti l led w ater
a s a diluent* He found ra inbow tro u t , Salm o g a ird n e r i v a r . s h a s ta ,
would to le r a te a p o ta ss iu m ch ro m a te and d ich rom ate solution at
co n cen tra tio n equivalen t to 2 0 mg. C r / l . , fo r f ro m 2 to 8 days. He
concluded tha t the lim iting concen tra tion below which substan tia lly
n e u t ra l so lu tions of c h ro m a te a r e nontoxic to rainbow tro u t during
p e r io d s of 8 d ay s , under ex p e r im en ta l conditions, ap p ea red to be
s ligh tly le s s than 2 0 mg. C r / l .
In G r in d le y 's (1946) paper on toxicity to fish he again r e
p o r ts on c h ro m a te tox icity to rainbow tro u t . W hether th ese two
p a p e rs co v er the sam e ex p erim en t could not be d e te rm in ed , since
no re f e re n c e was m ade in e i th e r w ork to the o ther p ro jec t. A s s u m
ing two t e s t s w ere p e r fo rm e d , he again u sed w e l l -a e ra te d d is ti l led
w a te r to m ake up the p o ta ss iu m ch ro m a te and d ich rom ate solutions
which w ere m ain ta in ed at 18° C, during exposure to the fish .
The tox ic ity of a solution to individual f ish was e x p re s s e d a s
100 t im e s the r e c ip ro c a l of the tim e period , in m in u tes , during which
each f ish w as im m e rs e d . The av erag e of th e se individual to x ic it ie s was
r e p o r te d a s the m ean tox icity plus o r m inus the s tan d a rd deviation.
91
R a th e r than re p o r t in g h is com plete data h e r e , which covered
tw en ty -tw o d ilu tions of both K2C r 0 4 and K ^ C ^ C y only the r e s u l t s
which a r e c lo s e s t to the 24 h ou rs (1440 m inutes) and 48 hours
(2 880 m inu tes) le th a l co n cen tra tio n s a r e d iscu ssed . With K C rO2 4
G rind ley found 10 tro u t would endure 2 00 mg. C r / l . (747 mg.
K ^ C rO ^ /l .) a t an in i t ia l pH of 7.3 fo r an av e rag e of 374 m inutes
b e fo re o v e r tu rn in g , with a ca lcu la ted m ean toxicity of 0.2 7 ± 0.11
m in . 1; 50 m g. C r / l . (187 K2C r 0 4 m g ./ l . ) at pH 6.6 could be en
d u red 3580 m in u tes with a m ean toxicity of 0.02 8 0.010 min.
With the d ich ro m ate h is r e s u l t s w ere a s follows: 2 00 mg.
C r / l . (566 m g. K ^ C r^O ^ /l .) a t pH 5.4 fo r 188 m inu tes with a mean
toxocity of 0.53 £ 0.60 m in, \ 50 mg. C r / l . (142 mg. K ^C r^O ^/l.)
at pH 5.0 fo r 1946 m inu tes with a m ean toxicity of 0.051 +, 0.044
min. * and 2 0 mg. C r / l (57 mg. K ^C r^O ^/l .) at pH 5,5 for 4348
m in u tes with a m ean tox ic ity of 0.02 3 0.008 min.
It is in te r e s t in g to note tha t the ch rom ate and d ich rom ate ,
w hen e x p re s s e d as m g, C r / l . , y ie ld approx im ate ly the sam e to x ic i t ie s .
Wnen the fish had tu rn e d ov er , they w ere t r a n s f e r r e d to
f r e s h w a te r , and fish which had been im m e rs e d in so lutions con ta in
ing the h ighest co n cen tra tio n of ch ro m ate died soon a f te r t r a n s f e r .
Some of th e f ish r which had b een im m e rs e d in low er co n cen tra tio n s ,
d ied in about 3 days a f te r t r a n s f e r , and a few did re c o v e r . V ery

92
few fish which had b een im m e rs e d in solutions of the d ich rom ate
su rv iv ed when t r a n s f e r r e d to f r e s h w a te r . Those that did survive
w ere u su a lly the fish which had been the f i r s t to overturn* sug g es t
ing that th e se fish w ere affec ted by the acidity of the solution
r a th e r than by any specific toxic effect of the dichromate,,
F ro m m and Schiffm an (1958), using the m ethods of Doudoroff
e t ja l , (1951), found the 48 hour m ean to le ran ce l im its of la rgem outh
b a s s , length 10,6 0,64 c m ., weight 11.3 ± ,2 .7 g ra m s , for hexavalent
c h ro m iu m , K ^C rO ^, w as 195 mg. C r / l . The diluent had a to ta l
h a rd n e s s of 3 34 mg. C a C O ^ /l . , to ta l a lkalin ity of 2 06 mg. C aC O ^/l-,
a pH of 8.5 to 8„5, and w as held at 20° C. to 21° C.
In addition to the above, Doudoroff and Katz (1953), in th e ir
rev iew of l i t e r a tu r e p erta in ing to the toxicity of w as tes to fish , c ite
o th e r r e f e r e n c e s , which, due to th e i r unavailab ility , the au thor was
not ab le to consu lt . They a r e as follows: O shim a (1931) re p o r te d
tha t the su rv iv a l t im e of young ee ls in a solution of K C rz (SC>4)2 at
a co n cen tra tio n of 5.2 mg. C r / l . av e rag e d 18.7 h o u rs . He a lso
found that 0.01 M. K ^C rC ^ and 0.005 M. K2C r2 0 ? solu tions (520
mg. C r / l . ) w ere le th a l to young e e ls in an average of 12.4 and 5.35
h o u rs re s p e c t iv e ly , w h e rea s 0.002 5 M. K2C r 0 4 and 0.0005 Mo
K C r O so lu tions (13 0 mg. C r / l . and 52 mg. C r / l . ) k il led no ee ls Z 2« *7
in 50 h o u rs .
93
Le C le rc and D evlam inck (195 0) found tha t t r iv a len t ch rom iu m ,
a s a su lfa te , at a co n ce n tra tio n of 40 m g, C r / l . was a m inim um fatal
c o n ce n tra tio n fo r m innow s in 6 h o u rs . Rushton (1921) found that a
6 hour ex p o su re to 100 m g. K ^C r^O ^ /l . proved fa ta l to trou t within
12 h o u rs a f te r r e tu r n to f r e s h w a te r .
K la s se n et a l . (1949) did work on w as tes fro m a ch rom ium
pla ting in d u s try in W oodstock, I ll ino is . Since the au thor is personally
f a m i l ia r with th i s w ork , he fee ls tha t the re s u l t s w ere so e r r a t ic
tha t they do not con s ti tu te a v a lid te s t . Doudoroff, in h is re p o r t on
th is w ork , c i ted tha t in one te s t 10 b lueg ill sunfish to le ra te d 83 mg.
C r / l . fo r 10 days o r m o re , w h ereas 6 b luegill sunfish died within 4
days in a d ilu ted w aste contain ing 75 mg. C r / l . It is the a u th o r 's
opinion that th e se conflic ting data w ere due to the fact that the
w aste u sed in the b io a ssa y s was co llec ted at v a r io u s t im e periods
and i t s com position was in a s ta te of constan t flux. Knowing the
s itua tion , cyanide would be su sp ec ted a s being a contribu ting fac to r
to the v a r ia t io n o b se rv ed .
The data r e la t in g to the tox ic ity of ch rom ium to in v e r te b ra te s
i s even m o re s c a r c e than that of the fish .
A n d e rso n h as m ade exce llen t p ro g re s s in the fie ld with h is
work with Daphnia m agna in an a ttem pt to study the effect of v a r io u s
po llu tan ts on the food cha in of f ish . In h is w ork (1944. 1946) he
94
u se d th re s h o ld co n cen tra tio n s ; tha t i s , co n cen tra tion s which would
im m o b il iz e 5 0 p e rcen t of the te s t a n im a ls in a given p e rio d of tim e .
In h is e a r l i e r w ork , he em ployed a t im e in te rv a l of 16 h o u rs , but
found th is u n s a t is fa c to ry . Then he changed to a 48 hour period in
1946 w ith a r e s u l ta n t low ering of th re sh o ld s . In both th e se p ro je c ts ,
he u se d L ake E r i e w a te r a s the diluent which had the following p e r
tinen t c h e m ic a l com position: c a lc iu m , 31 m g ./ l . ; m ag n es iu m , 7.6
m g . / l . ; c a rb o n a te r a d ic a l , 3.1 m g ./ l . ; b ica rbona te ra d ic a l , 114 m g . /
1.; su lfa te r a d ic a l , 13 m g . / l . ; ch lo rin e (Cl), 8.7 m g ./ l , ; and to ta l
d is so lv ed so lid , 133 m g . / l .
In 1944 A n d erso n found K ^CrO^ to im m obilized Daphnia
m agna in 16 h o u rs a t a co n cen tra tio n of le s s than 0.6 m g . / l . In h is
1946 w ork with sodium s a l t s , he found lit t le d ifference between the
c h ro m a te and d ich ro m ate th re sh o ld s when com pared on the b a s is of
the ch ro m iu m conten t of the m olecu le , the ch ro m ate being toxic at
<0.32 m g . / l . and the d ich ro m ate at <<0.31 m g . / l .
Rudolfs et a l . (1950) r e p o r te d a toxic effect to f lo ra and
fauna due to t r iv a le n t ch ro m iu m concen tra tions of 6 m g . / l . o r le ss .
H is a r t i c l e , a co m preh ens iv e rev iew of toxicity l i te r a tu re perta in ing
to a l l b ra n c h e s of w aste d isp o sa l , was lengthy, and re fe re n c e to the
p a r t ic u la r w ork in which th is datum w as found could not be located .
A P P E N D I X II
T his sec tio n con ta ins a l l data and th e ir s ta t is t ic a l evaluation*
A ll s ta t i s t ic a l m e th o d s , except the a n a ly s is of v a r ian ce technique
u sed on the r e g r e s s io n co eff ic ien ts , a r e accord ing to Snedecor (1956).
H is convenien t a b b rev ia t io n s , m eaning significant (c< = .05) and **
m eaning highly sign ifican t (c< = .01) a r e used.
The an a ly s is of v a r ia n c e techn iques used on the r e g re s s io n
coeffic ien ts a r e those of D r. W. D. Baten , S ta tis tic ian , M ichigan State
U n ivers ity A g r ic u l tu re E x p e r im en t Station.
95

9 6
P a r t A. N o rm al T rou t
D ata U sed to O btain the R e g re s s io n C u rv es of Kidney, L iv e r , andSpleen W eights on Body Weight
T o ta l Wt.
of F is h Minus O rgans
(*.)
T o ta lLength
ofF is h(cm.)
KidneyWeight(mg.)
KidneyIndex(pet.bodywt.)
L iv e rWeight(mg.)
L iverIndex(pet.bodywt.)
SpleenWeight
(mg.)
SpleenIndex(pet.bodywt.)
14.6 13.1 131.8 0.90 66.6 0.46 32.6 0.22
11.0 11.3 79.8 0.72 130.0 t—> i—< 00 36.2 0.33
8.7 11.6 64.6 0.74 74.4 0,86 13.4 0.15
14.8 12.9 81.6 0.55 162.0 1.09 46.2 0.31
17.7 13.2 176.0 0.99 181.0 1.02 54.0 0,30
13.7 12.7 120.4 0.88 170.4 1.24 27.4 0.20
24.2 14.6 199.6 0.82 231.8 0.96 79.2 0.33
14.0 12.5 93.6 0.67 153.4 1.10 27.4 0.20
11.1 12.5 82.8 0.74 103.8 0.94 15.6 0.14
26.0 15.6 200.0 0.77 345.4 1.33 51.4 0.20

97
Data P e r ta in in g to O rgan W eight, Gall B ladder, and Gonads
T o ta l Weight of F ish Minus
O rgans
(g.)
T o ta l Length of F is h
(cm.)
GallB ladderWeight(mg.)
GallB ladder
Index(pet.bodywt.)
GonadWeight(mg.)
Gonad Index (pet. body w t.)
14,6 13,1 49.0 0.34 8.6 0,06
11.0 11.3 20.0 0.18 34.2 0.31
8.7 11.6 25.0 0.29 25,6 0,2 9
14.8 12.9 36.4 0.25 44.6 0.30
17.7 13.2 18.0 0.10 379.0 2.14
13.7 12 .7 24.0 0.18 6.4 0,05
24.2 14.6 31.8 0.13 272.0 1.12
14.0 12.5 27.0 0.19 34.8 0,24
11.1 12.5 24.6 0.22 11.6 0.10
2 6,0 15.6 38.6 0.15 28.0 0.11
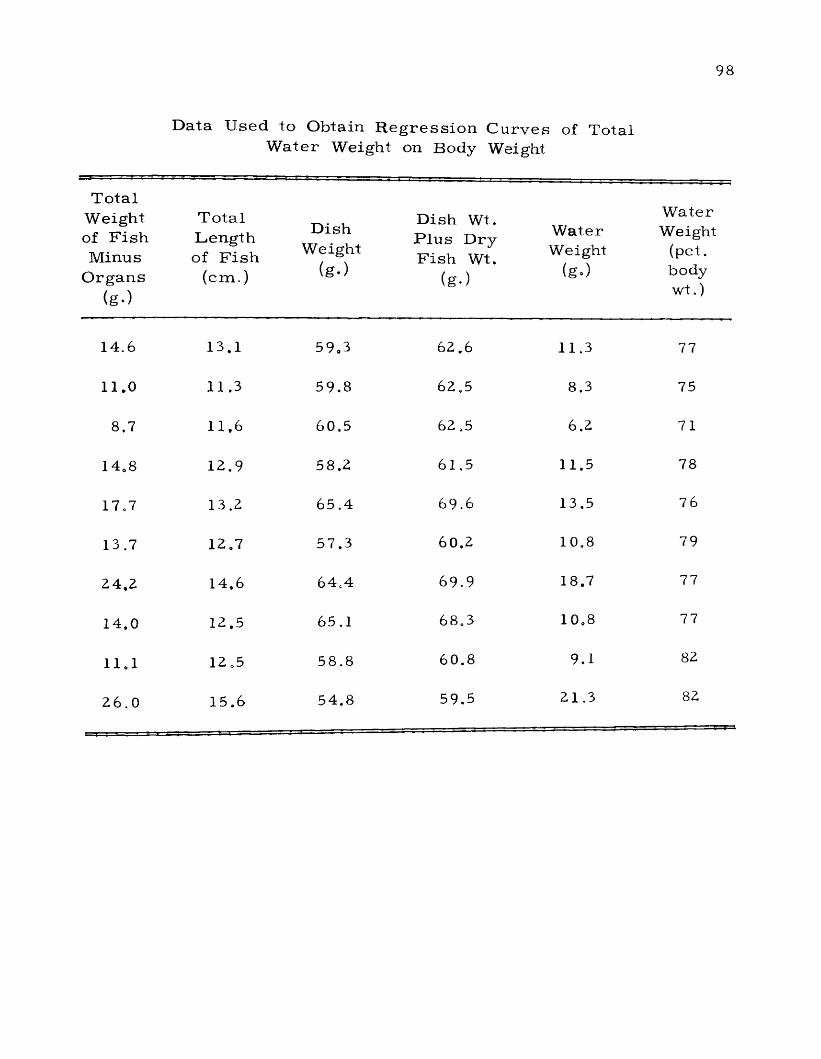
98
D ata U sed to O btain R e g re s s io n C u rv es of Total W ater Weight on Body Weight
T o ta l Weight of F is h Minus
O rgans
(g.)
T o ta l Length of F is h
(cm.)
D ishWeight
(g-)
Dish Wt. P lu s D ry F ish Wt.
(g-)
W aterWeight
(go)
W ater Weight
(pet. body w t.)
14.6 13.1 59„3 62.6 11.3 77
11.0 11.3 59.8 62.5 8.3 75
8,7 11.6 60.5 62.5 6.2 71
14.8 12.9 58.2 61,5 11.5 78
17,7 13.2 65.4 69.6 13.5 76
13.7 12.7 57.3 60,2 10.8 79
24,2 14.6 64,4 69.9 18.7 77
14.0 12.5 65.1 68.3 10.8 77
11.1 12.5 58.8 60.8 9.1 82
26.0 15.6 54.8 59.5 21.3 82
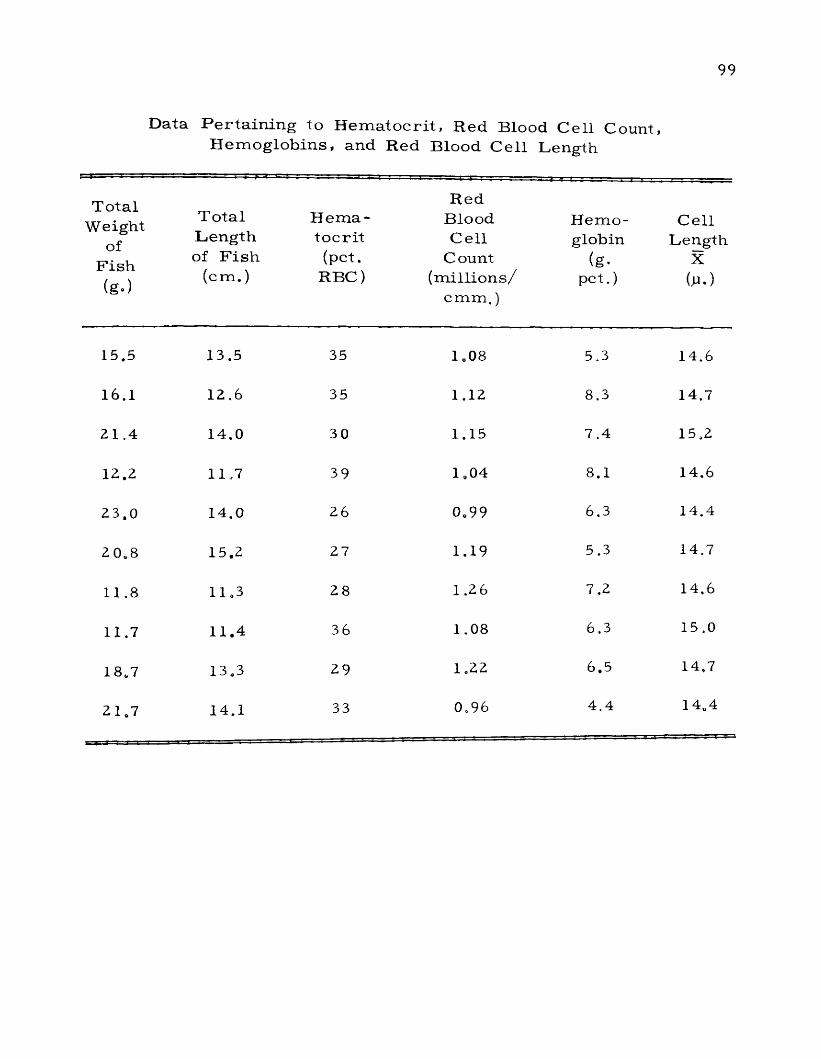
99
D ata P e r ta in in g to H e m a to c r i t , Red Blood C ell Count, H em og lob ins , and Red Blood C ell Length
T ota lWeight
ofF ish(g.)
T o ta l Length of F is h
( c m .)
H e m a to c r i t (pet.
R B C )
Red Blood C ell
Count (m ill io n s /
c m m ,)
H em oglobin
(g*pet.)
C ellLength
X(p.)
15.5 13.5 35 1 „08 5.3 14.6
16.1 12.6 35 1.12 8.3 14.7
21.4 14.0 30 1.15 7 .4 15,2
12.2 11.7 39 1.04 8.1 14.6
23.0 14.0 2 6 0.99 6.3 14.4
2 0.8 15.2 27 1.19 5.3 14.7
11.8 11.3 28 1.2 6 7.2 14.6
11.7 11.4 36 1.08 6.3 15,0
18,7 13.3 29 1.22 6.5 14.7
2 1 „7 14.1 33 0,96 4.4 14.4
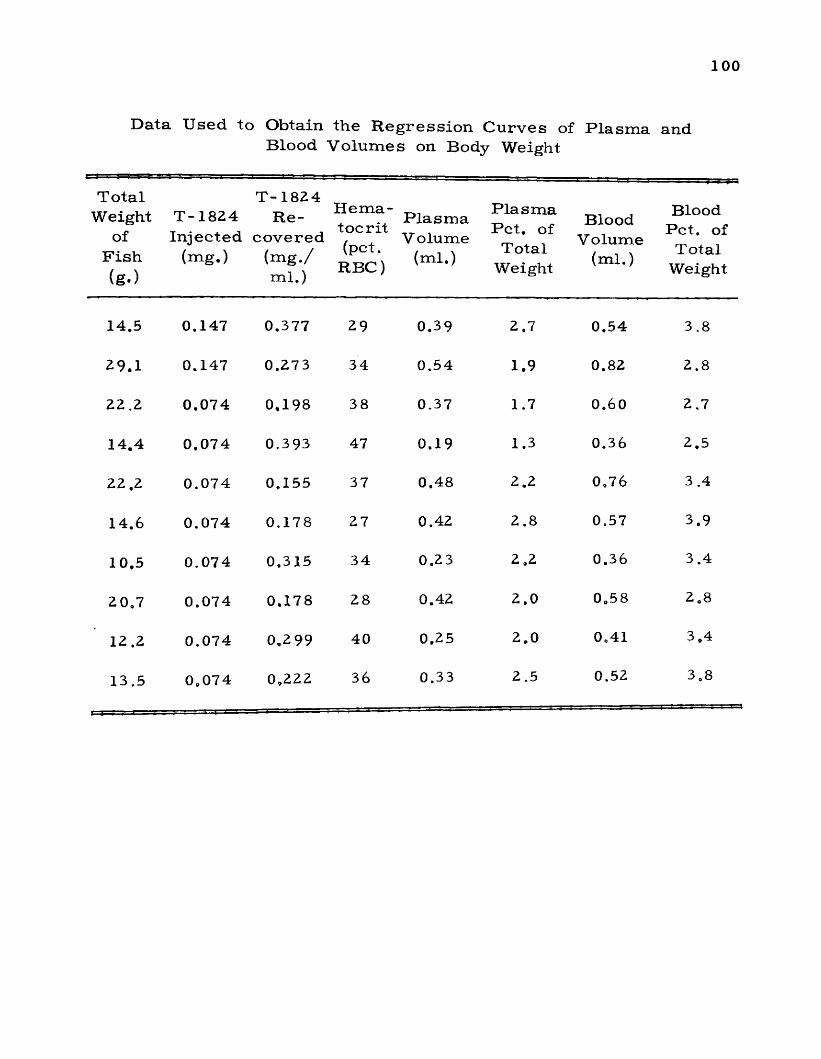
1 0 0
Data Used to Obtain the Regression Curves of Plasma and Blood Volumes on Body Weight
T o ta lWeight
ofF is h(g.)
T - 182 4 T - 1824 R e- In jec ted c o v e red
(mg.) (m g ./ m l.)
H e m a to c r i t(pet.
RBC)
P la sm a V olume
(ml.)
P la sm a P e t. of
Total Weight
Blood V olume
(ml.)
Blood P et. of
Total Weight
14.5 0.147 0.377 29 0.39 2.7 0.54 3.8
29.1 0.147 0.273 34 0.54 1.9 0.82 2.8
22.2 0.074 0.198 38 0.37 1.7 0.60 2.7
14.4 0.074 0.393 47 0.19 1.3 0.36 2.5
22.2 0.074 0.155 37 0.48 2.2 0.76 3.4
14.6 0.074 0.178 27 0.42 2.8 0.57 3.9
10.5 0.074 0.315 34 0.23 2.2 0.36 3.4
2 0.7 0.074 0.178 28 0.42 2.0 0.58 2.8
12.2 0.074 0.2 99 40 0.25 2.0 0.41 3.4
13.5 0.074 0.222 36 0.33 2.5 0.52 3.8
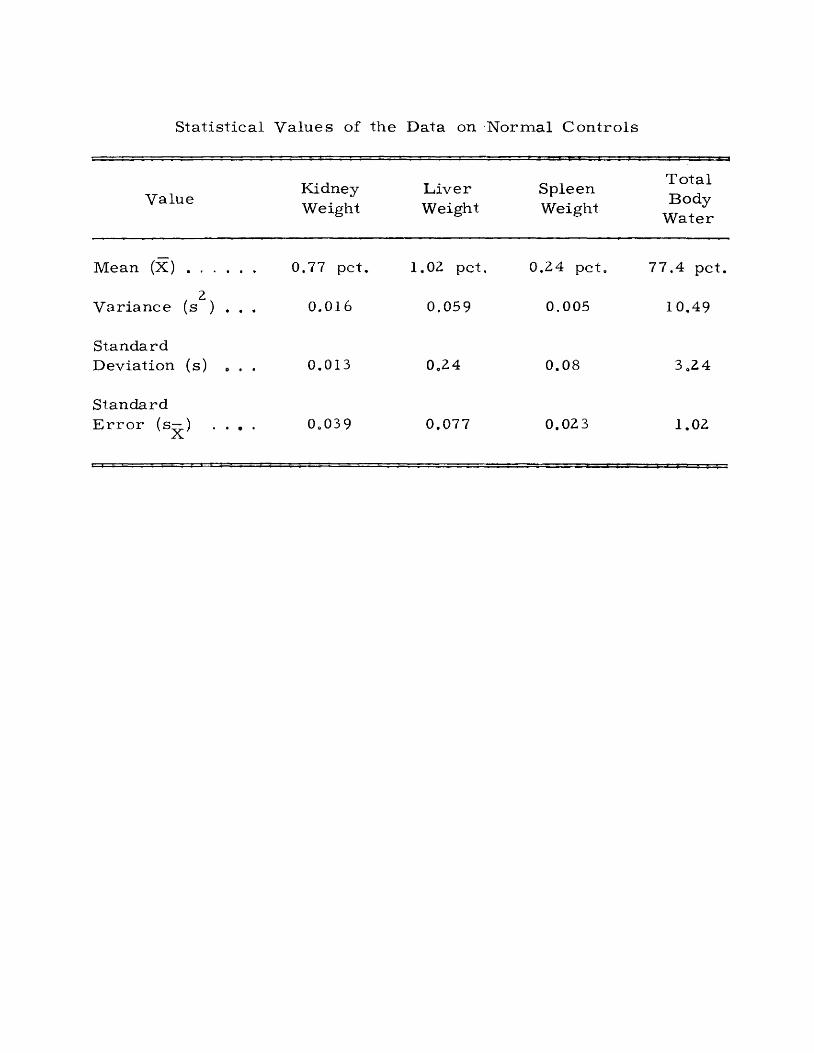
S ta tis tica l Values of the Data on N orm al C on tro ls
ValueKidneyWeight
L iverWeight
SpleenWeight
TotalBody
W ater
Mean ( X ) .................. 0.77 pet. 1.0Z pet, 0,24 pet. 77.4 pet.
ZV ariance (s ) . . . 0.016 0.059 0.005 10.49
StandardDeviation (s) „ . . 0.013 0.24 0.08 3.24
StandardE r r o r (s—) . . . .
X 0.039 0.077 0.023 1.02
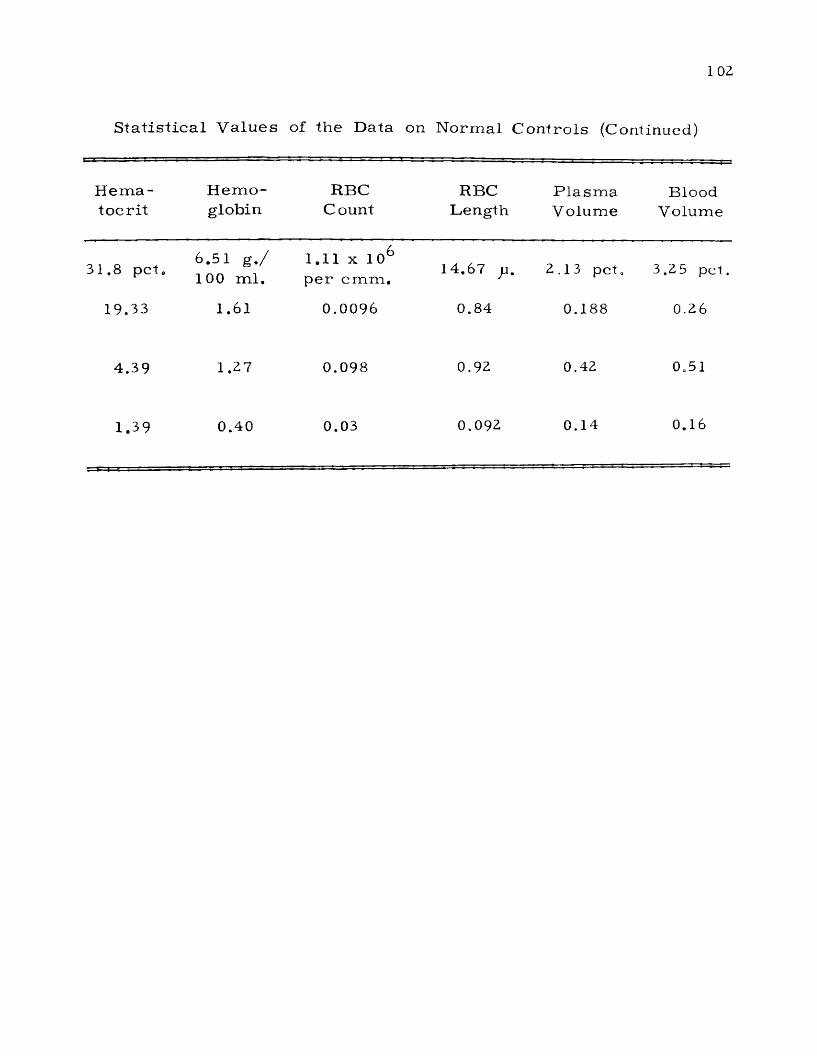
1 0 Z
S ta t is t ic a l V a lues of the Data on N orm al C on tro ls (Continued)
H em ato c r i t
H em o globin
RBCCount
RBCLength
P la sm a V olume
BloodVolume
31.8 pet.6.51 g , / 100 m l .
1.11 x 10⁶ p e r cm m .
14,67 p . Z.13 pc t0 3.2 5 pet.
19.33 1.61 0.0096 0.84 0.188 0.26
4.39 1.Z7 0.098 0.9Z 0,42 0.51
1.39 0.40 0.03 0.09Z 0.14 0.16
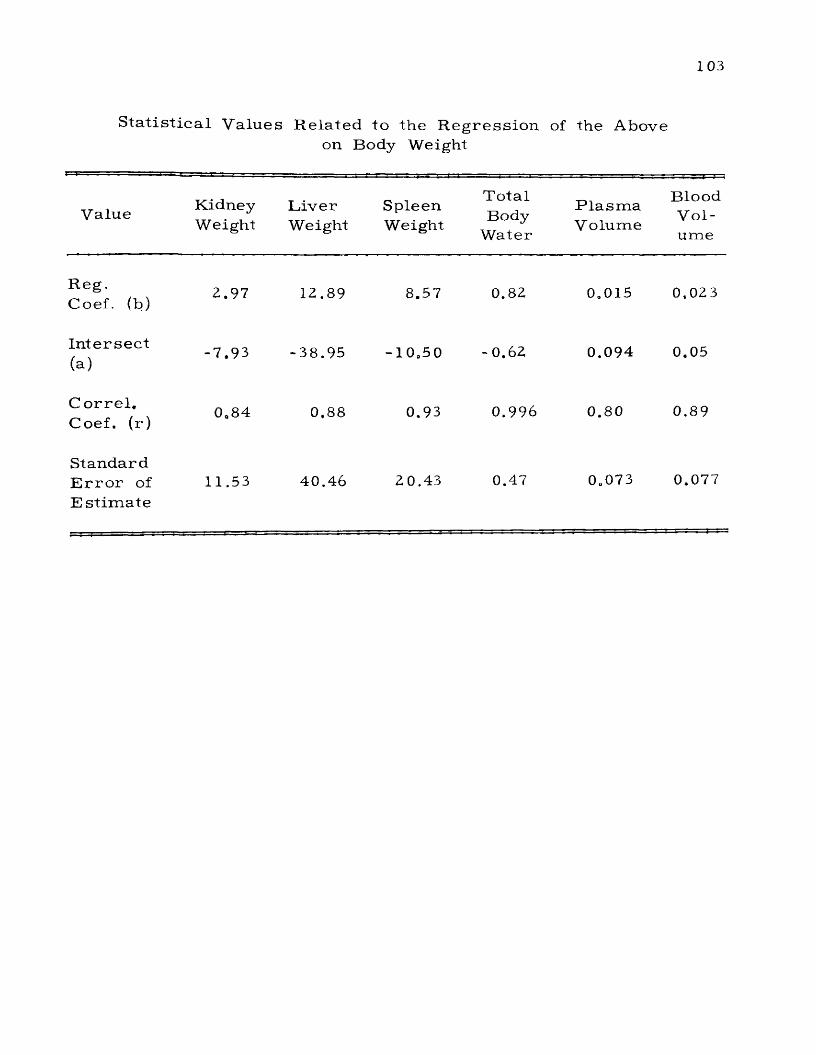
103
S ta t is t ic a l V alues R e la ted to the R e g re s s io n of the Aboveon Body Weight
Value KidneyWeight
L iv e rWeight
SpleenWeight
T o ta lBody
W ater
P la s m a V olum e
BloodV o lum e
Reg.Coef. (b)
2.97 12.89 8.57 0.82 0.015 0,023
In te rs e c t(a)
-7.93 -38.95 -10 .50 -0.62 0.094 0.05
C o r r e l . Coef. (r)
0a84 0.88 0.93 0.996 0.80 0.89
S tandard E r r o r of E s t im a te
11.53 40.46 20.43 0.47 0.073 0.077
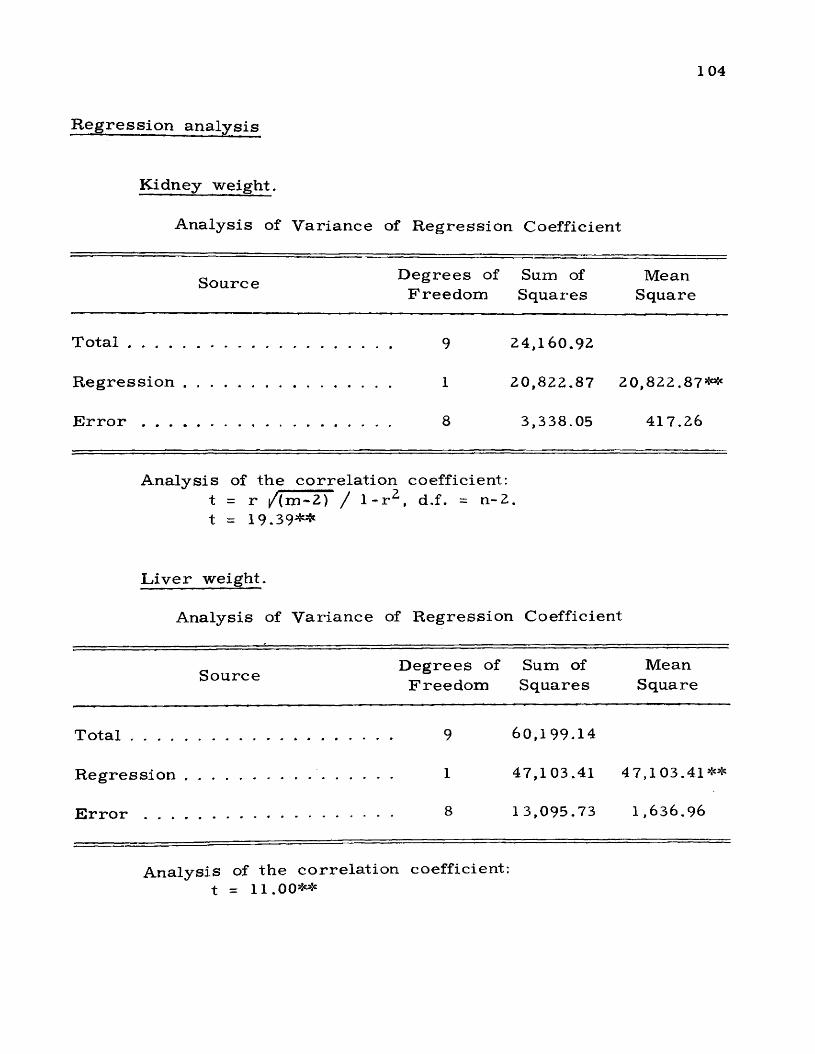
1 0 4
R e g r e s s i o n a n a l y s i s
K idney w e ig h t.
A na ly s is of V arian ce of R e g re ss io n Coeffic ient
S ource D eg rees of Sum of MeanF re e d o m S quares Square
T o t a l ............................................................................... 9 24,160.92
R e g r e s s i o n ............................................................... 1 20,822.87 20,822.87**
E r r o r ........................................................................... 8 3,338.05 417.26
A n aly s is of th e c o r re la t io n coefficient: t = r / (m -2 ) / 1 - r ^ , d.f. = n-2 . t = 19.39**
L iv e r w eigh t.
A nalysis of V a r ia n c e of R e g re s s io n C oeffic ient
^ D eg rees of Sum of MeanF re e d o m S q uares Square
T o t a l .............................................................................. 9 60,199.14
R e g r e s s i o n ...................................................... 1 47,103.41 47,103.4.1**
E r r o r ........................................................................... 8 13,095.73 1 ,6 3 6 . 9 6
A nalys is of th e c o r re la t io n coefficient: t = 11.00**
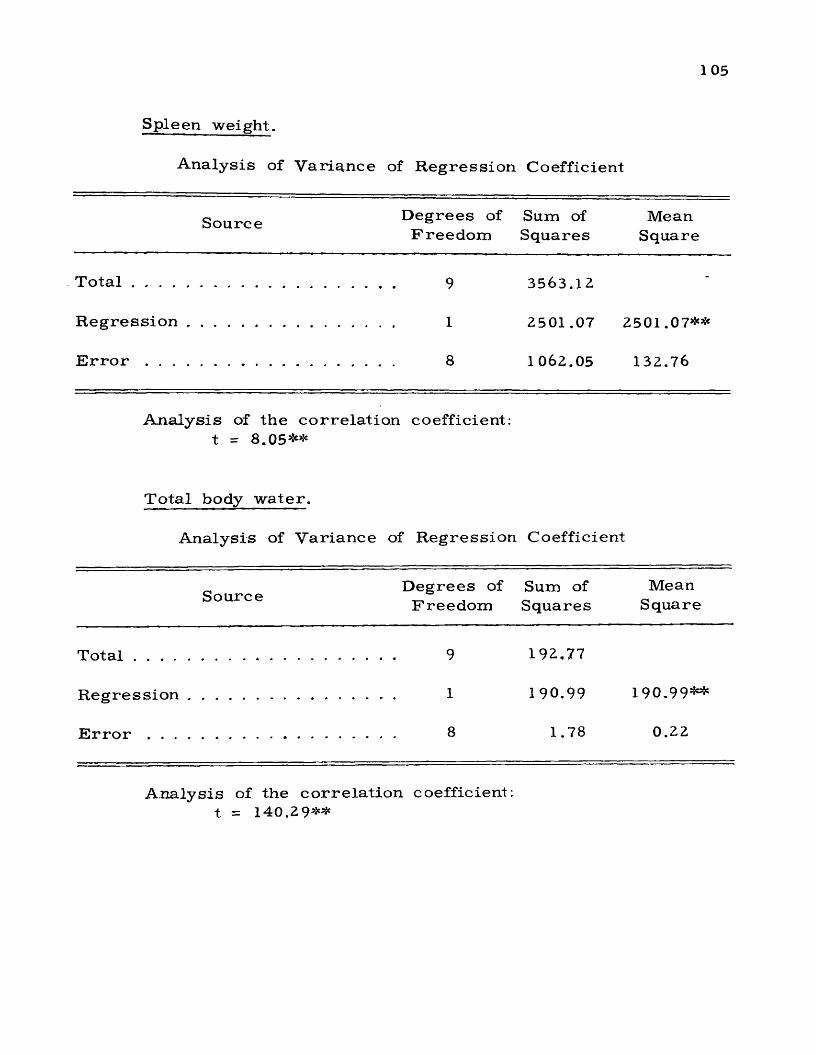
1 05
Spleen weight.
Analysis of Variance of Regression Coefficient
Source D egrees of Sum of MeanF re e d o m Squares Square
T o t a l ............................................................................... 9 3563.12
R e g r e s s i o n ............................................................... 1 2501.07 2501.07**
E r r o r ........................................................................... 8 1062.05 132.76
A n a ly s is of the c o r r e l a t io n coefficient: t = 8.05**
T o ta l body w a t e r .
A nalys is of V a r ian ce of R e g re s s io n Coefficient
D eg rees of Sum of MeanSO IU T C G F re e d o m S quares Square
T o t a l .............................................................................. 9 192.77
R e g r e s s i o n .................................................... . 1 190.99 190.99**
E r r o r .......................................................................... 8 1.78 0.22
A na ly s is of the c o r r e l a t io n coefficient: t = 140.2 9**
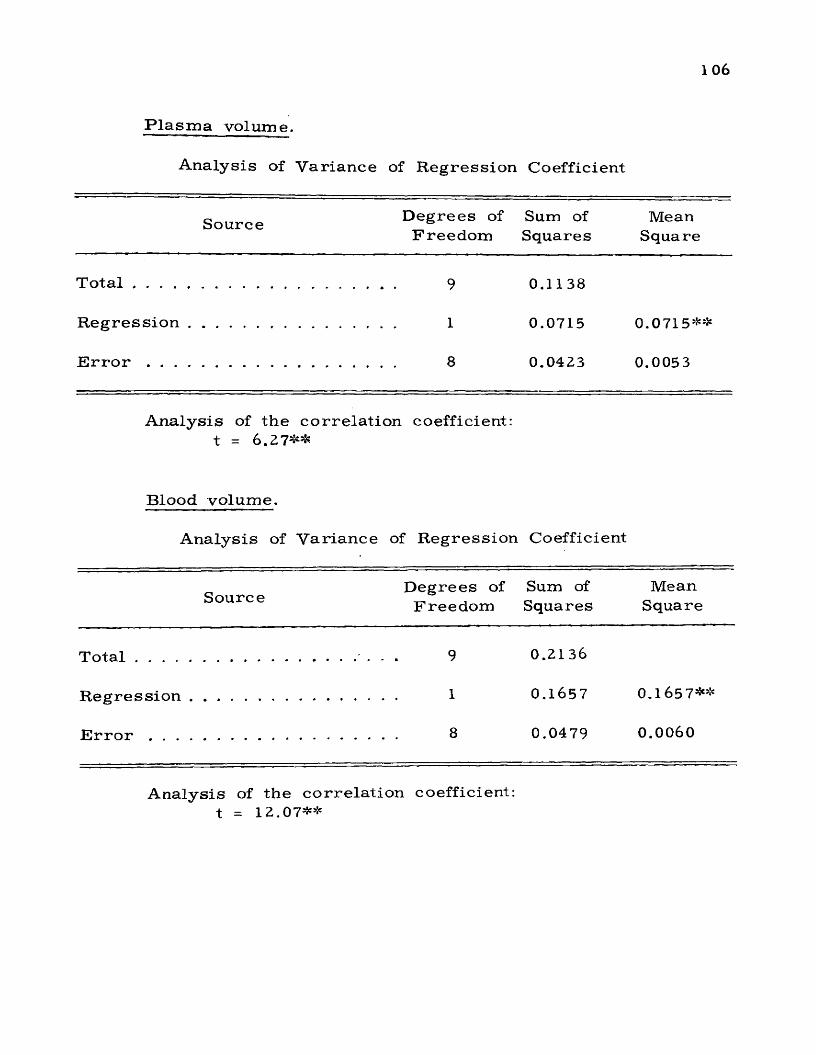
106
Plasma volume.
Analysis of Variance of Regression Coefficient
D eg rees of Sum of MeanF re e d o m Squares Square
T o t a l .............................................................................. 9 0.1138
R e g r e s s i o n ............................................................... 1 0.0715 0.0715**
E r r o r ........................................................................... 8 0.0423 0.0053
A na lys is of the c o r r e l a t io n coefficient: t = 6.27**
Blood v o lu m e .
A nalys is of V a r ia n c e of R eg re s s io n Coefficient
D eg rees of Sum of Meano u rce F r e e d o m Squares Square
T o t a l .......................................................................... 9 0.2136
R e g r e s s i o n ............................................................... 1 0.165 7 0.165 7**
E r r o r .............................................. 8 0.0479 0.0060
A nalys is of the c o r r e l a t io n coefficient: t = 12.07**
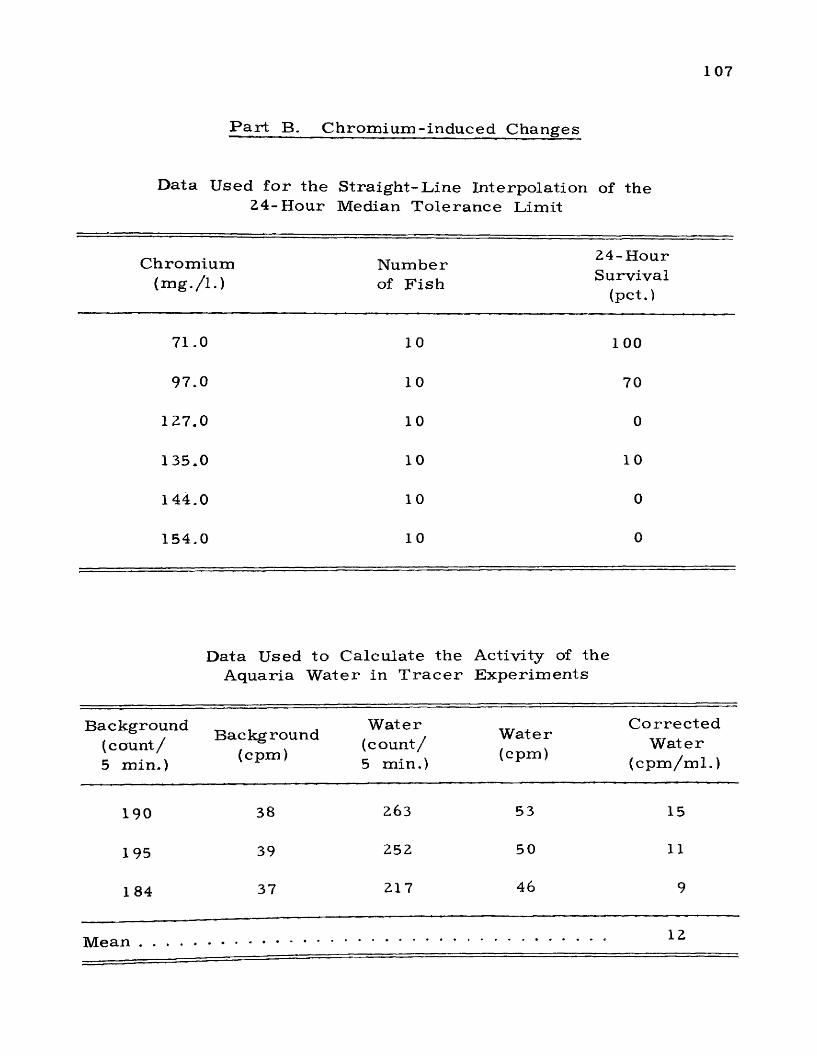
107
P a r t B. C h ro m iu m - in d u ce d Changes
Data Used f o r the 24- Hour
S t ra ig h t -L in e In te rpola tion Median T o le ran ce L im it
of the
C hrom ium N um ber 24-H our
(m g . / l . ) of F i s h Survival(pet.)
71.0 10 100
97.0 10 70
127.0 10 0
135.0 10 10
144.0 10 0
154.0 10 0
Data Used to Calcu la te the A quar ia W ate r in T r a c e r
Activity of the E x p e r im en ts
Background(count/5 min.)
Background(cpm)
W ate r (coun t / 5 min.)
W ate r(cpm)
C o r r e c t e d W a te r
( c p m / m l . )
190 38 263 53 15
195 39 252 50 11
1 84 37 217 46 9
Mean 12

1 08
Data Used to D e te rm in e Amount of C hrom ium in A quar ia W ate r in T r a c e r E xper im en t
SampleNo.
P e t . T r a n s .
C hrom ium (H-g*/sample)
Chrom ium(m g./ l .)
1 44.0 9.3 18.6
2 43.5 9.3 18.6
3 43.5 9.3 18.6
Weight s of the O rgans of F i s h Used in T r a c e r Exper im en t
F is h Spleen L iv e r Gall Kidney CaudalWt. Wt. Wt. B ladder Wt, Peduncle
(g.) (mg.) (mg*) Wt. (mg.) (mg.) Wt. (mg.)
8.1 1 7.0 131 .8 16.2 78.0 235.4
14.7 21 .6 158.0 24.8 94.4 1 70.4
15.8 63.0 1 74.2 41 .0 1 28.2 218.0
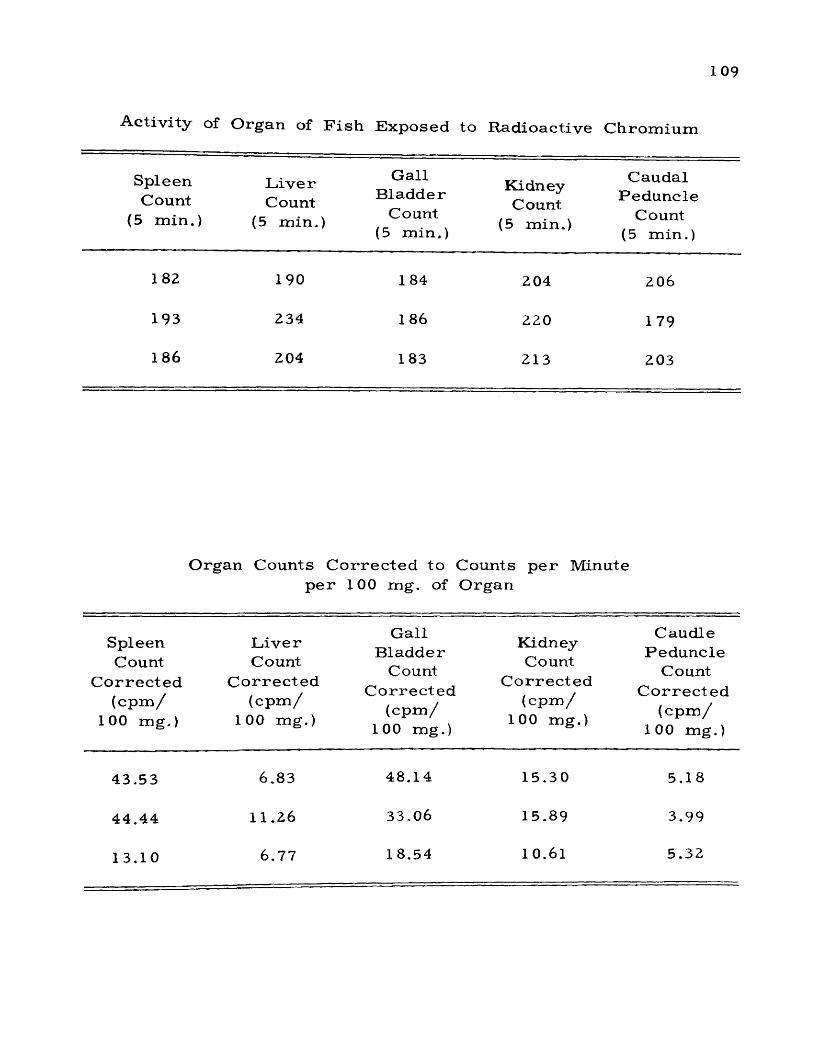
109
Activity of Organ of Fish Exposed to Radioactive Chromium
Spleen Count
(5 min .)
L iv e r Count
(5 min.)
Gall B ladder
Count (5 min.)
Kidney Count
(5 min.)
Caudal Peduncle
Count (5 min.)
182 190 1 84 204 206
193 2 34 186 220 179
186 204 183 213 203
Organ Counts C o r r e c t e d to p e r 100 mg. of
Counts p e r Minute O rgan
Spleen Count
C o r re c te d ( c p m /
100 mg.)
L iv e r Count
C o r r e c t e d ( c p m /
100 mg.)
Gall B ladde r
Count C o r re c t e d
(c p m / 100 mg.)
Kidney Count
C o r r e c t e d ( c p m /
100 mg.)
Caudle Peduncle
Count C o r r e c t e d
( c p m / 100 mg.)
43.53 6.83 48.14 15.30 5.18
44,44 11.26 33.06 15.89 3.99
13.10 6.77 18.54 1 0 . 6 1 5.32
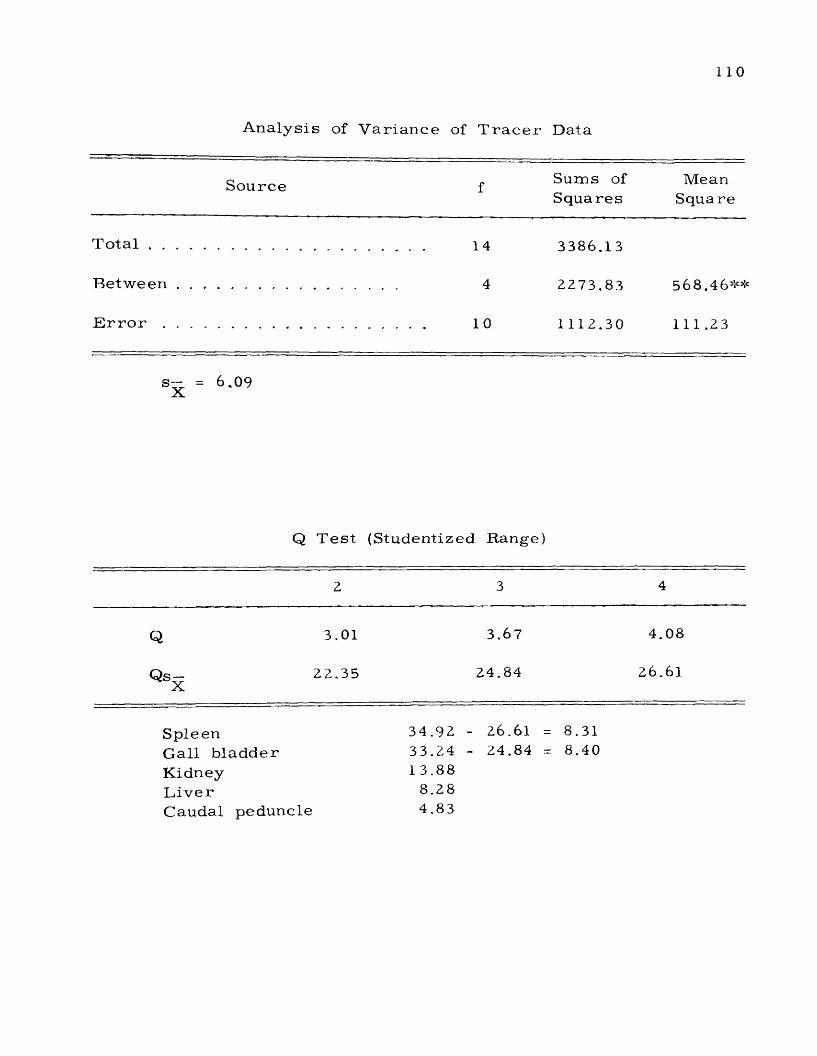
110
A n a l y s i s o f V a r i a n c e o f T r a c e r D a t a
Source f Sums of Squares
MeanSquare
T o t a l ......................................... 3386.13
B e t w e e n ........................................................ 4 2273,83 568.46**
E r r o r . .................................................... . . . . 10 1112.30 111 .23
s — = 6.092
Q T es t {Studentized Range)
2 3 4
Q 3.01 3.67 4.08
Qs— 22,35 X
24.84 26.61
SpleenGall b ladderKidneyL iv e rCaudal peduncle
34.92 - 26.61 = 8.31 33.24 - 24.84 = 8.40 13.88
8.28 4.83
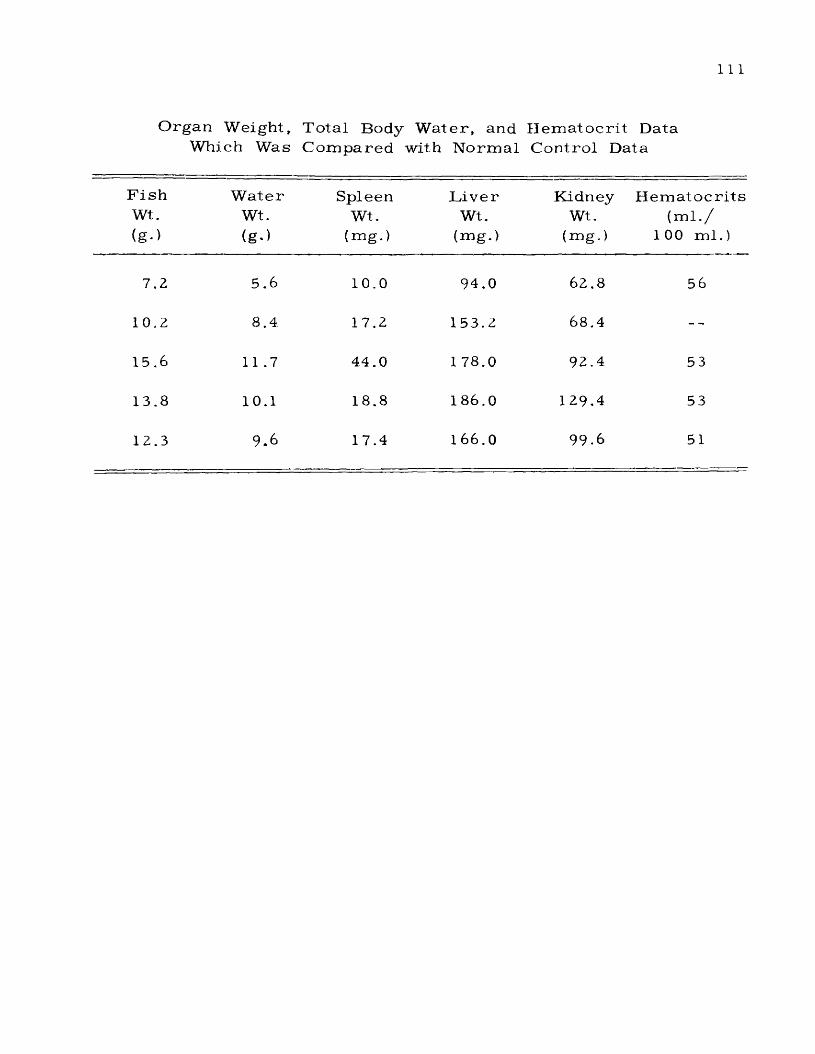
I l l
O rgan Weight, Total Body W ater , and H em ato c r i t Data Which Was C om pared with N orm al Control Data
F i s hWt.<g-)
W ate rWt.(g->
SpleenWt.
(mg.)
L iv e rWt.
(mg.)
KidneyWt.
(mg.)
H em a to c r i t s( m l . /
100 m l .)
7.2 5.6 10.0 94.0 62.8 5 6
10.2 8.4. 17.2 153.2 68.4
15.6 11.7 44 .0 1 78.0 92.4 53
13.8 10.1 18.8 186.0 129.4 53
12.3 9*6 17.4 1 6 6 . 0 99.6 51
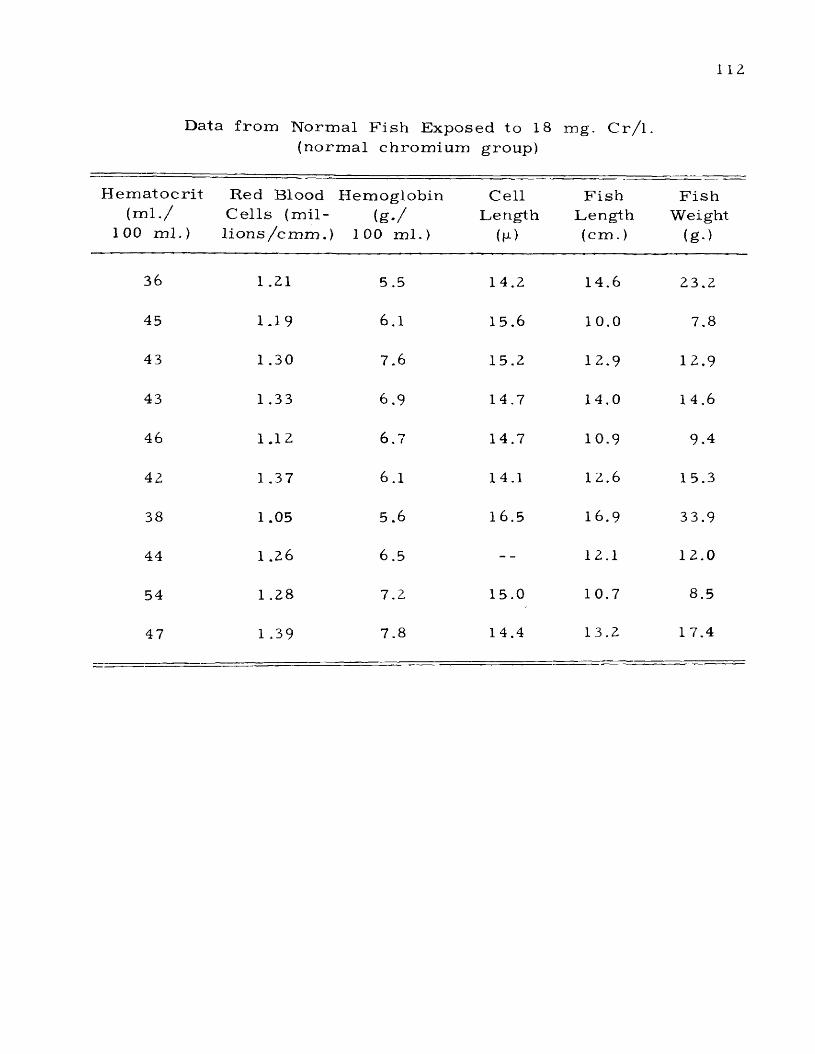
11 z
Data from Normal Fish Exposed to IB mg. Cr/l. (normal chromium group)
Hematocrit Red Blood Hemoglobin Cell Fish Fish(m l./ Cells (mil- (g*/ Length Length Weight
1 0 0 ml.) 1 ions/cmm.) 1 0 0 ml.) (p) (cm.) (g.)
36 1 .21 5.5 14.2 14.6 23.2
45 1.19 6.1 15.6 10.0 7.8
43 1 .30 7.6 15.2 1 2.9 12.9
43 1.33 6.9 14.7 14.0 1 4.6
46 1.12 6.7 14.7 10.9 9.4
42 1 .37 6.1 14.1 12.6 15.3
38 1.05 5.6 16.5 16.9 33.9
44 1 . 2 6 6.5 12.1 12.0
54 1 .28 7.2 15.0 1 0.7 8.5
47 1 .39 7.8 14.4 13.2 1 7.4
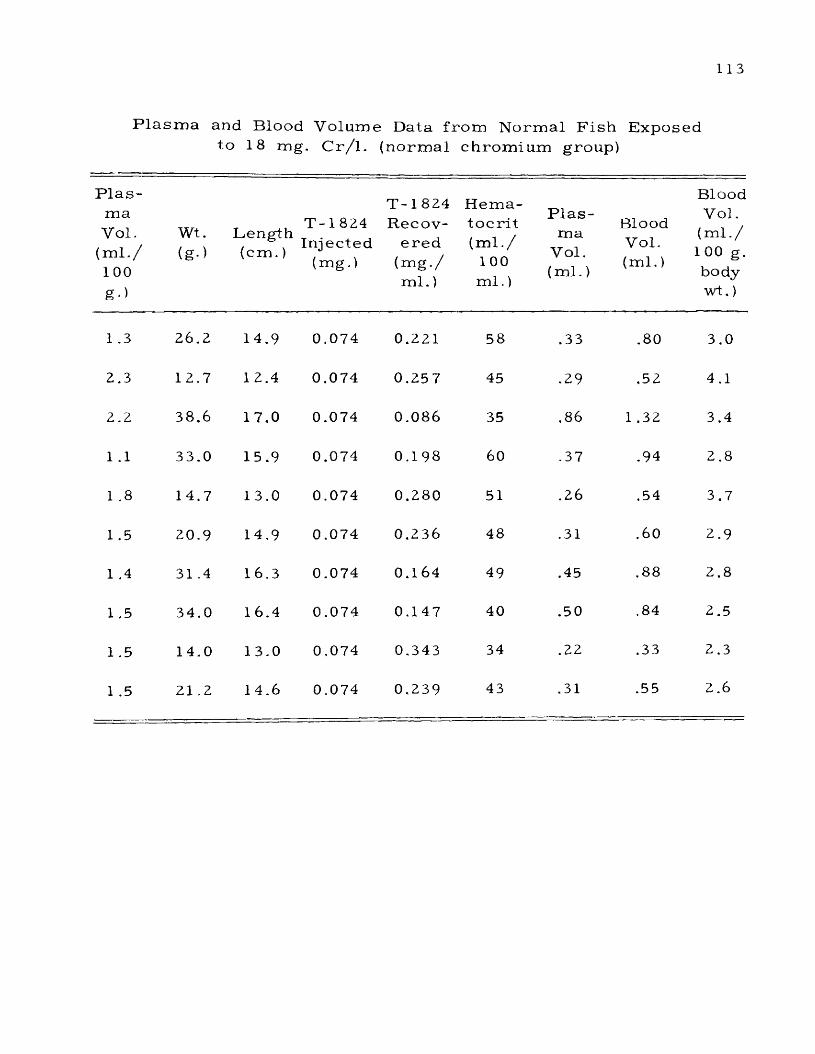
113
P la s m a and Blood Volume Data f rom N orm al F is h Exposed to 18 mg. C r / l . (norm al ch rom ium group)
P l a s maVol.
( m l . /100g*>
Wt.(g->
Length ( c m . )
T - 1 824 In jec ted
(mg-)
T - 1824 R ecov
e r e d (m g . / ml.)
H em ato c r i t(m l - /
100ml.)
P l a s ma
Vol. (m l . )
BloodVol.(ml.)
BloodVol.
(m l . /100 g.bodywt.)
1 .3 26.2 14.9 0,074 0.221 58 .33 .80 3.0
2.3 12.7 12.4 0.074 0.257 45 .29 .52 4.1
2.2 38.6 17.0 0.074 0.086 35 .86 1 .32 3,4
1 .1 33.0 15.9 0.074 0.198 60 .37 .94 2.8
1 .8 14.7 13.0 0.074 0.280 51 .26 .54 3.7
1 .5 20.9 14,9 0.074 0.236 48 .31 .60 2.9
1 .4 31 .4 16.3 0.074 0.164 49 .45 .88 2.8
1 .5 34.0 16.4 0.074 0,147 40 .50 .84 2.5
1 .5 14.0 13.0 0.074 0.343 34 .22 .33 2.3
1 .5 21.2 14.6 0.074 0,239 43 .31 .55 2.6
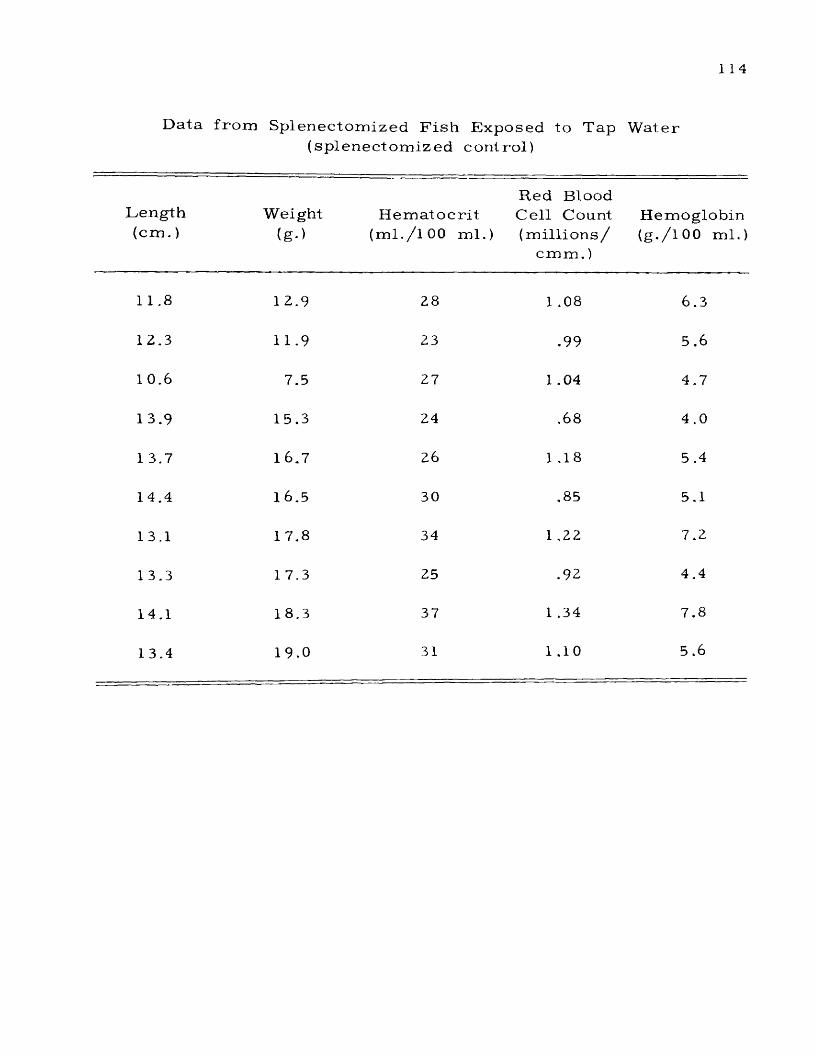
1 1 4
Data f rom Splenectomized F ish Exposed to Tap Water(sp lenec tom ized control)
Length ( c m . )
Weight(g->
H em ato c r i t (ml./lOO ml.)
Red Blood Cell Count (m i l l io n s /
c m m . )
Hemoglobin (g./lOO ml.)
11 -8 12.9 28 1 .08 6.3
12.3 11.9 23 .99 5.6
1 0.6 7.5 27 1 .04 4.7
1 3.9 15.3 24 .68 4.0
1 3.7 16.7 26 1 .18 5 .4
14.4 16.5 30 .85 5.1
13.1 17.8 34 1 .22 7.2,
13.3 1 7.3 25 .92 4.4
14.1 18.3 37 1 .34 7.8
13.4 19.0 31 1.10 5.6
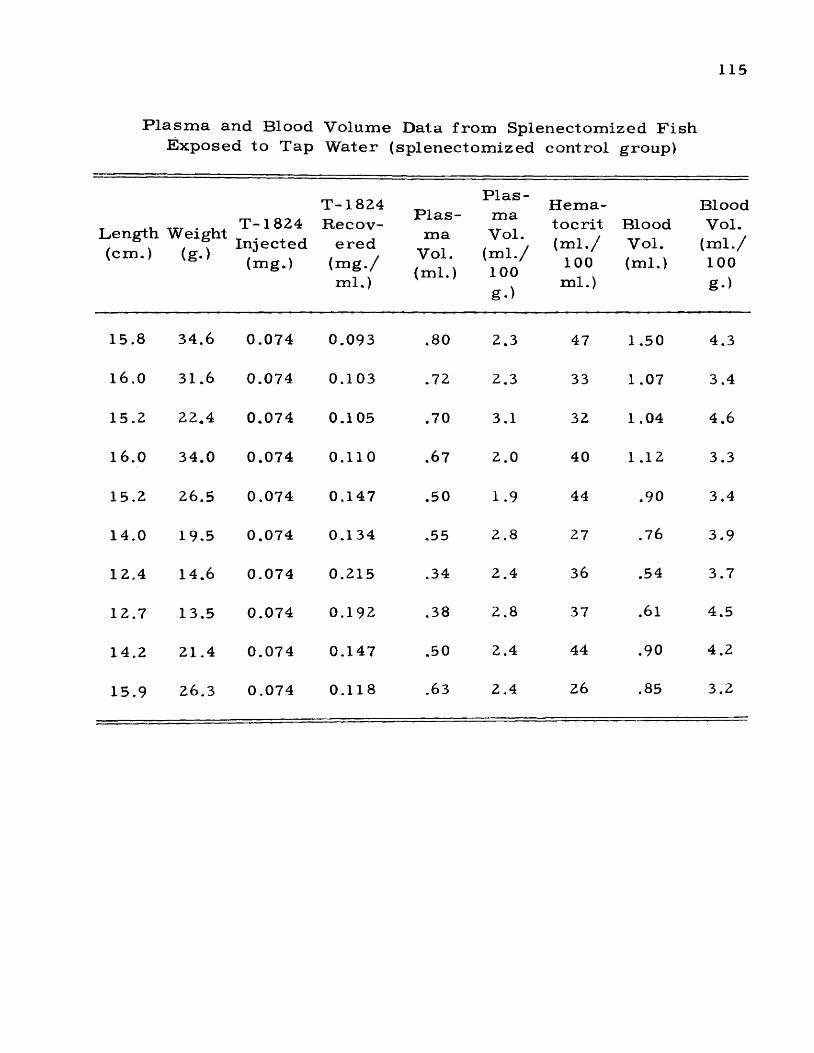
115
Plasma and Blood Volume Data from Splenectomized Fish Exposed to Tap Water (splenectomized control group)
length Weight (cm.) (g.)
T -1824 Injected
(mg.)
T -1824 Recov
ered (mg./ ml.)
Plasma
Vol.(ml.)
PlasmaVol.
(m l./1 0 0g.)
Hematocrit(m l./
1 0 0ml.)
BloodVol.(ml.)
BlooVol
(ml.,1 0 0g-)
15.8 34.6 0.074 0.093 .80 2.3 47 1.50 4.3
1 6 . 0 31.6 0.074 0.103 .72 2.3 33 1 .07 3.4
15.2 22,4 0.074 0.105 .70 3.1 32 1.04 4.6
1 6 . 0 34.0 0.074 0 . 1 1 0 .67 2 . 0 40 1 . 1 2 3.3
15.2 26.5 0.074 0.147 .50 1 .9 44 .90 3.4
14.0 19.5 0.074 0.134 .55 2 . 8 27 .76 3.9
12.4 14.6 0.074 0.215 .34 2.4 36 .54 3.7
12.7 13.5 0.074 0 . 1 9 2 .38 2 . 8 37 .61 4.5
14.2 21.4 0.074 0.147 .50 2.4 44 .90 4.2
15.9 26.3 0.074 0.118 .63 2.4 26 .85 3.2
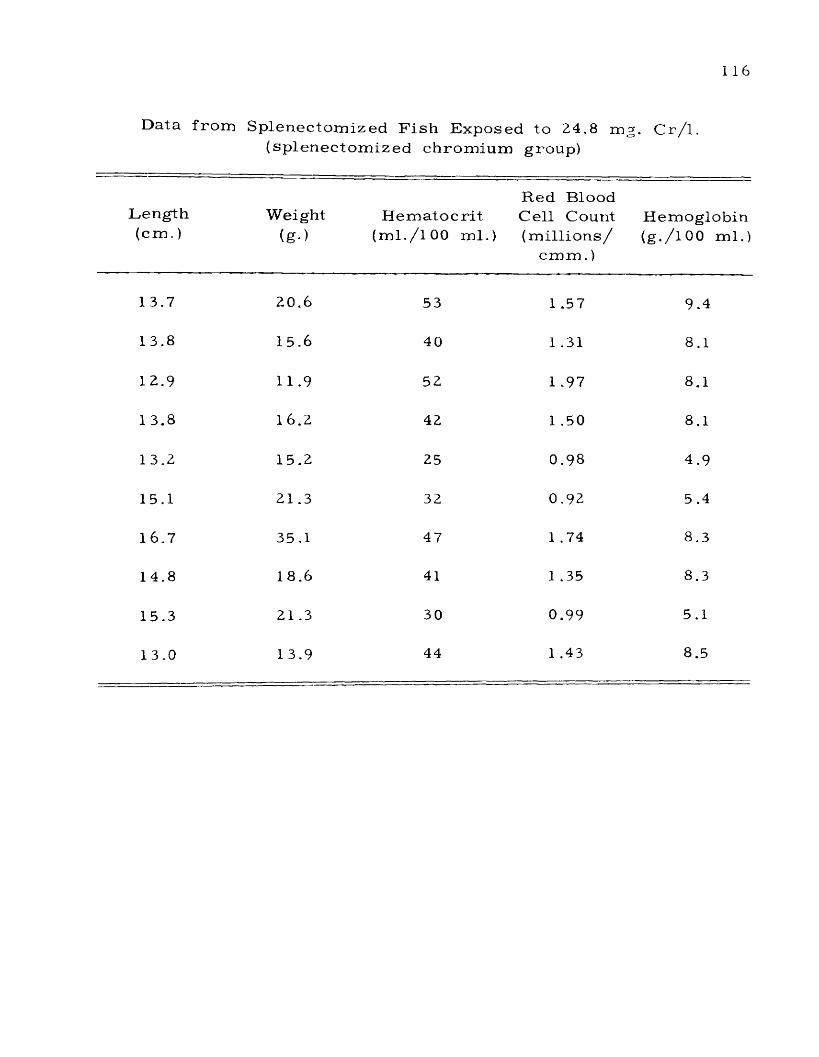
1 16
Data f ro m Sp lenec tom ized F i s h Exposed to 24.8 mg. C r / l . (sp lenec tom ized ch rom ium group)
Length ( c m . )
Weight
(g->H em ato c r i t
(ml./lOO ml.)
Red Blood Cell Count (m i l l io n s /
c m m .)
Hemoglobin (g./lOO ml.)
13.7 20.6 53 1 .57 9.4
13.8 15.6 40 1 .31 8.1
12.9 11.9 52 1 .97 8.1
1 3.8 16.2 42 1 .50 8.1
13.2 15.2 25 0.98 4.9
15.1 21.3 32 0.92 5 .4
16.7 35.1 47 1 .74 8.3
14.8 18.6 41 1 .35 8.3
15.3 21.3 30 0.99 5.1
13.0 13.9 44 1 .43 8.5
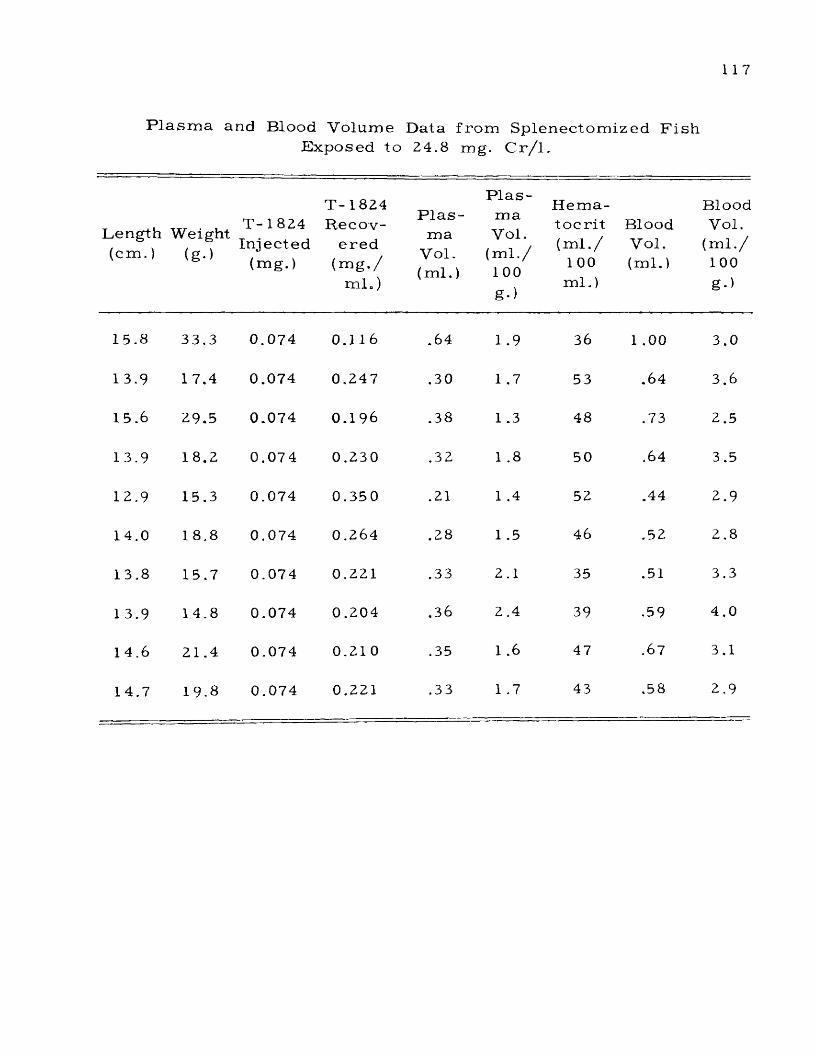
117
P la s m a and Blood Volume Data f rom Splenectom ized F is hExposed to 24.8 mg. C r / l .
^ength Weight (cm.) (g.)
T - 1824 In jec ted
(mg.)
T - 1824 Recov
e re d ( m g . /
m l . )
P l a s ma
Vol. (m l . )
P l a s maVol.
( m l . /100g>)
H em ato c r i t( m l . /
100ml.)
Blood Vol. (m l . )
BlooVol
(ml.,100g->
15.8 33.3 0.074 0.116 .64 1 .9 36 1 .00 3.0
13.9 17.4 0.074 0.247 .30 1 .7 53 .64 3.6
1 5.6 29.5 0.074 0.196 .38 1 .3 48 .73 2.5
13.9 18.2 0.074 0.230 .32 1 .8 50 .64 3.5
12.9 15.3 0.074 0.350 .21 1 .4 52 .44 2.9
14.0 18.8 0.074 0.264 .28 1 .5 46 .52 2,8
13.8 15.7 0.074 0.221 .33 2.1 35 .51 3.3
1 3.9 14.8 0.074 0.204 .36 2.4 39 .59 4.0
14.6 21.4 0.074 0.210 .35 1 .6 47 .67 3.1
14.7 19.8 0.074 0.221 .33 1 .7 43 .58 2.9
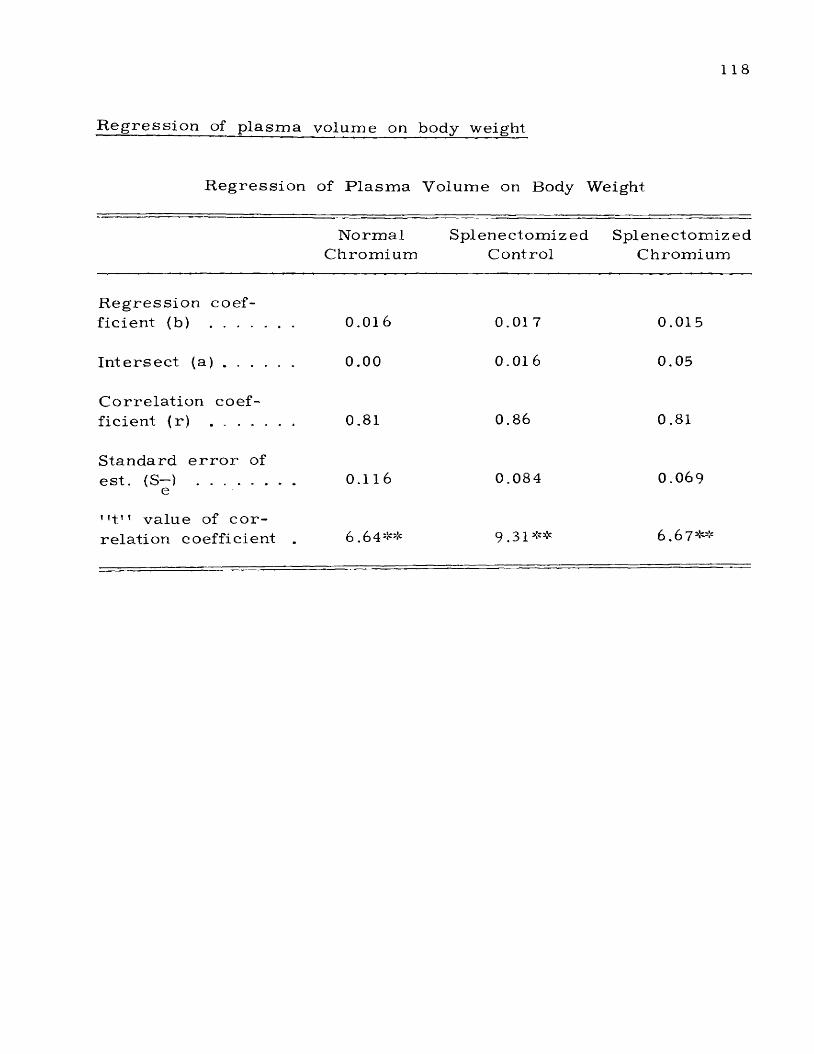
118
R e g r e s s io n of p la sm a volume on body weight
R e g re s s io n of P la s m a Volume on Body Weight
N orm alChrom ium
SplenectomizedControl
SplenectomizedChrom ium
R e g re s s io n coeff ic ien t (b) ....................... 0.016 0.01 7 0.015
In te r s e c t ( a ) ................... 0.00 0.016 0.05
C o r re la t io n coeff ic ien t (r) ....................... 0.81 0.86 0.81
Standard e r r o r ofes t . (S—) ...........................e
0.116 0.084 0.069
1' t M value of c o r re la t ion coeffic ient . 6.64** 9.31** 6.67**
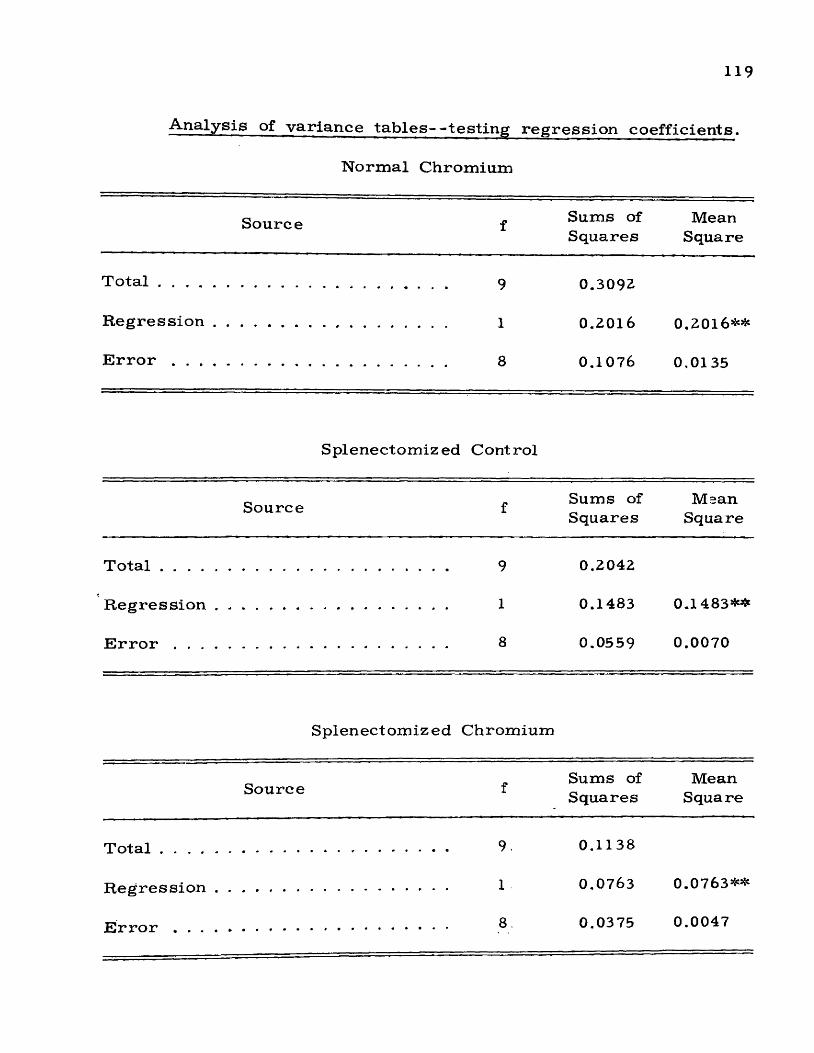
119
A n a ly sis of variance ta b le s— testin g reg ress io n co effic ien ts .
Normal Chromium
Source f Sums of Squares
MeanSquare
T o ta l .............. 9 0.3092
Regression 1 0 . 2 0 1 6 0 .2 0 1 6 **
Error . . . . 8 0 . 1 0 7 6 0,0135
Splenectomiz ed Control
Source f Sums of MeanI Squares Square
T o ta l .............. 9 0.2042
Regression , 1 0.1483 0.1483**
Error . . . . 8 0.0559 0.0070
Splenectomized Chromium
Source f Sums of Squares
MeanSquare
T o ta l .............. 9. 0.1138
Regression . 1 0.0763 0.0763**
8 0.0375 0.0047
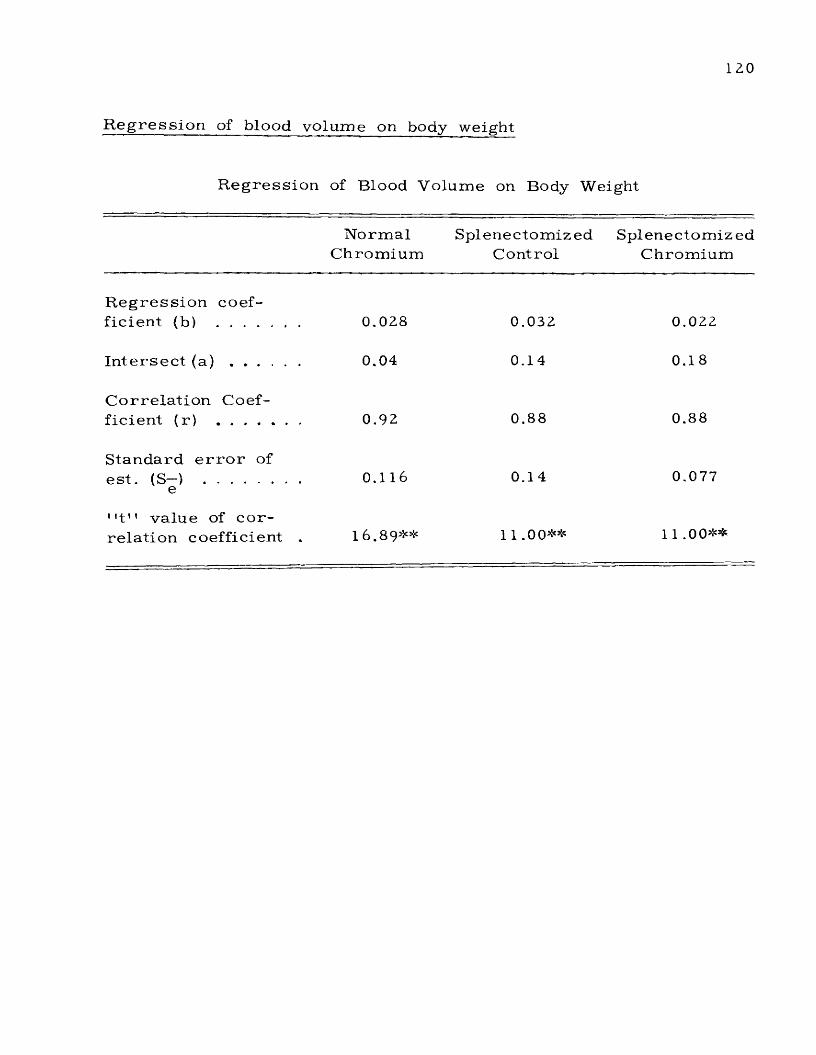
120
R e g re s s io n of blood volume on body weight
R e g re s s io n of Blood Volume on Body Weight
N orm alChrom ium
SplenectomizedControl
SplenectomizedChromium
R e g re s s io n coeff ic ien t (b) ....................... 0.028 0.032 0.022
In te r s e c t (a) ................... 0.04 0.14 0.18
C o r re la t io n Coeff ic ien t (r) ....................... 0.92 0.88 0.88
S tandard e r r o r ofes t . (S—) ..........................e
0.116 0.14 0.077
Mt M value of c o r re la t ion coefficient . 16.89** 11.00** 11 .00**
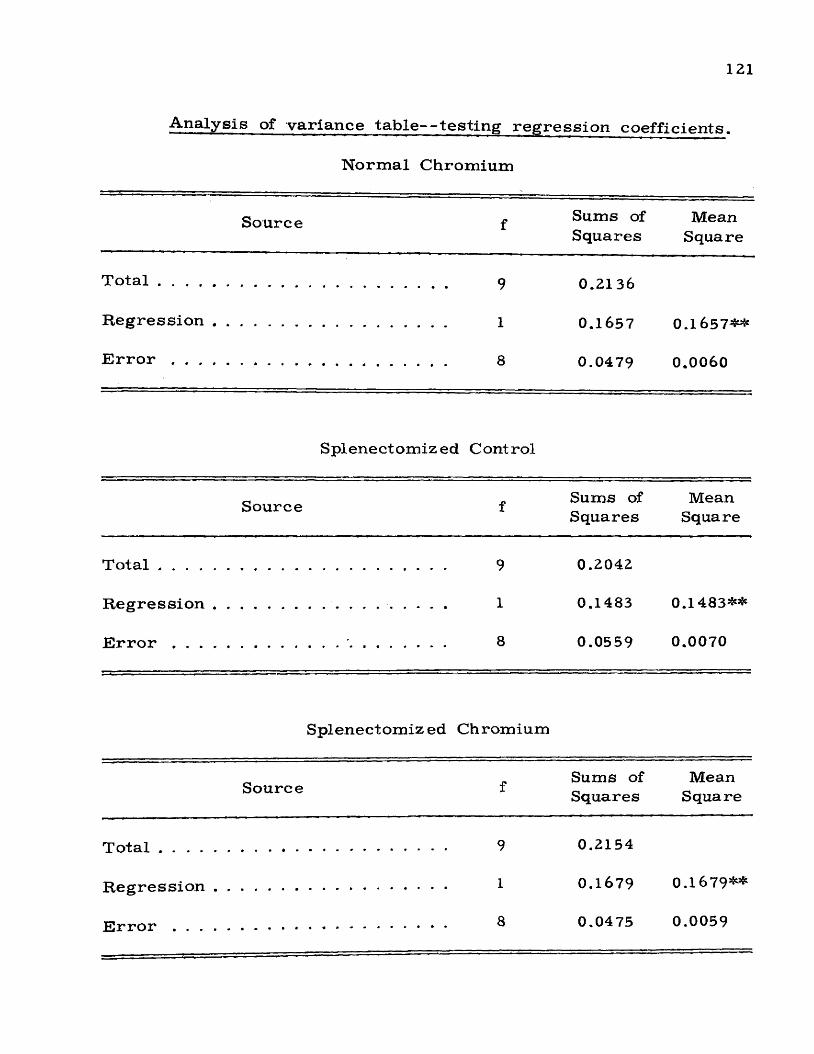
121
Analysis of variance table--testing regression coefficients.
Normal Chromium
Source f Sums of MeanSquares Square
T o ta l ........................................................................ 9 0.2136
R egression 1 0.1657 0.1657**
E r r o r 8 0.0479 0.0060
Splenectomized Control
Source f
T o ta l .............................................................................. 9
R egression . . . . ....................... 1
E r r o r ........................................... '.............................. 8
Sums of Squares
MeanSquare
0.2042
0.1483 0.1483**
0.0559 0.0070
Splenectomized Chromium
Source f Sums of Squares
MeanSquare
T o ta l............................................. ........................ 9 0.2154
R egression ................................... ........................................................ 1 0.1679 0 .1 679**
................. 8 0.0475 0.0059
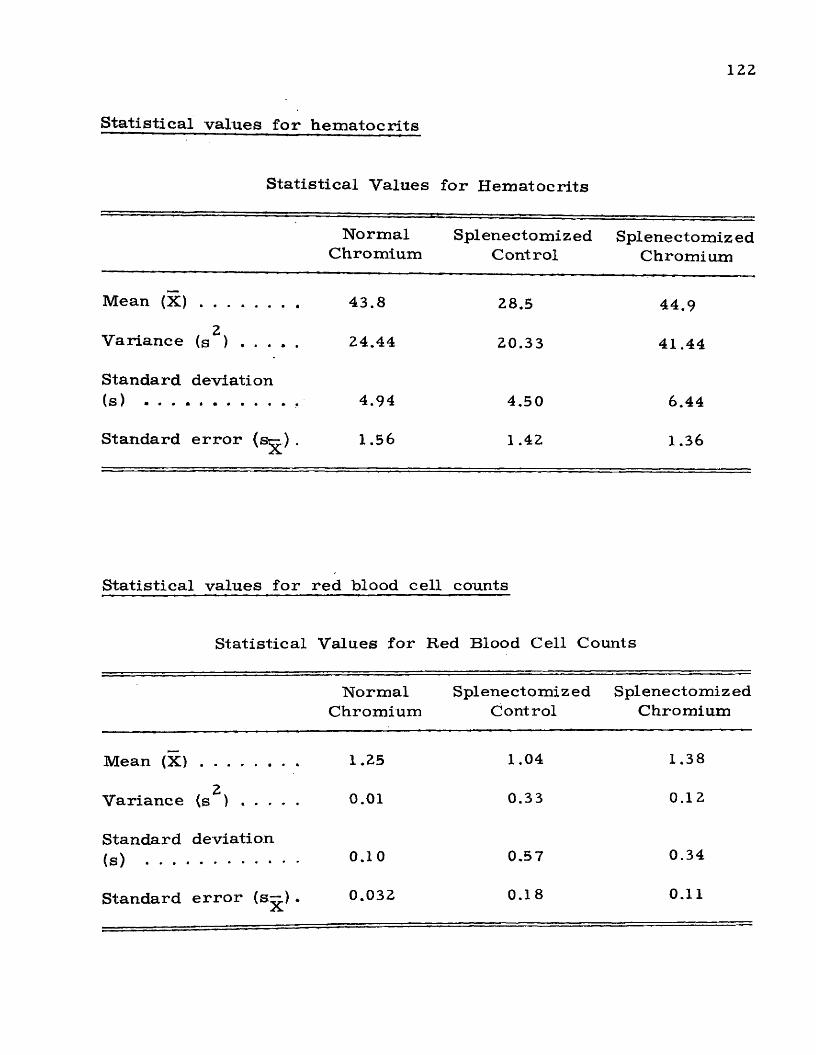
122
S ta tistica l va lu es fo r h em atocrits
S ta tistica l V alues for H em atocrits
NormalChromium
SplenectomizedControl
Splenectomiz ed Chromium
Mean (X) ........................ 43.8 28.5 44.9
Variance (s2) .............. 24.44 20.33 41.44
Standard deviation (s) ..................................., 4.94 4.50 6.44
Standard error (sr-) . 1.56 1.42 1.36
Statistical values for red blood cell counts
Statistical Values for Red Blood Cell Counts
NormalChromium
SplenectomizedControl
Splenectomiz ed Chromium
Mean (X) ........................ 1.25 1.04 1.38
Variance ( s ^ ) .............. 0 . 0 1 0.33 0 . 1 2
Standard deviation (s) ...................................... 0 . 1 0 0.57 0.34
Standard error (s—) . 0.032 0.18 0 . 11
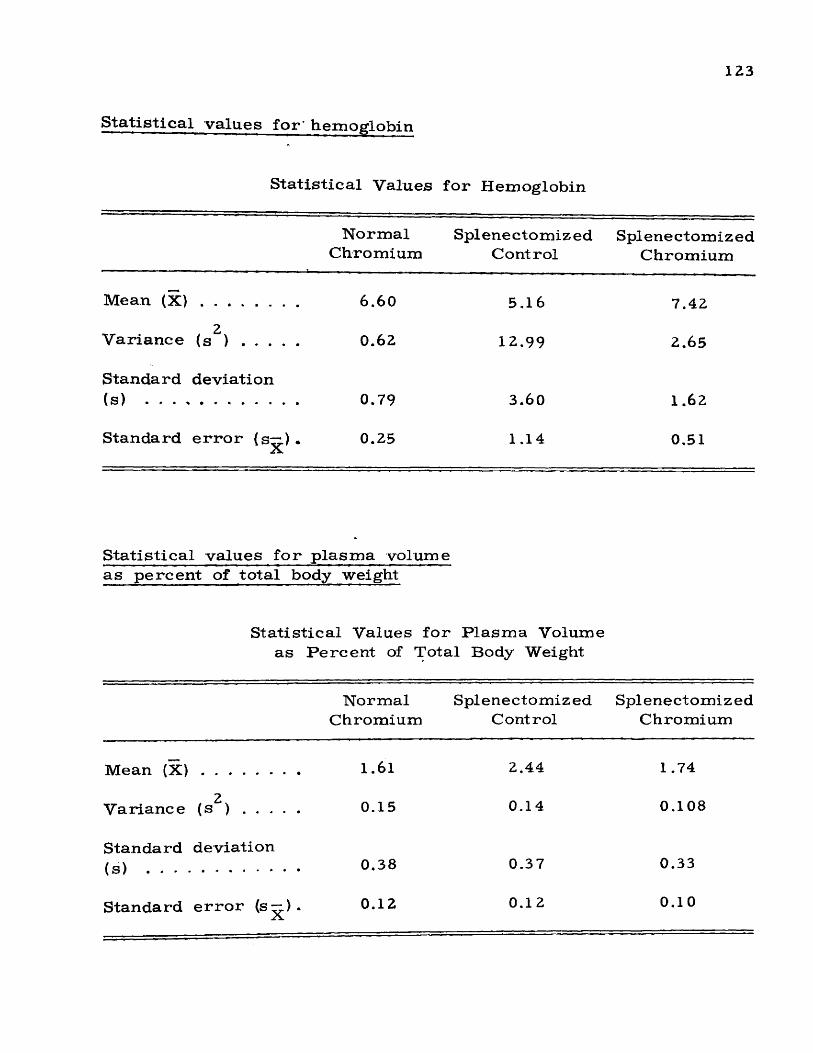
123
S ta tistica l v a lu es for' hem oglobin
S ta tistica l V alues for Hem oglobin
NormalChromium
SplenectomizedControl
SplenectomizedChromium
Mean (X) ........................ 6 . 6 0 5.16 7.42
Variance (s2) .............. 0 . 6 2 12.99 2.65
Standard deviation (s) ...................................... 0.79 3.60 1 . 6 2
Standard error { s ~ ) •X 0.25 1.14 0.51
Statistical values for plasma volumeas percent of total body weight
Statistical Values for Plasma Volume as Percent of Total Body Weight
NormalChromium
SplenectomizedControl
SplenectomizedChromium
Mean ( X ) ........................ 1 .61 2.44 1.74
Variance (s ) .............. 0.15 0.14 0.108
Standard deviation (s) ...................................... 0.38 0.37 0.33
Standard error (s^.) • 0 . 1 2 0 . 1 2 0 . 1 0
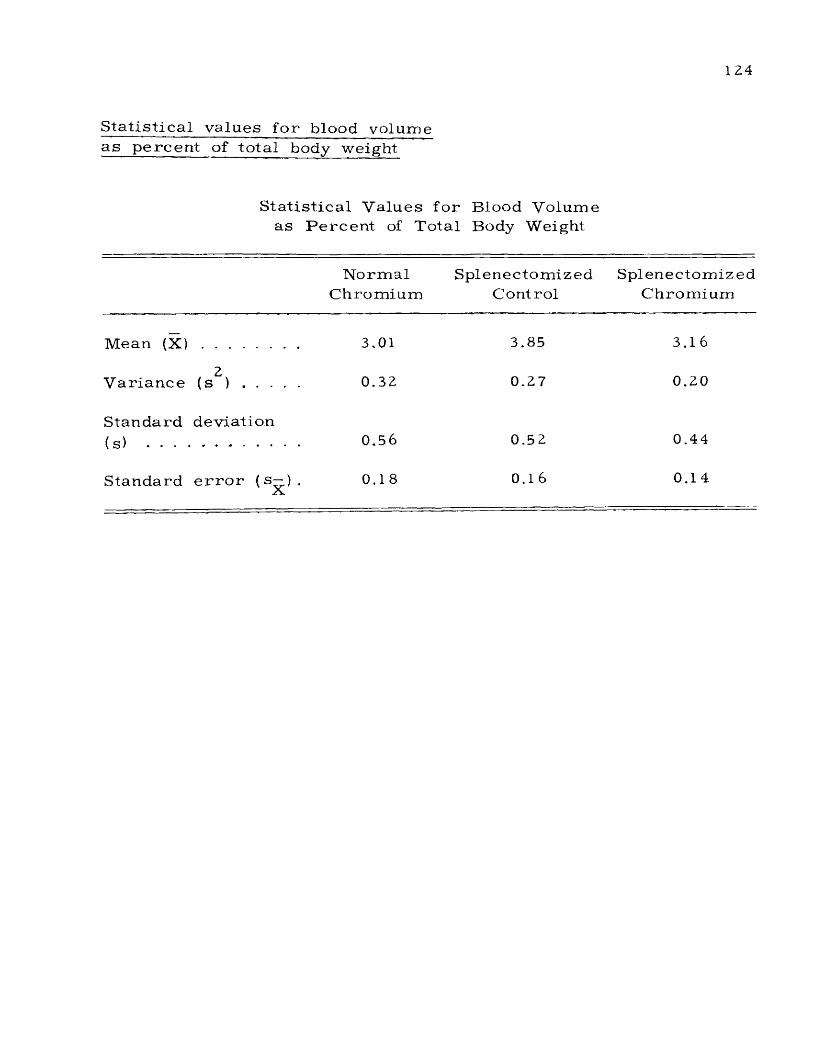
1 2 4
S ta t i s t ic a l values fo r blood volume a s p e rc e n t of to ta l body weight
S ta t is t ic a l V alues fo r Blood Volume as P e rc e n t of Total Body Weight
N orm alChrom ium
SplenectomizedControl
SplenectomizedChrom ium
Mean (X) 3.01 3.85 3.1 6
V ar ian ce2
(S ) ............... 0.32 0.27 0.20
Standard (s) . . • •
devia tion0.56 0.52 0.44
Standard e r r o r ( s—) . 0.18 0,16 0.14
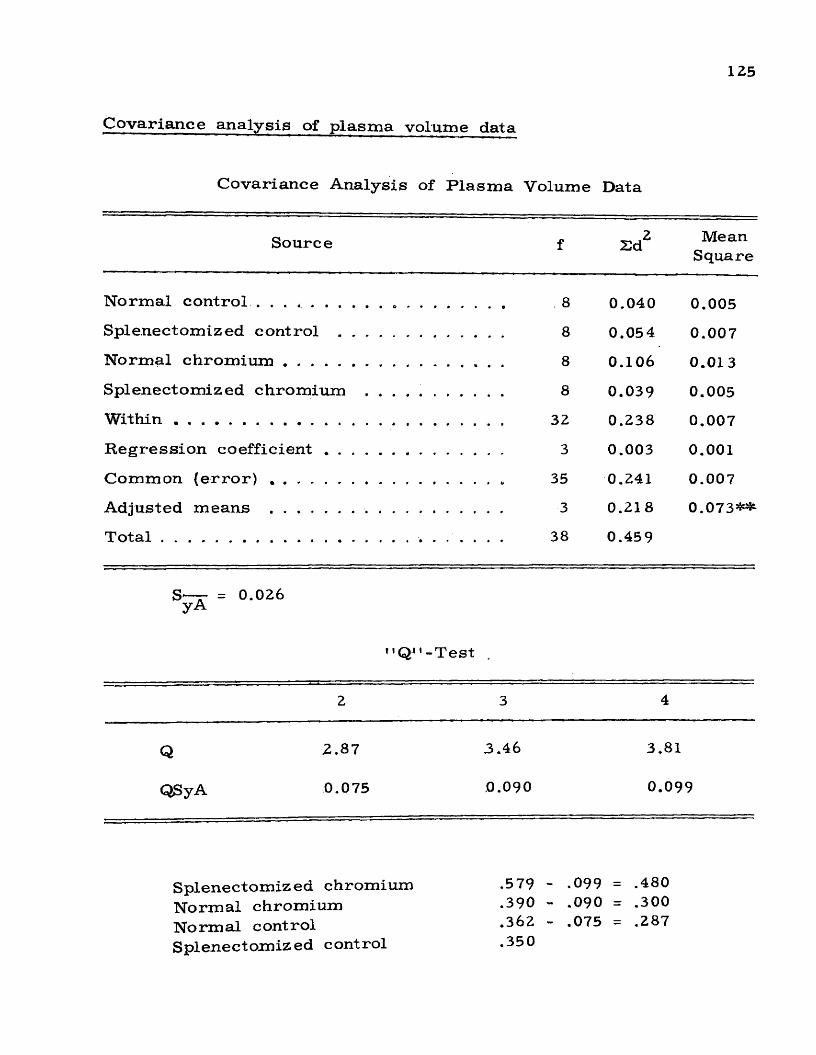
125
C o v a r ia n c e a n a ly s i s o f p la s m a v o lu m e d a ta
Covariance Analysis of Plasma Volume Data
Source f 2 d2 MeanSquare
Normal con tro l............................................................. . 8 0.040 0.005
Splenectomized control ......................................... 8 0.054 0.007
Normal chrom ium....................................................... 8 0 . 1 0 6 0.013
Splenectomized chromium .................................. 8 0.039 0.005
W ithin ............................................................................... . 32 0.238 0.007
Regression co effic ien t............................................ 3 0.003 0 . 0 0 1
Common ( e r r o r ) ...................................................... ... 35 0.241 0.007
Adjusted means .......................................................... 3 0.218 0.073**
T o ta l............................................................. ... 38 0.459
S— = 0.026 yA
''Q''-Test .
2 3 4
Q 2.87 3.46 3.81
QSyA 0.075 0 . 0 9 0 0.099
Splenec tom ized chrom ium N o rm a l ch rom ium N o rm a l contro l Sp lenec tom ized contro l
.579 ~ .099 = .480
.390 - . 0 9 0 = .300
. 3 6 2 - .075 = .287
.350
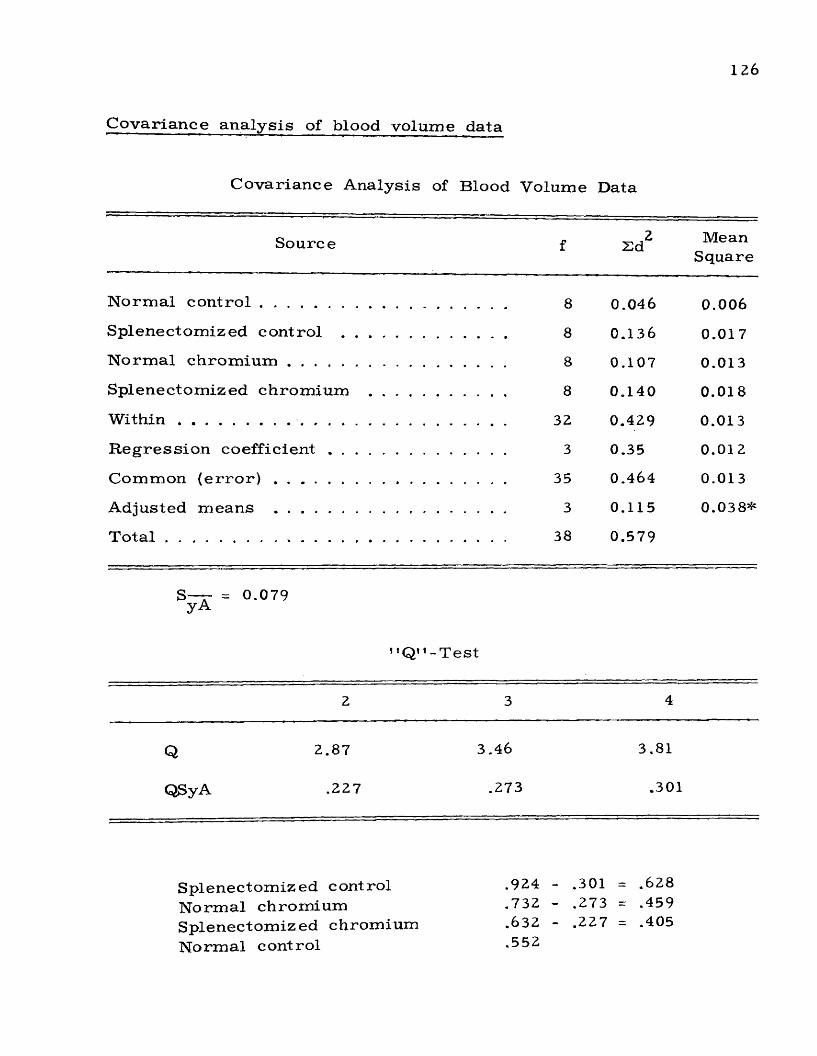
126
C o v a r ia n c e a n a ly s i s o f b lo o d v o lu m e d a ta
C ovariance A nalysis of Blood Volum e Data
Source f 22 d Mean
Square
Normal control............................ 8 0.046 0.006
Splenectomized control . . . 8 0.136 0.017Normal chrom ium .................... 8 0.107 0.013
Splenectomized chromium 8 0.140 0.018
W ithin ................................................ 32 0.429 0.013
Regression coefficient . . . , 3 0.35 0.012
Common ( e r r o r ) ........................ 35 0.464 0.013
Adjusted means ........................ 3 0.115 0.038*
Total . ................................................ 38 0.579
S— = 0.079yA
1 'QM-Test
2 3 4
Q 2.87 3.46 3.81
QSyA .227 .273 .301
Splenec tom ized contro l N orm a l ch rom ium Splenec tom ized ch rom ium N orm al contro l
.924 - .301 = .628
.732 - .273 = .459
.632 - .227 = .405
.552

127
A nalays is of v a r ia n c e of h em a to c r i t data
A nalys is of V ar iance of H em ato c r i t Data
Source f Sums of Squares
MeanSquare
T o t a l ............... ...................... 39 2902
Between . . . ...................... 3 1557 519**
E r r o r . , . . ...................... 6 1345 37.3
s x =1.93
MQM-Test
2 3 4
Q 2.87 3.46 3.82
^ X5.64 6.68 7.37
N o r m a l c h r o m i u m S p l e n e c t o m i z e d c h r o m i u m N o r m a l c o n t r o l S p l e n e c t o m i z e d c o n t r o l
43.8 - 7.37 = 36.440.6 - 6.68 = 33.931.8 - 5.64 = 26.228.5
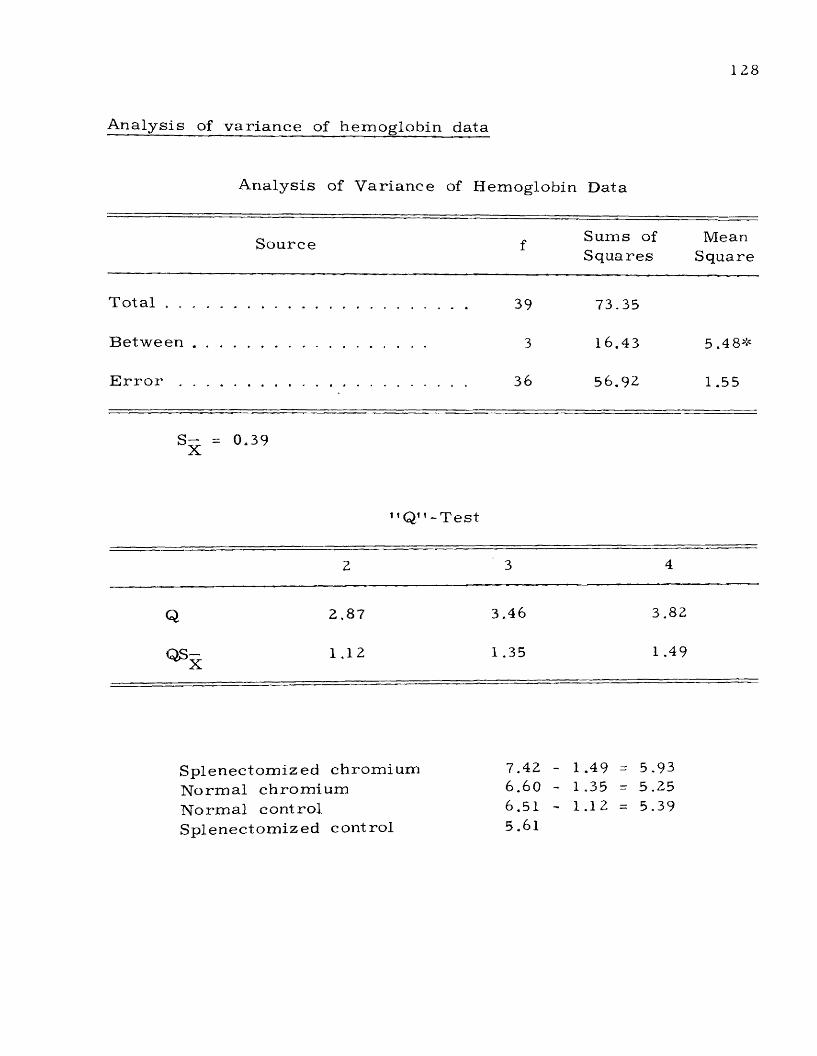
128
A nalys is of v a r ia n c e of hemoglobin data
A nalys is of V ar iance of Hemoglobin Data
Source f Sums of Squares
MeanSquare
T o t a l ................ . . . . . . . . . . . . . . . . . . . . . . . . . . . . . . . . . . . . . . . . . . . . . . . . . . . . . . . . . . . . . . . . . . 3 9 7 3 . 3 5
Between . . . . . . . . . . . . . . . . . . . . . . . . . . . . . . . . . . . . . . . . . . . . . . . . . . . . 3 1 6 . 4 3 5 . 4 8 *
E r r o r . . . .. . . . . . . . . . . . . . . . . . . . . . . . . . . . . . . . . . . . . . . . . . . . . . . . . . . . . . . . . . . . . . . . . . 3 6 5 6 , 9 2 1 . 5 5
s x = 0 . 3 9
1 ’Q11 - T es t
2 3 4
Q 2 . 8 7 3 . 4 6 3 . 8 2
OS- 1 . 1 2 1 . 3 5 1 . 4 9
S p l e n e c t o m i z e d c h r o m i u m 7 , 4 2 - 1 . 4 9 = 5 . 9 3N o r m a l c h r o m i u m 6 . 6 0 - 1 . 3 5 = 5 . 2 5N o r m a l c o n t r o l 6 . 5 1 - 1 . 1 2 = 5 . 3 9S p l e n e c t o m i z e d c o n t r o l 5 . 6 1
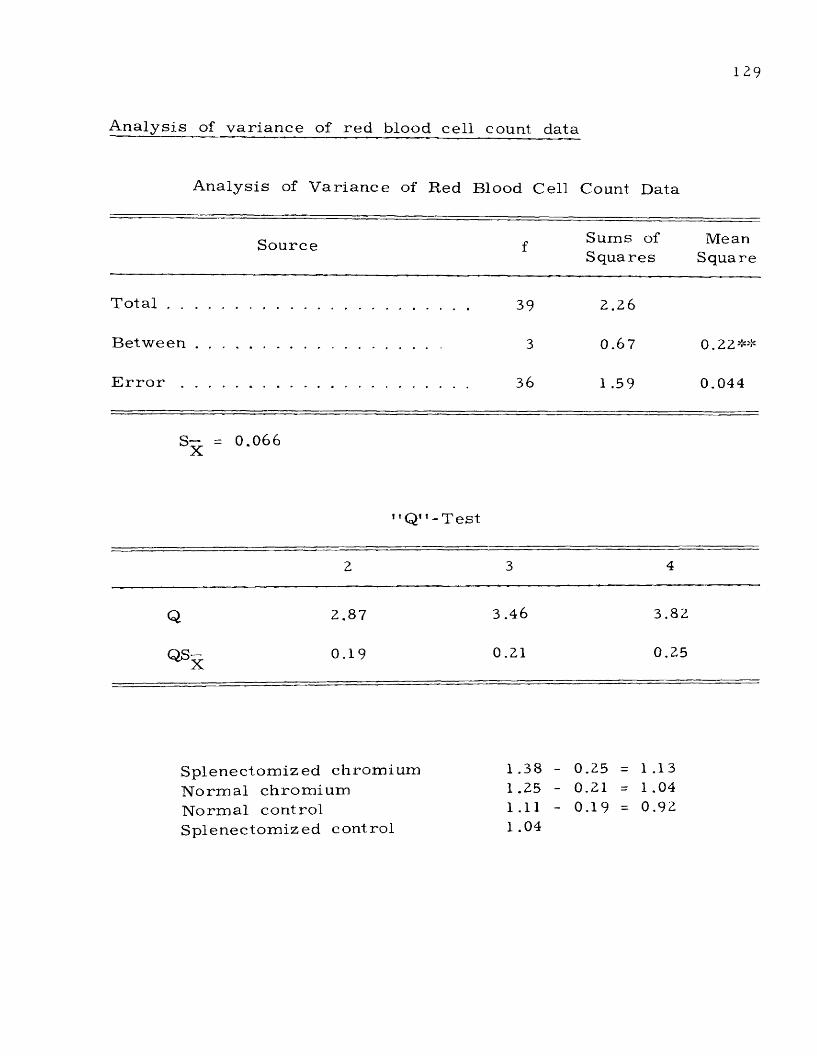
129
A nalys is of v a r ian ce of r ed blood cell count data
Analysis of V a r ian ce of Red Blood Cell Count Data
Source f Sums of Squares
MeanSquare
T o t a l ............... ...................... 39 2.26
Between . . . 0.67 0.22**
E r r o r . . . . ...................... 36 1 .59 0.044
s 5 =0.066
" Q11- T es t
Z 3 4
Q 2,87 3.46 3.82
OS- 0.19 0.Z1 0.25
Splenec tom ized chrom ium 1 .38 - 0.25 = 1.13N orm a l ch rom ium 1.25 - 0.21 = 1.04N orm al contro l 1.11 - 0.19 = 0.92Splenec tom ized cont rol 1 .04

130
1111T - T e s t s
Between n o rm a l ch rom ium and no rm al control:
Red blood cell counts t = 3.18**
Red blood cell lengths t = 4.7 7**
Data used in po ta ss ium chloridee x p e r im e n ts - - h e m a to c r i t s
Data Used in P o ta s s iu m Chloride Expe r i m e nt s - -H em a to c r i t s
Tap Water 29.8 mg. K /l 20 mg, C r / l .
Sam ples ,.............................. 39 38 47
32 44 44
33 37 33
30 38 44
34 45 40
3 6 34 35
28 35 43
32 39 34
37 35 38
39 43 44
Mean . . . ............... 34.0 38.8 40.2
Ya r iance ............... 13.77 85.55 24.44
Standard deviation . . 3.71 9.25 4.9
S tandard e r r o r . . . . 1.17 2 . 9 2 1.56

1 3 1
Mt T ' - T e s t s .
Between h e m a to c r i t s f rom KC1 solution and tap water:
t = 1.53
Between h e m a to c r i t s f rom KCl and C r solutions:
t = 0.42
Data used in de te rm ina t ion of sp leen function
Resu l ts of H em a to c r i t s D ete rm ined on Sham O pera ted and Splenectomized F ish
Splenec tom ized Control No T - 1824
Timeio
ShamOpera ted
Time0
ShamOperatedTime10
26 36 29 30
32 29 38 35
38 32 33 40
36 50 32 36
44 26 36 38