normalisation method for evaluation of metal contamination of soil józsef prokisch, ildikó...
TRANSCRIPT
NORMALISATION METHOD FOR EVALUATION OF METAL CONTAMINATION OF SOIL
József PROKISCH, Ildikó SZEGVÁRI, Éva SZÉLES, Béla KOVÁCS, Zoltán GYŐRI
University of DebrecenDepartment of Food Science and Quality Assurance4032 Debrecen Böszörményi út 138.E-mail: [email protected]

NORMALISATION METHOD: a method for calculation of geogenic and anthropogenic origin
of metals
Environmental Geochemistry And Health 2000, 22(4), pp 317-323Yttrium normalisation: A new tool for detection of chromium contamination in soil samplesProkisch-J Kovacs-B Palencsar-AJ Szegvari-I Gyori-Z
The measurement of chromium and yttrium concentration could give a chance to detect 5-10 times less chromium contamination in soil by using the yttrium normalisation method. The principle of the method is the following: elements such as chromium and yttrium exist naturally in the soil in a strongly bonded form. Therefore, in a noncontaminated area there should be a close correlation between the yttrium and chromium concentrations. If the measured Cr concentration in a sample is not on the Cr-Y trend line then the distance of plotted point from the line indicates the amount of anthropogenic chromium. Anthropogenic chromium can be detected only in the case when the contamination does not contain yttrium. This theory was tested in an agricultural-toxicological field experiment where Cr(VI) was added to the soil. Applying the yttrium normalisation method a much smaller anthropogenic effect was detected than by other evaluation methods.

NORMALISATION METHOD: a method for calculation of geogenic and anthropogenic origin
of metals
0
10
20
30
40
50
60
70
7 8 9 10 11 12 13
Yttrium [mg/kg]
Chr
omiu
m [
mg/
kg]
control
Cr(VI) treated
antropogenic
geogenic

y = 0,001257x + 1,717102
R2 = 0,851122
0
10
20
30
40
50
60
70
80
90
100
0 10000 20000 30000 40000 50000 60000 70000
Aluminium concentration [mg/kg]
Chr
omiu
m c
once
ntra
tion
[m
g/k
g]
Samples from the Soil Information and Monitoring System (TIM)
0
1
2
3
4
5
6
0 10 20 30 40 50 60
Time passed since 5 a.m. 11th March 2000 (hours)
mg/
l
CuPbZn
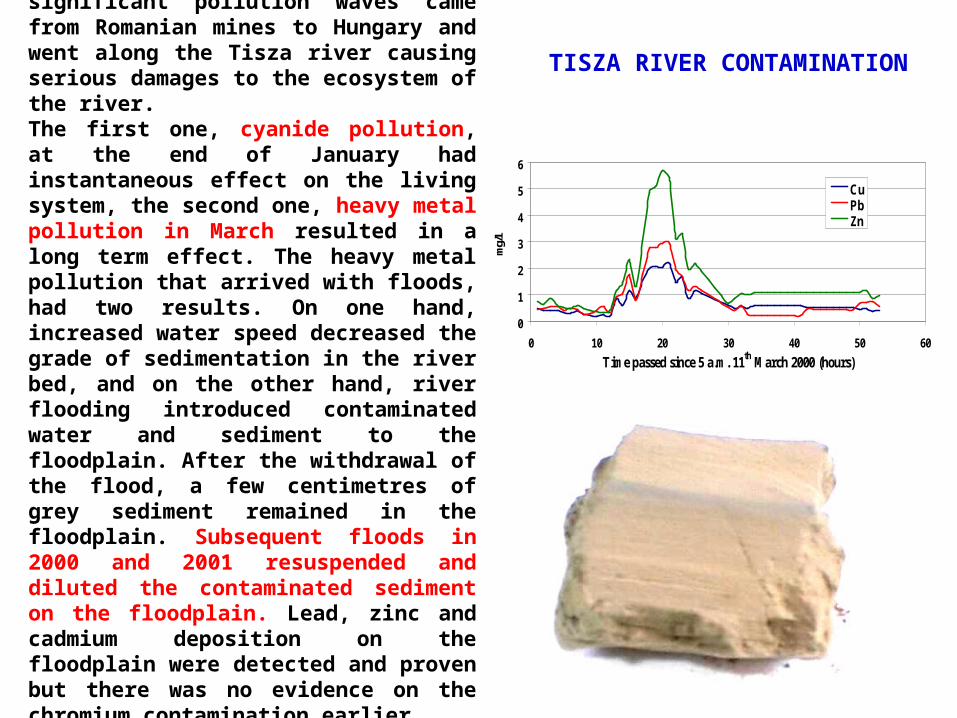
During the year 2000. two significant pollution waves came from Romanian mines to Hungary and went along the Tisza river causing serious damages to the ecosystem of the river. The first one, cyanide pollution, at the end of January had instantaneous effect on the living system, the second one, heavy metal pollution in March resulted in a long term effect. The heavy metal pollution that arrived with floods, had two results. On one hand, increased water speed decreased the grade of sedimentation in the river bed, and on the other hand, river flooding introduced contaminated water and sediment to the floodplain. After the withdrawal of the flood, a few centimetres of grey sediment remained in the floodplain. Subsequent floods in 2000 and 2001 resuspended and diluted the contaminated sediment on the floodplain. Lead, zinc and cadmium deposition on the floodplain were detected and proven but there was no evidence on the chromium contamination earlier.
TISZA RIVER CONTAMINATION
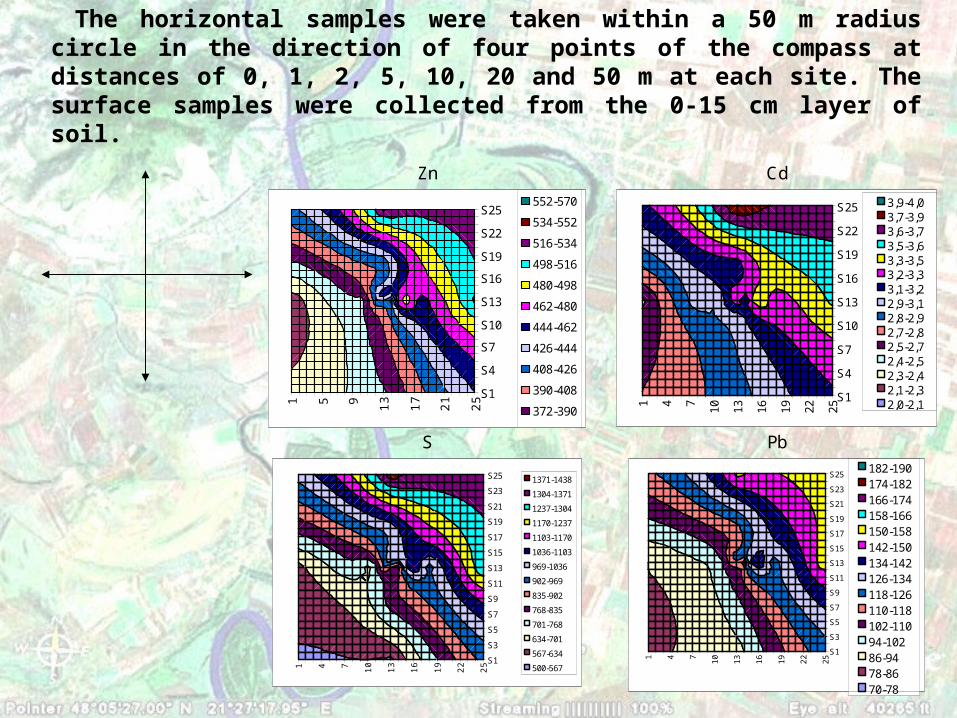
The horizontal samples were taken within a 50 m radius circle in the direction of four points of the compass at distances of 0, 1, 2, 5, 10, 20 and 50 m at each site. The surface samples were collected from the 0-15 cm layer of soil.
Zn
1 5 9 13 17 21 25
S1
S4
S7
S10
S13
S16
S19
S22
S25552-570
534-552
516-534
498-516
480-498
462-480
444-462
426-444
408-426
390-408
372-390
354-372
336-354
Cd
1 4 7 10 13 16 19 22 25
S1
S4
S7
S10
S13
S16
S19
S22
S25 3,9-4,03,7-3,93,6-3,73,5-3,63,3-3,53,2-3,33,1-3,22,9-3,12,8-2,92,7-2,82,5-2,72,4-2,52,3-2,42,1-2,32,0-2,1
S
1 4 7 10 13 16 19 22 25
S1
S3
S5
S7
S9
S11
S13
S15
S17
S19
S21
S23
S25 1371-1438
1304-1371
1237-1304
1170-1237
1103-1170
1036-1103
969-1036
902-969
835-902
768-835
701-768
634-701
567-634
500-567
Pb
1 4 7
10
13
16
19
22
25
S1
S3
S5
S7
S9
S11
S13
S15
S17
S19
S21
S23
S25182-190174-182166-174158-166150-158142-150134-142126-134118-126110-118102-11094-10286-9478-8670-78

y = 0,001346xR2 = 0,948
15
25
35
45
55
65
75
10000 20000 30000 40000
Al [mgkg]
Cr
[mg/
kg]
TIM data
L1S1
L1S2
L1S4
L2S1
L2S2
L2S3
y = 0,001346xR2 = 0,948
0
10
20
30
40
50
60
70
80
0 10000 20000 30000 40000 50000
Al [mgkg]
Cr
[mg/
kg]
TIM data
L1S3 (control)
L2S4 (control)
Samples from control and floodplain of Tisza River comparing to the TIM samples

Comparing the traditional and the normalisation method for the evaluation of chromium contamination of the floodplain
0
10
20
30
40
50
60
70
Sampling site
"Tot
al"c
hrom
ium
[m
g/kg
]
0
2
4
6
8
10
12
14
16
18
Sampling site
Ant
ropo
geni
c ch
rom
ium
[m
g/kg
]

Conclusions:
1. Normalisation method is an excellent tool for evaluation of metal contamination of soil
2. Geogenic and anthropogenic origin of metals can be separated
3. Contaminations can be detect much earlier
4. Good for Cr, Ni, Cu worth to try!