north american steel industry recent market developments, future prospects … · ·...
TRANSCRIPT
1
North American Steel Industry
Recent Market Developments, Future
Prospects and Key Challenges
OECD Steel Committee
June 8-9, 2009
Paris, France
*American Iron and Steel Institute (AISI)
Steel Manufacturers Association (SMA)
Specialty Steel Industry of North America (SSINA)
Canadian Steel Producers Association (CSPA)
Mexican Steel Producers Association (CANACERO)
2
Presentation Summary
I. NAFTA Economic Conditions and Outlook
II. NAFTA Steel Market Conditions and Outlook
III. NAFTA Steel Trade Challenges and Concerns

2
3
I. NAFTA Economic Conditions and Outlook
4
NAFTA Region Continues in Serious Recession
NAFTA Real GDP Since 2007
-6.3
-1.8
0
-5.7
-5.4
-5.9-8
-6
-4
-2
0
2
4
6
Q1 Q2 Q3 Q4 Q1 Q2 Q3 Q4 Q1
2007 2008 2009
Qu
arte
rly
% c
ha
ng
e
USA Canada Mexico
Sources: Bureau of Economic Analysis (US) , Statistics Canada, Canacero
3
55Sources: Bureau of Economic Analysis (US) ,CSSPA, Canacero
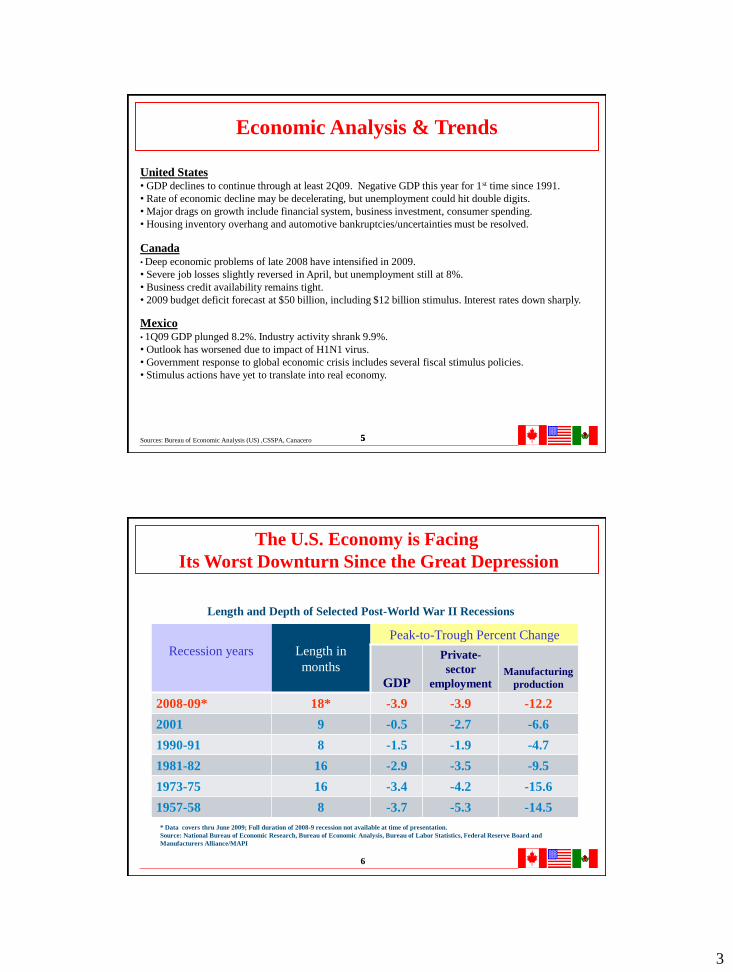
United States• GDP declines to continue through at least 2Q09. Negative GDP this year for 1st time since 1991.
• Rate of economic decline may be decelerating, but unemployment could hit double digits.
• Major drags on growth include financial system, business investment, consumer spending.
• Housing inventory overhang and automotive bankruptcies/uncertainties must be resolved.
Canada• Deep economic problems of late 2008 have intensified in 2009.
• Severe job losses slightly reversed in April, but unemployment still at 8%.
• Business credit availability remains tight.
• 2009 budget deficit forecast at $50 billion, including $12 billion stimulus. Interest rates down sharply.
Mexico• 1Q09 GDP plunged 8.2%. Industry activity shrank 9.9%.
• Outlook has worsened due to impact of H1N1 virus.
• Government response to global economic crisis includes several fiscal stimulus policies.
• Stimulus actions have yet to translate into real economy.
Economic Analysis & Trends
6
Length and Depth of Selected Post-World War II Recessions
Recession years Length in
months
Peak-to-Trough Percent Change
GDP
Private-
sector
employmentManufacturing
production
2008-09* 18* -3.9 -3.9 -12.2
2001 9 -0.5 -2.7 -6.6
1990-91 8 -1.5 -1.9 -4.7
1981-82 16 -2.9 -3.5 -9.5
1973-75 16 -3.4 -4.2 -15.6
1957-58 8 -3.7 -5.3 -14.5
The U.S. Economy is Facing
Its Worst Downturn Since the Great Depression
* Data covers thru June 2009; Full duration of 2008-9 recession not available at time of presentation.
Source: National Bureau of Economic Research, Bureau of Economic Analysis, Bureau of Labor Statistics, Federal Reserve Board and
Manufacturers Alliance/MAPI
4
77
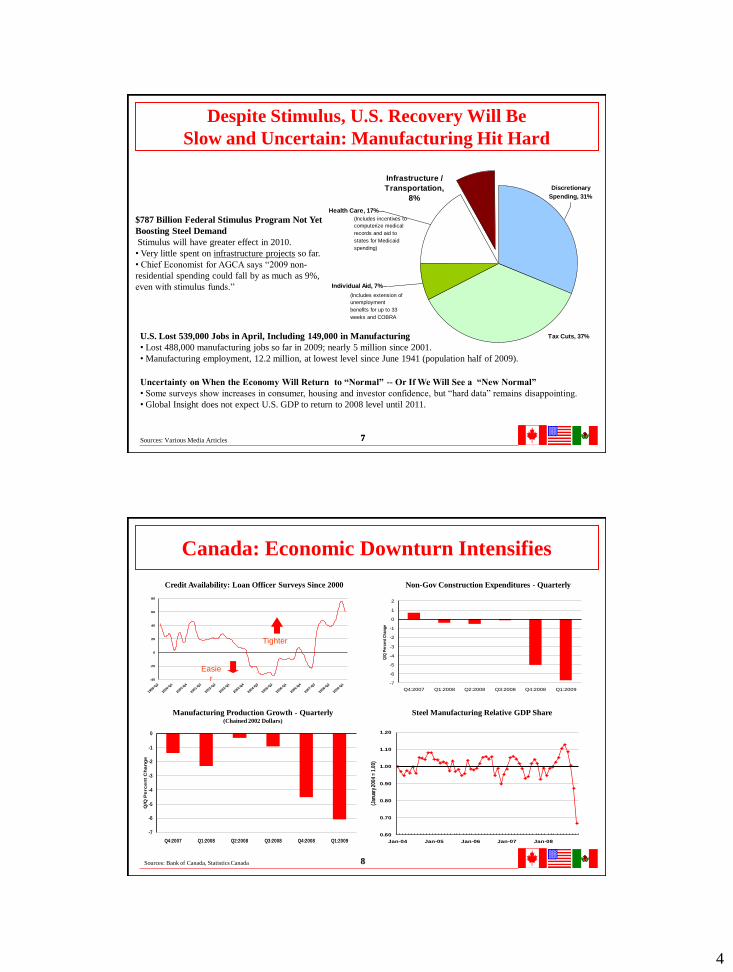
Despite Stimulus, U.S. Recovery Will Be
Slow and Uncertain: Manufacturing Hit Hard
$787 Billion Federal Stimulus Program Not Yet
Boosting Steel Demand
Stimulus will have greater effect in 2010.
• Very little spent on infrastructure projects so far.
• Chief Economist for AGCA says “2009 non-
residential spending could fall by as much as 9%,
even with stimulus funds.”
U.S. Lost 539,000 Jobs in April, Including 149,000 in Manufacturing
• Lost 488,000 manufacturing jobs so far in 2009; nearly 5 million since 2001.
• Manufacturing employment, 12.2 million, at lowest level since June 1941 (population half of 2009).
Sources: Various Media Articles
Uncertainty on When the Economy Will Return to “Normal” -- Or If We Will See a “New Normal”
• Some surveys show increases in consumer, housing and investor confidence, but “hard data” remains disappointing.
• Global Insight does not expect U.S. GDP to return to 2008 level until 2011.
Infrastructure /
Transportation,
8%
Health Care, 17%
Individual Aid, 7%
Tax Cuts, 37%
Discretionary
Spending, 31%
(Includes incentives to
computerize medical
records and aid to
states for Medicaid
spending)
(Includes extension of
unemployment
benefits for up to 33
weeks and COBRA
subsidy)
8
-40
-20
0
20
40
60
80
1999:Q
2
2000:Q
1
2000:Q
4
2001:Q
3
2002:Q
2
2003:Q
1
2003:Q
4
2004:Q
3
2005:Q
2
2006:Q
1
2006:Q
4
2007:Q
3
2008:Q
2
2009:Q
1
0.60
0.70
0.80
0.90
1.00
1.10
1.20
Jan-04 Jan-05 Jan-06 Jan-07 Jan-08
(Jan
uary
200
4 =
1.00
)
Canada: Economic Downturn Intensifies
Sources: Bank of Canada, Statistics Canada
Credit Availability: Loan Officer Surveys Since 2000 Non-Gov Construction Expenditures - Quarterly
Steel Manufacturing Relative GDP Share
-7
-6
-5
-4
-3
-2
-1
0
Q4:2007 Q1:2008 Q2:2008 Q3:2008 Q4:2008 Q1:2009
Q/Q
Pe
rc
en
t C
ha
ng
e
Manufacturing Production Growth - Quarterly(Chained 2002 Dollars)
-7
-6
-5
-4
-3
-2
-1
0
1
2
Q4:2007 Q1:2008 Q2:2008 Q3:2008 Q4:2008 Q1:2009
Q/Q
Per
cen
t C
han
ge
Easie
r
Tighter
5
9
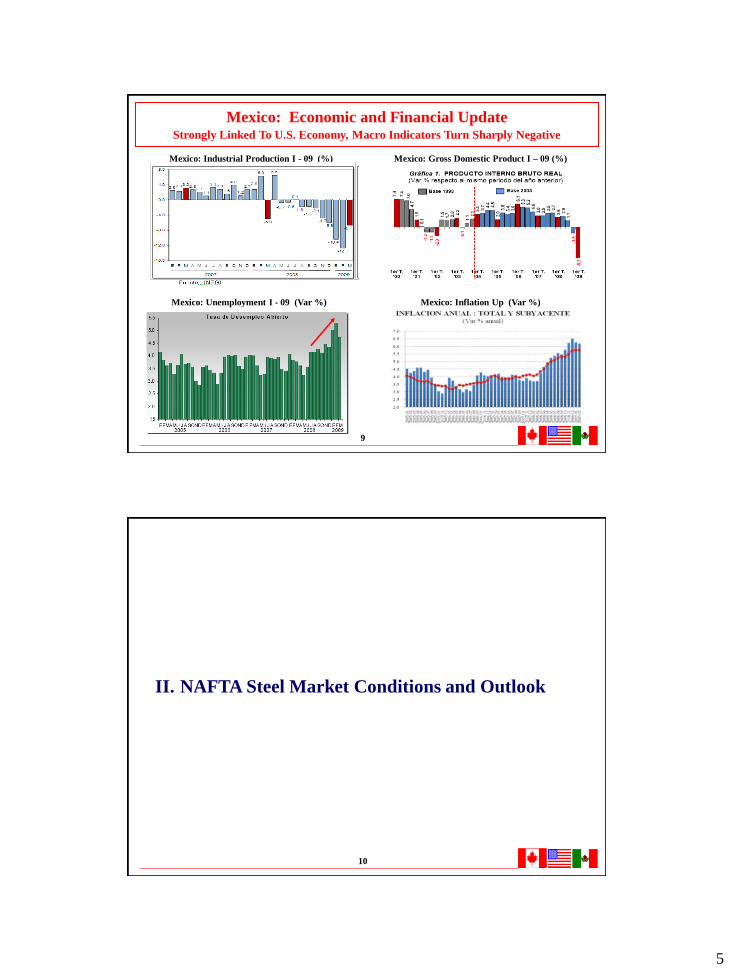
Mexico: Economic and Financial UpdateStrongly Linked To U.S. Economy, Macro Indicators Turn Sharply Negative
Mexico: Industrial Production I - 09 (%)
Mexico: Inflation Up (Var %)
Mexico: Gross Domestic Product I – 09 (%)
Mexico: Unemployment I - 09 (Var %)
10
II. NAFTA Steel Market Conditions and Outlook
6
11
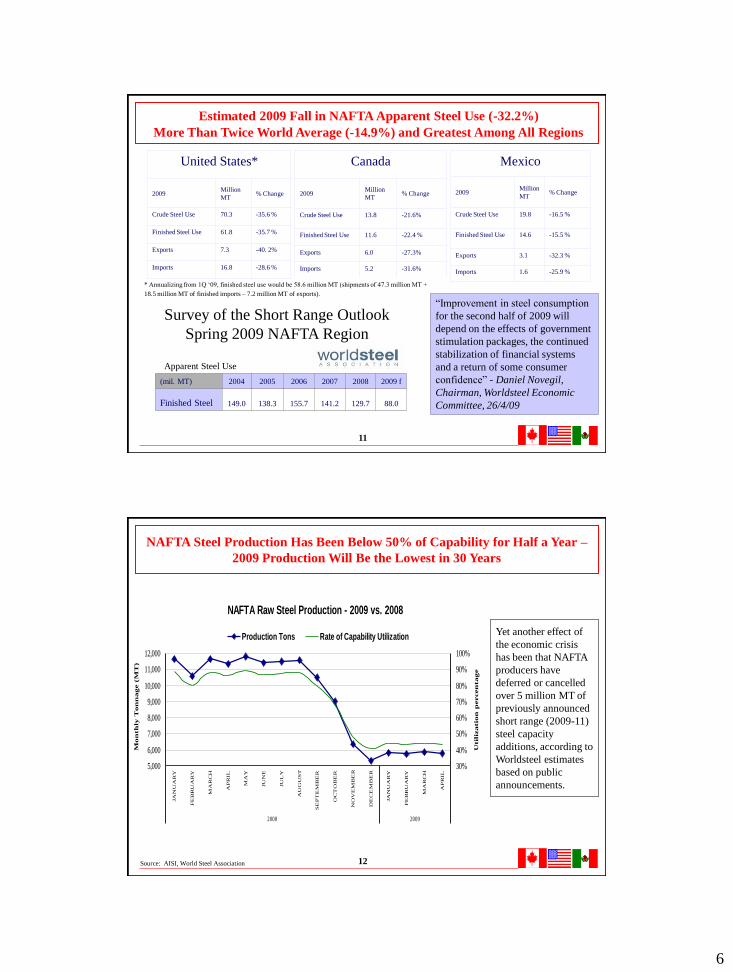
“Improvement in steel consumption
for the second half of 2009 will
depend on the effects of government
stimulation packages, the continued
stabilization of financial systems
and a return of some consumer
confidence” - Daniel Novegil,
Chairman, Worldsteel Economic
Committee, 26/4/09
Estimated 2009 Fall in NAFTA Apparent Steel Use (-32.2%)
More Than Twice World Average (-14.9%) and Greatest Among All Regions
(mil. MT) 2004 2005 2006 2007 2008 2009 f
Finished Steel 149.0 138.3 155.7 141.2 129.7 88.0
Apparent Steel Use
Survey of the Short Range Outlook
Spring 2009 NAFTA Region
United States*
2009Million
MT% Change
Crude Steel Use 70.3 -35.6 %
Finished Steel Use 61.8 -35.7 %
Exports 7.3 -40. 2%
Imports 16.8 -28.6 %
Canada
2009Million
MT% Change
Crude Steel Use 13.8 -21.6%
Finished Steel Use 11.6 -22.4 %
Exports 6.0 -27.3%
Imports 5.2 -31.6%
Mexico
2009Million
MT% Change
Crude Steel Use 19.8 -16.5 %
Finished Steel Use 14.6 -15.5 %
Exports 3.1 -32.3 %
Imports 1.6 -25.9 %
* Annualizing from 1Q „09, finished steel use would be 58.6 million MT (shipments of 47.3 million MT +
18.5 million MT of finished imports – 7.2 million MT of exports).
12Source: AISI, World Steel Association
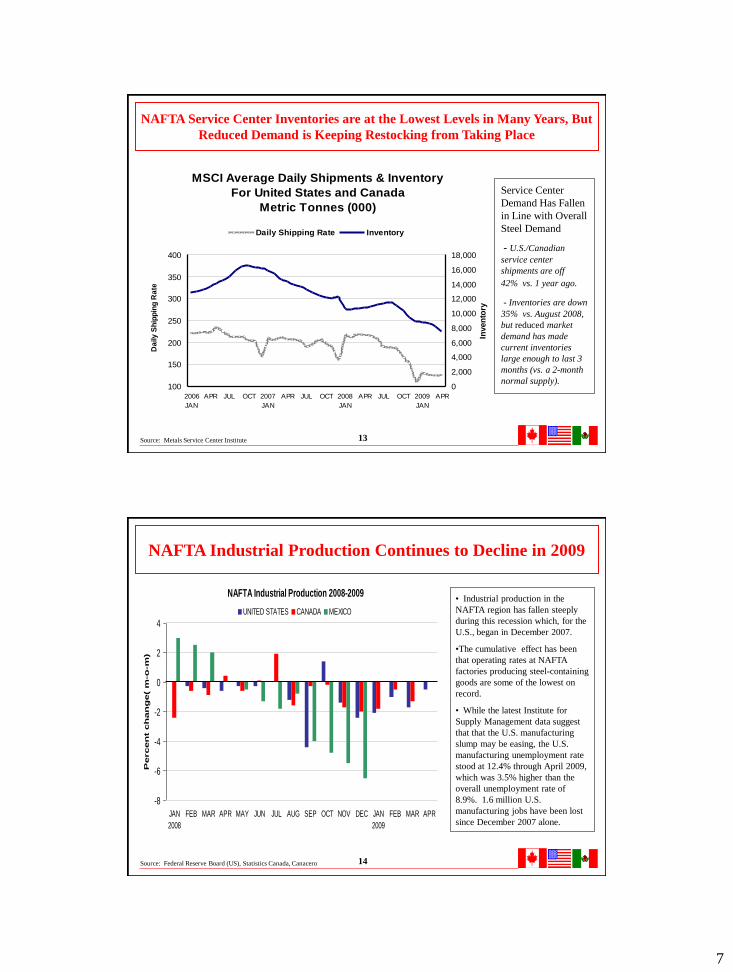
NAFTA Steel Production Has Been Below 50% of Capability for Half a Year –
2009 Production Will Be the Lowest in 30 Years
NAFTA Raw Steel Production - 2009 vs. 2008
5,000
6,000
7,000
8,000
9,000
10,000
11,000
12,000
JA
NU
AR
Y
FE
BR
UA
RY
MA
RC
H
AP
RIL
MA
Y
JU
NE
JU
LY
AU
GU
ST
SE
PT
EM
BE
R
OC
TO
BE
R
NO
VE
MB
ER
DE
CE
MB
ER
JA
NU
AR
Y
FE
BR
UA
RY
MA
RC
H
AP
RIL
2008 2009
Mon
th
ly T
on
nage (
MT
)
30%
40%
50%
60%
70%
80%
90%
100%
Util
izatio
n p
ercen
tage
Production Tons Rate of Capability UtilizationYet another effect of
the economic crisis
has been that NAFTA
producers have
deferred or cancelled
over 5 million MT of
previously announced
short range (2009-11)
steel capacity
additions, according to
Worldsteel estimates
based on public
announcements.
7
13
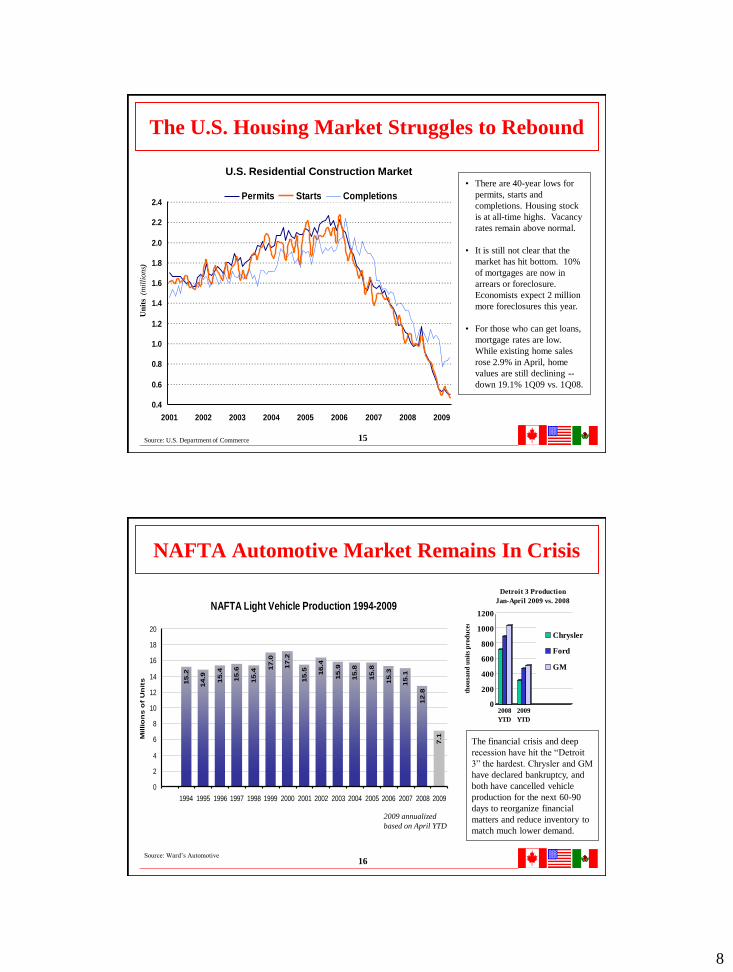
MSCI Average Daily Shipments & Inventory
For United States and Canada
Metric Tonnes (000)
100
150
200
250
300
350
400
2006
JAN
APR JUL OCT 2007
JAN
APR JUL OCT 2008
JAN
APR JUL OCT 2009
JAN
APR
Da
ily
Sh
ipp
ing
Ra
te
0
2,000
4,000
6,000
8,000
10,000
12,000
14,000
16,000
18,000
Inven
tory
Daily Shipping Rate Inventory
Source: Metals Service Center Institute
NAFTA Service Center Inventories are at the Lowest Levels in Many Years, But
Reduced Demand is Keeping Restocking from Taking Place
Service Center
Demand Has Fallen
in Line with Overall
Steel Demand
- U.S./Canadian
service center
shipments are off
42% vs. 1 year ago.
- Inventories are down
35% vs. August 2008,
but reduced market
demand has made
current inventories
large enough to last 3
months (vs. a 2-month
normal supply).
14Source: Federal Reserve Board (US), Statistics Canada, Canacero
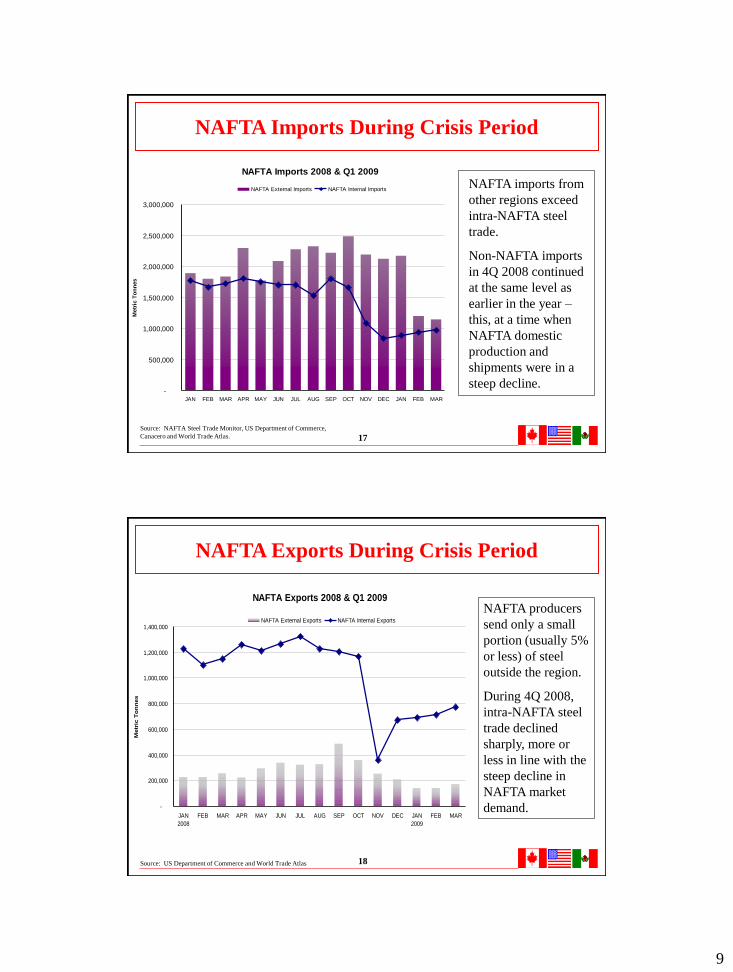
NAFTA Industrial Production Continues to Decline in 2009
NAFTA Industrial Production 2008-2009
-8
-6
-4
-2
0
2
4
JAN
2008
FEB MAR APR MAY JUN JUL AUG SEP OCT NOV DEC JAN
2009
FEB MAR APR
Percen
t c
han
ge( m
-o
-m
)
UNITED STATES CANADA MEXICO
• Industrial production in the
NAFTA region has fallen steeply
during this recession which, for the
U.S., began in December 2007.
•The cumulative effect has been
that operating rates at NAFTA
factories producing steel-containing
goods are some of the lowest on
record.
• While the latest Institute for
Supply Management data suggest
that that the U.S. manufacturing
slump may be easing, the U.S.
manufacturing unemployment rate
stood at 12.4% through April 2009,
which was 3.5% higher than the
overall unemployment rate of
8.9%. 1.6 million U.S.
manufacturing jobs have been lost
since December 2007 alone.
8
15
0.4
0.6
0.8
1.0
1.2
1.4
1.6
1.8
2.0
2.2
2.4
2001 2002 2003 2004 2005 2006 2007 2008 2009
Permits Starts Completions
• There are 40-year lows for
permits, starts and
completions. Housing stock
is at all-time highs. Vacancy
rates remain above normal.
• It is still not clear that the
market has hit bottom. 10%
of mortgages are now in
arrears or foreclosure.
Economists expect 2 million
more foreclosures this year.
• For those who can get loans,
mortgage rates are low.
While existing home sales
rose 2.9% in April, home
values are still declining --
down 19.1% 1Q09 vs. 1Q08.
U.S. Residential Construction Market
The U.S. Housing Market Struggles to Rebound
Source: U.S. Department of Commerce
Un
its
(m
illi
ons)
16
NAFTA Automotive Market Remains In Crisis
0
200
400
600
800
1000
1200
thou
san
d u
nit
s p
rod
uce
d
2008
YTD
2009
YTD
Detroit 3 Production
Jan-April 2009 vs. 2008
Chrysler
Ford
GM
The financial crisis and deep
recession have hit the “Detroit
3” the hardest. Chrysler and GM
have declared bankruptcy, and
both have cancelled vehicle
production for the next 60-90
days to reorganize financial
matters and reduce inventory to
match much lower demand.
2009 annualized
based on April YTD
Source: Ward‟s Automotive
NAFTA Light Vehicle Production 1994-2009
15.2
14.9
15.4
15.6
15.4
17.0
17.2
15.5 16.4
15.9
15.8
15.8
15.3
15.1
12.8
7.1
0
2
4
6
8
10
12
14
16
18
20
1994 1995 1996 1997 1998 1999 2000 2001 2002 2003 2004 2005 2006 2007 2008 2009
Millio
ns o
f U
nit
s
9
17
Source: NAFTA Steel Trade Monitor, US Department of Commerce,
Canacero and World Trade Atlas.
NAFTA Imports During Crisis Period
NAFTA Imports 2008 & Q1 2009
-
500,000
1,000,000
1,500,000
2,000,000
2,500,000
3,000,000
JAN FEB MAR APR MAY JUN JUL AUG SEP OCT NOV DEC JAN FEB MAR
Metr
ic T
on
nes
NAFTA External Imports NAFTA Internal ImportsNAFTA imports from
other regions exceed
intra-NAFTA steel
trade.
Non-NAFTA imports
in 4Q 2008 continued
at the same level as
earlier in the year –
this, at a time when
NAFTA domestic
production and
shipments were in a
steep decline.
18Source: US Department of Commerce and World Trade Atlas
NAFTA Exports During Crisis Period
NAFTA Exports 2008 & Q1 2009
-
200,000
400,000
600,000
800,000
1,000,000
1,200,000
1,400,000
JAN
2008
FEB MAR APR MAY JUN JUL AUG SEP OCT NOV DEC JAN
2009
FEB MAR
Metr
ic T
on
nes
NAFTA External Exports NAFTA Internal Exports
NAFTA producers
send only a small
portion (usually 5%
or less) of steel
outside the region.
During 4Q 2008,
intra-NAFTA steel
trade declined
sharply, more or
less in line with the
steep decline in
NAFTA market
demand.
10
19
III. NAFTA Steel Trade Challenges and Concerns
20
Major Trade Concerns During Economic Crisis
NAFTA steel producers‟ key concerns include:
• Increased import market share, at a time when low-cost, efficient NAFTA steel producers have ample capacity to meet reduced domestic demand
• Threat of further surges of unfairly traded steel and manufactured goods imports into North America
• Subsidized capacity expansions offshore in the face of declining demand
• VAT rebate increases to promote direct and indirect steel exports
• Higher import tariffs unrelated to trade cases
• Steel quotas and more restrictive steel import licensing systems
• Increases in government transportation and energy subsidies
• Manipulation by governments of raw material markets
• Massive government interventions to keep currencies undervalued
11
21
1,000
1,050
1,100
1,150
1,200
1,250
1,300
1,350
1,400
1,450
1,500
1Q
2005
2Q
2005
3Q
2005
4Q
2005
1Q
2006
2Q
2006
3Q
2006
4Q
2006
1Q
2007
2Q
2007
3Q
2007
4Q
2007
1Q
2008
2Q
2008
3Q
2008
4Q
2008
1Q
2009
Millio
ns o
f M
T
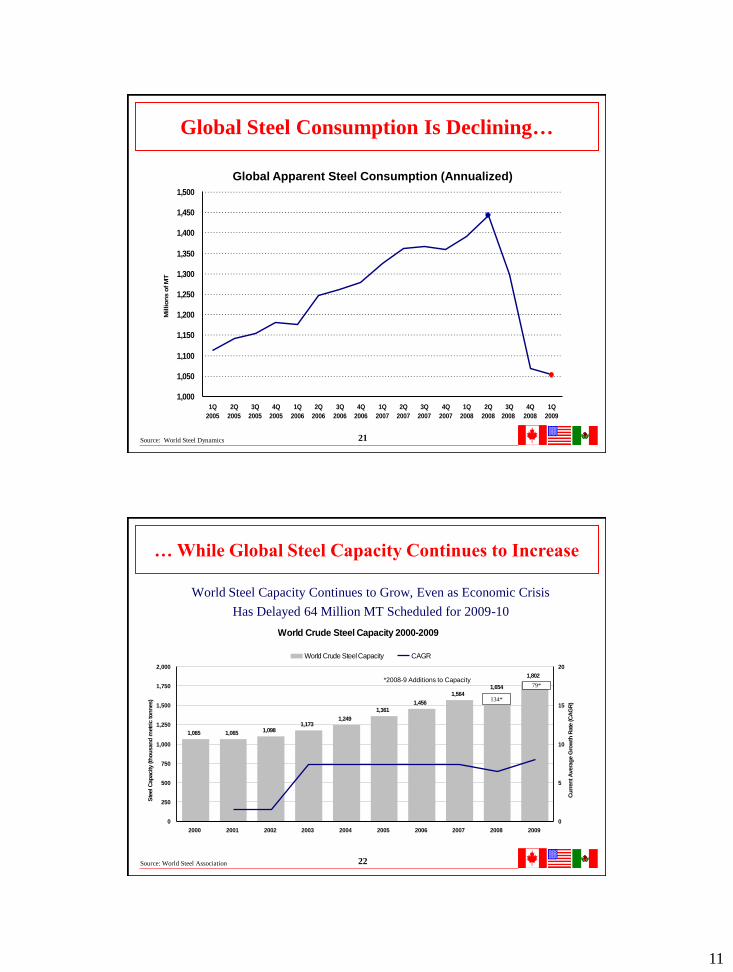
Global Apparent Steel Consumption (Annualized)
Source: World Steel Dynamics
Global Steel Consumption Is Declining…
22
World Steel Capacity Continues to Grow, Even as Economic Crisis
Has Delayed 64 Million MT Scheduled for 2009-10
Source: World Steel Association
… While Global Steel Capacity Continues to Increase
World Crude Steel Capacity 2000-2009
1,065 1,065 1,0981,173
1,249
1,361
1,456
1,564
1,802
1,654
0
250
500
750
1,000
1,250
1,500
1,750
2,000
2000 2001 2002 2003 2004 2005 2006 2007 2008 2009
Ste
el C
ap
acity (th
ou
san
d m
etr
ic to
nn
es)
0
5
10
15
20
Cu
rren
t A
vera
ge G
row
th R
ate
(C
AG
R)
World Crude Steel Capacity CAGR
134*
*2008-9 Additions to Capacity79*
12
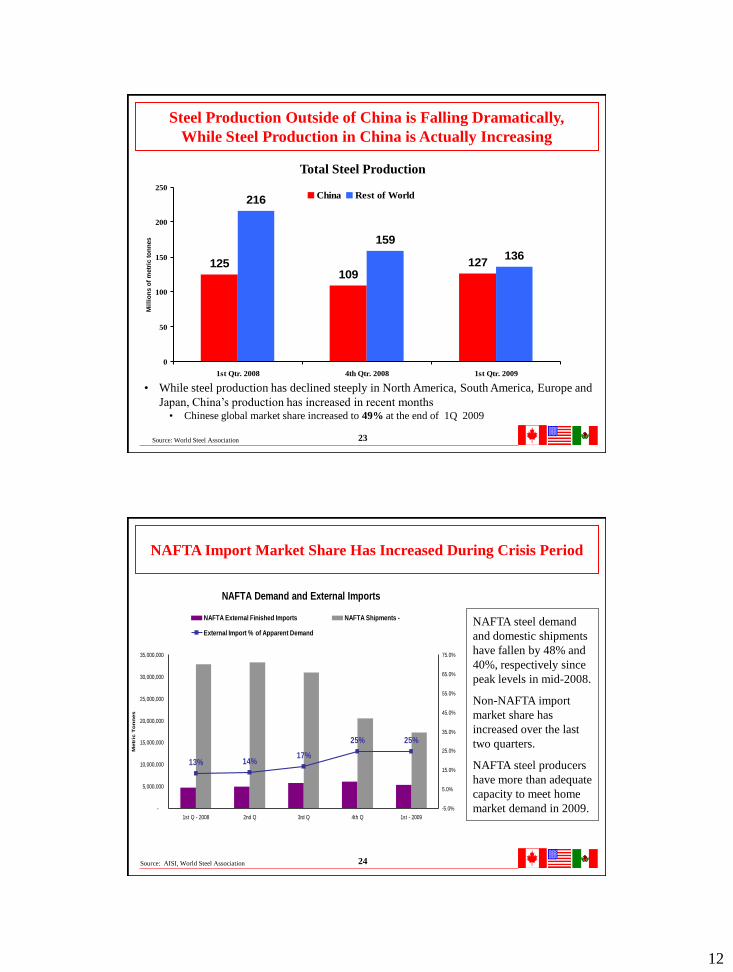
23
125109
127
216
159
136
0
50
100
150
200
250
1st Qtr. 2008 4th Qtr. 2008 1st Qtr. 2009
Mil
lio
ns o
f m
etr
ic t
on
nes
China Rest of World
Total Steel Production
Source: World Steel Association
Steel Production Outside of China is Falling Dramatically,
While Steel Production in China is Actually Increasing
• While steel production has declined steeply in North America, South America, Europe and
Japan, China‟s production has increased in recent months• Chinese global market share increased to 49% at the end of 1Q 2009
24Source: AISI, World Steel Association
NAFTA Import Market Share Has Increased During Crisis Period
NAFTA Demand and External Imports
13% 14%17%
25% 25%
-
5,000,000
10,000,000
15,000,000
20,000,000
25,000,000
30,000,000
35,000,000
1st Q - 2008 2nd Q 3rd Q 4th Q 1st - 2009
Metr
ic T
on
nes
-5.0%
5.0%
15.0%
25.0%
35.0%
45.0%
55.0%
65.0%
75.0%
NAFTA External Finished Imports NAFTA Shipments -
External Import % of Apparent Demand
NAFTA steel demand
and domestic shipments
have fallen by 48% and
40%, respectively since
peak levels in mid-2008.
Non-NAFTA import
market share has
increased over the last
two quarters.
NAFTA steel producers
have more than adequate
capacity to meet home
market demand in 2009.
13
25Source: US Department of Commerce, Statistics Canada, Banco de Mexico
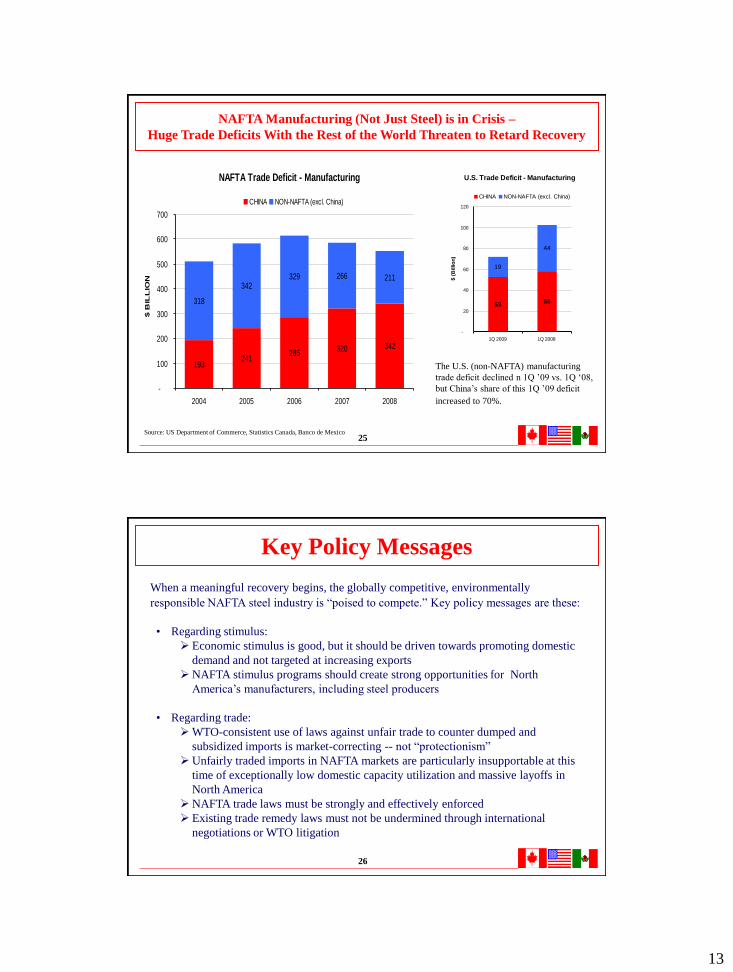
NAFTA Manufacturing (Not Just Steel) is in Crisis –
Huge Trade Deficits With the Rest of the World Threaten to Retard Recovery
NAFTA Trade Deficit - Manufacturing
193241
285320 342
318
342329 266 211
-
100
200
300
400
500
600
700
2004 2005 2006 2007 2008
$ B
ILL
ION
CHINA NON-NAFTA (excl. China)
U.S. Trade Deficit - Manufacturing
5358
19
44
-
20
40
60
80
100
120
1Q 2009 1Q 2008
$ (
Billio
n)
CHINA NON-NAFTA (excl. China)
The U.S. (non-NAFTA) manufacturing
trade deficit declined n 1Q ‟09 vs. 1Q „08,
but China‟s share of this 1Q ‟09 deficit
increased to 70%.
26
Key Policy Messages
When a meaningful recovery begins, the globally competitive, environmentally
responsible NAFTA steel industry is “poised to compete.” Key policy messages are these:
• Regarding stimulus:
Economic stimulus is good, but it should be driven towards promoting domestic
demand and not targeted at increasing exports
NAFTA stimulus programs should create strong opportunities for North
America‟s manufacturers, including steel producers
• Regarding trade:
WTO-consistent use of laws against unfair trade to counter dumped and
subsidized imports is market-correcting -- not “protectionism”
Unfairly traded imports in NAFTA markets are particularly insupportable at this
time of exceptionally low domestic capacity utilization and massive layoffs in
North America
NAFTA trade laws must be strongly and effectively enforced
Existing trade remedy laws must not be undermined through international
negotiations or WTO litigation