north american weather consultants, inc - department of public works, los angeles county€¦ ·...
TRANSCRIPT

North American Weather Consultants, Inc.
SAN GABRIEL MOUNTAINS
CLOUD SEEDING DRAFT PROGRAM REPORT
Prepared for
Los Angeles County, Department of Public Works
By
Don A. Griffith, Certified Consulting Meteorologist
Mark E. Solak
North American Weather Consultants, Inc.
8180 South Highland Dr., Suite B-2
Sandy, Utah 84093
NAWC Report No. WM 16-1
Los Angeles Department of Public Works Contract No. 003343
January 19, 2016

SAN GABRIEL MOUNTAINS
CLOUD SEEDING DRAFT PROGRAM REPORT
Prepared for
Los Angeles County, Department of Public Works
By
Don A. Griffith, Certified Consulting Meteorologist
North American Weather Consultants, Inc.
8180 South Highland Dr., Suite B-2
Sandy, Utah 84093
Los Angeles Department of Public Works Contract No. 003343
January 19, 2016

i
TABLE OF CONTENTS
Section Page
1. Introduction .........................................................................................................1
2. Background .........................................................................................................1
3. Proposed Target Area ..........................................................................................3
4. Task A: Preparation .............................................................................................3
4.1 Specify Recommended Seeding Locations and Operating Personnel ................4
4.2 Estimated Coverage of the Target Area by Specified Generator Locations .......9
4.3 Acquisition of Weather Radar Products ............................................................12
4.4 Acquisition of Weather and Hydrologic Data from the LACDPW’s
ALERT Systems ...............................................................................................14
4.5 Acquisition of Metrological Forecasts ..............................................................14
4.6 Organizational Approaches, Control Center Sites and Communication ...........16
4.7 Supervision of the Updating of the Cloud Seeding Program Report ................17
4.8 Operation of Remote Cloud Nucleating Generators .........................................17
4.9 Development of an Operational Manual and Guidelines Including
Discussion of Seeding Equipment ....................................................................17
4.9.1 Activation Criteria and Procedures ........................................................19
4.9.2 Procedures to Determine Storm Seedability ..........................................19
4.9.3 Seeding Suspensions ..............................................................................24
4.9.4 NAWC Staffing ......................................................................................24
4.9.5 Remote Monitoring Techniques .............................................................26
4.9.6 Proposed Equipment ...............................................................................26
4.10 Equipment Installation .......................................................................................35
4.10.1 Generator Site Locations and Operations ..............................................36
4.10.2 Use of County-Owned Property ............................................................36
4.10.3 Ground Generator Sites .........................................................................36
4.10.4 Cloud Seeding Equipment .....................................................................36
4.10.5 Seeding Generator Specifications .........................................................36
5. Task B: Operations ...........................................................................................37
5.1 Storm Monitoring and Identification of “Seedable” Conditions ......................37
5.2 Forecast Model..................................................................................................38
5.3 Seeding Suspension Criteria .............................................................................40
5.4 Coordination .....................................................................................................43
5.5 Method of Verification of the Location of Augmented Precipitation...............44
5.6 Generator Control .............................................................................................47
5.7 Acquisition of Real-Time Weather Data ..........................................................47
6. Task C: Reports and Miscellaneous Items ........................................................47
6.1 Monthly Operational Reports ............................................................................47
6.2 Annual Report ...................................................................................................48
6.3 Federal and State Reporting ..............................................................................48
6.4 Hours and Days of Service ................................................................................48
6.5 Miscellaneous Scope of Work Items .................................................................49
ii
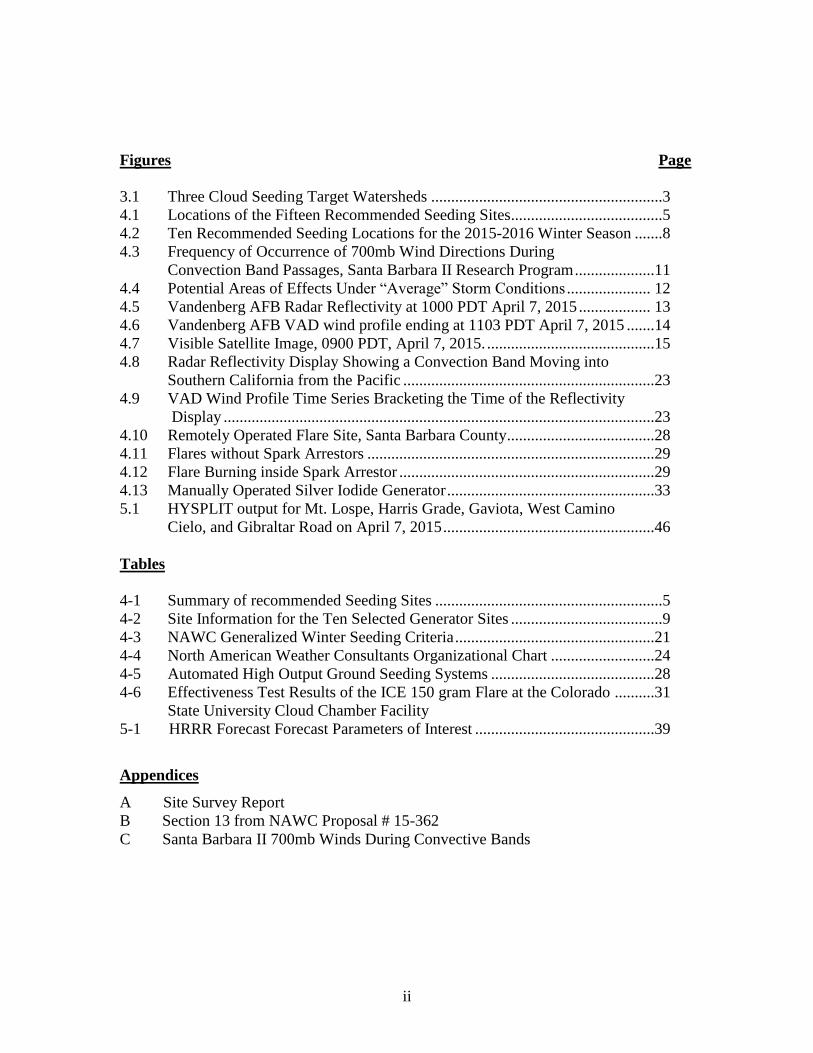
Figures Page
3.1 Three Cloud Seeding Target Watersheds ..........................................................3
4.1 Locations of the Fifteen Recommended Seeding Sites ......................................5
4.2 Ten Recommended Seeding Locations for the 2015-2016 Winter Season .......8
4.3 Frequency of Occurrence of 700mb Wind Directions During
Convection Band Passages, Santa Barbara II Research Program ....................11
4.4 Potential Areas of Effects Under “Average” Storm Conditions ..................... 12
4.5 Vandenberg AFB Radar Reflectivity at 1000 PDT April 7, 2015 .................. 13
4.6 Vandenberg AFB VAD wind profile ending at 1103 PDT April 7, 2015 .......14
4.7 Visible Satellite Image, 0900 PDT, April 7, 2015. ..........................................15
4.8 Radar Reflectivity Display Showing a Convection Band Moving into
Southern California from the Pacific ...............................................................23
4.9 VAD Wind Profile Time Series Bracketing the Time of the Reflectivity
Display ............................................................................................................23
4.10 Remotely Operated Flare Site, Santa Barbara County.....................................28
4.11 Flares without Spark Arrestors ........................................................................29
4.12 Flare Burning inside Spark Arrestor ................................................................29
4.13 Manually Operated Silver Iodide Generator ....................................................33
5.1 HYSPLIT output for Mt. Lospe, Harris Grade, Gaviota, West Camino
Cielo, and Gibraltar Road on April 7, 2015 .....................................................46
Tables
4-1 Summary of recommended Seeding Sites .........................................................5
4-2 Site Information for the Ten Selected Generator Sites ......................................9
4-3 NAWC Generalized Winter Seeding Criteria ..................................................21
4-4 North American Weather Consultants Organizational Chart ..........................24
4-5 Automated High Output Ground Seeding Systems .........................................28
4-6 Effectiveness Test Results of the ICE 150 gram Flare at the Colorado ..........31
State University Cloud Chamber Facility
5-1 HRRR Forecast Forecast Parameters of Interest .............................................39
Appendices
A Site Survey Report
B Section 13 from NAWC Proposal # 15-362
C Santa Barbara II 700mb Winds During Convective Bands

1
1.0 Introduction
North American Weather Consultants, Inc. (NAWC) of Sandy, Utah submitted document
No. 15-362 to provide “As-Needed Weather Modification (Cloud Seeding) Services (2015-
AN013). This proposal was submitted in response to a Request For Proposals (RFP) issued by
the County of Los Angeles, Department of Public Works (LACDPW) dated May 19, 2015.
NAWC was awarded a contract (#003343) which is for a one year period but additional one year
contracts may be granted by the LACDPW for up to four additional one year periods at the
discretion of the LACDPW. NAWC had conducted similar work for the County dating back to
1961.
The 2015 RFP identified three primary tasks to be completed for the one year period:
Task A- Preparation: Development of a Revised Cloud Seeding Program Report
and Seeding Equipment Fabrication and Installation
Task B- Operations
Task C- Reporting
Each of these tasks are discussed separately in sections 4 through 6. There is some
overlap of topics between Tasks A and B so there is some duplication of information in
sections 4-6.
2.0 Background
North American Weather Consultants, Inc. (NAWC) of Sandy, Utah submitted document
No. P08-223 to provide weather modification (cloud seeding) services. This proposal was
submitted in response to a Request For Proposals (RFP) issued by the County of Los Angeles,
Department of Public Works (LACDPW) dated February 14, 2008. NAWC had conducted
similar work for the County dating back to 1961. NAWC was awarded Contract No. PW 13177
on August 7, 2008 and given the notice to proceed on September 8, 2008. The proposed work
included:
2
Preparation of a Cloud Seeding Program Report
Environmental Documentation to Satisfy California Environmental Quality Act
(CEQA) requirements.
Implementation: Installation of Seeding Equipment.
Operations: Conduct of cloud seeding for the period November 1, 2008 through
April 30, 2009. At the option of the LACDPW, additional one year operational
periods could be exercised.
NAWC prepared a draft Cloud Seeding Program Report and upon review and comments
by LACDPW, a final report was developed (Griffith, 2009). NAWC subcontracted with TRC, an
environmental firm with offices in Carlsbad, California, to prepare the environmental
documentation. NAWC provided considerable input to this documentation. After several drafts
of a Mitigated Negative Declaration (MND) were prepared then revised taking into account
comments from the LACDPW. A draft final was prepared and was scheduled to be considered
for acceptance by the Los Angeles County Board of Supervisors in the summer of 2009.
A large wildfire, called the Station Fire, impacted the proposed cloud seeding target area.
This fire began in late August 2009 and eventually burned an area of over 160,000 acres. Due to
concerns about the burn area, the request for the Los Angeles County Board of Supervisors to
approve the MND was withdrawn. The operations portion of the contract, which would have
involved cloud seeding for the November 1, 2008 through April 30, 2009 period was cancelled
due to concerns about erosion in the burn areas. The LACDPW estimated it would take
approximately five years for the burned areas to recover to the point that cloud seeding could
again be considered without future major wildfires impacting this potential target area.
An updated MND was accepted by the Los Angeles County Board of Supervisors on
October 20, 2015.

3
3.0 Proposed Target Area
The cloud seeding program’s target area is defined in the contract as watersheds tributary
to the Big Tujunga, Pacomia, and San Gabriel Dams. Figure 3.1 graphically portrays this area.
Figure 3.1 Three Cloud Seeding Target Watersheds
4.0 Task A: Preparation
The Scope of Work in the contract identifies several sub-tasks to be completed under this
heading including:
Specify recommended seeding locations and operating personnel.
Estimated coverage of the target area by specified generator placements.
Acquisition of weather radar products.

4
Acquisition of weather and hydrologic data from the LACDPW’s ALERT
Systems.
Acquisition of meteorological forecasts.
Organizational approaches, control center sites, and communications.
Preparing this report. Report preparation to be overseen by a Weather
Modification Certified Manager.
Development of an operational manual and guidelines including discussion of
seeding equipment.
Equipment installation.
Each sub-task is discussed separately in the following.
4.1 Specify Recommended Seeding Locations and Operating Personnel
The Griffith 2009 report provided recommendations for 15 potential ground-based
seeding locations. Figure 4.1 provides a map of these locations and Table 4-1 provides specific
information on each site. These 15 sites were selected from a list of 20 potential sites, all located
on LACDPW sites (typically debris basins), that was provided to NAWC by the LACDPW. In
the Griffith 2009 report two different types of ground-based seeding equipment were
recommended; 1) manually operated silver iodide generators and 2) remotely operated flare
trees. Information in Table 4-1 indicates which type of seeding device might be considered at
each of the 15 recommended locations. Either type of equipment may be appropriate at some
locations. NAWC’s proposal for the 2015-2016 winter season proposed six manually operated
silver iodide generators and four remotely operated flare trees. The mix of manual remote
equipment at these sites could change in future seasons of operations.

5
Figure 4.1 Locations of the Fifteen Recommended Seeding Sites
Table 4-1 Summary of Recommended Seeding Sites
Site
Number
Site Name,
Location,
Elevation
Rating Remarks Yes/No
1 Pacomia
Dam
1180
24.0
W
340
19.8
N
1502
Good Near base of dam. Some LACDPW
personnel on site (6:30-4:00). Possible
manual or AHOGS site. No other houses
nearby, just County buildings. Dirt.
Yes
2 Lopez Inlet
Debris
Basin
1180
24.08
W
340
17.31
N
Fair Busy roads nearby. Possible manual
generator site. Possible choice for second site
that could impact the Pacoima area.
Yes

6
Site
Number
Site Name,
Location,
Elevation
Rating Remarks Yes/No
3 Cassara
DB
1180
21.4
W
340
16.8
N
1280
Fair
To
Good
Graffiti, possible vandalism. No nearby
buildings. Possible manual site on asphalt
pad east side of dam. AHOGS also possible
on edge of asphalt pad that is dirt, but
somewhat close to bushes. Possible second
site to impact Pacoima drainage.
Yes
4 Zachau
SPS
1180
17.6
W
340 16.1
N
1845
Good West of Zachua DB, more isolated. Possible
manual or AHOGS site. Gravel.
Yes
5 Dunsmuir
DB
1180
15.5
W
340 14.9
N
2258
Very
Good
Isolated location, unmanned, ideal site next
to small building. Likely AHOGS or manual
site. Gravel. Second possible site, east end of
dam, asphalt.
Yes
6 Winery
Cyn DB
1180
13.5
W
340 12.6
N
1935
Good Isolated location, 2 locked gates. Limited
space, possible manual site just behind gate.
Gravel.
Yes
7 Lincoln
DB
1180 9.4
W
340 12.2
N
1351
Good Large site with many roads. Possible manual
or AHOGS site. Gravel.
Yes
8 Kinneloa
West DB
1180
5.2
W
340 11.0
N
1397
Good
to Very
Good
Isolated location. Two possible sites, one on
west end of dam (concrete) could be manual
site. Second site adjacent to short dirt road
along west side of catchment area could be
AHOGS site. Gravel.
Yes
7
Site
Number
Site Name,
Location,
Elevation
Rating Remarks Yes/No
9 Santa Anita
DB
1180
1.2
W
340 10.3
N
Good Large area, unmanned. Possible manual or
AHOGS site east side of drainage.
Yes
10 Sawpit DB
1170 59.5
W
340 10.1
N
954
Good Suitable area along road below the dam
leading to Sediment Placement Site. East of
road adjacent to hillside. Possible manual or
AHOGS site. Possible manual site west end
of dam, somewhat limited space on parking
area, asphalt.
Yes
11 Spinks DB
1170 57.7
W
340
9.1 N
837
Good
to Very
Good
Above Bradbury Dam. Isolated site, round
about access into site. Nice asphalt area of
reasonable size. Possible manual or AHOGS
site.
Yes
12 Morris
Dam
1170
52.9
W
340 10.5
N
1180
Very
Good
Great location for seeding material to flow up
the San Gabriel canyon, limited space on
dam but possibly enough room for an
AHOGS site, clearly enough room for a
manual site (one was installed at this location
for the earlier program), gravel.
Yes
13 Hook West
DB
1170
52.6
W
340 9.2 N
1193
Good Actually two dams adjacent to each other.
Several good locations for either manual or
AHOGS. One site at east dam would be a
good manual site (concrete, protected).
Possible AHOGS site below west dam,
gravel. Access is through a church property.
Yes
14 Big Dalton
DB
1170
50.1
W
340 9.4 N
1155
Good Three possible areas. Small area near west
end of dam, possible manual site, but very
close to road. Large area below the dam,
possible manual or AHOGS site. Possible site
out on long dam road (asphalt) on top of dam
leading to spillway. No nearby houses. All
areas unmanned. All sites gravel.
Yes
15 Big Dalton
Dam
1170 48.7
Good Site below dam (no room at the dam),
possible AHOGS or manual site. Manual
generator located here during previous
Yes

8
Site
Number
Site Name,
Location,
Elevation
Rating Remarks Yes/No
W
340 10.1
N
1585
program.
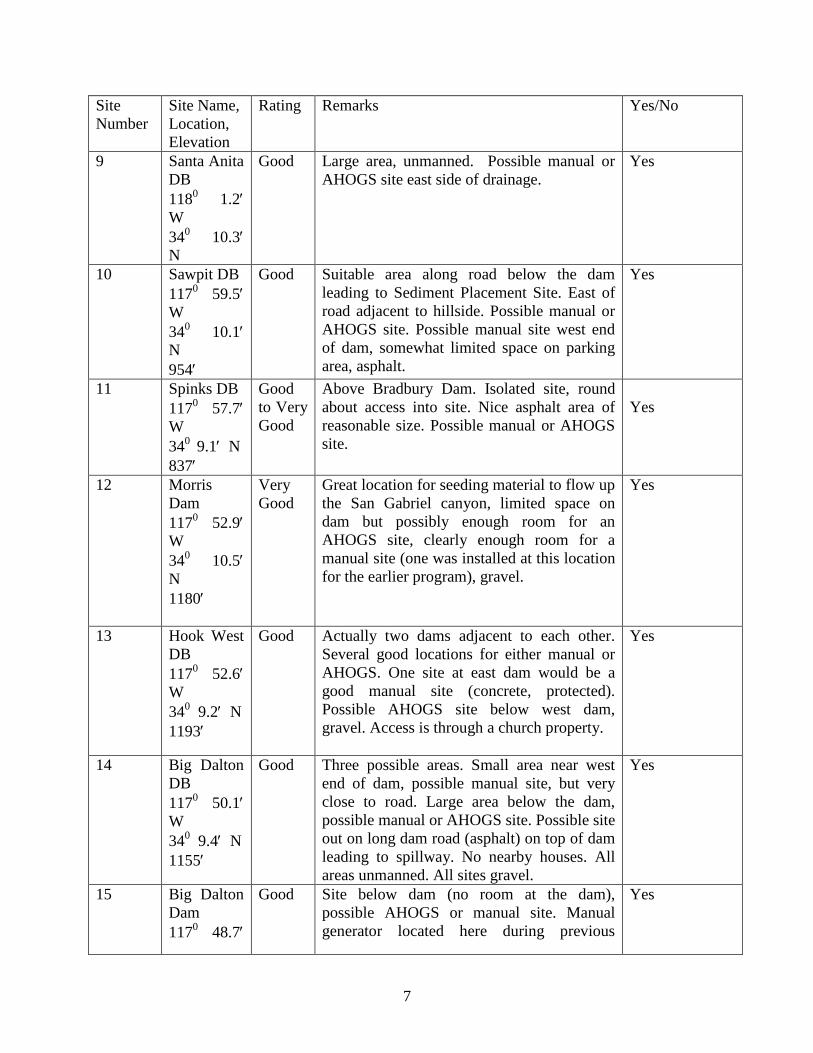
NAWC performed on site surveys, with LACDPW assistance, of these 15 sites to
develop recommendations for the placement of these two types of devices to LACDPW’s
personnel. Mr. Mark Solak of NAWC assisted by Mr. Keith Hala of LACDPW conducted these
surveys on December 1-2, 2015 (see Appendix A for report on site visits). Ten sites were
selected as displayed in Figure 4.2. Table 4-2 provides details on these ten sites including
whether they would be manual or remotely controlled units.
Figure 4.2 Ten Recommended Seeding Locations for the 2015-2016 Winter Season

9
Table 4-2 Site Information for the Ten Selected Generator Sites
NAWC will employ one or two part-time technicians to help install, operate, maintain,
and secure some components in the summer months. NAWC will consider the GAIN and
GROW programs of the LACDPW to locate these technicians. Names and qualifications will be
provided to the LACDPW once NAWC has hired them.
4.2 Estimated Coverage of the Target Area by Specified Generator Locations.
As discussed in Section 3.0, the target watersheds will be the Pacoima, Big Tujunga, and
San Gabriel watersheds. The Scope of Work requests an area map indicating the target
watersheds covered by each cloud nucleating generator under expected normal conditions of air
movement. Upper-air (weather balloon) observations were made during the Santa Barbara II
research program, Phases I and II (Thompson, 1975, Griffith, et al, 2005). This research program
was conducted in Santa Barbara County during the period of 1967-1974. Weather balloons were
launched into “convection bands” as they passed over the observation site. These convection
bands were the seeding targets of the research program (refer to Appendix B). It is standard
procedure to report weather balloon observations at constant pressure altitudes. One of these
altitudes is 700 millibars, which is typically located at approximately 10,000 feet in the
atmosphere. There were 181 observations of the wind direction and wind speed at the 700 mb

10
level available from the earlier research program. We calculated an average of these
observations, which was 2340
and 36 knots. Winds in meteorology are reported in the direction
from which the wind is blowing so the average winds at 700 mb during the passage of
convection bands were blowing from the southwest towards the northeast at an average velocity
of 36 knots, which is approximately 41 miles per hour. Appendix C contains this 700 mb wind
information.
Even though these data are rather dated and were taken from a different location, we
believe they are a reasonable approximation of the average winds that may be expected during
the San Gabriel Mountains cloud seeding program. The transport and diffusion of seeding
materials from the proposed ground seeding sites will vary from storm to storm and even during
a storm. The resultant nucleation of ice crystals, their growth into snowflakes, and the
subsequent fall-out either as snow or rain is a very complex issue. Some research groups (e.g.,
the Desert Research Institute) have attempted to develop models to predict at least part of this
sequence of events. However, verification of such predictions is problematic. We suspect that the
low-level winds will be blowing from the south or even south-southeast through southwest
during winter storms affecting the target areas. As the seeding plume climbs in elevation the
winds will likely become more southwesterly. To present an estimate of the possible transport
and fall-out of precipitation over the target area, NAWC used the average winds from the Santa
Barbara research program to depict the possible effect of each of the 10 sites selected for 2014-
2015 winter operations.
Based on analyses from a research program conducted in Utah (Griffith, et al, 1992),
NAWC estimated the plume spread would be approximately 200. Figure 4.3 contains the
frequency distribution of the 700 mb wind directions in ten degree increments from the Santa
Barbara program. Figure 4.4 contains these predicted plumes from each of the generator
locations under the expected average conditions. This information can be utilized to visualize
how Figure 4.4 might appear with different ten-degree wind direction changes versus the likely
frequency of occurrence of such wind directions.

11
Figure 4.3 Frequency of Occurrence of 700mb Wind Directions During
Convection Band Passages, Santa Barbara II Research Program
Figure 4.4 is of interest for another reason; the potential production of cloud seeding
effects within the Los Angeles Basin. Earlier programs conducted for the San Gabriel Mountains
were designed not to have an impact within the Basin. The RFP specified this restriction as well
and this issue is mentioned in Section 5.3 which discusses program suspension criteria. Referring
to Figure 4.3 it is seen that the 700 mb winds were seldom blowing from due west to west-
northwest on the Santa Barbara program. This implies that little seeding potential will be lost at
the proposed sites due to the restriction of not producing seeding effects in the Los Angeles
Basin.

12
Figure 4.4 Potential Areas of Effect Under “Average” Storm Conditions
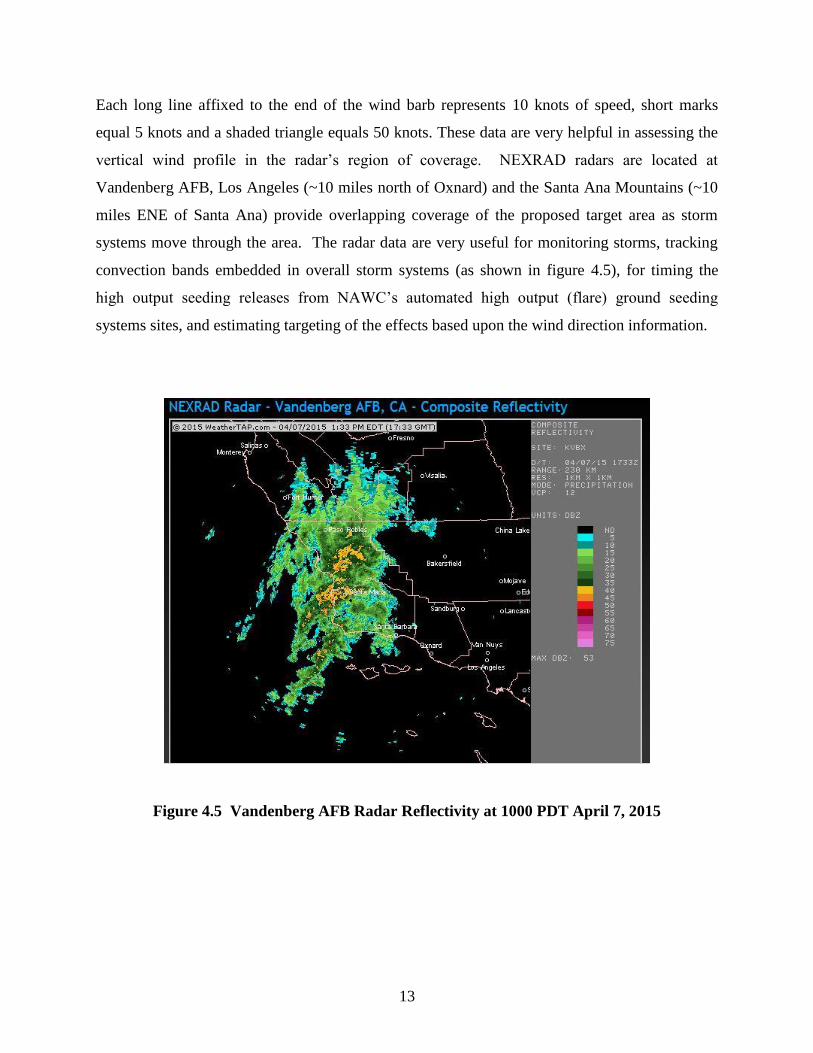
4.3 Acquisition of Weather Radar Products
NAWC will use National Weather Service NEXRAD (Next Generation Radar) S-band
radar products in the performance of this work. NEXRAD radars operated by the National
Weather Service provide radar reflectivity (~precipitation rate) displays and time series data on
the vertical wind structure, updated at ~5-6 minute intervals. The effective range of each of
these radars is approximately 140 nautical miles. These data are available via specialized
subscription services such as WeatherTap, a service that NAWC has used for years, or from
National Weather Service sites (like the one located in Oxnard, California). An example of a
Plan Position Indicator (PPI which is a horizontal display) reflectivity display is shown in Figure
4.5; reflectivity values are related to the intensity of the precipitation. An example of a radar-
derived velocity azimuth display (VAD) plot is shown in Figure 4.6. It provides a time series of
average winds at many height levels, based on the motion of hydrometeors sensed by the
Doppler radars. The wind barbs point towards the direction in which the winds are blowing.
13
Each long line affixed to the end of the wind barb represents 10 knots of speed, short marks
equal 5 knots and a shaded triangle equals 50 knots. These data are very helpful in assessing the
vertical wind profile in the radar’s region of coverage. NEXRAD radars are located at
Vandenberg AFB, Los Angeles (~10 miles north of Oxnard) and the Santa Ana Mountains (~10
miles ENE of Santa Ana) provide overlapping coverage of the proposed target area as storm
systems move through the area. The radar data are very useful for monitoring storms, tracking
convection bands embedded in overall storm systems (as shown in figure 4.5), for timing the
high output seeding releases from NAWC’s automated high output (flare) ground seeding
systems sites, and estimating targeting of the effects based upon the wind direction information.
Figure 4.5 Vandenberg AFB Radar Reflectivity at 1000 PDT April 7, 2015

14
Figure 4.6 Vandenberg AFB VAD wind profile ending at 1103 PDT April 7,
2015. A display of wind direction and speed versus height in thousands of feet.
4.4 Acquisition of Weather and Hydrologic Data from the LACDPW’s ALERT
Systems
In prior contracts with the LACDPW, NAWC has made the necessary arrangements to
acquire weather and hydrologic data from LACDPW’s Automated Local Evaluation in Real
Time (ALERT) systems. We understand that the specific software and directions for accessing
the LACDPW ALERT networks via a Virtual Private Network will be provided by LACDPW.
This information will be included in a stand-alone Operations Plan.
4.5 Acquisition of Metrological Forecasts
There is a large array of sites on the web that provide weather observation and forecast
information. NAWC routinely uses a number of these sites in the conduct of our winter cloud
seeding programs located in the western United States. NAWC’s web site provides links to a

15
significant number of these sites: www.nawcinc.com. Some of these links provide various types
of weather satellite displays of visible and infrared images. Figure 4.7 is a visible satellite image
covering the State of California showing the cloud cover associated with a storm that occurred
on April 7, 2015. This particular image is from a commercial weather site called WeatherTap.
Figure 4.7 Visible Satellite Image, 0900 PDT, April 7, 2015.
The requirement for an on-site satellite receiving capability could be misunderstood to
require a stand-alone receiving system. This was a requirement a number of years ago when

16
satellite photos could only be acquired by having a special satellite antenna and receiving
equipment. This is no longer the case and NAWC intends to acquire needed satellite information
which is readily available through the internet.
North American Weather Consultants and subcontractor Meteorological Solutions, Inc.
(MSI), a Trinity Consultants Company, have been contracted by the LACDPW for previous
winter seasons since 2002 to provide specialized weather forecasting services for the Los
Angeles County Drainage area. These forecasts have included: 1) Monthly/Seasonal Forecasts 2)
Weekly Forecasts 3) Daily Forecasts 4) Pre-Storm Forecasts 5) As Needed Intensive Storm
Forecasts and 6) Verbal Briefing Updates. In a recent LACDPW solicitation, NAWC/MSI has
been selected as the group to continue these weather forecast services for the upcoming winter
season. NAWC intends to use these forecasts to help plan and conduct the cloud seeding
operations. The area of coverage of these forecasts includes the three specified target areas for
the proposed cloud seeding program.
4.6 Organizational Approaches, Control Center Sites and Communication
The operations for this program will be directed from NAWC’s home office located in
Sandy, Utah (a suburb of Salt Lake City). This home office is equipped with multiple computers,
telephones, and a fax. A variety of weather products available via the internet will be utilized to
direct the cloud seeding program. These products will include: surface and upper-air
observations, analyses and forecasts, weather satellite information (both visible and infrared),
weather radar and lighting information, precipitation data and NWS watches and warnings.
NAWC computers will also provide access to the LACDPW’s ALERT precipitation and
hydrologic data and will be updated, if necessary, to accommodate any changes made in
LACDPW computers as mentioned in the RFP. No radar, satellite or other specialized equipment
is required for the reception of weather data. Communications with the remotely controlled flare
seeding sites will be based on a custom computer program that can communicate with these sites
through the internet using a special cell phone device which is a part of the electronics at each
remote site. No radio control is required. Telephone service is a part of the main office in Sandy,
Utah. The manual generator sites do not require any power so back-up power is not necessary.
The remotely operated seeding flare sites have battery packs and solar panels which can provide
power for at least 24 hours without any interruption of seeding capabilities.

17
A project personnel contact list that includes phone numbers and e-mail addresses will be
developed after all project personnel have been identified then added to the Operational Manual.
Near real-time communications will be necessary during the winter operational periods when
storms are approaching, passing over, and exiting the target areas. Such communications will be
accomplished via telephone calls or e-mail.
NAWC’s WMA Certified Manager may authorize NAWC WMA Certified Operators to
conduct cloud seeding operations from their homes if storms impact the target areas during late
evening through early morning hours. All of NAWC’s meteorologists have computers in their
homes that allow access to the internet which will also include access to the LACDPW ALERT
networks and the customized program needed to operate the remotely controlled flare units.
4.7 Supervision of the Updating of the Cloud Seeding Program Report
The RFP specified that the updating of the Cloud Seeding Program Report must be under
the supervision of a Weather Modification Association’s Certified Manager or an American
Society Certified Consulting Meteorologist. Mr. Don Griffith, NAWC’s President, will provide
this supervision. He holds both of the above certifications and is also the author of the original
2009 program report.
4.8 Operation of Remote Cloud Nucleating Generators
As discussed in Section 4.6, these remote units can be operated from either NAWC’s
main offices or from NAWC’s meteorologist’s residences.
4.9 Development of an Operational Manual and Guidelines Including Discussion
of Seeding Equipment
As stated in the contract, the seeding objective should be to seed as many favorable
storms as practical to enhance precipitation within the target areas.
NAWC will monitor storm systems with the potential to impact the target areas during
the time when at least some of the generators have been installed and are operational through
April 15, 2016. NAWC will use its experience to determine the cloud conditions that are

18
potentially “seedable” based upon metrological observations and forecasts. The focus will be on
the identification and seeding of convection bands as discussed in Appendix B. This is
especially true of any seeding conducted using the four remotely controlled seeding flare sites.
The six manually operated cloud seeding generators can be operated for longer periods under
conditions that NAWC considers “seedable”. The HRRR model, also disused in Appendix B will
be useful in the near-term prediction of the formation or passage of convection bands through the
target area. The local NWS NEXRAD sites will identify these bands as they move into the target
areas. These NEXRAD displays will be used to determine when flares should be fired from any
of the four remotely controlled sites. The goal will be to fire flares into the leading edge of these
bands as the band passes over any of the four sites. Seeding between convection bands with the
manual generators may produce some seeding effects from the stratiform clouds that typically
occur between the bands. Some seeding material released from these manual generators will
also be incorporated into the convection bands.
NAWC will make recommendations to the designated LACDPW’s Contract Manager or
designee regarding the proposed operations of the seeding equipment. Operations will commence
only after receiving the approval of the Contract Manager or designee. NAWC will monitor the
program’s meteorological suspension criteria (precipitation rates and accumulations) to
determine if operations should be curtailed before the expected turn off times. This is one
example of a significant event that the RFP requires the Contractor to inform the Contract
Manager or designee of, relative to the progress of the cloud seeding efforts.
NAWC will run the HYSPLIT dispersion model, as discussed in Appendix B, either
during or following each storm to simulate the trajectories of the seeding plumes from each of
the seeding locations.
NAWC will be responsible for the operational control of the cloud seeding generators,
including communications, generator refilling and flare replacement, and maintenance/repair of
this equipment.
A more detailed Operational Manual has been developed which can be used as a
stand-alone document.

19
4.9.1 Activation Criteria and Procedures
NAWC’s project meteorologist(s) will monitor weather conditions in order to identify
storm events that may impact the target area. As storm systems approach the target areas, their
seeding potential will be determined. The seeding targets will primarily be convection bands that
are typically embedded in the winter storms impacting coastal regions of southern California.
NAWC’s design for this modernized San Gabriel cloud seeding program was based upon the
results obtained from a research program conducted in Santa Barbara County. The four remotely
controlled flare trees would be the primary seeding mode during the passage of convection bands
through the target areas. Seeding could also be accomplished in the more stratiform clouds
between convection bands using the manually operated ground generators. If a storm event is
expected to impact the target area, a determination will be made whether it should be seeded.
There are two considerations involved: 1) do meteorological conditions indicate that the situation
is seedable and 2) suspension criteria are not met or expected to be met with the passage of the
seedable event through the target areas. Three meteorological conditions indicate the event is
seedable:
1) The radar echo tops within the band are less than -5oC. This temperature is the
threshold of silver iodide activation.
2) The steering level wind flow at the 700mb level is such that seeding impacts would
be expected in the target area(s),
3) No low-level atmospheric inversions exist to prevent the entrainment of the seeding
material into the storm clouds.
The manual generators may potentially be operated both between and during convection
band passages if the above seeding criteria and those contained in Table 4-3 are met.
4.9.2 Procedures to Determine Storm Seedability
NAWC will utilize procedures similar to those used in past LACDPW cloud seeding
operations to determine storm seedability. Procedures will also be updated based on insights
gained via winter cloud seeding research and operations conducted in Santa Barbara County.

20
These procedures involved weather forecasting of the magnitude and wind directions of winter
storms that were expected to impact the target area. Typically storms expected to produce <0.50
inches of rain in the target areas will not be seeded.
The “seedability” of the approaching storms will be a function of wind direction,
atmospheric stability, and temperatures. Lower level winds need to be blowing from the south
through west to avoid creating seeding impacts within the Los Angeles Basin. Fortunately, these
wind directions also produce the bulk of the precipitation in the target area. The atmosphere
needs to be neutral to unstable to allow the seeding material released from the surface to be
transported into the colder portions of the storm clouds in a timely fashion. The temperatures
need to be cold enough so that the silver iodide seeding material can quickly reach its activation
temperature (-50C). These seedability factors can be examined based upon surface and upper-
level observations (i.e. rawinsonde observations) and atmospheric model forecasts.
The seedability issue is vitally important to the success of seeding operations. Data are
available from widely spaced routine balloon soundings twice daily, at fixed 12-hour intervals.
Balloon release sites at Vandenberg AFB, Edwards AFB and San Diego bracket the project area.
These data can be useful, but suffer from coarse time resolution, being twice-daily snapshots.
The variability of the winds as a function of height can be considerable and can evolve
significantly with time. There are internet sites that provide predicted atmospheric information at
six hour intervals, similar to the data available from the standard weather balloon observations.
These predictions are derived from the atmospheric circulation models (e.g., NAM, GFS) that
are processed by the National Weather Service (NWS). These models provide the backbone of
basically all of the weather forecasts that are issued by the NWS.

21
Table 4-3 NAWC Generalized Winter Seeding Criteria
1) CLOUD BASES ARE BELOW THE MOUNTAIN BARRIER CREST.
2) LOW-LEVEL WIND DIRECTIONS AND SPEEDS THAT WOULD FAVOR THE MOVEMENT
OF THE SILVER IODIDE PARTICLES FROM THEIR RELEASE POINTS INTO THE
INTENDED TARGET AREA. WINDS AT THE 850MB LEVEL (~ 4,000 FEET MSL) ≤ 50 KTS.
3) NO LOW LEVEL ATMOSPHERIC INVERSIONS OR STABLE LAYERS THAT WOULD RESTRICT
THE VERTICAL MOVEMENT OF THE SILVER IODIDE PARTICLES FROM THE SURFACE TO
AT LEAST THE -5°C (23°F) LEVEL OR COLDER.
4) TEMPERATURE AT MOUNTAIN BARRIER CREST HEIGHT IS -5°C (23°F) OR COLDER.
5) TEMPERATURE AT THE 700-MB LEVEL (APPROXIMATELY 10,000 FEET) IS WARMER THAN -
15°C (5°F).
6) CLOUD TOP TEMPERATURES < -250 C (-13
0 F).
NAWC will utilize National Weather Service NEXRAD radars as input to decision-
making. NEXRAD radars operated by the National Weather Service provide radar reflectivity
used to approximate precipitation rate displays and time series data on the vertical wind
structure. Information is updated at approximately 5-6 minute intervals. These data are available
via specialized subscription services such as WeatherTap, a service that NAWC has used for
years. An example plan view reflectivity display is shown in Figure 4.8. The figure shows a
convection band that is moving on-shore in southern California. An example radar-derived
velocity azimuth display (VAD) plot is shown in Figure 4.9. It provides a time series of average
winds at many height levels, based on the motion of hydrometeors sensed by the radars. These
data are very helpful in assessing the vertical wind profile in the radar’s region of coverage. The

22
NEXRAD radars to be used in this program are Vandenberg AFB (KVBX), Los Angeles
(KVTX), and the Santa Ana Mountains (KSOX). These radar sites provide overlapping coverage
of the region as storm systems move through the target areas. The radar data are very useful for
monitoring storms, tracking convection bands embedded in overall storm systems, timing the
high output seeding releases from NAWC’s remotely controlled flare trees, and targeting the
seeding effects based upon the wind direction information. NAWC has developed and will use
image archiving software to capture and record the reflectivity displays from NEXRAD radars
during storm operations. The storm radar sequences will be stored on the acquisition computer’s
hard drive. The storm sequence images can be produced as needed on CDs or DVDs. As required
in the RFP, cloud seeding generator locations and times of activation and deactivation will be
documented on CDs or DVDs.
NAWC will also utilize the real-time precipitation data from LACDPW’s Automated
Local Evaluation in Real Time (ALERT) system to monitor rainfall intensities and the storm
system progress through the target areas. This ground truth information will be considered in
conjunction with the NEXRAD radar intensity information.
Ground based seeding utilizing the flare trees will be conducted at approximately 15-30
minute intervals as a convection band is passing over any of the four ground sites. All four sites
may be used to seed a convection band based upon targeting considerations and the relative
strength of the band. Due to their lower cost of operation, manually operated generators will be
operated for longer periods when any seeding potential is thought to exist based upon the seeding
criteria contained in Table 4-3.
.

23
Figure 4.8 Radar Reflectivity Display Showing a Convection Band Moving into Southern
California from the Pacific. Higher reflectivity values indicate a higher
precipitation rate.
Figure 4.9 VAD Wind Profile Time Series Bracketing the Time of the Reflectivity Display
(Figure 4.8). The wind barbs are pointed in the direction that the wind is blowing,
and the number of side barbs represent the strength of the wind in knots. Each full
length barb is 10 knots, a half barb is 5 knots and a filled triangular barb is 50
knots.

24
4.9.3 Seeding Suspensions
Suspension of seeding is discussed in detail in section 5, Task B Operations.
4.9.4 NAWC Staffing
NAWC’s staffing plan for this work is summarized below. NAWC’s overall
organizational chart is shown in Table 4-4, followed by staffing specific to the proposed cloud
seeding work for the LACDPW.
Table 4-4 North American Weather Consultants Organization Chart
NAWC Project Personnel and Subcontractor to be assigned to this program are listed
below.
Don A. Griffith Managing Employee (B.S., 45+ years experience, Certified WMA
Manager and Operator, AMS CCM)

25
Mark E. Solak Project Supervisor, Site Selection and Installation (B.S., 40+ years
experience, Certified WMA Manager and Operator, AMS member)
David Yorty Lead Project Meteorologist (M.S., 14 years experience, Certified WMA
Operator, AMS member)
Stephanie Beall Backup Project Meteorologist (B.S., 10 years experience, Certified
WMA Operator, AMS member)
Shauna Ward Backup Project Meteorologist (M.S., 1.5 years experience, Certified
WMA Operator, AMS member)
Edward Pinion Supervising Technician during manual generator installation phase (20+
years cloud seeding equipment experience)
Bret Everett Local Hire, Field Technician
Roger Mallery Local Hire, Field Technician
Subcontractor (MSI, a Trinity Consultants Company)
Casey Lenhart Supervisor for flare system programming, installation and testing
Mr. Griffith is the managing employee overseeing all NAWC’s work on the project. Mr.
Solak and NAWC technicians will conduct the seeding equipment field installations and testing.
Mr. Yorty (lead), with backup support from Beall and Ward, will conduct weather forecasting,
the conduct of day-to-day seeding operations and operations report generation. Mr. Griffith
will oversee/contribute to report preparation. Mr. Griffith (assisted by Mr. Solak) will have
responsibility as compliance monitor to assure timely provision of quality services and products,
as well as interface with LADPW’s manager as needed.
4.9.5 Coordination with LACDPW Staff
Once NAWC’s project meteorologist has developed seeding recommendations, he will
coordinate these recommendations with the LACDPW operations director. The operations
director will authorize NAWC’s project meteorologist to activate the seeding equipment as
discussed in the recommendations with any potential modifications requested by the LACDPW
operations director. Recommendations will normally include estimates of the duration of the

26
seeding period. Operations will continue as long as seedable conditions exist and no suspension
criteria are reached. Operations will cease once NAWC’s project meteorologist has determined
that the event is no longer seedable.
NAWC’s project meteorologist will inform specified LACDPW personnel of all
significant events related to the San Gabriel cloud seeding program. One means of dissemination
of information during the operational periods will be the monthly program reports.
4.9.5 Remote Monitoring Techniques
Remote weather monitoring techniques were discussed in section 4.3 – 4.6.
4.9.6 Proposed Equipment
Cloud seeding will use two types of ground based silver iodide generator systems: 1)
remotely operated flare trees and 2) manually operated silver iodide generators. The RFP,
requested ten ground seeding sites for the 2015-2016 winter season. NAWC will provide six
manually operated and four remotely controlled units for the 2015-2016 winter season.
Remotely Operated Flare Trees
This system is based upon one or more “trees” that each hold several flares impregnated
with silver iodate. Very large numbers of ice forming nuclei (silver iodide) are produced via
combustion of these high output flares. NAWC proposed the use of this type of remotely
controlled flare unit for the 2001-2002 winter seeding program in the ongoing Santa Barbara
County operational winter cloud seeding program. NAWC was awarded the contract and
customized a design for these updated, remotely controlled units, referred to as Automated High
Output Ground Seeding Systems (AHOGS). Three units were subsequently fabricated and
installed for the 2001-2002 storm season. Three additional units were incrementally added to the
network during the period from 2002 through 2007. These sites can be remotely accessed and
activated on a 24/7 basis through a cell phone modem that uses a special Campbell Scientific
computer program customized for the project and is a password driven system.

27
The flare seeding system design was modified for the 2005-2006 project through the
introduction of a NAWC custom designed spark arrestor. These spark arrestors, which fit over
each of the seeding flares, were developed to ensure that no large sparks or burning embers are
released from the flare burns. This greatly reduces fire concerns. Since flares are typically
burned when rain has recently occurred, or is occurring, fire danger is eliminated. The arrestors
were developed in case of an accidental misfire. Figure 4.9 provides a photo of a Santa Barbara
site with the spark arrestors installed. Figure 4.10 shows the flares installed without the spark
arrestors in place. Figure 4.11 shows close-ups of a flare burning inside a spark arrestor. Table 4-
5 provides a summary of the units being used on the Santa Barbara program.
These field-proven systems are designed for intensive seeding of convective cloud
systems from strategically located ground based sites using pyrotechnic devices (flares). These
are updated versions of systems used by North American Weather Consultants for cloud seeding
operations and research in past years. NAWC is currently operating multiple AHOGS systems
for cloud seeding in Santa Barbara County, California.
The AHOGS allows automated, focused, high-output seeding releases from remote field
sites under program control from a PC located at the seeding project control center. Thus, the
project meteorologist has the ability to conduct intensive seeding of convective rain bands or
other organized convective systems as they track into and across, or persist over, the project area
under varying wind flow regimes.
The AHOGS field systems are built to withstand and operate reliably under harsh field
conditions, consisting of the following primary field site components: The AHOGS flare sites are
controlled via a modem-equipped PC at the operations center, running custom software to
manage the flare seeding operations. The meteorologist has the option of firing flares
individually in real time, or to order batch firing of any number of flares at selectable intervals at
each remote field site, e.g., three flares at selectable time intervals, beginning at any selected
time. The software allows monitoring and reporting of site status information, such as flare
inventory and battery voltage.

28
At each field site, the system is designed for easy reloading of flares, easy system
operations testing and reset of onsite flare inventory via the integrated datalogger.
Table 4-5
Automated High Output Ground Seeding Systems
Flare masts which each hold 16, 150-gm (fast acting AgI) flares.
An environmentally sealed control box containing a cellular phone communications
system, digital firing sequence relays/controller, datalogger and system battery.
A solar panel/charge regulation system to maintain site power.
Cellular phone communications antenna.
Lightning protection.
NAWC will use an updated design for the fabrication of the four remotely controlled
flare trees. This updated design will be similar to the earlier design of the Santa Barbara remotely
controlled units. There will be two “trees” at each site. Each tree will hold 16 flares. A central
mast will support the electronics, battery and solar panel.
Figure 4.10 Remotely Operated Flare Site, Santa Barbara County

29
Figure 4.11 Flares without Spark Arrestors
Figure 4.12 Flare Burning inside Spark Arrestor

30
NAWC initially used this ground-based pyrotechnic seeding approach in the operational
Santa Barbara program following the completion of the research program (1982-1985). This
flare based seeding mode was discontinued when the manufacture of high output flares was
discontinued. Ice Crystal Engineering (ICE) developed and marketed a high output flare
beginning in the late 1990’s, which again made this a viable seeding approach. These flares are
similar to common highway distress flares both in appearance and burn characteristics. Once
ignited, the flares burn for approximately 4 minutes. The ICE flares have been tested at the
Cloud Simulation Laboratory located at Colorado State University (CSU) to quantify their
effectiveness in producing ice-forming nuclei. Tests results are summarized in Table 4-6. The
flares create high numbers of microscopic sized ice nuclei that are capable of producing ice
crystals at temperatures as warm as -3.80C. For example, from Table 4-6, 6.13 x 10
13 ice crystals
could be produced for each gram of silver iodate burned from one of these flares. The goal of
producing ice nuclei by any method has always been to develop generation systems that produce
nuclei that begin to activate at, or as near as possible, to the freezing level. Numerous research
programs have indicated the frequent occurrence of supercooled water droplets in the range of 0
to –100C. The flares are also fast acting with 90% of the total ice crystal formation occurring in
5 minutes in the cloud chamber (DeMott, 1999). Both of these characteristics are very attractive
for application in the San Gabriel program. The goal of the original Santa Barbara II design was
to nucleate as many of the supercooled liquid water droplets in the lower levels of the convection
bands as possible. By definition supercooled liquid water droplets can occur at temperatures just
slightly less than freezing. The ice nuclei produced by these flares would enter the bases of the
convection bands and be carried upward then would nucleate quickly once they are carried
through the –40C temperature level.

31
Table 4-6. Effectiveness Test Results of the ICE 150 gram Flare at the Colorado -State
University Cloud Chamber Facility
Manually Operated Silver Iodide Generators
These manually operated devices, a NAWC custom design, are approximately 12 inches
in diameter and three feet tall. Each Cloud Nucleating Generator (CNG) would be connected to a
large-capacity propane tank (250-500 gal) supplied by a third-party propane company. Figure
4.13 provides photographs of one of these sites from the 2001-2002 program conducted for the
LACDPW.
Each generator will be attached to four steel rebar rods driven into the ground around
each generator, attached to an adjacent structure, or attached to a weighted foundation plate. In
all cases, the manual generators will be secured in place by a chain attached to an existing
facility or an “I-bolt” concreted in place. This will mitigate tampering by unauthorized
personnel. A spare generator will be kept on standby so that replacements can be made within 24
hours in case of theft. NAWC will arrange for temporary employees to be available during storm
periods to turn the generators on or off at the six locations.

32
Chemical Makeup of Flares
The ICE flares contain 150 grams of binder and seeding material. Each unit emits 15
grams of seeding material when burned.
Chemical Makeup of Manual Generator Seeding Solution
The CNGs would operate by burning a solution of approximately 96% acetone
(CH3COCH), 3% silver iodide (AgI), and 1.0% sodium iodide (NaI). The AgI acts as the ice
nuclei on which ice crystals form, and the sodium iodide acts as a catalyst to dissolve the AgI in
acetone. Each manually operated CNG would hold approximately 8 gal of acetone/AgI solution.
The solution would be burned at a rate of 0.24 gal/hr, with the AgI in solution being burned at 24
grams/hr.
Fuel or Propellant to be Used, Flares
None required.
Fuel or Propellant to be Used, Manual Generators
Propane gas is used with the manual generators.
Capacity of Remote Flare Dispensers
The two flare trees will hold 16 flares each.
Capacity of Manual Generators
Each CNG will hold approximately 8 gallons of the acetone/silver iodide seeding
solution. The solution would be burned at a rate of 0.24 gal/hr. This consumption rate would
allow approximately 30 hours of operation before the tank would need to be refilled.
Capacity of Remote Flare Fuel Supply
No separate fuel supply is required.

33
Figure 4.13 Manually Operated Silver Iodide Generator
Capacity of Manual Generator Fuel Supply
NAWC will use propane tanks with a 120 gallon capacity. Propane will be burned at a
rate of approximately 0.75 gallons per hour. NAWC will keep track of propane consumption and
call for propane tank refills as needed throughout the operational season. NAWC has contracted
with a local propane dealer that is located near the target areas.
Vandalism, Fire Protection and Equipment Removal
Vandalism counter measures will be considered at each of the sites. All sites will be
located on LACDPW property. All sites are fenced with access provided to authorized personnel
through locked gates. Additional fences (6 to 8 feet in height) will be installed around the four
remotely operated flare units. Access to these enclosures will be through a locked gate.
The manual generators will be removed at the end of each seeding season and re-installed
34
each fall. Some of the components of the remote systems (e.g., solar panels, antennas, batteries)
will also be removed each spring and re-installed each fall).
Fire protection measures to be taken at the remote flare sites will include:
Spark arrestors that are installed around each flare as discussed in section 4.5.1.
Sites will be installed in areas that are gravel, bare dirt or asphalt.
Each site will be fenced with plastic slats inserted in the chain link fencing.
Units will only be operated when rain has recently fallen or is falling in the
vicinity as determined from the LACDPW’s ALERT rainfall network.
Fire protection measures to be taken at the manual sites will include:
Each generator will either be secured to four steel rebar rods driven into on the
ground around each generator, secured to some structure, or secured to a weighted
foundation base plate. Manual generators will be chained to an appurtenance of an
existing facility or an “I-bolt” concreted in place. Sites will be installed in areas
that are gravel, bare dirt or asphalt.
Units will only be operated when rain has recently fallen or is falling in the
vicinity as determined from the LACDPW’s ALERT rainfall network.
Control of cloud seeding activities from NAWC’s perspective will primarily be
accomplished from NAWC’s corporate headquarters located in Sandy, Utah. Each of NAWC’s
meteorologists will also have the necessary project information, access to the internet, the
software program needed to operate the remote flare sites, and telephone access in their homes.
This will allow operations to be conducted on a 24/7 basis. NAWC’s project manager will be
responsible for designating the project meteorologist periods of responsibility for the oversight
and operations of this program.
4.10 Equipment Installation

35
There were five sub-tasks that are identified in the RFP. Each of these sub-tasks will be
discussed in the following.
4.10.1 Generator Site Locations and Operations
NAWC agrees with the requirement listed in the RFP: Contractor shall provide, install,
adjust, calibrate, maintain, and operate a system of cloud nucleating generators (remotely and/or
manually operated) within the work location area. All equipment shall be maintained in good
operating condition.
NAWC will utilize APCO, Inc. of Salt Lake City to fabricate and test the four remotely
controlled ground-based flare sites. APCO, Inc. previously designed and fabricated three similar
units for NAWC that are currently being used in the conduct of the Santa Barbara County
program as discussed in Appendix B. These units have been operating very successfully on that
program for many years. The units provided for the San Gabriel program will be new, not
previously used, units. APCO will not perform any work in California. More information on
APCO may be found on their web site: www. http://www.apco-inc.com/. NAWC will
subcontract with Metrological Solutions, Inc. (MSI), a Trinity Consultants Company based in
Salt Lake City, to install and field test these units at the selected sites chosen through the update
to the 2009 Cloud Seeding Program Report. It may be worth noting that to the best of our
knowledge, NAWC is the only U.S. firm that has routinely utilized the ground-based,
remotely operated flare technology in central or southern California to seed winter clouds.
NAWC has utilized this technology in performing annual winter programs in Santa Barbara
County since the 2001-2002 winter season (Griffith, et al, 2005 and 2015).
NAWC has a ready inventory of 15 ground-based manually operated liquid fueled
generators on hand, available for dedication to the seeding program. Six of these generators will
be installed at sites chosen through the update of the Cloud Seeding Program Report. NAWC
will hire one or two part time temporary local employees to operate and maintain the six manual
generators. One of NAWC’s temporary employees, Mr. Henry Reese, a long-term NAWC
temporary employee working on a winter cloud seeding program in Utah will work with the
locally-hired temporary employee(s) on the installation of the manually operated units. At the
same time he will train the local employee(s) on the operation and maintenance of these units.

36
Descriptions of both the remote flare units and manually operated liquid fueled generators were
included in sections 4.9.6.1 and 4.9.6.2 (included there since such descriptions should be in the
operations manual).
Mr. Solak, NAWC’s Vice President, will be on site to supervise the installation of both
the remote and manual units.
4.10.2 Use of County-Owned Property
NAWC in the preparation of the Cloud Seeding Program Report (Griffith 2009)
considered only County-owned properties as potential cloud seeding generator sites. We intend
to choose sites for installation of the seeding generators from a list of 15 County-owned sites as
documented in this Program Report.
4.10.3 Ground Generator Sites
As discussed in Section 4.1, NAWC intends to recommend ten sites to be used in the
conduct of the 2015-2016 cloud seeding program. Four of the ten recommended sites will be
remotely operated flare sites. The other six will be manually operated, liquid fueled generator
sites. The recommended mix of manual and remote units may change in future optional
seasons of operation.
4.10.4 Cloud Seeding Equipment
NAWC will meet the requirements listed in the RFP as covered in previous sections.
4.10.5 Seeding Generator Specifications
NAWC agrees to meet the requirements listed in the RFP.

37
5.0 Task B: Operations
Quoting from the Scope of Work:
“Operation of cloud seeding equipment shall be the responsibility of the Contractor. The
Cloud Seeding Program will be managed by the Contractor's WMA certified operator as
provided in Exhibit J. The Contractor will provide all equipment, materials, and personnel
necessary to properly direct operations. The Contractor and project manager must have at least
five years of experience within the last ten years providing weather modification (cloud seeding)
services to government, utility, or similar agencies in the central and southern California region.
Cloud seeding operations shall be carefully coordinated with weather conditions to
ensure maximum effect on the target area and avoid any weather modification operations
outside the target areas. The seeding objective should be to seed as many favorable storms as
practical to enhance precipitation within the target areas”.
Mr. Don Griffith, NAWC’s President, will manage this cloud seeding program. As
previously stated, Mr. Griffith is a WMA Certified Manager. NAWC agrees to the coordination
and seeding objectives stated above.
There are several specific tasks to be accomplished concerning Operations. Each of these
tasks will be discussed in the following.
5.1 Storm Monitoring and Identification of “Seedable” Conditions
NAWC will utilize similar procedures that evolved in the conduct of the previous NAWC
four-year project for LACDPW, plus updates based on insights gained via winter cloud seeding
research and operations conducted in Santa Barbara County. These procedures involved weather
forecasting of the magnitude and seedability of winter storms that were expected to impact the
target area. Typically storms expected to produce <0.50 inches of rain in the target areas will not
be seeded. The seedability of the approaching storms will be a function of wind direction,
atmospheric stability and temperatures. Lower level winds need to be blowing from the south
through west to avoid creating seeding impacts within the Los Angeles Basin. Fortunately, these
wind directions also produce the bulk of the precipitation in the target area. The atmosphere
needs to be neutral to unstable to allow the seeding material released from the surface to be

38
transported into the colder portions of the storm clouds in a timely fashion. The temperatures
need to be cold enough so that the silver iodide seeding material can reach its activation
temperature (-40 C) quickly.
NAWC’s meteorologist responsible for seeding operations will assess each approaching
storm system to assess its seeding potential. Identification of seeding potential was discussed in
Section 4.9.2. As documented in Appendix B, the main focus of the cloud seeding will be on
convection bands (especially so when using the four remotely operated flare trees). The manually
operated silver iodide generators may be used to seed during periods between convection bands
but they too are thought to be most effective during the passage of convection bands. A variety
of tools are available on the internet to monitor storms and determine whether they contain
“seedable” periods. These tools include upper-air constant pressure surface analysis (e.g. 700
mb) and model projections of future conditions. This type of information is used in assessing
whether NAWC’s generalized seeding criteria (Table 4-3). Satellite photos can reveal the
location of storms, storm movement, relevant features such as indications of cyclogenesis along
a frontal system, water vapor content, cloud tops, etc. The NWS NEXRAD radar systems
provide the key observational tool used in identifying the location and intensity of convection
bands.
5.2 Forecast Model
The Weather Research and Forecasting (WRF) Model is a next-generation mesoscale
numerical weather prediction system designed to serve both operational forecasting and
atmospheric research needs. It features multiple dynamical cores, a 3-dimensional variational
(3DVAR) data assimilation system, and a software architecture allowing for computational
parallelism and system extensibility. WRF is suitable for a broad spectrum of applications across
scales ranging from meters to thousands of kilometers.
The effort to develop WRF has been a collaborative partnership, principally among the
National Center for Atmospheric Research (NCAR), the National Oceanic and Atmospheric
Administration (the National Centers for Environmental Prediction (NCEP) and the Forecast
Systems Laboratory (FSL), the Air Force Weather Agency (AFWA), the Naval Research

39
Laboratory, the University of Oklahoma, and the Federal Aviation Administration (FAA). WRF
allows researchers the ability to conduct simulations reflecting either real data or idealized
configurations. WRF provides operational forecasting a model that is flexible and efficient
computationally, while offering the advances in physics, numerics, and data assimilation
contributed by the research community.
NAWC will utilize NOAA’s Earth Systems Research Laboratory’s High Resolution
Rapid Refresh (HRRR) version of the WRF model during the 2015-2016 rainy season. The
output from the HRRR model has been found to be quite useful in forecasting weather
parameters of interest in seeding at one hour intervals out to 13 or 14 hours offering rather
accurate short term forecasts. This model has a 3km grid spacing compared to the more standard
grid model spacing of 13km (e.g. NAM model), plus it is re-initialized every hour using the
latest radar observations. The NAM and GFS models are currently re-initialized every 6 hours.
Hourly forecast outputs from the HRRR model are available for a variety of parameters out to 15
hours. Table 5-1 provides a summary of some of forecast parameters of interest in conducting the
cloud seeding program.
Table 5-1 HRRR Forecast Parameters of Interest
Parameter Application
1km above ground
level reflectivity
Forecast of convection band locations based on radar returns 1km above
ground
Composite
reflectivity
Forecast of convection band locations using reflectivity values from
different scan elevations. This is useful when bands approach the radar
site since low elevation scans may go underneath the bands.
Maximum 1km above
ground level
reflectivity
Forecasts that pinpoints the location of the heart of the convection bands
1 hour accumulated
precipitation
Forecasts of radar derived estimates of precipitation reaching the ground
in a one-hour period (QPF).
Total accumulated
precipitation
Forecasts of radar derived estimates of precipitation reaching the ground
for a specified time period, for example 1-6 hours in the future (QPF).
40
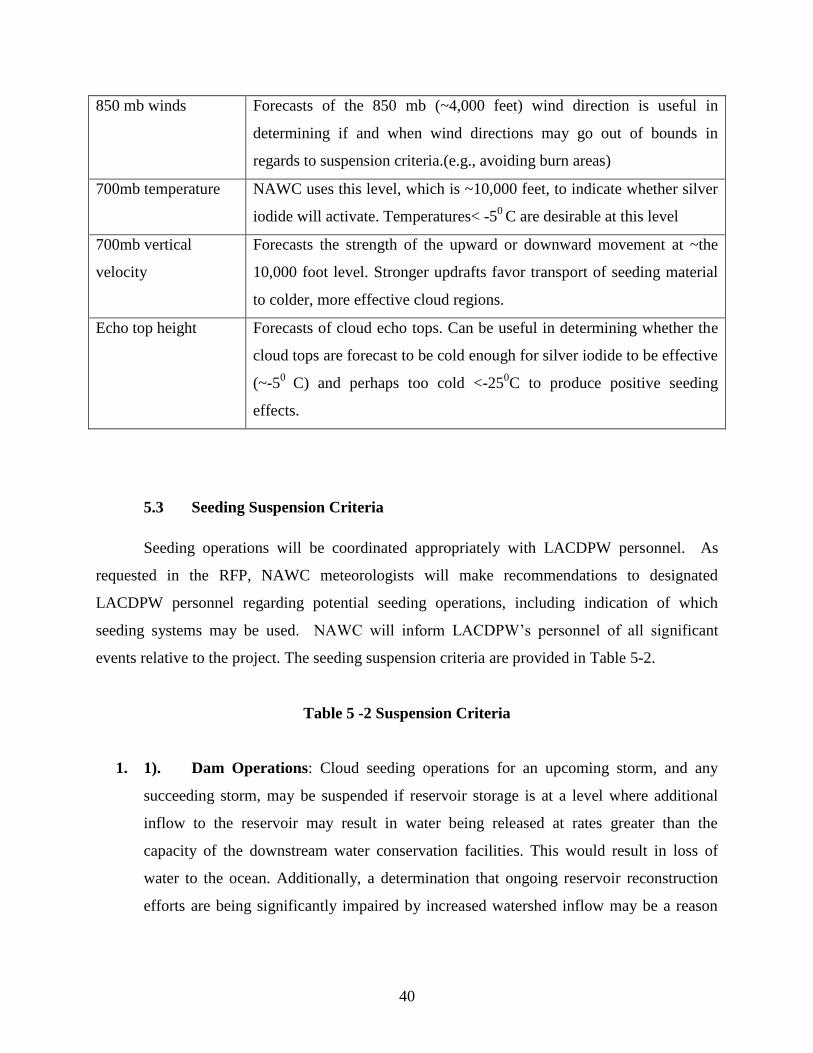
850 mb winds Forecasts of the 850 mb (~4,000 feet) wind direction is useful in
determining if and when wind directions may go out of bounds in
regards to suspension criteria.(e.g., avoiding burn areas)
700mb temperature NAWC uses this level, which is ~10,000 feet, to indicate whether silver
iodide will activate. Temperatures< -50
C are desirable at this level
700mb vertical
velocity
Forecasts the strength of the upward or downward movement at ~the
10,000 foot level. Stronger updrafts favor transport of seeding material
to colder, more effective cloud regions.
Echo top height Forecasts of cloud echo tops. Can be useful in determining whether the
cloud tops are forecast to be cold enough for silver iodide to be effective
(~-50
C) and perhaps too cold <-250C to produce positive seeding
effects.
5.3 Seeding Suspension Criteria
Seeding operations will be coordinated appropriately with LACDPW personnel. As
requested in the RFP, NAWC meteorologists will make recommendations to designated
LACDPW personnel regarding potential seeding operations, including indication of which
seeding systems may be used. NAWC will inform LACDPW’s personnel of all significant
events relative to the project. The seeding suspension criteria are provided in Table 5-2.
Table 5 -2 Suspension Criteria
1. 1). Dam Operations: Cloud seeding operations for an upcoming storm, and any
succeeding storm, may be suspended if reservoir storage is at a level where additional
inflow to the reservoir may result in water being released at rates greater than the
capacity of the downstream water conservation facilities. This would result in loss of
water to the ocean. Additionally, a determination that ongoing reservoir reconstruction
efforts are being significantly impaired by increased watershed inflow may be a reason
41
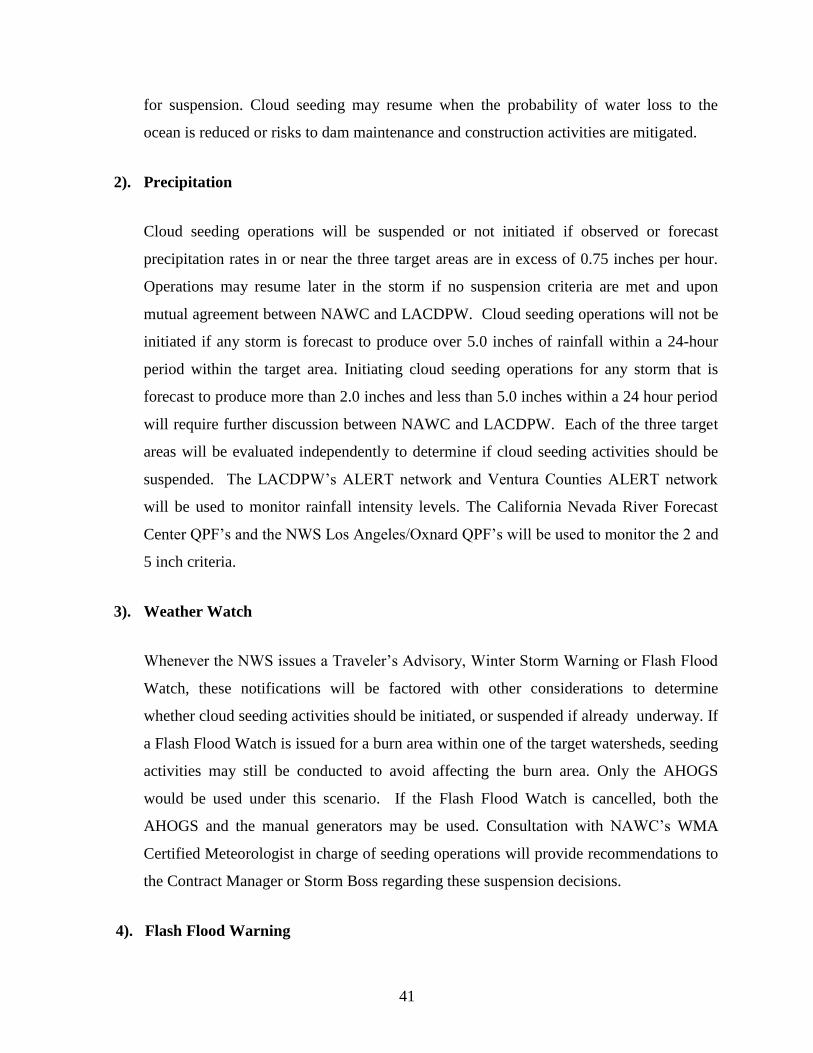
for suspension. Cloud seeding may resume when the probability of water loss to the
ocean is reduced or risks to dam maintenance and construction activities are mitigated.
2). Precipitation
Cloud seeding operations will be suspended or not initiated if observed or forecast
precipitation rates in or near the three target areas are in excess of 0.75 inches per hour.
Operations may resume later in the storm if no suspension criteria are met and upon
mutual agreement between NAWC and LACDPW. Cloud seeding operations will not be
initiated if any storm is forecast to produce over 5.0 inches of rainfall within a 24-hour
period within the target area. Initiating cloud seeding operations for any storm that is
forecast to produce more than 2.0 inches and less than 5.0 inches within a 24 hour period
will require further discussion between NAWC and LACDPW. Each of the three target
areas will be evaluated independently to determine if cloud seeding activities should be
suspended. The LACDPW’s ALERT network and Ventura Counties ALERT network
will be used to monitor rainfall intensity levels. The California Nevada River Forecast
Center QPF’s and the NWS Los Angeles/Oxnard QPF’s will be used to monitor the 2 and
5 inch criteria.
3). Weather Watch
Whenever the NWS issues a Traveler’s Advisory, Winter Storm Warning or Flash Flood
Watch, these notifications will be factored with other considerations to determine
whether cloud seeding activities should be initiated, or suspended if already underway. If
a Flash Flood Watch is issued for a burn area within one of the target watersheds, seeding
activities may still be conducted to avoid affecting the burn area. Only the AHOGS
would be used under this scenario. If the Flash Flood Watch is cancelled, both the
AHOGS and the manual generators may be used. Consultation with NAWC’s WMA
Certified Meteorologist in charge of seeding operations will provide recommendations to
the Contract Manager or Storm Boss regarding these suspension decisions.
4). Flash Flood Warning

42
Cloud seeding will be not be initiated or will be immediately suspended whenever the
NWS issues a Flash Flood Warning that impacts one of the target areas. Each area will
be evaluated independently, and cloud seeding operations may continue in the other
target areas if NAWC’s WMA Certified Operator determines that impacts in the Flash
Flood Warning area can be avoided. Either the Contract Manager, Storm Boss or
NAWC’s WMA Certified Operator may call for such suspensions. The party that calls
the suspension will notify the other parties in a timely manner. The decision of whether to
initiate or resume operations following the expiration of the Flash Flood Warning will be
a joint decision involving the Contract Manager or Storm Boss and NAWC’s WMA
Certified Operator.
5). Fire Damage
Cloud seeding activities will be suspended in areas impacted by fire to prevent undue
erosion, mudflow hazards, or flooding downstream of the area that has been burned. The
suspension will continue until natural re-vegetation occurs to mitigate excessive sediment
flows during storms
6). Earthquake Damage
Depending on the intensity and distance from the epicenter of an earthquake, prior to or
during a storm season, the soil structure in the target areas could be disturbed creating the
potential for damaging landslides and mudflows during periods of moderate to heavy
rainfall. If these conditions exist in the target areas, cloud seeding may be suspended for
the remainder of the storm season. Public Works geology, geo-technical, and
sedimentation personnel will analyze the impact on sediment transport and decide when
cloud seeding may be resumed in that area.
7). Special Conditions
Cloud seeding operations may be suspended for special conditions such as significant
construction activities, search and rescue operation, holiday times when public use is
higher than normal, and special events such as bicycle races or large public gatherings.

43
8). No Impact Area
Cloud seeding operations will be suspended if they are predicted to have an impact within
the Los Angeles Basin.
9). Other Special Circumstances
Devils Gate Dam Watershed: LACDPW wishes to limit cloud seeding impacts in this
watershed due to a high level of sediment that has built up behind the dam. As a
consequence, activate generator sites 6 (Winery Canyon Debris Basin) and 7 (Lincoln
Debris Basin) only when this drainage is not expected to be impacted or that the seeding
material will rise over the hills that feed the Devil’s Gate Watershed, and augmented
precipitation would be expected to fall in the Big Tujunga Watershed.
Other special circumstances that the Operations Director or NAWC's Project
Meteorologist deem unsafe.
10) Manual Generators
Manual generators are to be turned off within one hour of any suspension criteria being
met.
5.4 Coordination
NAWC will attempt to provide 48 hours’ notice of the potential for a “seedable” storm to
impact the target areas. NAWC will monitor the potential storm and give an update on the
potential “seedabilty” of the storm 24 hours before precipitation is expected to begin. NAWC
will obtain prior approval from Public Works’ Contract Manager (Manager) before conducting
any cloud seeding; cloud seeding will be conducted by Contractor's personnel. Contractor will
notify the Manager when an approaching storm is expected to impact the target area that
is expected to be “seedable” and produce > 0.50” but < 2.00” of rainfall at one or more
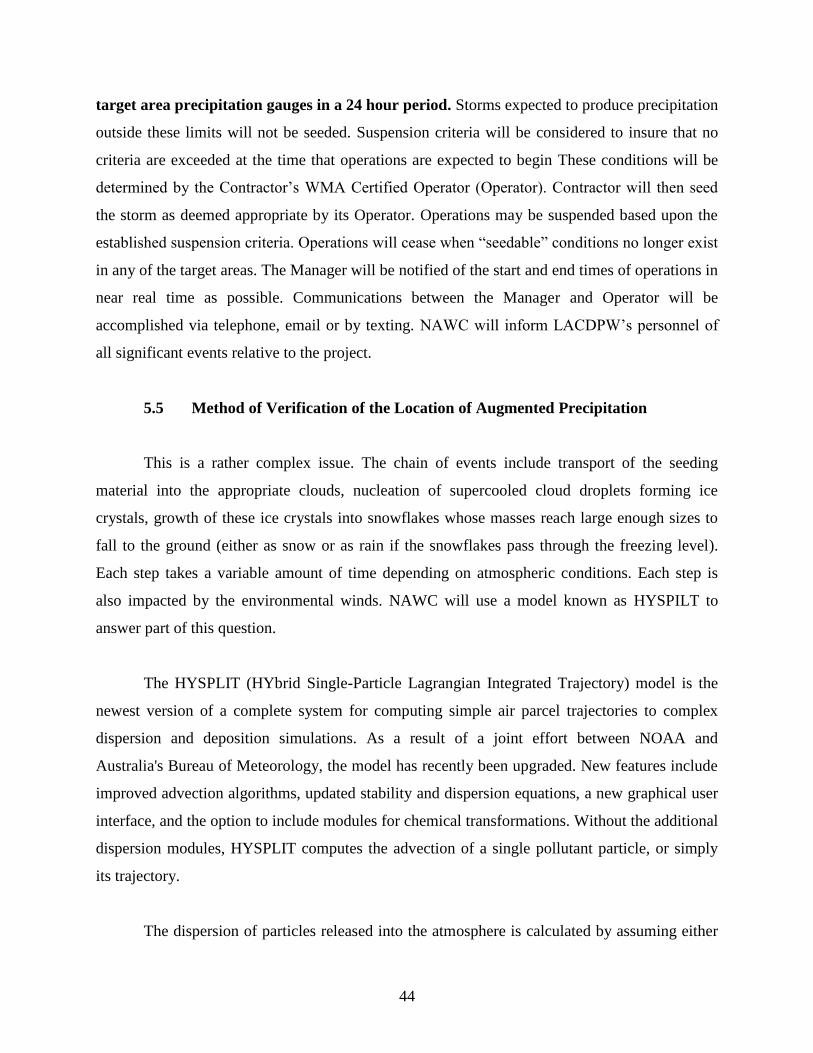
44
target area precipitation gauges in a 24 hour period. Storms expected to produce precipitation
outside these limits will not be seeded. Suspension criteria will be considered to insure that no
criteria are exceeded at the time that operations are expected to begin These conditions will be
determined by the Contractor’s WMA Certified Operator (Operator). Contractor will then seed
the storm as deemed appropriate by its Operator. Operations may be suspended based upon the
established suspension criteria. Operations will cease when “seedable” conditions no longer exist
in any of the target areas. The Manager will be notified of the start and end times of operations in
near real time as possible. Communications between the Manager and Operator will be
accomplished via telephone, email or by texting. NAWC will inform LACDPW’s personnel of
all significant events relative to the project.
5.5 Method of Verification of the Location of Augmented Precipitation
This is a rather complex issue. The chain of events include transport of the seeding
material into the appropriate clouds, nucleation of supercooled cloud droplets forming ice
crystals, growth of these ice crystals into snowflakes whose masses reach large enough sizes to
fall to the ground (either as snow or as rain if the snowflakes pass through the freezing level).
Each step takes a variable amount of time depending on atmospheric conditions. Each step is
also impacted by the environmental winds. NAWC will use a model known as HYSPILT to
answer part of this question.
The HYSPLIT (HYbrid Single-Particle Lagrangian Integrated Trajectory) model is the
newest version of a complete system for computing simple air parcel trajectories to complex
dispersion and deposition simulations. As a result of a joint effort between NOAA and
Australia's Bureau of Meteorology, the model has recently been upgraded. New features include
improved advection algorithms, updated stability and dispersion equations, a new graphical user
interface, and the option to include modules for chemical transformations. Without the additional
dispersion modules, HYSPLIT computes the advection of a single pollutant particle, or simply
its trajectory.
The dispersion of particles released into the atmosphere is calculated by assuming either

45
puff or particle dispersion. In the puff model, puffs expand until they exceed the size of the
meteorological grid cell (either horizontally or vertically) and then split into several new puffs,
each with its share of the pollutant mass. In the HYSPLIT particle model, a fixed number of
initial particles are advected about the model domain by the mean wind field and a turbulence
component. The model's default configuration assumes a puff distribution in the horizontal and
particle dispersion in the vertical direction. In this way, the greater accuracy of the vertical
dispersion parameterization of the particle model is combined with the advantage of having an
ever-expanding number of particles represent the pollutant distribution.
The model can be run interactively on the Web through the READY system on the
NOAA site, or the code executable and meteorological data can be downloaded to a Windows
PC. The Web version has been configured with some limitations to avoid computational
saturation of the web server. The registered PC version is complete with no computational
restrictions, except that the user must download the necessary meteorological data files. The
unregistered version is identical to the registered version except that it will not work with
forecast meteorology data files.
NAWC has utilized the HYSPLIT model to predict the transport and diffusion of silver
iodide seeding material during storm situations in Santa Barbara County during the past four
seasons of operations. The model can also be run using archived NAM model data, which is
available back to 2007. Figure 5.1 provides a HYSPLIT model output for a seeded storm event
during the 2014-2015 winter season in Santa Barbara County.

46
Figure 5.1 HYSPLIT output for Mt. Lospe, Harris Grade, Gaviota, West Camino Cielo,
and Gibraltar Road on April 7, 2015
The depictions provided in Figure 5.1 are of the transport of the seeding plumes. The
seeding material needs to interact with the convection bands, forming ice crystals which grow
into snowflakes which then fall to the ground changing into rain drop as they pass through the
freezing level. These processes occur as the band moves downwind in time. Consequently, these
depictions are of the initial transport and diffusion phase of the plumes while the resultant fallout
of augmented precipitation would occur downwind of these plume depictions (typically to the
east or northeast of these plume depictions). HYSPLIT runs for representative seeding events can
be provided to LACDPW after the passage of each seeded storm.

47
There are some sophisticated plume transport, ice crystal growth and fallout models
being developed at institutes like the National Center for Atmospheric Research (NCAR).
Currently these models are in a developmental phase and not available to public users. These
models require large computers to run simulations and these runs are rather expensive.
5.6 Generator Control
NAWC will be responsible for operational control of the cloud seeding
generators, including communications, flare replacement, and maintenance/repair of
all the NAWC equipment.
5.7 Acquisition of Real-Time Weather Data
NAWC will provide the appropriate equipment to acquire real-time weather data
available from Public Works ALERT System, National Weather Service (NWS), or other
sources to ensure that the Contractor's WMA Certified Manager or meteorologist
shall have access to sufficient current weather data to make forecasts and seeding
recommendations as required. Additional details on this topic were provided in Sections 4.3-4.5.
6.0 Task C: Reports and Miscellaneous Items
6.1 Monthly Operational Report
NAWC will provide one hard copy and one electronic copy of a monthly
operational report at the end of each month using Microsoft Word. This report shall include
general remarks on the cloud seeding opportunities and activities of the month and
summary of storm periods. The monthly report will include computerized color
weather images with color contouring. All precipitation events and contoured radar
scans are to be recorded on CD or DVD, which shall show targeted rain cloud
positions, relevant wind directions, and indicate time of nuclei generation data. Radar range
will be at least 100 nautical miles. All archival CD or DVDs shall be part of the monthly

48
operations Report. All costs for archival of CDs or DVDs shall be included in the cost of the
monthly operational report.
6.2 Annual Report
NAWC will provide five hard copies and one electronic copy of a draft annual
operation and evaluation report using Microsoft Word within 45 days following
termination of the Storm season for Public Works to review. This report shall be a
summary of all activities related to the project including seeding operations, storm data,
analysis of actual silver iodide plume dispersion, assessment of additional precipitation,
and a discussion of project effectiveness. NAWC will incorporate comments received from
Public Works into the draft submittal and submit five hard copies and one electronic copy
of a final annual report using Microsoft Word within 14 days of receiving comments.
Photographs of equipment used in connection with this project will be included as part of
the report.
6.3 Federal and State Reporting
NAWC will file the appropriate paperwork at the Federal level with the National Oceanic
and Atmospheric Administration (NOAA). NAWC will assist the LACDPWs in completing the
reporting requirements of the California Department of Water Resources at the State level
although these requirements are the responsibility of the sponsoring agency; in this case the
LACDPW.
6.4 Hours and Days of Service
Once the program is operational, operations will be conducted during “seedable” storm
events on a 24/7 basis, including Holidays, through April 15, 2016.

49
6.5 Miscellaneous Scope of Work Items
Item H, Suspension Criteria, were covered under Section 5.3. NAWC acknowledges all
other items listed: E, F, G, I, J, K, L, M, N, and O.

A-1
APPENDIX A Site Survey Report
North American Weather Consultants, Inc.
San Gabriel Cloud Seeding Project Site Survey
December 1-2, 2015
A survey of prospective ground-based cloud seeding equipment sites was
conducted December 1-2, 2015, by Mark Solak of North American Weather Consultants
and Keith Hala of Los Angeles County DPW. The purpose of the survey was to identify
ten sites from a list of fifteen possibilities located at LACDPW foothills properties,
identified earlier by DPW staff. A NAWC staff member had visited the fifteen sites in
2009 as part of development of a Program Report for the cloud seeding project. The
purpose of the December 2015 survey was to establish a network of ten seeding sites
for effective treatment (for precipitation augmentation) of winter storm systems affecting
the San Gabriel Mountains from the Pacoima drainage to the San Gabriel drainage. All
fifteen prospective sites were visited and assessed.
The seeded portion of the mountains stretches from near San Fernando
eastward to near San Dimas, a distance of approximately 40-45 miles. Establishment
of ten seeding sites for a target area of that size is consistent with the generalized
concept of average site separation of about 5 miles. This allows overlap of the seeding
plumes as the seeding material released from the ground sites is transported up the
mountain slopes by the southerly winds associated with the most productive winter
storms.
Two types of seeding systems will be employed, both emitting the seeding
material by combustion. One type is manually operated, producing the silver iodide
seeding material by spraying a solution of acetone containing 3% by weight of the
seeding material. These systems, referred to as Cloud Nucleating Generators (CNG’s),
are designed for continuous operation during stormy periods exhibiting favorable
characteristics. A CNG is shown in Figure 1. The second seeding system type is an
Automated High Output Ground Seeding (AHOGS) that emits the seeding material via
combustion of flares impregnated with seeding material. An AHOGS site is shown in
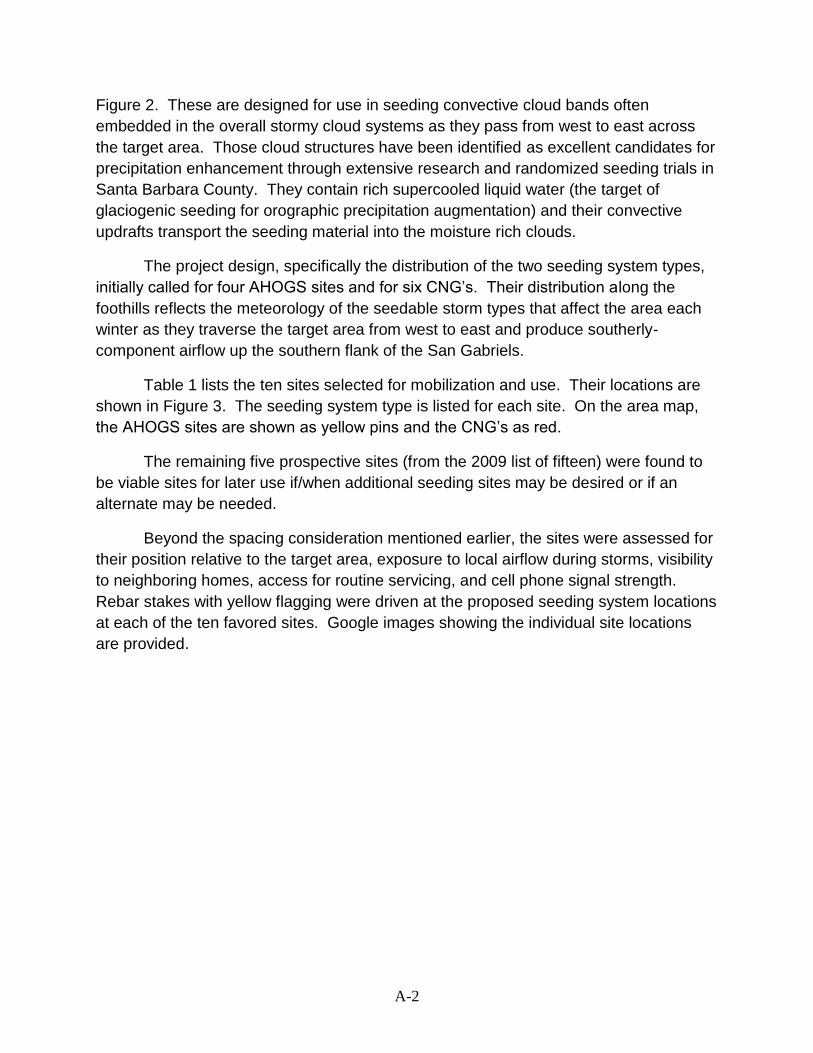
A-2
Figure 2. These are designed for use in seeding convective cloud bands often
embedded in the overall stormy cloud systems as they pass from west to east across
the target area. Those cloud structures have been identified as excellent candidates for
precipitation enhancement through extensive research and randomized seeding trials in
Santa Barbara County. They contain rich supercooled liquid water (the target of
glaciogenic seeding for orographic precipitation augmentation) and their convective
updrafts transport the seeding material into the moisture rich clouds.
The project design, specifically the distribution of the two seeding system types,
initially called for four AHOGS sites and for six CNG’s. Their distribution along the
foothills reflects the meteorology of the seedable storm types that affect the area each
winter as they traverse the target area from west to east and produce southerly-
component airflow up the southern flank of the San Gabriels.
Table 1 lists the ten sites selected for mobilization and use. Their locations are
shown in Figure 3. The seeding system type is listed for each site. On the area map,
the AHOGS sites are shown as yellow pins and the CNG’s as red.
The remaining five prospective sites (from the 2009 list of fifteen) were found to
be viable sites for later use if/when additional seeding sites may be desired or if an
alternate may be needed.
Beyond the spacing consideration mentioned earlier, the sites were assessed for
their position relative to the target area, exposure to local airflow during storms, visibility
to neighboring homes, access for routine servicing, and cell phone signal strength.
Rebar stakes with yellow flagging were driven at the proposed seeding system locations
at each of the ten favored sites. Google images showing the individual site locations
are provided.

A-3
Figure 1: CNG site in operation

A-4
Figure 2: AHOGS site

A-5
Table 1
San Gabriel Cloud Seeding Project, 15-362
Site Survey December 2015
Final 10 Sites (from earlier list of 15; numbering preserved)
Ground Seeding Sites
1 Pacoima Dam Work Area AHOGS
2 Lopez Inlet Debris Basin CNG
3 Cassara Debris Basin CNG
4 Zachau Sediment. Placement Site CNG
5 Dunsmuir Debris Basin AHOGS
6 Winery Canyon Debris Basin CNG
7 Lincoln Debris Basin CNG
8 Kinneloa West Debris Basin AHOGS
9 Santa Anita Spreading Ground CNG
11 Bradbury/Spinks Debris Basin AHOGS

A-6
Figure 3: Map of cloud seeding site locations (yellow = AHOGS, red = CNG)

Appendix B
Section 13 from NAWC Proposal # 15-362

B-1
13.0 Additional Information
The RFP in Section 2 provides the opportunity in this section to provide additional
information not presented elsewhere but is essential to a fair evaluation. As a consequence,
NAWC provides additional information in this section, information that is integral to our
proposal, feeding back into the proposed Work Plan in Section 6. Several topics will be
discussed: 1) Cloud Seeding Background and Cloud Seeding Program Design, 2) Possible
Evaluation of Seeding Effectiveness, 3) Scheduling of Work, and 4) Exceptions.
13.1 Background
Precipitation Augmentation Theories
Two theories have evolved concerning the potential to augment naturally occurring
precipitation. One theory postulates that a natural cloud's efficiency in producing precipitation
can be increased, while the other theory postulates that seeding can enhance cloud development,
leading to additional precipitation. The first theory has often been referred to as the static
seeding hypothesis while the second relies upon dynamic effects of cloud growth. In many
situations processes could be operative, whereby a cloud's precipitation efficiency is increased
and the cloud is made to grow larger due to the seeding.
Clouds contain water vapor, water droplets and frequently ice crystals if cloud
temperatures drop below freezing. Discoveries in the late 1940's established that minute
particles of silver iodide, when injected into a cloud that contained supercooled water droplets,
would cause those droplets to freeze (Vonnegut, 1947). Supercooled water droplets (droplets in
a cloud at temperatures below freezing) frequently exist in clouds, as evidenced by icing on
aircraft. These supercooled water droplets are the normal targets of most modern day cloud
seeding programs.

B-2
Precipitation Processes
There are two basic mechanisms that produce precipitation: coalescence and ice
formation. Coalescence is defined as “The growth of raindrops by the collision and coalescence
of cloud drops and or small precipitation particles.” This process is especially important in
tropical locations in the production of rainfall but it can also be a factor in the production of
rainfall in more temperate climates like those found in Santa Barbara County. Ice nucleation
(also known as the Bergeron-Findeisen theory) consists of a process in which precipitation
particles may form within a mixed cloud (ones composed of both ice crystals and liquid water
drops). In such clouds the ice crystals will gain mass by sublimation (formation of a solid phase
directly from a vapor phase) at the expense of the liquid drops that lose mass by evaporation.
Upon attaining sufficient weight, the ice crystals (by this time they would be snowflakes) would
fall to the ground as snow if the surface temperatures are at or below freezing, but would melt
and fall as raindrops if the surface temperatures are warmer than freezing. Of interest to this
discussion is the fact that cloud drops often exist in portions of clouds that are colder than
freezing. In fact, pure water droplets in a very clean laboratory environment can be cooled to
-39C before they will freeze through a process known as homogeneous nucleation. The
Bergeron-Findeisen process is important in the production of snow and rain in the more
temperate climates like those found in Santa Barbara County. The presence of supercooled
water droplets in clouds is often the focus of attempts to artificially modify clouds.
Ice Nucleation
As discussed in the above, clouds often have cloud droplets present at sub-freezing
temperatures. These droplets are termed “supercooled”. The natural tendency is for these
droplets to freeze, but to do so at temperatures warmer than -39C they need to encounter an
impurity to trigger the conversion to ice. There are particles present in our atmosphere that
possess the ability to cause these supercooled droplets to freeze; they are known as freezing
nuclei. Research has demonstrated that certain natural particles (e.g., soil particles) in the
atmosphere serve as freezing nuclei. The conversion of a supercooled water droplet into an ice
crystal is referred to as nucleation. It is known that the efficiency of these naturally occurring
B-3
freezing nuclei increases with decreasing temperatures. It has also been established that naturally
occurring freezing nuclei active in the temperature range of approximately -5 to -15C are
relatively rare. Research has also shown that minute particles of silver iodide begin to act
effectively as freezing nuclei at temperatures colder than -5C (Dennis, 1980). Some more
recently developed seeding formulations show nucleation at temperatures as warm as -4C. Silver
iodide is the agent most commonly used to “seed” clouds, a process often referred to as “cloud
seeding.”
There are two types of ice nucleation: condensation-freezing and contact. In condensation
freezing, a nucleus first serves as a condensation nucleus in forming a cloud droplet. At
temperatures of approximately -5C or colder this same nucleus can serve as a freezing nucleant.
In other words, under the right conditions, a nucleus can a) cause condensation, forming a cloud
droplet and b) then promote freezing on the same nucleus, forming an ice crystal. Contact
nucleation, as the name implies, means that a freezing nucleus must come in physical contact
with a supercooled water droplet, thus causing it to freeze (as long as the temperature of the
cloud droplet is cold enough for the freezing nuclei to be active). Contact nucleation can be a
relatively slow process (from a few to tens of minutes) compared to condensation-freezing
nucleation, which can be quite rapid (on the order of one minute).
Impacts of Silver Iodide Seeding
Since a sparsity of natural ice nuclei commonly exists in the atmosphere at temperatures
in the range of -5 to -15C, many clouds may be inefficient in converting water droplets into ice
crystals. The addition of silver iodide nuclei to these cloud regions can produce additional ice
crystals, which, under the right conditions, grow into snowflakes and fall out of the cloud as
either snow or rain. Rain is produced by the melting of such snowflakes when they fall through
warmer air near the ground. This increase in efficiency is usually referred to as a static seeding
effect.
In the process of converting supercooled water droplets to ice, additional heat is added to
the cloud due to the release of latent heat of fusion. This additional heat may invigorate the

B-4
circulation of air within the clouds, resulting in a dynamic effect. This postulated dynamic effect
was the basis for a National Oceanic and Atmospheric (NOAA) research program conducted in
Florida known as the Florida Area Cumulus Experiment (FACE). Two different phases of
FACE 1, 1970-76 and FACE 2, 1978-80 (Woodley, et al., 1983) indicated increases in area wide
rainfall, but the results fell short of strict statistical acceptance criteria. Rainfall increases from
seeded convection bands in the Santa Barbara II research program (Brown et al., 1974) were
attributed to both static and dynamic effects. NAWC conducted this research program in Santa
Barbara County with funding from the Naval Weapons Center at China Lake.
13.2 Santa Barbara II Research Program
The Santa Barbara II research program (1967-1973) conducted in Santa Barbara County
consisted of two primary phases. Phase I consisted of the release of silver iodide from a ground
location near 2,000 feet MSL located in the Santa Ynez Mountains north of Santa Barbara.
These silver iodide releases were made as “convective bands” passed overhead. The releases
were conducted on a random seed or no-seed decision basis in order to obtain baseline non-
seeded (natural) information for comparison. A large network of recording precipitation gauges
was installed for the research program (Figure 13.1). The amount of precipitation that fell from
each seeded or non-seeded convective band was determined at each precipitation gauge location.
Average convective band precipitation for seeded and non-seeded events was calculated for each
rain gauge location. Figure 13.2 shows the results of seeding from the ground as contours of the
ratios of average seeded band precipitation versus the non-seeded band precipitation. Griffith, et,
al, 2005 provides a description of this research program and a discussion of follow-on
operational programs that have been conducted in this area since 1981.
Ratios greater than 1.0 are common in Figure 13.2. A ratio of 1.50 would indicate a 50
percent increase in precipitation from seeded convection bands. The high ratios in Southwestern
Kern County are not significant in terms of amounts of additional rainfall since the convective
bands (both seeded and non-seeded) rapidly lose intensity as they enter the San Joaquin Valley.
In other words, a high percentage applied to a low base amount does not yield much additional
precipitation. These apparent effects may be due to delayed ice nucleation which would be
B-5
expected with the type of seeding flares used in this experiment that produced nuclei operating
by contact nucleation which is a relatively slow process.
The low amounts of natural precipitation in southwest Kern County results from
evaporation in “downslope” flow in the winter storms that affect this area. Such predominant
“downslope flow” areas are frequently known as rain-shadow areas in the lee of mountain
ranges. Figure 13.3 dramatically depicts this phenomenon from the coastal mountains in Central
and Southern California, which are wet, to the San Joaquin and Imperial Valleys, which are dry.
The 1.5 ratios along the backbone of the Santa Ynez Mountains are, however, significant in
terms of rainfall amounts since this area receives higher natural precipitation during winter
storms due to “upslope” flow. This upslope flow is also known as an orographic effect and
accounts for many mountainous areas in the west receiving more precipitation than adjoining
valleys (especially downwind valleys). It was concluded that convection band precipitation was
increased over a large area using this ground seeding approach.
In a similar experiment, phase II employed an aircraft to release silver iodide (generated
by silver iodide - acetone wing tip generators) into the convective bands as they approached the
Santa Barbara County coastline west of Vandenberg Air Force Base. The convective bands to be
seeded were also randomly selected. Figure 13.4 provides the results. Again, a larger area of
higher precipitation is indicated in seeded convective bands compared to non-seeded convective
bands. Notice the westward shift of the effect in this experiment versus the ground-based
experiment. This feature is physically plausible since the aircraft seeding was normally
conducted off the coastline in the vicinity of Vandenberg AFB (i.e., west of the ground-based
release point).
A study of the contribution of "convective band" precipitation to the total winter
precipitation in the Santa Barbara County and surrounding areas was conducted (in the analysis
of the Santa Barbara II research program). This study indicated that convective bands
contributed approximately one-half of the total winter precipitation in this area (Figure 13.5). If
it is assumed that all convective bands could be seeded in a given winter season and that a 50
percent increase was produced, the result would be a 25 percent increase in winter season

B-6
precipitation if we assume the convective bands would have contributed one half of the winter
season's rainfall. The two reports mentioned earlier (Thompson, et al., 1988 and Solak et al.,
1996) provided a more precise quantification of the optimal seeding increases that might be
expected at Juncal and Gibraltar Dams (i.e., 18-22%) from seeding convective bands.
As mentioned in Section 5.0, NAWC has conducted operational cloud seeding programs
for the Santa Barbara County Water Agency most rainy seasons from 1981 to the present.
NAWC recently completed an evaluation of the apparent seeding effects from this program. A
peer reviewed paper is currently being published in the Weather Modification Association’s
Journal of Weather Modification (Griffith, and Yorty, 2015). Interestingly, the average results
for Juncal and Gibraltar Dams were +19 to +21% quite similar to the calculated optimal seeding
increases of +18% to +22% contained in the Solak et al., 1996 study.
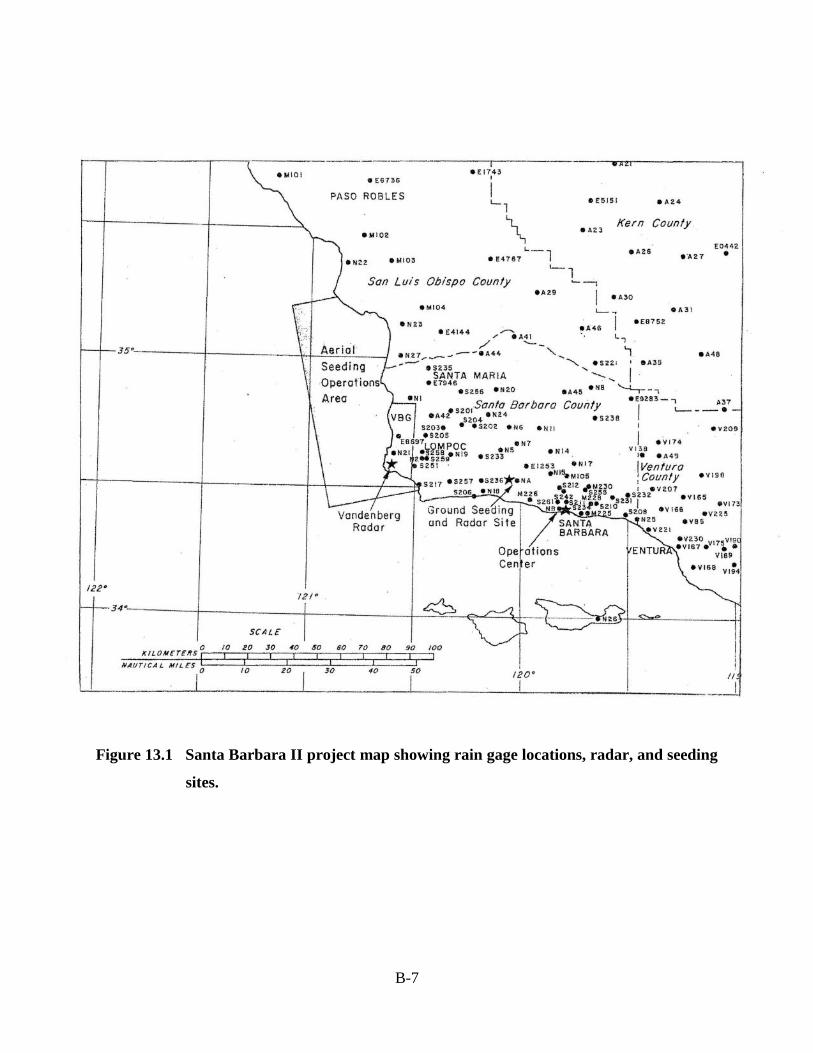
B-7
Figure 13.1 Santa Barbara II project map showing rain gage locations, radar, and seeding
sites.

B-8
Figure 13.2 Seeded/not-seeded ratios of band precipitation for Phase I ground
operations, 1967-71 seasons; 56 seeded and 51 not-seeded bands.
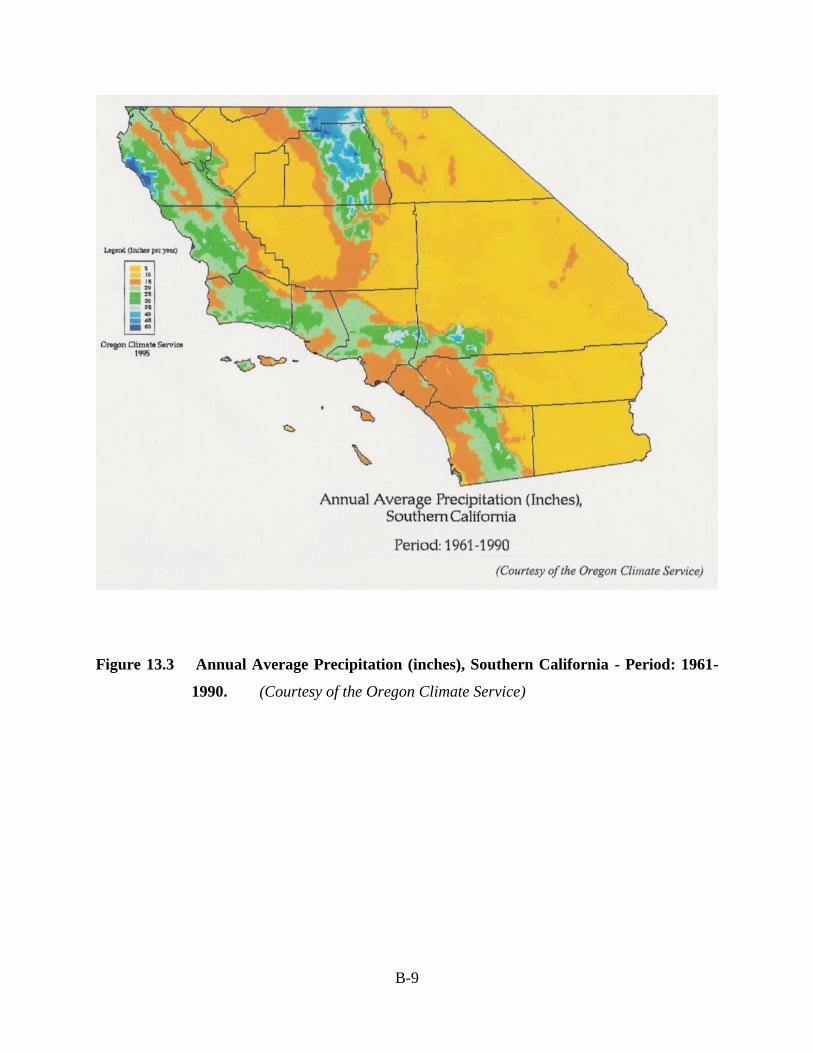
B-9
Figure 13.3 Annual Average Precipitation (inches), Southern California - Period: 1961-
1990. (Courtesy of the Oregon Climate Service)

B-10
Figure 13.4 Seeded/not-seeded ratios of band precipitation for Phase II aerial
operations, 1970-74 seasons; 18 seeded and 27 not-seeded bands.

B-11
Figure 13.5 Approximate percentage of winter precipitation occurring in convection
bands, 1970-74 seasons.
B-12
For illustration purposes, Figure 13.6 provides a sequence of six radar images of a
convection band as it moved into Santa Barbara County on April 11, 2010. The radar images are
from the Vandenberg AFB NEXRAD radar site. Table 13-1 provides 30-minue interval rainfall
values observed at Buellton during the passage of this convection band. The highest 15-minute
rainfall total (not shown in the table) was 0.35” between 1725 and 1740 PST during the passage
of the heaviest portion of the band, corresponding to the time period between the 2nd
and 3rd
images in the sequence. Very short duration rainfall rates peaked at close to 2”/hour equivalent
for a very brief period (5-10 minutes) around 1730. Rainfall rates then averaged around a
quarter inch per hour or less during the remainder of the event (after about 1800 PST).
Research conducted in Texas (Rosenfeld and Woodley, 1993; Rosenfeld and Woodley,
1997) and in Thailand (Woodley and Rosenfeld, 1999) has also indicated additional rainfall
being produced from silver iodide seeding of convective cloud elements. These increases appear
to occur due to increased duration of the seeded entities rather than increases in precipitation
intensity. These indications are in agreement with the results observed in the Santa Barbara II
research program.
In summary, earlier research conducted in Santa Barbara County indicated that
“convection bands” are a common feature of winter storms that impact Santa Barbara County
and that those bands contribute a significant proportion (~50%) of the area’s winter precipitation.
In addition, research has indicated that these bands contain supercooled liquid water droplets; the
target of most modern day cloud seeding activities (Elliott, 1962). Seeding these bands with
silver iodide either from the ground or air increases the amount of precipitation received at the
ground. These bands are typically oriented in some north to south fashion (e.g. northeast to
southwest, northwest to southeast, etc.) as they move from west to east. It is common to have at
least one convection band per winter storm with as many as three or four per storm being fairly
common. One band is usually associated with a cold front as it passes through the county.
Frequently these frontal bands are the strongest, longest lasting bands during the passage of a
storm. Other bands may occur in either pre-frontal or post-frontal situations. The duration of
these bands over a fixed location on the ground can vary from less than one hour to several hours
duration.

B-13
Figure 13.6 Frontal convection band passing over Santa Barbara County on
April 11, 2010
Table 13-1 Short Duration Rainfall Amounts at Orcutt
During Storm Event in Figure 13.6
Time Period
(PST)
1630 -
1700
1700 -
1730
1730-
1800
1800 -
1830
1830 -
1900
1900 -
1930
1930 -
2000
Precipitation (in) 0.03 0.26 0.35 0.12 0.10 0.12 0.02
13.3 Cloud Seeding Project Design Considerations

B-14
The field of weather modification is an interesting one. Both research and operational
programs have been conducted in the United States and a number of other countries dating back
to the 1950's. This field has generated its fair share of controversy. The scientific community is
still somewhat divided as to the efficacy of weather modification. The types of precipitation
augmentation programs that find the most scientific acceptance are the winter orographic
(mountainous) programs. The Santa Barbara program would be classified as orographic based
upon the coastal mountain setting of the target areas.
Several professional societies have adopted capability or position statements regarding
weather modification programs. The principal societies or associations that have existing
weather modification statements include:
The Weather Modification Association (WMA)
The American Meteorological Society (AMS)
The World Meteorological Organization (WMO)
The American Society of Civil Engineers (ASCE)
From the preceding organizational statements, the following key points regarding the
current status of winter orographic seeding emerge:
Of the primary categories of cloud seeding for precipitation increase; seeding of
winter orographic storm systems seems to offer the best prospects for increasing
precipitation in an economically viable manner.
Strong (albeit largely non-randomized) statistical evidence exists for (winter)
seasonal increases of the order of 5% to 15%.
A growing body of evidence from focused physical studies is confirming some
key steps in the weather modification process, in support of the statistical evidence.
Additional research is recommended/encouraged. It is recognized that (needed)
additional applied research can shed much valuable light on the physical processes
involved, leading to improved opportunity recognition and intervention, resulting in

B-15
more optimum augmentation operations, especially given technological
advancements in observational systems and computer modeling.
Accurately quantifying the effects of cloud seeding programs remains a challenge.
13.4 Proposed Program Design
It has always been NAWC’s philosophy that the design of our operational programs
should be based upon prior research programs that provided positive indications of increases in
precipitation, to the extent that the research results are considered to be representative of the
operational programs’ conditions (i.e., transferable results). The San Gabriel Mountains area has
a unique advantage in this regard since a well-funded winter research program was conducted
during the winters of 1967-1973 in near-by Santa Barbara County, with funding provided by the
Naval Weapons Center at China Lake, California (Section 5.2 discusses the design and the
results of this research program). This program was known as the Santa Barbara II research
program (an earlier research program, Santa Barbara I, was also conducted by NAWC). The
Santa Barbara II program focused on seeding convective bands embedded in naturally occurring
winter storms. The occurrence of convective bands and their importance in producing rainfall in
Santa Barbara County had been documented in an earlier study performed by NAWC (Elliott and
Hovind, 1964). These bands were found to be a common feature of winter coastal California
storms, which produced 50% or more of the precipitation that falls in the Santa Barbara area.
The bands also exhibited stronger upward vertical motions and higher supercooled liquid
water contents, characteristics which make them prime candidates for ice phase cloud
seeding. In fact, the storm regions on either side of these convective bands seem to offer
very limited seeding potential. The research in Santa Barbara II was conducted in two phases;
a single point ground seeding site using high output pyrotechnics (phase I) and airborne seeding
of the bands off the west coast of Santa Barbara County (phase II). A large array of rain gage
sites (168 gages) either already in place or installed for the program (Figure 5.1) was used to
evaluate the results of the seeding. The results were impressive and similar for the two
phases; the magnitude of the precipitation increase was of the order of 50-100% within the
seeded bands and 25-50% of the storm total! A number of the precipitation rain gage results
were statistically significant (i.e., they were very unlikely to be chance occurrences). A paper

B-16
(Griffith, et al, 2005) summarizes this research program as well as the follow-on operational
programs conducted in Santa Barbara County. We consider the methodology and potential
results from Santa Barbara II Phase I to be transferable to the proposed San Gabriel Mountains
project area. NAWC has often observed the passage of convection bands through the intended
San Gabriel Mountains target areas during previous winter seasons.
Even though the Santa Barbara research program was conducted approximately 37 years
ago, it is our professional opinion that it offers the most relevant information for the design of
precipitation enhancement programs for the southern California coastal areas at the present time.
There has not been any winter weather modification research programs conducted in
representative coastal areas of the United States since Santa Barbara II. This is a prime
example of technology transfer from research to operations. As further proof of the efficacy
of the application of the seeding design used on the Santa Barbara II research program to the
conduct of an operational cloud seeding program conducted in the same area since 1981, a recent
peer reviewed paper estimates the average seasonal seeding effects to range from +9% to +21%
(Griffith and Yorty, 2015).
Although both ground-based and airborne seeding modes were successfully tested in the
Santa Barbara II research program only ground based seeding equipment is proposed for this
program as specified in the RFP. Under different situations aircraft seeding would be desirable.
This program is unique in that: 1) seeding impacts are not desired in the Los Angeles Basin, 2)
lower-level winds during the more productive storm periods blow from the south through west
directions towards the north through east directions and 3) the very high volume of commercial
and general aviation air traffic within this area. These conditions render aircraft seeding
impractical. Seeding aircraft would need to fly upwind of the intended target areas to produce an
impact in these areas. This means the seeding aircraft would need to fly over the Los Angeles
Basin at low elevations (approximately 10,000 feet) which would be in direct conflict with the
landing and take-off corridors for several major airports in the area. Even if aircraft could
effectively fly in these areas, the public might well question whether some seeding impacts
would be occurring in the Los Angeles Basin. This would be a difficult question to answer
convincingly.

B-17
Therefore the primary seeding mode will be ground-based silver iodide generator
systems. Locations of the 15 sites listed as potential seeding sites in the Cloud Seeding Program
Report are shown in Figure 13.7. NAWC utilized all manually operated silver iodide generators
in the 2001-2002 program and in all prior seasons of operation. NAWC proposes (and as
requested in the RFP) to establish a total of ten sites for the 2015-2016 program; four remotely
controlled, ground-based silver iodide flare sites and six manually operated liquid fueled
generator sites.
Figure 13.7 Locations of the Fifteen Recommended Seeding Sites
13.4.1 Remotely Controlled Seeding Flare Sites

B-18
NAWC proposed the use of this type of remotely controlled flare unit for the 2001-2002
winter seeding program in the ongoing Santa Barbara County operational winter cloud seeding
program. NAWC was awarded that contract and, as had been proposed, had a customized design
prepared for these updated, remotely controlled units, referred to as Automated High Output
Ground Seeding Systems (AHOGS). Three units were subsequently fabricated and installed for
the 2001-2002 winter season. Three additional units were incrementally added to the network
during the period from 2002 through 2007. These sites can be remotely accessed and activated
on a 24/7 basis through a cell phone modem that uses a special Campbell Scientific
computer program customized for the project which is a password driven system. The flare
seeding system design was modified for the 2005-2006 project through the introduction of a
NAWC custom designed spark arrestor. These spark arrestors, which fit over each of the seeding
flares, were developed to assure that no large sparks or burning embers that could pose a fire
concern could be released from the flare burns. Normally, this would not be a concern since
flares are only burned when rain is occurring, thus eliminating any fire danger. These arrestors
were developed in case of an accidental misfire or at the beginning of a storm following an
extended dry spell. Figure 13.8 provides a photo of a site at with the spark arrestors installed.
Figure 13.9 shows the flares installed without the spark arrestors in place. Figure 13.10 shows
close-ups of a flare burning inside of a spark arrestor. Figure 13.11 provides a photo of the
interior of one of the control boxes. A one-page summary of the AHOGS characteristics and
primary components is provided in Table 13-2. It may be worth noting that to the best of our
knowledge, NAWC is the only U.S. firm that has routinely utilized the ground-based,
remotely operated flare technology in central or southern California to seed winter clouds.
The goal in the Santa Barbara program, which would also be the case in the re-start of the
modernized San Gabriel’s program, is focused on duplicating the highly successful seeding
technique used in the conduct of the Santa Barbara II, Phase I research program. Flares would
be ignited as convective bands pass over each of the seeding locations. Flares would be ignited
at approximately 15-minute intervals as the band passes over each site. In a convective regime,
the seeding material would then be entrained into the convection bands’ updraft/inflow areas and
lofted to the supercooled liquid water regions of the clouds where the precipitation formation
process is active.

B-19
NAWC initially used this ground-based pyrotechnic seeding approach in the operational
Santa Barbara program following the completion of the research program (1982-1985), but that
seeding mode was discontinued when the manufacture of high output flares (400 grams of silver
iodide each) was discontinued. Ice Crystal Engineering (ICE) of Fargo, North Dakota developed
and marketed a high output flare beginning in the late 1990’s, which again made this a viable
seeding approach. ICE manufactures a flare that weighs 150 grams and contains 15 grams of
seeding material. These flares are similar in appearance and burn characteristics to common
highway distress flares. Once ignited, the flares burn for approximately 4 minutes. The ICE
flares have been tested at the Cloud Simulation Laboratory located at Colorado State University
(CSU) to quantify their effectiveness in producing ice-forming nuclei. The flares have high
numbers of nuclei that are capable of producing ice crystals at warm temperatures (as warm as
-3.8C). This is a very desirable attribute since supercooled liquid water is often found at
relatively warm temperatures in winter clouds. The naturally occurring ice nuclei are relatively
inactive in these warmer temperature regimes. NAWC will use the ICE 150 gram burn in
place flares on this program. This is the same flare that NAWC has used for a number of years
on the Santa Barbara program (used both in ground units and on aircraft).

B-20
Figure 13.8 Remotely Operated Flare Site, Santa Barbara County 2014-2015 Program

B-21
Figure 13.9 Remote Flare Unit without Spark Arrestors Installed
Figure 13.10 Flare Burning with Spark Arrestor in Place

B-22
Figure 13.11 Interior View of the Electronics and Related Equipment,
Remotely Controlled Flare Unit

B-23
Table 13-2 General Specifications of an AHOGS Unit
Two flare masts, which hold a total of 32, fast-acting seeding flares.
Spark arrestors that enclose each flare.
An environmentally sealed control box containing a cellular phone communications
system, digital firing sequence relays/controller, data logger and system battery
(see Figure 13.11).
A solar panel/charge regulation system to maintain site power.
Cellular phone antenna.
Lightning protection.
NAWC proposes to incorporate some upgrades to the units being used on the Santa
Barbara program. These upgrades would include updated electronics components, an
updated computer program used to communicate with the sites, and the addition of a wide
angle video camera. Although the reliability of the AHOGS units used on the Santa Barbara
program has been quite high, we occasionally find upon visiting these sites that some flares have
not fired even though it appeared they had fired when communicating with the systems via the
internet. There can be three causes for flares not firing: 1) a bad flare (sometimes happens even
though flares are tested when they are placed into the flare trees), 2) some type of
communication failure with the site or 3) some type of intermittent electronic failure within the
on-site control units. Since no one is on site when the flares are requested to fire there is not a
clear indication that a flare has fired even though the remote indication is that the flare should
have fired. A solution we propose to address this occasional problem is to install a video camera
at each site. This camera would be activated when the meteorologist logs onto the site in
preparation to fire a flare or flares. The video output from the camera would be displayed
remotely such that the meteorologist can visually confirm that flares fire as programmed. If a
flare does not fire, the meteorologist can immediately program another flare to be fired.
The goal of producing ice nuclei by any method has always been to develop generation
systems that will begin to activate at or as near as possible to the freezing level since numerous

B-24
research programs have indicated the frequent occurrence of supercooled water droplets (the
targets of an ice phase seeding program) in approximately the range of 0 to –10C.
The flares are also fast acting; 90% of the total ice crystal formation occurred in 5 minutes in the
cloud chamber (DeMott, 1999). Both of these characteristics are very attractive for application
in the San Gabriel program. The goal of the original Santa Barbara II design was to nucleate as
many of the supercooled liquid water droplets in the lower levels of the convective bands as
possible. By definition supercooled liquid water droplets can occur at temperatures just slightly
less than freezing (i.e., starting just above the freezing level in-cloud). These flares ignited at
ground sites release particles that would enter the bases of the convective bands and the material
would nucleate quickly once it is carried by cloud updrafts through the -4C temperature level.
The convective elements of the convection bands provide along with the orographic lift produced
as the storm winds flow over the San Gabriel’s provide the need lift of the seeding particles.
The high-output flares used in the first phase of the Santa Barbara II research program
had the designation of LW-83. Figure 13.12 provides a graphical comparison of the ICE and the
LW 83 flares. This figure demonstrates that the ICE flare is more effective in the warmer
temperature regions of -4C to -10C. This temperature region is of prime importance to seeding
induced increases in precipitation because in that temperature range the nucleating activity of
natural ice forming nuclei is typically low. Freezing supercooled water droplets in the upper
(colder) portions of the bands may not necessarily contribute substantially to the production of
increased rainfall at the ground. The ICE flare is faster acting since it is operative by the
condensation-freezing mechanism (fast) whereas the LW-83 probably acted through contact
nucleation (a slower process).

B-25
Figure 13.12 Comparison of Nucleating Effectiveness of the LW-83
Versus the ICE Burn-in-Place Flare, CSU Cloud Chamber Results.
13.4.2 Manually Operated Silver Iodide Generators
NAWC proposes to install six manually operated silver iodide generators. Figure 13.13
provides photographs of one of these sites from the 2001-2002 program conducted for the
LACDPW. Figure 13.14 provides a cut-away view of one of these generators. An updated

B-26
seeding formulation will be utilized. Instead of using ammonium iodide as a complexing agent
to dissolve the silver iodide in acetone (as was done in the conduct of earlier programs for the
LACDPW), a combination of sodium iodide and para-dichlorobenzene will be used. This
mixture has been shown via cloud chamber tests to produce ice crystals in supercooled clouds
much faster than the ammonium iodide mixture. It appears that nucleation is accomplished
through a condensation freezing versus a contact nucleation process (Finnegan, 1999). This will
offer an advantage in seeding clouds over the target area, especially in the stronger wind cases.
Each generator will burn a 3% solution of the silver iodide mixture described above
dissolved in acetone. This solution will be burned in a propane flame at a rate that will release 25
grams of seeding material per hour (as requested in the RFP). Generators will be sited at
LACDPW facilities (e.g., debris basin locations were used for some of the earlier locations) if
possible. Each generator will be secured in-place using rebar rods driven into the ground. NAWC
will arrange for temporary employees to be available during storm periods to turn the generators
on or off at the LACDPW locations. It should be noted that due to the high cost of silver
iodide it is important for the reviewers of the proposals to verify that the cost proposals are
for a release rate of 25 grams per hour since lower release rates are often used on other
cloud seeding programs. In other words, insure an apples to apples comparison.

B-27
Figure 13.13 NAWC ground-based, silver iodide cloud-nucleating generator

B-28
Figure 13.14 Cut-away View of a NAWC Manually Operated Cloud Seeding Generator
B-29
13.4.3 Computer Modeling
One of the major questions in conducting a weather modification program is where and
when the seeding should be conducted in order to achieve proper targeting of seeding effects
within the intended target area. Past research programs have demonstrated that this has not
always been achieved with any consistency.
In recent rainy seasons NAWC has utilized specialized computer models in the conduct
of the Santa Barbara program. These models are of two basic types: 1) those that forecast a
variety of weather parameters useful in the conduct of the cloud seeding program (e.g. NAM or
WRF) and 2) those that predict the transport and diffusion of seeding materials (e.g., HYSPLIT).
In previous rainy seasons NAWC had used the standard National Oceanic and
Atmospheric Administration NOAA) atmospheric models: NAM (formerly ETA) and GFS in
forecasting “seedable” events and associated parameters of interest (e.g. temperatures, winds,
precipitation). NAWC continued to use the NAM and GFS models, especially for longer range
forecasts. A more sophisticated model was used for shorter range forecasts. This was the
Weather Research and Forecasting (WRF) model developed by the National Center for
Atmospheric Research (NCAR) and NOAA. Recently this model has shown considerable skill in
predicting precipitation, pressure fields, wind fields and a variety of other parameters of interest
in conducting the cloud seeding operations.
The GUIDE model (Rauber, et al, 1988) had been used for many years to predict the
transport and diffusion of seeding material and fallout of seeded precipitation. There has been
significant advancement in computer models that predict the transport and diffusion of particles
released either from the ground or aircraft since the GUIDE model was developed. NAWC
recognized that newer, more sophisticated computer models would provide more accurate
predictions than those produced by GUIDE. For example, the HYSPLIT model developed by
NOAA provides forecasts of the transport and diffusion of either ground or aerial releases of
some material, which in our case would be silver iodide seeding particles.
The WRF and HYSPILT models will be discussed separately in the following.
B-30
WRF Model
The Weather Research and Forecasting (WRF) Model is a next-generation mesoscale
numerical weather prediction system designed to serve both operational forecasting and
atmospheric research needs. It features multiple dynamical cores, a 3-dimensional variational
(3DVAR) data assimilation system, and a software architecture allowing for computational
parallelism and system extensibility. WRF is suitable for a broad spectrum of applications across
scales ranging from meters to thousands of kilometers.
The effort to develop WRF has been a collaborative partnership, principally among the
National Center for Atmospheric Research (NCAR), the National Oceanic and Atmospheric
Administration (the National Centers for Environmental Prediction (NCEP) and the Forecast
Systems Laboratory (FSL), the Air Force Weather Agency (AFWA), the Naval Research
Laboratory, the University of Oklahoma, and the Federal Aviation Administration (FAA). WRF
allows researchers the ability to conduct simulations reflecting either real data or idealized
configurations. WRF provides operational forecasting a model that is flexible and efficient
computationally, while offering the advances in physics, numerics, and data assimilation
contributed by the research community.
NAWC utilized NOAA’s Earth Systems Research Laboratory’s High Resolution Rapid
Refresh (HRRR) version of the WRF model during the 2014-2015 rainy season. This model has
a 3km grid spacing compared to the more standard grid model spacing of 13km (e.g. NAM
model), plus it is re-initialized every hour using the latest radar observations. The NAM and GFS
models are currently re-initialized every 6 hours. Hourly forecast outputs from the HRRR model
are available for a variety of parameters out to 15 hours. Table 13-3 provides a summary of some
of forecast parameters of interest in conducting the cloud seeding program.
Table 13-3 HRRR Forecast Parameters of Interest
Parameter Application
1km above ground Forecast of convection band locations based on radar returns 1km above

B-31
level reflectivity ground
Composite
reflectivity
Forecast of convection band locations using reflectivity values from
different scan elevations. This is useful when bands approach the radar
site since low elevation scans may go underneath the bands.
Maximum 1km above
ground level
reflectivity
Forecasts that pinpoints the location of the heart of the convection bands
1 hour accumulated
precipitation
Forecasts of radar derived estimates of precipitation reaching the ground
in a one-hour period (QPF).
Total accumulated
precipitation
Forecasts of radar derived estimates of precipitation reaching the ground
for a specified time period, for example 1-6 hours in the future (QPF).
850 mb winds Forecasts of the 850 mb (~4,000 feet) wind direction is useful in
determining if and when wind directions may go out of bounds in
regards to suspension criteria.(e.g., avoiding burn areas)
700mb temperature NAWC uses this level, which is ~10,000 feet, to indicate whether silver
iodide will activate. Temperatures< -50
C are desirable at this level
700mb vertical
velocity
Forecasts the strength of the upward or downward movement at ~the
10,000 foot level. Stronger updrafts favor transport of seeding material
to colder, more effective cloud regions.
Echo top height Forecasts of cloud echo tops. Can be useful in determining whether the
cloud tops are forecast to be cold enough for silver iodide to be effective
(~-50
C) and perhaps too cold <-250C to produce positive seeding
effects.
Figure 13.15 is a ten-hour forecast from the HRRR model of composite radar reflectivity
over the southwest valid at 1600 PDT, March 25, 2012. This model predicted a west-east
oriented convection band over Santa Barbara County associated with an upper closed low
located off the coast of Santa Barbara County. This HRRR forecast agrees well with the radar
image in Figure 13.16, which is the Vandenberg AFB PPI radar display valid at 1530 PDT
March 25th
. Figure 13.17 provides a ten-hour forecast of the one hour accumulated precipitation
over California valid from 1500-1600 PDT March 25, 2012. This forecast also seemed to verify,

B-32
for example, the HRRR forecast indicated approximately 0.10” of precipitation in the Sudden
Peak vicinity. Figure 13.18 provides hourly precipitation values from Sudden Peak, which
indicates 0.20” of precipitation fell from 1400-1500 PDT, about an hour earlier than forecast.
Examination of the rainfall at Santa Maria indicated that the band apparently rotated northward
with 0.11” from 1500-1600 PDT being observed there about an hour earlier than predicted;
(Figure 13.19). More comparisons like this, conducted in future seasons, will help determine
how well this model is performing. The precipitation that was forecast to occur over Santa
Barbara County during this period was associated with a convection band that did develop and
that was seeded from ~ 1400-1500 PDT.
Figure 13.15 HRRR Model ten-hour forecast of composite radar reflectivity,
valid at 1600 PDT on March 25, 2012
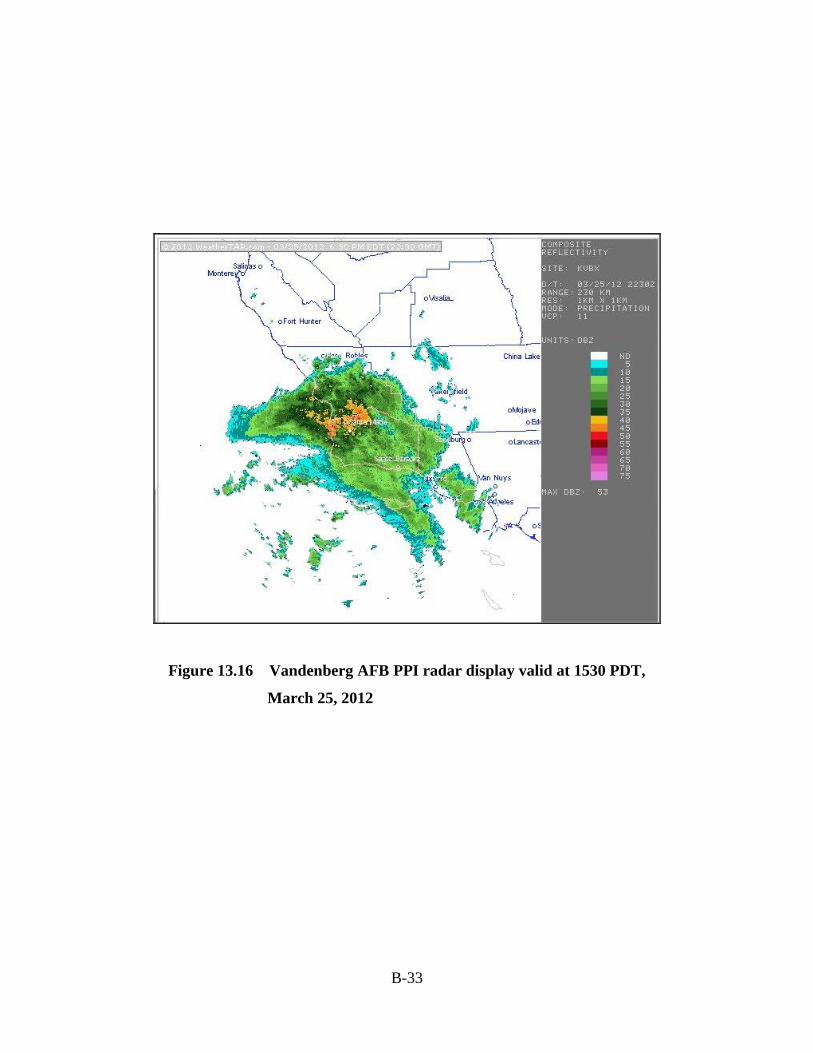
B-33
Figure 13.16 Vandenberg AFB PPI radar display valid at 1530 PDT,
March 25, 2012
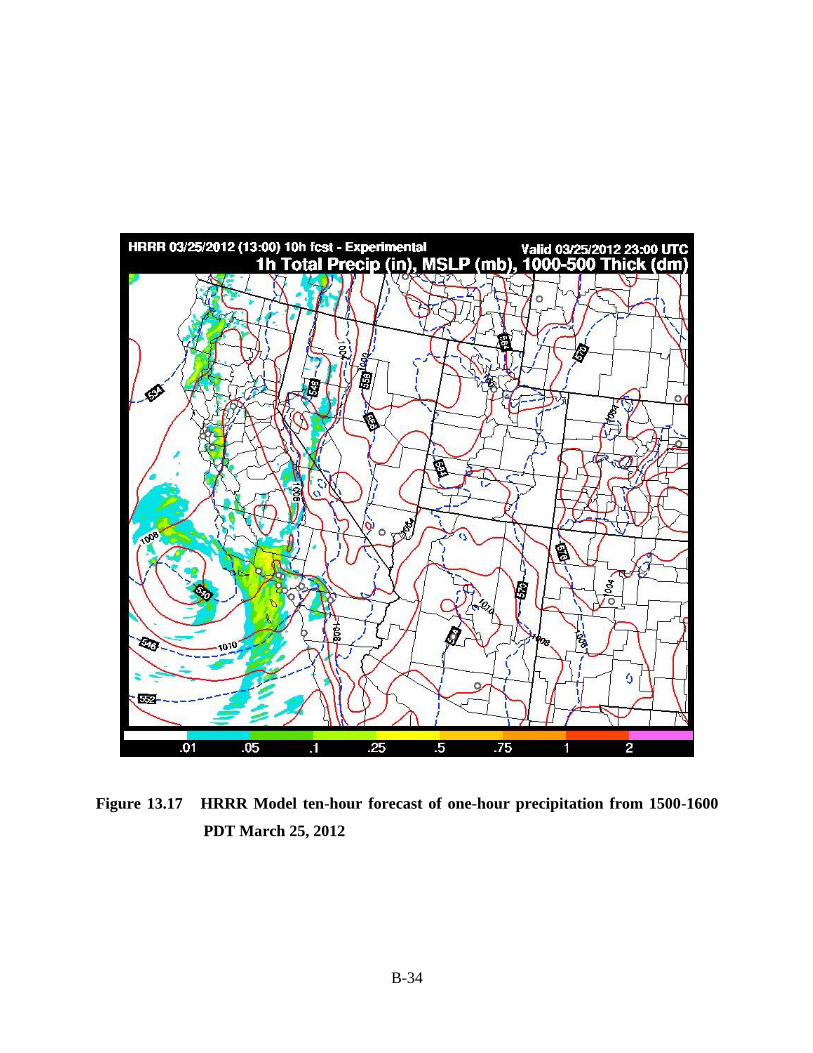
B-34
Figure 13.17 HRRR Model ten-hour forecast of one-hour precipitation from 1500-1600
PDT March 25, 2012

B-35
Figure 13.18 Observed hourly precipitation at Sudden Peak, March 25, 2012
Figure 13.19 Observed hourly precipitation at Santa Maria, March 25, 2012

B-36
HYSPLIT Model
The HYSPLIT (HYbrid Single-Particle Lagrangian Integrated Trajectory) model is the
newest version of a complete system for computing simple air parcel trajectories to complex
dispersion and deposition simulations. As a result of a joint effort between NOAA and
Australia's Bureau of Meteorology, the model has recently been upgraded. New features include
improved advection algorithms, updated stability and dispersion equations, a new graphical user
interface, and the option to include modules for chemical transformations. Without the additional
dispersion modules, HYSPLIT computes the advection of a single pollutant particle, or simply
its trajectory.
The dispersion of particles released into the atmosphere is calculated by assuming either
puff or particle dispersion. In the puff model, puffs expand until they exceed the size of the
meteorological grid cell (either horizontally or vertically) and then split into several new puffs,
each with its share of the pollutant mass. In the HYSPLIT particle model, a fixed number of
initial particles are advected about the model domain by the mean wind field and a turbulence
component. The model's default configuration assumes a puff distribution in the horizontal and
particle dispersion in the vertical direction. In this way, the greater accuracy of the vertical
dispersion parameterization of the particle model is combined with the advantage of having an
ever-expanding number of particles represent the pollutant distribution.
The model can be run interactively on the Web through the READY system on the
NOAA site, or the code executable and meteorological data can be downloaded to a Windows
PC. The Web version has been configured with some limitations to avoid computational
saturation of the web server. The registered PC version is complete with no computational
restrictions, except that the user must download the necessary meteorological data files. The
unregistered version is identical to the registered version except that it will not work with
forecast meteorology data files.

B-37
Figur
e 13.20 HYSPLIT output for Mt. Lospe, Harris Grade, Gaviota, West
Camino Cielo, and Gibraltar Road on April 7, 2015
NAWC has utilized the HYSPLIT model to predict the transport and diffusion of silver
iodide seeding material during storm situations in Santa Barbara County during the past four
seasons of operations. The model can also be run using archived NAM model data, which is
available back to 2007. Figure 13.20 provides a HYSPLIT model output for a seeded storm
event during the 2014-2015 winter season in Santa Barbara County.
The depictions provided in Figure 13.20 are of the transport of the seeding plumes. The
seeding material needs to interact with the convection bands, forming ice crystals which grow
into snowflakes which then fall to the ground changing into rain drop as they pass through the
freezing level. These processes occur as the band moves downwind in time. Consequently, these
depictions are of the initial transport and diffusion phase of the plumes while the resultant fallout

B-38
of augmented precipitation would occur downwind of these plume depictions (typically to the
east or northeast of these plume depictions).
13.4.4 Operations Center
NAWC proposes that all operations for this program be directed from our home office
located in Sandy, Utah (a suburb of Salt Lake City) or from NAWC meteorologists’ residences.
Our home office is equipped with multiple computers, telephones, and a fax. A variety of
weather products available via the internet will be utilized to direct the cloud seeding program.
These products will include: surface and upper-air observations, analyses and forecasts, weather
satellite information (both visible and infrared), weather radar and lighting information,
precipitation data and NWS watches and warnings. NAWC computers will also provide access to
the LACDPW’s ALERT precipitation and hydrologic data and will be updated, if necessary, to
accommodate any changes made in LACDPW computers as mentioned in the RFP. NAWC
routinely acquires special ALERT information in the conduct of the Santa Barbara cloud seeding
program. NAWC meteorologists have home computers that provide all of the capabilities found
in NAWC’s office.
13.4.5 Storm Operations
NAWC proposes to utilize similar procedures that evolved in the conduct of the previous
NAWC four-year project for LACDPW, plus updates based on insights gained via winter cloud
seeding research and operations conducted in Santa Barbara County. These procedures involved
weather forecasting of the magnitude and seedability of winter storms that were expected to
impact the target area. Typically storms expected to produce <0.50 inches of rain in the target
areas will not be seeded. The seedability of the approaching storms will be a function of wind
direction, atmospheric stability and temperatures. Lower level winds need to be blowing from
the south through west to avoid creating seeding impacts within the Los Angeles Basin.
Fortunately, these wind directions also produce the bulk of the precipitation in the target area.
The atmosphere needs to be neutral to unstable to allow the seeding material released from the
surface to be transported into the colder portions of the storm clouds in a timely fashion. The
temperatures need to be cold enough so that the silver iodide seeding material can reach its

B-39
activation temperature (-4C) quickly. These seedability factors can be examined based upon the
surface and upper-level observations (i.e. rawinsonde observations) and atmospheric model
forecasts.
The seedability issue is vitally important to the potential for success in conduct of seeding
operations in this area. Beyond identification of the best-suited cloud structures, as discussed in
an earlier section, atmospheric stability and seeding material targeting and trajectories are
crucial. Data are available from widely spaced routine balloon soundings twice daily, at fixed
12-hour intervals. Balloon release sites at Vandenberg AFB, Edwards AFB and San Diego
bracket the project area. The data can be useful, but suffer from coarse time resolution, being
twice-daily snapshots. The variability of the winds as a function of height can be considerable
and can evolve significantly with time. More detailed wind data are now available from National
Weather Service NEXRAD radars. The HRRR model and NAM model have the capability of
predicting rawinsonde profiles at selected locations which can be used to assess the presence of
lower-level stable layers.
13.4.6 Communications
Seeding operations will be coordinated appropriately with LACDPW personnel. As
requested in the RFP, NAWC meteorologists will make recommendations to designated
LACDPW personnel regarding potential seeding operations, including indication of which
seeding systems would be turned on or off. NAWC will inform LACDPW’s personnel of all
significant events relative to the project.
13.4.7 Suspension Criteria
The proposed seeding suspension criteria are provided in Table 13-4.
Suspension of seeding may be necessary under the following circumstances:
Table 13-4 Proposed Suspension Criteria

B-40
1. Dam Operations: Cloud seeding operations for an upcoming storm, and any succeeding
storm, may be suspended if reservoir storage is at a level where additional inflow to the
reservoir may result in water being released at rates greater than the capacity of the
downstream water conservation facilities. This would result in loss of water to the ocean.
Additionally, determination that ongoing reservoir reconstruction efforts are being
significantly impaired by increased watershed inflow may be a reason for suspension.
Cloud seeding may resume when the probability of water loss to the ocean is reduced or
risks to dam maintenance and construction activities are mitigated.
2. Precipitation: Precipitation rates in excess of 0.75" per hour. Any storm forecast to
produce over 2.0 inches of rainfall within a 24-hour period within any of the target areas.
3. Weather Watch: Whenever the National Weather Service issues a severe weather or
flash flood warning affecting any of the target areas; cloud seeding operations may be
suspended.
4. Fire Damage: To prevent undue erosion, mudflow hazards, or flooding downstream of
an area that has been burned prior to or during a storm season, seeding activities may be
suspended for the remainder of the storm season. The suspension will continue until
natural re-vegetation occurs to mitigate excessive sediment flows during storms
5. Earthquake Damage: Depending on the intensity and distance from the epicenter of an
earthquake, prior to or during a storm season, the soil structure in the target areas could
be disturbed creating the potential for damaging landslides and mudflows during periods
of moderate to heavy rainfall. If these conditions exist in the target areas, cloud seeding
in the affected area may be suspended for the remainder of the storm season. Public
Works geology, geo-technical, and sedimentation personnel will analyze the impact on
sediment transport and decide when cloud seeding may be resumed in that area.
6. Special conditions such as significant construction activities, search and rescue
operation, holiday times when public use is higher than normal, and special events such as
bicycle races or large public gatherings.

B-41
7. Operations that are predicted to have an impact within the Los Angeles Basin.
8. Other special circumstances that the Operations Director or NAWC's Project
Meteorologist deem unsafe.
13.4.8 Installation, Operations, Maintenance and Removal of Equipment
NAWC shall be responsible for the site selection, installation, operation, maintenance
and removal of all equipment necessary to perform this work. The installation, maintenance and
removal of the equipment will be performed by NAWC personnel including the project
meteorologist and assisted by a part-time technician. The remotely operated AHOGS flare sites
may be left in place during the summer months minus the electronics box and the flares would be
removed at the end of the program operations each spring. The manual generators would be
removed for the off-season but the propane tanks would be left in place.
13.5 Cloud Seeding Program Evaluation
There is perhaps an important item not addressed in the RFP. This item is the question
whether some methodology should be proposed to provide some means to attempt to estimate the
effects of cloud seeding. In Section 5.4 of this proposal, NAWC discussed two earlier
evaluations that were applied to earlier NAWC seeding programs in this area. One was based on
streamflow measurements which is no longer possible since an important historical control
stream gage site was discontinued.
However, NAWC’s final report on this program covering the 2001-2002 winter season
(Griffith, et al, 2002) contained an historical target/control precipitation evaluation. This report
provided an estimate of cloud seeding for a seven-year period (1992, 1993, 1997, 1999-2002).
This analysis indicated an average 10% increase in December-March precipitation in the target
areas. This was equivalent to an average annual target area increase in precipitation of 2.28
inches. The two target sites used in this evaluation were Cogswell Dam and Mt. Wilson.
NAWC offers as an option to LACDPW to investigate the possible update of this

B-42
technique to provide a means of estimating the apparent effects of cloud seeding programs
possibly conducted over the next five years. This evaluation contained nine historical seasons
without seeding on which the regression equation was based. There have been a number of
unseeded seasons since 2002. NAWC proposes to add the recent unseeded seasons to the earlier
nine unseeded seasons and then calculate new linear and multiple linear regression equations.
These equations would then be used in future seeded seasons to estimate the seeding effects. The
cost of this optional work would be $10,000.
13.6 Scheduling of Work
Mr. Don Griffith, NAWC’s President and Mr. Mark Solak, NAWC’s Vice-President
attended the required Proposer’s Conference held at LACDPW’s offices in Alhambra on June 2,
2015. One of the more important items of information that came out of this conference dealt with
scheduling issues. It is our understanding that LACDPW should be able to evaluate proposals,
select a potential contractor and negotiate a contract with the contractor in approximately one
months’ time after the proposals are submitted on June 17th
(e.g. mid-July). It is also our
understanding that it would then take ten weeks to get this contract on a Los Angeles County
Board of Supervisors agenda for approval. Assuming the Board of Supervisors approves this
contract, the Contractor is given a notification to begin work shortly after the Board meeting;
probably mid-September. This timing translates into perhaps only one month of time for the
Contractor to complete the various tasks in the Scope of Work and have the program operational
by October 15th
. This timing appears questionable. To give an example, Task A requires the
Contractor to review and modify the earlier 2009 Cloud Seeding Program Report. No time is
estimated on how long the Contractor would be expected to complete a draft report. The
LACDPW is then given four weeks to review the draft and return comments. “All comments
shall then be incorporated, finalized and delivered to Public Works within three weeks for
approval. Approval of the updated report is required prior to its implementation.” If we assume
the Contractor can conduct site visits and complete a draft report in three weeks then install the
seeding equipment and bring the program to operational status in three weeks, the math is as
follows: Two weeks to complete draft report, four weeks for LACDPW to review report and
provide comments, three weeks for Contractor to revise report, three weeks to install equipment
and bring project to operational status equals twelve weeks! Time to fabricate the four remotely

B-43
controlled flare units is not included in the above. This may require approximately four weeks.
This part of the process could be shortened if LADPW were to authorize the Contractor to
conduct the site surveys and begin fabrication of these units once the Board of Supervisors
approves the contract (e.g. mid-September). In this manner, fabrication and testing of the units
could be conducted in parallel with the modifications and acceptance of the revised report.
NAWC is attempting to be flexible in our proposal, recognizing the apparent interest at
the Board of Supervisors level as well as the LACDPW level. This interest is obviously at least
partially attributable to the extreme drought currently impacting a majority of California. Last
winter was the fourth below normal winter in southern California in terms of precipitation. This
on-going drought has had significant impacts on agriculture in the state and resulted in
mandatory reductions of 25% applied to other water users in the state as mandated by Governor
Brown.
13.7 Exception
The RFP calls for monthly coordination meetings during each contractual period. Since
NAWC’s headquarters are located in Sandy, Utah and most of the work will be conducted from
this location, NAWC requests that these monthly coordination meetings be held via conference
calls. NAWC personnel can attend special meetings at the LACDPW’s offices as needed.
NAWC personnel could travel from Utah to attend special meetings at the LACDPW’s offices if
requested.
References
Thompson, J.R., K.J. Brown and R.D. Elliott, 1975: Santa Barbara Convective Band Seeding
Test Program. Final Report published by the Naval Weapons Center, China Lake, California.
Griffith, D.A., M.E. Solak, R.B. Almy and D. Gibbs, 2005: The Santa Barbara Cloud Seeding
Project in Coastal Southern California, Summary of Results and Their Implications. WMA
Journal of Weather Modification, pp. 21-27.

APPENDIX C
SANTA BARBARA II 700 MB WINDS DURING CONVECTIVE BANDS

Santa Barbara Wind Data and Averages for Convective
Bands
Dir Speed (kts) Dir Speed (kts) Dir Speed (kts)
230 33 210 35 229 24
230 33 215 23 216 33
230 35 275 20 190 46
230 35 260 12 200 42
240 35 230 41 260 22
260 35 240 39 270 29
170 15 215 48 270 41
230 24 222 45 260 43
230 30 225 45 260 43
240 25 240 33 162 43
260 25 200 52 265 32
270 26 210 62 155 35
270 25 215 54 175 22
280 25 245 37 190 35
240 31 240 37 212 30
240 32 235 37 155 23
220 28 235 35 210 22
250 39 203 13 225 20
245 30 235 39 250 18
260 29 220 43 220 52
270 30 235 15 260 30
270 32 235 37 251 40
285 42 240 44 265 38
275 57 220 44 230 42
270 35 195 45 210 37
275 44 215 55 193 54
260 45 220 51 202 56
240 36 230 54 240 43
220 54 160 21 256 49
225 24 190 44 199 8
240 46 195 37 197 33
240 39 238 35 210 35
C-1

Dir Speed (kts) Dir
Speed
(kts) Dir
Speed
(kts)
210 35 225 28 245 21
257 45 235 32 280 24
264 34 235 32 252 31
260 25 235 34 255 28
258 33 235 27 255 28
188 22 230 27 207 44
200 12 226 28 213 33
258 48 270 30 225 44
223 22 255 35 230 40
223 22 268 38 215 45
207 60 268 38 217 38
225 38 268 41 240 38
241 32 265 33 225 37
228 48 260 58 192 46
225 43 273 46 200 44
225 43 243 26 286 38
209 44 250 35 241 42
260 27 205 28 236 36
270 43 210 50 239 47
268 54 275 44 230 44
280 44 230 17 225 26
275 30 228 25
270 33 255 26 Average:
270 33 240 28 234 36
225 27 230 40
226 31 265 32
225 30 220 40
237 43 230 46
230 40 227 44
210 36 181 38
225 30 226 23
221 34 240 36
Santa Barbara Wind Data and Averages for Convective Bands (Continued).
C-2