north atlantic oscillatiodannular mode: two paradigms-one
TRANSCRIPT

Q U A R T E R L Y J O U R N A L
R O Y A L OF T H E
M E T E O R O L O G I C A L S O C I E T Y
Vol. 126 APRIL 2000 Part A No. 564
Q. J. R. Meteorol. SOC. (2000), 126, pp. 791-805
North Atlantic Oscillatiodannular mode: Two paradigms-one phenomenon By JOHN M. WALLACE*
University of Washington. USA
(Received 20 October 1999; revised 22 November 1999) (Symons Memorial Lecture: delivered 19 May 1999)
SUMMARY The North Atlantic Oscillation (NAO), as defined in the studies of Sir Gilbert Walker cu. 1930, and the zonal-
index cycle, as elaborated by investigators at the Massachusetts Institute of Technology some twenty years later, are different interpretations of the same entity, whose time variations are well represented by the leading principal component of the northern hemisphere sea-level pressure field. The NAO paradigm envisions this phenomenon as involving a unique teleconnection pattern in the Atlantic sector that varies on interannual and longer time-scales in association with large-scale atmosphere-ean interaction. In contrast, the zonal-index-cycle paradigm posits the existence of independent, fundamentally zonally symmetric (or ‘annular’) modes of variability in the northern and southern hemispheres, both of which fluctuate on intraseasonal as well as interannual time-scales. Spontaneous interactions between the zonally symmetric flow and the eddies are viewed as being largely responsible for the variability of the annular modes at the higher frequencies, and a variety of different mechanisms including, but by no means limited to, atmosphere-ocean interaction are viewed as potentially capable of forcing them at the lower frequencies. The NAO and ‘annular mode’ paradigms offer contradictory interpretations of the causal linkages that are responsible for the observed correlations between North Atlantic climate variability and variations in a diverse array of zonally averaged quantities. They suggest different research agendas and they evoke quite different images in the popular press. It is argued that the two paradigms cannot be equally valid and that it is in the interests of the community to come to a consensus as to which of them is more appropriate. Rules of evidence are proposed as a basis for making that decision.
KEY WORDS: Atmospheric dynamics Teleconnections Zonal-index cycle
1. INTRODUCTION
A century-long search for order in low-frequency atmospheric and oceanic variabil- ity has yielded a diverse and sometimes confusing array of ‘oscillations’, ‘modes’, and ‘teleconnection patterns’, many of which are linearly dependent in space and time. The object of this ongoing search is a limited set of what I will refer to as ‘dynamical modes’ in the anomaly fields of primary climatic variables (notably, pressure, temperature and rainfall) whose polarity and amplitude can be shown to vary in a more rational and potentially predictable way than those of climatic anomalies at individual stations, or the amplitudes of spherical harmonics fitted to anomaly fields. Dynamical modes are the imprints of fundamental processes such as instabilities of the climatological-mean flow, large-scale atmosphere-ocean interaction, or interactions between the climatological- mean flow and the transients.
The spatial pattern associated with what is arguably the most important northern hemisphere dynamical mode is undergoing something of an identity crisis. In the guise of the North Atlantic Oscillation (NAO), a name that evokes the notion of an oceanic * Corresponding address: Joint Institute for the Study of the Atmosphere and Ocean, University of Washington, Box 354235, Seattle, WA 98195-4235, USA.
79 1

792 J . M . WALLACE
or coupled atmosphere+xean mode, this pattern has long been recognized as a major player in winter-to-winter climate variability over Europe and eastern North America (van Loon and Rogers 1978; Hurrell 1995; Hurrell and van Loon 1997). The same pattern has recently come to be recognized as the tropospheric signature of the primary mode of variability of the wintertime stratospheric circulation (Perlwitz and Graf 1995; Kodera et al. 1996; Kitoh et al. 1996) and as bearing a remarkably strong resemblance to the pronounced wintertime climatic trends of the past 30 years (Hurrell 1995, 1996; Graf et al. 1995; Kodera and Koide 1997; Thompson and Wallace 1998; Thompson et al. 2000). Thompson and Wallace (1998, 2000), Gong and Wang (1999), and Thompson et al. (2000) draw attention to the prominence of the zonally symmetric component of this pattern and to its remarkable resemblance to the leading mode of variability of the extratropical southern hemisphere circulation. These new findings have elicited different reactions in different parts of the community. Some hail them as revealing the identity of a northern hemisphere ‘annular mode’ (NAM) that transcends the NAO and the regional atmosphere/ocean focus implied by that name, while others believe that the NAO paradigm can be easily adapted to incorporate them.
This article offers a perspective on the NAO/NAM controversy and suggests nu- merical experiments that might be performed to resolve it. The next section traces the historical development of these two contrasting paradigms. Section 3 offers examples illustrating some of the consequences of the choice of paradigm, and the final section proposes a series of numerical experiments that could be performed to expose and, hope- fully, resolve the dynamical issues involved in the choice of paradigm.
2. T W O PARADIGMS-ONE PHENOMENON
The mode in question was first identified in a series of studies by Sir Gilbert Walker, culminating in the landmark paper of Walker and Bliss (1932, hereafter referred to as WB). In his global search for predictors of Indian monsoon rainfall, Walker noticed that time series of wintertime-mean sea-level pressure (SLP) and surface air temperature (SAT) time series at an array of widely dispersed stations in eastern North America and Europe were strongly correlated with each other. He hypothesized that these strong correlations are a reflection of a preferred mode of planetary-scale fluctuations that he referred to as the NAO.
In order to describe the spatial pattern and time history of the NAO, WB generated a ‘first guess’ index comprised of a weighted average of what Walker considered to be a representative selection of these highly correlated SLP and SAT time series, where the weights were discretized as described in Table 1. The corresponding spatial patterns for SLP and SAT were obtained by correlating this trial index with each of the station time series. A ‘second guess’ index was then generated by replacing the original weights by these correlation coefficients and discretizing them. The process was then repeated with the second-guess index to generate a third index, and so on until successive iterations converged. The final station weights and the correlation coefficients between the index and each of the stations are shown in Table 1. Based on this same methodology, WB also identified what they referred to as the North Pacific Oscillation (NPO), which has proven to be less important than the NAO, as well as their most celebrated mode, the Southern Oscillation (SO).
Apart from the discretization, the analysis procedure employed by WB is essentially equivalent to empirical orthogonal function (EOF) analysis based on the temporal correlation matrix for their prescribed multivariate set of station time series. We have verified that this is, in fact, the case by comparing WB’s NAO and NPO indices with the

NORTH ATLANTIC OSCILLATIONlANNULAR MODE 793
TABLE 1. SPECIFICS OF THE DECEMBER-FEBRUARY NORTH ATLANTIC OSCILLATION (NAO) INDEX AS PRE-
SENTED B Y WALKER AND BLISS (1932)
Weight Correlation
Vienna p 1 .O 0.76 Stornoway T I .o 0.84 Bod0 T 1 .o 0.86 Stykkisholm p -1.0 -0.80 Ivigtut p -1.0 -0.84 Bermuda p 0.7 0.66 1/2 (Hatteras T + Washington T ) 0.7 0.72 Godthaab T -0.7 -0.70
The first column shows the weights the time series were. as- signed in the index and the second column shows the temporal correlations between the station time series and the NAO index. p denotes sea-level pressure and T denotes surface air temper- ature.
leading principal components of the respective correlation matrices for their component time series. The correlation coefficients, based on the period 1950-94, are 0.99 and 0.94, respectively. Hence, the only really subjective element in the procedure employed by WB was in the choice of station time series used to represent the NAO, NPO and SO in their analysis.
Figure 1 shows the wintertime (December to February) SLP correlation pattern associated with the NAO as published by WE3 together with an updated representation of the same pattern. The updated version is based on an NAO index constructed for the period of record 1950-94 by applying the weights for the locations in Table 1 to the nearest grid points in the UKMO* SLP analyses (Basnett and Parker 1997) and the University of East Anglia SAT analyses (Jones 1994). The remarkable similarity between the two representations attests to the robustness of both the pattern and the analysis scheme. The most pronounced differences in appearance are over the Arctic, which was not represented in WB’s analysis. Note that the Arctic data have no influence on our ‘updated NAO index’ as such: they only serve to fill in the correlation pattern and make it more fully hemispheric. Nonetheless, there is a notable difference in the appearance of the patterns. The prominence of the Arctic is even more apparent when the correlation pattern for the updated index is mapped in a polar stereographic projection (Fig. 2, upper left panel).
Most modem representations of WB’s NAO fall into two categories: those that simplify the original formulation by reducing it to just a pair of station time series, and those derived from objective analysis of gridded SLP datasets.
The most popular simplified station-based indices are those that represent the meridional SLP gradient and the strength of the surface westerlies across the North Atlantic sector. Data for Iceland are used to represent the higher latitudes, and the Azores or Portugal (depending upon the season) to represent the lower latitudes. Bjerknes (1964) used the difference in raw SLP, which yields the mean surface geostrophic zonal wind speed in the intervening latitude belt, whereas Rogers (1 984) and Hurrell (1995) used the difference in standardized SLP in order to reduce the dominance of the Iceland station. An alternative approach employed by van Loon and Rogers (1978) was to represent the NAO in terms of the east-west contrast in the SAT anomalies across the subpolar North Atlantic using station data for Olso, Norway and Jakobshavn, Greenland.
* United Kingdom Meteorological Office.

794 J. M. WALLACE
Figure I. Correlation maps for December to February seasonal-mean sea-level pressure (SLP) based on the North Atlantic Oscillation (NAO) of Walker and Bliss (1932). (a) A reproduction of chart 2 from their paper: contour interval 60. (b) The same analysis for 1950-94 based on gridded United Kingdom Meteorological Office SLP (Basnett and Parker 1997). See text for further details. Contour interval 30, negative contours are dashed, and
the zero contour is bold.
Figure 2. Correlation maps for the indices listed in Table 2 based on (upper panels) seasonal-mean and (lower panels) monthly December-March United Kingdom Meteorological Office sea-level pressure data (Basnett and Parker 1997) for the period of record 1950-94. Contour interval 0.15, negative contours are dashed, and the zero
contour is bold.

NORTH ATLANTIC OSCILLATION/ANNULAR MODE 795
TABLE 2. MATRIX OF CORRELATIONS BETWEEN VARIOUS INDICES OF THE NORTH ATLANTIC OSCIL- LATlONlANNULAR MODE PHENOMENON BASED ON SEASONAL-MEAN DECEMBER-MARCH DATA FOR THE
PERIOD OF RECORD 1950-94 WB P - I N - G PCI U55 p45
WB - 0.74 0.59 0.86 0.79 0.83 P - I - 0.37 0.83 0.87 0.83 N - G - 0.37 0.32 0.35 PCI - 0.95 0.97 u55 - 0.98
- P45
WB refers to the Walker and Bliss index, whose weights are listed in Table I ; P - I is the difference between Portugal and Iceland standardized sea-level pressure (SLP); N - G is the difference between Norway and Greenland surface air temperature (SAT); PCI is the leading principal component of the monthly December-February SLP field poleward of 20"N; U55 is zonally averaged zonal wind in the 50-60"N latitude belt; and p45 is the polar pressure deficit, i.e. the zonally averaged SLP on 45'N minus SLP averaged over the polar-cap region poleward of 45'N. SLP is based on United Kingdom Meteorological Office data (Basnett and Parker 1997) and SAT on University of East Anglia data (Jones 1994).
Correlation patterns for these two indices are shown in Fig. 2 and statistics for them are included in Table 2. The SLP-based index captures WB's pattern remarkably well, whereas the temperature index, being based on an east-west difference, tends to accentuate the features in the Atlantic sector, yielding a slightly more sectoral pattern with a weaker zonally symmetric component. The latter index is not very strongly correlated with the other indices in Table 2.
Kutzbach (1 970), Trenberth and Paolino (198 l), Wallace and Gutzler (198 l), Thompson and Wallace (1 998), among others, used principal component (PC) analysis as an objective method of determining the dominant patterns of variability in the SLP field. Regardless of whether a monthly or seasonal sampling interval is used, the leading mode recovered from this analysis is well separated from the succeeding ones and can therefore be considered reliable. The correlation pattern for the leading PC based on monthly (December-March) data, shown in the lower left panel of Fig. 2, is very similar to WB's NAO. It is evident from Table 2 that this PC is more strongly correlated with WB's NAO than the index based on Portugal and Iceland SLP.
An arguably similar phenomenon was discovered by Rossby and collaborators at the Massachusetts Institute of Technology (MIT) during the 1940s, using an entirely different research approach. Following Rossby (1939), these studies were based on the premise that the low-frequency variability of the atmospheric general circulation can be more clearly understood by dividing it into zonally symmetric and eddy (or stationary- wave) components. What distinguishes this particular group of studies from others in the general-circulation literature is the fact that the variations in the zonally symmetric component were represented in terms of a single mode that they referred to as the 'zonal-index cycle'. In most of these early MIT studies, the zonal-index cycle was envisioned as characterizing variations in the strength of the mid-latitude (35-55"N) surface westerlies. However, in a few of the papers that were written just before the concept of a zonal-index cycle fell out of favour, it appears in a different form. Based on his experience as a synoptic meteorologist, Namias (1950) became convinced that

796 J . M. WALLACE
TABLE 3. A S IN TABLE 2, BUT THE STATION-BASED INDICES W B , P - I AND N - G ARE REPLACED BY OP- TIMAL INDICES DERIVED FROM THE HEMISPHERIC SEA- LEVEL PRESSURE (SLP) FIELD, IN WHICH THE WEIGHT ASSIGNED TO EACH GRID POINT IS LINEARLY PROPOR- TIONAL TO THE CORRELATION COEFFICIENT BETWEEN SLP AT THAT GRID POINT AND THE STATION-BASED IN-
DEX
WB P - I N-G PCI U55 p45
WB - 0.97 0.98 0.99 0.94 0.97 P - I - 0.92 0.97 0.94 0.94 N - G - 0.98 0.92 0.96 PCI - 0.95 0.97 u55 - 0.98
- P45
the principal mode of variability of the zonal flow involves not so much the variations in overall strength of the surface westerlies as the meridional shifting of the belt of strongest westerlies. He defined a 'high zonal-index' circulation as being characterized by a poleward displacement of the zonally averaged surface westerlies toward subpolar latitudes, and a 'low-index circulation' by a southward displacement toward subtropical latitudes. Hence, while Rossby's original index is commonly represented by the zonally averaged SLP difference between 55'N and 35"N, Namias's (1950) zonal index would be more appropriately represented by the surface zonal wind difference between 55"N and 35"N.
Although it is not expressed as overtly as in those papers, a similar recasting of Rossby's zonal-index cycle is implicit in the studies of Lorenz (1951) and Gates (1950). On the basis of a thorough examination of correlation statistics for zonally averaged SLP and zonal wind perturbations on all possible pairs of latitude circles, Lorenz concluded that the zonal wind on 55"N represents the principal mode of variability of the zonally symmetric flow at the earth's surface about as well as any of the more complicated indices that he considered. As the basis for an extensive series of correlation maps, Gates employed an index that he referred to as the 'polar pressure deficit', the zonally averaged SLP on the 45"N latitude circle minus the SLP averaged over the polar-cap region poleward of 45"N. Correlation maps for monthly mean SLP based on Lorenz's and Gates's indices for December-March are shown in Fig. 2. The similarity between these patterns and the one based on the NAO index of WB is quite striking, as are the correlations between the indices themselves (Table 2). These indices are virtually identical to one another and to the leading PC of the SLP field. It follows that the PC time series can be regarded as an index of the zonal-index cycle or, as I will refer to it, the northern hemisphere annular mode.
The patterns in Fig. 2 are more similar to each other than might have been expected, given the modest strength of some of the correlations between the indices in Table 2. The correlations are relatively low because, unlike PCs, the simple station-based indices are not optimal representations of the time-dependent behaviour of their own associated spatial patterns. These indices are based on data for only a few stations, whereas the optimal representations (like PCs) are derived by projecting the full hemispheric seasonal-mean SLP fields onto their spatial correlation patterns in the upper panels of Fig. 2. The correlations based on these optimal indices, shown in Table 3, are much higher than their counterparts in Table 2. For example, the optimal index derived from Portugal minus Iceland standardized SLP is correlated with the leading PC of the

NORTH ATLANTIC OSCILLATIONlANNULAR MODE 197
hemispheric SLP field at a level of 0.97, compared with 0.83 for the original station- based index. Hence, the PC provides a much more faithful representation of the time- dependent behaviour of the spatial pattern derived from the Portugal minus Iceland standardized SLP index than the index itself does, and the same is true of the Norway minus Greenland SAT index. Hence, the NAO can be regarded as distinct from the annular mode only if it is defined strictly in terms of a particular station-based index, rather than by the corresponding correlation or regression pattern in the SLP field.
The time series listed in Table 2 are not the only ones that have been used to represent the NAO/annular mode phenomenon. Other indices include rotated EOFs of the mid-tropospheric geopotential-height field (Barnston and Livezey 1987; Kushnir and Wallace 1987) and the 200 hPa stream-function field (DeWeaver and Nigam 2000), the leading mode of a multi-level (1000-50 hPa) EOF analysis of the geopotential-height field (Baldwin and Dunkerton 1999), and projections of monthly hemispheric SAT and precipitation fields upon the leading PC of the SLP field (Fig. 1 of Thompson et al. 2000). Indices based on zonally averaged data include the 500 hPa geostrophic zonal- wind difference between 55 and 35"N (Ting et al. 1996) and the leading PC of the multi-level (1000-50 hPa) geopotential-height and zonal-wind fields (Thompson and Wallace 2000).
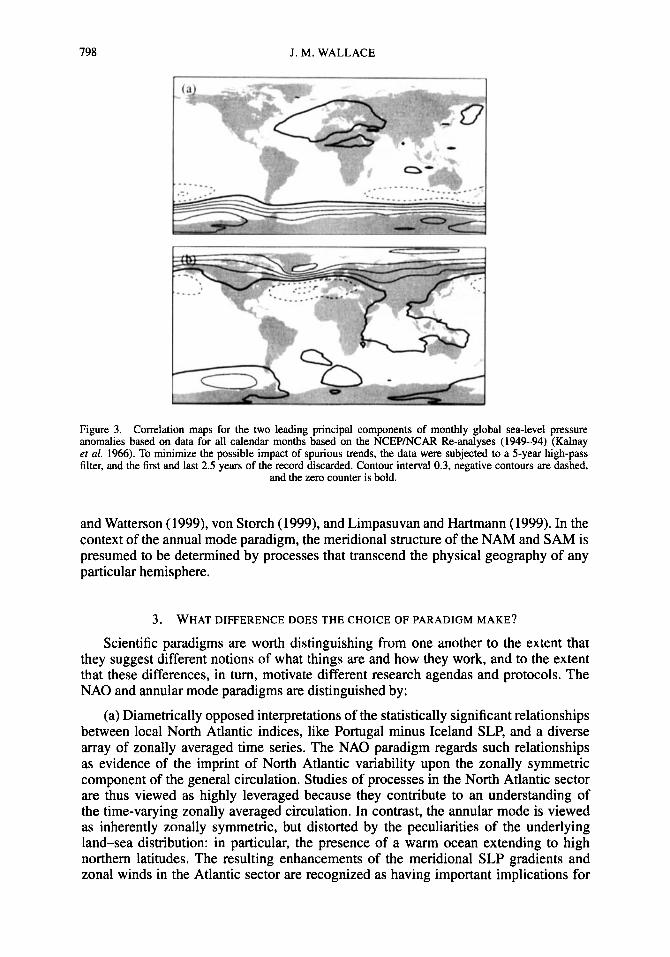
An important consideration in the interpretation of the common pattern in Fig. 2 is its strong resemblance to the leading mode of variability in the southern hemisphere (Gong and Wang 1999; Thompson and Wallace 2000). The two modes are recoverable as the two leading EOFs of global, monthly mean SLP, based on the NCEP/NCAR* re-analysis for all calendar months (Fig. 3). The similarity between them has inspired the use of the terms northern and southern hemisphere annular modes (NAM and SAM) (Limpasuvan and Hartmann 1999; Thompson and Wallace 2000).
Whether the phenomenon in question should be cast in terms of the NAO or annular mode paradigms remains controversial (e.g. see Kerr (1999)). Historical precedence might appear to favour the former, but based on the results presented above it can be argued that if Walker had had access to a global SLP dataset (1) he would have recognized the significant involvement of the entire Arctic basin in the mode that he labelled the NAO, and (2) he would have discovered the southern hemisphere annular mode and recognized it as an analogue of the NAO. In which case, his global synthesis of these modes would have been quite different from the one presented in WB.
Yet the NAO paradigm endures by virtue of the undeniable pre-eminence of the Atlantic sector in the SLP signature of this mode and the weakness of the SLP tele- connections between the Atlantic and Pacific sectors (Deser 2000). This lack of strong sectoral coherence in the SLP field, which is also characteristic of the SAM, was largely responsible for the decline in the popularity of the index cycle after the weather services began to make operational use of data for the entire northern hemisphere. The NAM and SAM signatures in the geopotential-height field are distinctive, not for the strength of the teleconnections between distant 'centres of action', but from the polar symmetry and large areal extent of their primary high-latitude centres of action.
The NAO has traditionally been viewed as a response to regional forcing over the North Atlantic or the tropical Atlantic/Americas, whereas variations in annular modes are viewed as reflecting the interaction between the eddies and the zonally symmetric component of the flow, as illuminated by the studies of Yoden et al. (1987), Shiotani (199O), Karoly (1990), Robinson (1991, 1996), Yu and Hartmann (1993), Kidson and Sinclair (1995), Lee (1997), Feldstein and Lee (1998), Hartmann and Lo (1998), Kidson
* National Centers for Environmental PredictiodNational Center for Atmospheric Research.
798 J . M. WALLACE
Figure 3. Correlation maps for the two leading principal components of monthly global sea-level pressure anomalies based on data for all calendar months based on the NCEPNCAR Re-analyses (1949-94) (Kalnay et al. 1966). To minimize the possible impact of spurious trends, the data were subjected to a 5-year high-pass filter, and the first and last 2.5 years of the record discarded. Contour interval 0.3, negative contours are dashed,
and the zero counter is bold.
and Watterson (1999), von Storch (1999), and Limpasuvan and Hartmann (1999). In the context of the annual mode paradigm, the meridional structure of the NAM and SAM is presumed to be determined by processes that transcend the physical geography of any particular hemisphere.
3 . WHAT DIFFERENCE DOES THE CHOICE OF PARADIGM MAKE?
Scientific paradigms are worth distinguishing from one another to the extent that they suggest different notions of what things are and how they work, and to the extent that these differences, in turn, motivate different research agendas and protocols. The NAO and annular mode paradigms are distinguished by:
(a) Diametrically opposed interpretations of the statistically significant relationships between local North Atlantic indices, like Portugal minus Iceland SLP, and a diverse array of zonally averaged time series. The NAO paradigm regards such relationships as evidence of the imprint of North Atlantic variability upon the zonally symmetric component of the general circulation. Studies of processes in the North Atlantic sector are thus viewed as highly leveraged because they contribute to an understanding of the time-varying zonally averaged circulation. In contrast, the annular mode is viewed as inherently zonally symmetric, but distorted by the peculiarities of the underlying land-sea distribution: in particular, the presence of a warm ocean extending to high northern latitudes. The resulting enhancements of the meridional SLP gradients and zonal winds in the Atlantic sector are recognized as having important implications for

NORTH ATLANTIC OSCILLATION/ANNULAR MODE 799
regional climate, but not as being of outstanding importance for understanding the time- dependent behaviour of the mode.
(b) Contrasting interpretations of the apparent coupling between troposphere and stratosphere. The NAO paradigm posits that the anomalous zonally symmetric compo- nent of the flow at stratospheric levels alters the upward propagation of the planetary- wave component of the NAO, thereby modulating the NAO's amplitude at tropospheric levels (e.g. Baldwin et al. 1994; Kodera and Yamazaki 1994; Perlwitz and Graf 1995). The annular mode paradigm posits that the vertical coupling is accomplished, not by any particular planetary-wave pattern, by the zonally symmetric component of the flow itself. The latter interpretation draws support from Plate 2 of Baldwin and Dunkerton (1999), which shows anomalies in geopotential height averaged over the entire polar-cap region propagating downward from mid-stratosphere to troposphere, and by the finding of Hartley et al. (1998) that, owing to their much larger horizontal scale, potential- vorticity perturbations associated with simultaneous geopotential-height rises and falls over the entire polar-cap region at the tropopause level are capable of inducing a much stronger tropospheric response than those associated with planetary waves.
(c) Different protocols for estimating this mode's contribution to hemispheric cli- mate trends. The NAO paradigm (e.g. Hurrell 1995) favours the use of indices such as the difference between standardized SLP anomalies at Portugal and Iceland stations. The annular mode paradigm prescribes that the analysis should be based on the leading natural mode(s) of variability as determined from PC analysis of the hemispheric or global SLP field based on observations or model control runs, as appropriate. In this respect, it is interesting to note that the trends in hemispheric SLP and SAT identified in the analysis of Hurrell (1995) based on the NAO index show up even more clearly when his analysis is repeated using the leading PC of hemispheric SLP (Thompson et al. 2000), as do the simulated responses to increasing concentrations of greenhouse gases in climate models (R. Miller (National Aeronautics and Space AdministratiodGoddard Space Flight Center), J. Fyfe (University of Victoria), E. Roeckner (Max Planck Institute for Meteorology) and R. McDonald (Hadley Centre for Climate Research), personal communications).
(d) Differing perspectives on the role of the ocean. Recent atmospheric general- circulation model (GCM) experiments conducted by Rodwell et al. (1999) show an apparent atmospheric response to prescribed time-varying SST anomalies over the Atlantic that qualitatively resembles the observed changes during the past 50 years. The NAO paradigm presumes that atmosphere4cean interaction over the Atlantic sector has been instrumental in inducing these changes. The annular mode paradigm invites exploration of the alternative hypothesis that the build-up of greenhouse gases (Shindell et al. 1999; Fyfe 1999) or ozone depletion (Volodin and Galin 1999) has forced a secular trend toward the 'high index' polarity of the annular mode which, in turn, forced the observed SST anomalies. In this scenario, the atmospheric 'response' to the SST anomalies in the experiments of Rodwell et al. (1999) would be viewed as a reflection of the weak positive feedback mechanism elucidated by Barsugli and Battisti (1998).
(e) Differing interpretations of the weak, but statistically significant, Atlantic- Pacific linkages observed in association with this mode. The NAO paradigm views them as wavetrains extending across the pole, or direct connections between regional centres of action separated by nearly 180" of longitude, whereas the annular mode paradigm views them as sectoral expressions of a see-saw in the geopotential-height field between a single extraordinarily large Arctic centre of action and the surrounding -45" latitude belt.

800 J . M . WALLACE
(0 Differing perspectives on dynamical analogues. The NAO paradigm invites the expectation of a Pacific counterpart that exhibits an analogous kind of atmosphere- ocean coupling. In contrast, the annular mode paradigm looks to the southern hemi- sphere annular mode, as illuminated by the studies of Szeredzi and Karoly (1987), Yoden et al. (1987), Kidson (1988a,b), Karoly (1990), Shiotani (1990), Hartmann and Lo (1998), Kidson and Watterson (1999) and others, for the most meaningful analogue. It also exploits the extensive literature on the zonally symmetric flow in idealized plan- etary atmospheres (Williams 1979; Robinson 1991, 1996; Feldstein and Lee 1998). In interpreting the trends of the past few decades, the annular mode paradigm invites com- parison of the behaviour of the NAM and SAM. There is, in fact, some indication of a trend toward the high-index polarity of the SAM (Hurrell and van Loon 1994; Randel and Wu 1999; Thompson et al. 2000), but this issue is in need of further investigation.
(8) Differing notions of the range of time-scales in which this phenomenon is observable. The NAO paradigm, with its emphasis on atmosphere-cean interaction is largely concerned with variability on interannual time-scales and longer, whereas the annular mode paradigm exploits observations on intraseasonal as well as interannual time-scales.
(h) Differing notions of what constitutes a distinctively North Atlantic Ocean climate phenomenon. The NAO paradigm points to the NAO as the premier mode of atmosphere-ocean interaction in the North Atlantic. In contrast, the most interesting patterns of SST anomalies in the context of the annular mode paradigm are the ones with distinctive shapes of their own, clearly distinguishable from the forced signature of the NAO/annular mode. Examples include the rapid warming that occurred along the Arctic fringe of the Atlantic from Baffin Island to Russia during the 1920s and the cooling that followed several decades later (Kelly 1982), and the ‘Great salinity anomaly’ of the 1970s (Dickson et al. 1988), both of which can be viewed as distinctively Atlantic contributions to the climate variability of the 20th century.
The choice of paradigms has implications for the way scientists in different subfields communicate and interact. The NAO is listed as one of four regional foci of the DecCen component of the CLIVAR* implementation plan (World Climate Research Programme 1998) and could be construed as falling largely within the purview of that programme. The annular mode transcends such geographic, time-scale or programmatic classifica- tions, and therefore serves as a cross-cutting theme of interest to the climate prediction, polar, stratospheric, anthropogenic climate change and atmospheric dynamics research communities. Implicit in the two paradigms are different research agendas: different ways of approaching the same research questions and, in some instances, different ques- tions entirely.
In conveying the message of what this phenomenon is about, there is no more important medium than the name by which it is known within the scientific community. Regardless of how it might be understood by the scientists themselves, the name NAO conveys to the public the notion of a northern hemisphere, Atlantic-centric phenomenon, whereas the NAM portrays it as a more generic, planetary-scale phenomenon. The alternative name, ‘Arctic Oscillation (AO)’, suggested by Thompson and Wallace (1998) is an attempt at a compromise that retains the flavour of Walker’s original label, while making more explicit the annular mode’s unique relation to the planetary geometry. One can envision that conferences organized under the rubric of the NAM, the NAO, and the A 0 would attract quite different mixes of attendees, and have quite different programmes. By the same token, it can be argued that the title of a primer, a tutorial, a
* CLlmate VARiability.

NORTH ATLANTIC OSCILLATION/ANNULAR MODE 80 1
request for proposals, or a section of an assessment of recent climatic trends relating to this phenomenon could influence the overall impression that readers take away from it. Over the course of time, I believe that these differing impressions will make a noticeable difference in the way NAO/annular mode-related scientific research is justified, organized, conducted, and perceived by the public. It is an important issue because this phenomenon rivals the El Nifio Southern Oscillation (ENSO) in terms of its significance for understanding global climate variability and trends.
4. ACHIEVING A CONSENSUS
In the interests of clarity, I believe it is incumbent upon the research community to come to grips with the differing definitions and interpretations of the NAO and NAM, and to make a choice between them based upon objective scientific evidence, not simply on historical precedent or programmatic expediency.
Observational or model budget diagnostics cannot, in and of themselves, tell us which of the two paradigms is more valid. Planetary-wave features in the Atlantic sector appear to be capable of forcing fluctuations in the zonally symmetric flow that resemble the observed (DeWeaver and Nigam 2000a); conversely, interactions between the zonally symmetric component of this pattern and the zonal gradients of the background climatology appear to be capable of accounting for much of the embedded stationary-wave pattern (Ting et al. 1996; DeWeaver and Nigam 2000b). Evidence based on EOF analysis for different domains is also subject to ambiguity. For example, Deser (2000) showed that the leading PCs of the SLP fields for the full northern hemisphere poleward of 20"N and just the Atlantic half of the hemisphere are very similar, whereas the leading PC for the Pacific half is entirely different. This result could be interpreted as indicating that the full hemispheric annular mode derives its character from the NAO signature in the Atlantic sector. However, it could equally well be interpreted as indicating that the SLP variability in the Atlantic sector is dominated by the annular mode, while other dynamical modes such as the ENSO and the Pacific-North American pattern are competing for the spotlight in the Pacific sector. Hence it is necessary to look to other kinds of evidence.
The apparent ubiquity of annular modes in GCM simulations of earth-like atmo- spheres, including those without land-sea contrasts, suggests a strategy for determin- ing the fundamental cause of the pattern. The following set of experiments could be performed with one (or more) model@): (a) a run with prescribed zonally symmetric boundary conditions; (b) several runs with prescribed boundary conditions as in (a) but with an anomalously warm lower boundary extending into high latitudes within a sector roughly the width of the Atlantic, the strength of the anomaly increasing from one experiment to the next; and (c) a run with realistic lower-boundary conditions with prescribed climatological-mean wintertime SST.
If the leading EOFs of SLP recovered from these experiments proved to be a family of patterns with a common zonally symmetric component and an embedded planetary- wave structure whose amplitude increases roughly in proportion to the degree of zonal asymmetry in the prescribed boundary conditions, it would support the notion that this pattern should be regarded as the expression of the annular mode. If, on the other hand, zonally asymmetric boundary conditions proved to be essential for obtaining a strong leading EOF, or if the warmth or the poleward extent of the warm sector strongly influenced the amplitude or meridional structure of the zonally symmetric component of the leading EOF, it would support the NAO paradigm.

802 J. M. WALLACE
One could envision another set of experiments with various treatments of the North Atlantic Ocean: prescribed climatological-mean SST, mixed layers of various depths, and more complete treatments of the ocean dynamics. If the inclusion of a more active ocean results in a more realistic simulation of the observed structure of the mode in question, it would argue that the pattern in question is indeed a sectoral NAO. On the other hand, if the treatment of the ocean dynamics affects the amplitude of the mode but not the structure, it would argue that the atmosphere-ocean interaction should be interpreted as a feedback upon an independently existing annular mode.
As an alternative to performing numerical experiments, one might consider criteria relating to how the NAO/annular-mode phenomenon affects regional climate. If its im- pacts prove to be largely attributable to (1) anomalous temperature advection involving the strong thermal contrasts between the North Atlantic and the upstream and down- stream continents, (2) changes in the latitude or intensity of the North Atlantic storm track and its downstream extension into Europe, (3) anomalies in the stationary-wave configuration induced by diabatic heating and/or storm track dynamics over the North Atlantic, or (4) changes in the frequency of blocking in the North Atlantic sector, it would argue in favour of the NAO paradigm. On the other hand, if the impacts can be shown to be more pervasive and extensive than can be accounted for by processes operating in, or remotely forced from, the Atlantic sector, it would argue in favour of the annular mode paradigm. For example, Namias (1950) envisioned that the low index (weaker subpolar westerlies) polarity of the zonal index, with its more extensive and less tightly confined pool of cold air at the surface, would exhibit a higher frequency of cold- air outbreaks throughout the hemisphere. One might also expect high-latitude blocking to be more pervasive during the low-index polarity, not only within the Atlantic sector, but also over Alaska and Russia as well. A hemisphere-wide survey is currently under- way to determine whether the regional expressions of the NAO/annular mode include phenomena such as these.
ACKNOWLEDGEMENTS
I am thankful to Todd P. Mitchell for collaborating with me in producing the new results presented in this paper, to David W. J. Thompson and Clara Deser for reading multiple versions of the manuscript and offering helpful critical comments and sugges- tions, and to Gabriele Hegerl for pointing out the similarity between Walker’s analysis scheme and EOF analysis and for her help in contacting scientists in the climate mod- elling community. The work was supported by the National Science Foundation under Grant ATM 9707069 and by the National Oceanic and Atmospheric Administration through a grant to the Hayes Center.
REFERENCES Baldwin, M. P. and Dunkerton, T. J .
Baldwin, M. P., Cheng, X. and
1999
1994
Propagation of the Arctic Oscillation from the stratosphere to the troposphere. J. Geuphys. Res., 104,30937-30946
Observed correlations between winter-mean tropospheric and stratospheric circulation anomalies. Geophys. Res. Lett., 21,
Classification, seasonality and persistence of low-frequency cir- culation patterns. Mun. Weather Rev., 115, 1083-1 126
The basic effects of atmosphereaean thermal coupling on mid- latitude variability. J. Atmos. Sci., 55,477-493
‘Development of the global mean sea level pressure data set GMSLPZ’. Climate Research Technical Note 79. Hadley Centre for Climate Research, UK Meteorological Office, Bracknell, Berks, UK
Dunkerton, T. J. 1 141-1 144
Bamston, A. and Livezey, R. E.
Barsugli, J. J. and Battisti, D. S.
Basnett, T. A. and Parker, D. E.
1987
1998
1997
NORTH ATLANTIC OSCILLATIONlANNULAR MODE 803
Bjerknes, J. Deser, C.
DeWeaver, E. and Nigam, S.
Dickson, R. R., Meincke, J.,
Feldstein, S. B. and Lee, S.
Fyfe, J. C., Boer, G. J. and
Gates, W. L.
Malmberg, S.-A. and Lee, A. J.
Flato, G. M.
Gong, D. and Wang, S.
Graf, H.-F., Perlwitz, J., Kirchner, I. and Schult, I.
Hartley, D. E., Villarin, J. T.,
Hartmann, D. L. and Lo, F.
Hurrell. J. W.
Black, R. X. and Davis, C. A.
Hurrell, J. W. and van Loon, H.
Jones. P. D.
Kalnay, E., Kanamitsu, M., Kistler, R., Collins, W., Deaven, D.. Gandin, L., Iredell, M., Saha, S., White, G., Woollen, J., Zhu, Y., Chelliah, M., Ebisuzaki, W., Higgins, W., Janowiak, J., Mo, K. C., Ropelewski, C., Wang, J., Leetmaa, A., Reynolds, R., Jenne, R. and Joseph, D.
Karoly, D. J.
Kelly, P. M., Jones, P. D., Sear, C. B., Cherry, B. S. G. and Tavakol, R. K.
Ken; R. A. Kidson, J. W.
Kidson, J. W. and Sinclair, M. R.
Kidson, J. W. and Watterson, I. G.
Kitoh, A., Koide, H., Kodera, K., Yukimoto, S. and Noda, A.
1964 2000
2000a
2000b
1988
1998
1999
1950
1999
1995
I998
1998
I995
1996
1994
1997
1994
1996
1990
1982
1999 1988a
1998b
1995
1999
1996
Atlantic air-sea interaction. Adv. Geophys., 10, 1-82 A note on the teleconnectivity of the ‘Arctic Oscillation’. Geo-
phys. Res. Lett., in press Zonal-eddy coupling and the dynamics of the North Atlantic
Oscillation. J. Climate, in press Zonal-eddy dynamics of the North Atlantic Oscillation. J. Cli-
mate, in press The ‘Great salinity anomaly’ on the northern Atlantic 1968-82.
Prog. Oceanogr ,38,24 1-295 Is the atmospheric zonal index driven by an eddy feedback?
J. Atmos. Sci., 44,3077-3086 The Arctic and Antarctic Oscillations and their projected changes
under global warming. Geophys. Res. Lett., 26, 1601-1604 ‘A statistical analysis of northern hemisphere sea-level pressure
patterns accompanying high and low polar pressure deficit’. S. B. thesis, Massachusetts Institute of Technology
Definition of Antarctic Oscillation index. Geophys. Res. Lett., 26, 459-462
Recent northern winter climate trends, ozone changes and in- creased greenhouse forcing. Contrib. Atmos. Phys., 68,233- 248
A new perspective on the dynamical link between the stratosphere and troposphere. Nature, 391,471474
Wave-driven zonal flow vacillation in the southern hemisphere. J. Atmos. Sci., 55, 1303-1315
Decadal trends in the North Atlantici Oscillation region tempera- tures and precipitation. Science, 269,676-679
Influence of variations in extratropical wintertime teleconnections on northern hemisphere temperature. Geophys. Res. Lett., 23, 665-668
A modulation of the atmospheric annual cycle in the southern hemisphere. Tellus, &A, 325-338
Decadal variations in climate associated with the North Atlantic Oscillation. Climate Change, 36,301-326
Hemispheric surface air temperature variations: A re-analysis and an update to 1993. J. Climate, 7, 1794-1802
The NCEPNCAR 40-year re-analysis project. Bull. Am. Meteorol. Soc., 77,437-471
The role of transient eddies in low-frequency zonal variations of the southern hemisphere circulation. Tellus, 42A, 4 1-50
Variations in surface air temperatures. Part 2: Arctic regions, 1881-1980. Mon. Weather Rev., 110,71-83
A new force in high-latitude climate. Science, 284,241-242 Indices of the southern hemisphere zonal wind. J. Climate, 1,
Interannual variations in the southern hemisphere circulation. J. Climate, 1, 1177-1 198
The influence of persistent anomalies on southern hemisphere storm tracks. J. Climate, 8, 1938-1950
The structure and predictability of the ‘High-latitude mode’ in the CSIR09 general circulation model. J. Atmos. Sci., 56, 3859- 3873
Interannual variability in the stratospheric-tropospheric circula- tion in a coupled ocean-atmosphere GCM. Geophy. Res.
183-1 94
Lett., 23,543-546

804 J. M. WALLACE
Kodera, K. and Koide, H.
Kodera, K. and Yamakazi, K.
Kodera, K., Chiba, M., Koide, H., Kitoh, A. and Nikaidou, Y.
Kushnir, Y. and Wallace, J. M.
Kutzbach. J. E.
Lee. S
Limpasuvan, V. and
Lorenz, E. N.
Namias, J.
Perlwitz, J. and Graf, H.-F.
Hartmann, D. L.
Randel, W. J. and Wu, F.
Robinson, W. A.
Rodwell, M. J., Rowell, D. P. and
Rogers, J. C. Folland, C. K.
Shindell, D. T., Miller, R. L.,
Shiotani. M. Schmidt, G. and Pandolfo, L.
Szeredzi, 1. and Karoly, D. J.
Thompson, D. W. J. and Wallace, J. M.
Thompson, D. W. J., Wallace, J. M.
Ting, M., Hoerling, M. P., Xu, T. and Hegerl, G.
and Kumar, A.
Trenberth, K. E. and Paolino, D. A.
van Loon, H. and Rogers, J.
Volodin, E. M. and Galin, V. Ya.
von Storch, J.
I997
1994
1996
1987
1970
1997
1999
1951
1950
1995
I999
1991
1996
I999
1984
1939
1999
I990
I987
1998
2000
2000
1996
1981
1978
1999
1999
Spatial and seasonal characteristics of recent climate trends in the northern hemisphere troposphere and stratosphere. J. Geo- phys. Res., 102,19433-19447
A possible influence of recent stratospheric coolings on the tro- posphere in the northern hemisphere winter. Geophys. Res.
Interannual variability of the winter stratosphere and troposphere in the northern hemisphere. J. Meteoml. Soc. Japan, 74,365- 382
Low frequency variability in the northern hemisphere winter: Geographical distribution, structure and time dependence. J. Atmos. Sci., 46,3122-3142
Large-scale features of monthly mean northern hemisphere anomaly maps of sea-level pressure. Mon. Weather Rev., 98,
Lett., 21,809-812
708-7 16 Maintenance of multiple jets in a baroclinic flow. J. Armos. Sci.,
54. 1726-1738 Eddies ‘and the annular modes of climate variability. Geophys.
Res. Lett., 26,3 133-3 136 Seasonal and irregular variations of the northern hemisphere sea-
level pressure profile. J. Meteorol., 8,52-59 The index cycle and its role in the general circulation.
J. Meteorol., 7 , 13& 139 The statistical connection between tropospheric and stratospheric
circulation of the northern hemisphere in winter. J. Climate,
Cooling of the Arctic and Antarctic polar stratospheres due to ozone depletion. J. Climate, 12, 1467-1479
The dynamics of the zonal index in a simple model of the atmos- phere. Tellus, 43A, 295-305
Does eddy feedback sustain variability in the zonal index? J. Atmos. Sci., 53,3556-3569
Oceanic forcing of the wintertime North Atlantic Oscillation and European climate. Nature, 398,320-323
Association between the North Atlantic Oscillation and the South- ern Oscillation in the northern hemisphere. Mon. Weather Rev., 112,1999-2015
Relations between variations in the intensity of the zonal circula- tion of the atmosphere and the displacements of the semiper- manent centers of action. J. Ma,: Res., 3,38-55
Simulation of recent northern winter climate trends by greenhouse-gas forcing. Nature. 399,452-455
Low-frequency variations of the zonal mean state of the southern hemisphere troposphere. J. Meteoml. Soc. Japan, 68, 461- 47 1
Horizontal structure of monthly fluctuations of the southern hemi- sphere troposphere from station data. Australian Meteond.
The Arctic Oscillation signature in the wintertime geopotential height and temperature fields. Geophys. Res. Lett., 25, 1297- 1300
Annular modes in the extratropical circulation. Part I: Month-to- month variability. J. Climate, 13, IOOO-1016
Annular modes in the extratropical circulation. Part 11: Trends. J. Climate, 13, 1018-1036
Northern hemisphere teleconnection patterns during extreme phases of the zonal-mean circulation. J. Climute, 9, 2614- 2633
Characteristic patterns of variability of sea level pressure in the northern hemisphere. Mon. Weather Rev., 109, 1169-1 189
The seesaw in winter temperatures between Greenland and North- ern Europe. Part I: General description. Mon. Weather Rev., 106,296-3 10
Interpretation of winter warming over the northern hemisphere continents in 1977-1994. J. Climate, 12,2947-2955
The reddest atmospheric modes and the forcings of the spectra of these modes. J. Atmos. Sci., 56, 1614-1626
8,2281-2295
Mag., 35, I 19-1 29

NORTH ATLANTIC OSCILLATIONlANNULAR MODE 805
Walker, G. T. and Bliss, E. W. 1932 Wallace, J. M. and Gutzler, D. S. 1981
Walsh, J. E., Chapman, W. L. and 1996
Williams, G. P. 1979
World Climate Research 1998
Yoden, S., Shiotani, M. and 1987
Yu, J.-Y. and Hartmann, D. L. 1993
Shy, T. L.
Programme
Hirota, I.
World Weather V. Mem. R. Meteorol. SOC., 4 , 5 3 4 3 Teleconnections in the geopotential height field during the north-
Recent decrease of sea level pressure in the central Arctic. J. Cli-
Planetary circulations. Part 3; Ternstrial quasi-geostrophic regi-
‘CLIVAR initial implementation plan’. WCRP No. 103;
Multiple planetary flow regimes in the southern hemisphere.
Zonal flow vacillation and eddy forcing in a simple GCM of the
em hemisphere winter. Mon. Weather Rev., 109,784-812
mate, 9,480-486
ime. J. Atmos. Sci., 36, 1409-1435
WMO/TD No. 869, Geneva, Switzerland
J. Meteorol. SOC. Japan, 65,571-586
atmosphere. J. Atmos. Sci., 50,3244-3259