north broadway market study
TRANSCRIPT

North Broadway Market Study
Presented to:
City of Boulder, Colorado
December 18, 2013
Prepared by:
1807 South Pearl Street Denver, CO 80210
720.244.7678 t 720.228.2211 f

Table of Contents I. Executive Summary ................................................................................................................................................................................................................. 1 II. Introduction ............................................................................................................................................................................................................................ 5 III. Economic and Demographic Framework .............................................................................................................................................................................. 9
3.1 General Economic Background ........................................................................................................................................................................................ 9 3.2 Population and Demographic Characteristics ................................................................................................................................................................. 12 3.3 Market Area Demographic Characteristics ..................................................................................................................................................................... 13 3.4 NoBo Psychographics ....................................................................................................................................................................................................... 17 3.5 Employment and Commercial Real Estate Characteristics ............................................................................................................................................ 18 3.6 Population and Household Forecasts ............................................................................................................................................................................. 20 3.7 Employment Forecasts .................................................................................................................................................................................................... 22 3.8 High Hazard Zone ............................................................................................................................................................................................................ 22
IV. Retail Market Analysis .......................................................................................................................................................................................................... 25 4.1 Retail Demand Analysis ................................................................................................................................................................................................... 25 4.2 Current and Future Demand for North Broadway Area Grocery Store ........................................................................................................................ 25 4.3 Current and Future Demand for Full-Service Grocery .................................................................................................................................................... 27 4.4 Retail Supply Characteristics ........................................................................................................................................................................................... 29 4.5 Impact of New Supermarket / Grocer .............................................................................................................................................................................. 31 4.6 North Broadway Inventory ............................................................................................................................................................................................. 33 4.7 Retail Demand without an Anchor ................................................................................................................................................................................. 34 4.8 Retail Demand with an Anchor ....................................................................................................................................................................................... 36 4.9 Retail Market Analysis Conclusions ................................................................................................................................................................................ 37
V. Office and light Industrial Analysis ...................................................................................................................................................................................... 38 5.1 Office Development Trends ............................................................................................................................................................................................ 38 5.2 Office Development Potential ........................................................................................................................................................................................ 39 5.3 Current Industrial Uses .....................................................................................................................................................................................................41

5.4 Industrial Demand ............................................................................................................................................................................................................41 5.5 Artists ............................................................................................................................................................................................................................... 43 5.6 Potential Office and Industrial Demand Capture ........................................................................................................................................................... 45
VI. North Broadway Barriers ..................................................................................................................................................................................................... 46 6.1 Village Center ................................................................................................................................................................................................................... 46 6.2 Public Storage .................................................................................................................................................................................................................. 47 6.3 Flood Plain ........................................................................................................................................................................................................................ 47 6.4 Annexation ....................................................................................................................................................................................................................... 47
VII. North Boulder Subcommunity Plan Update Opportunities ............................................................................................................................................... 48 Tables Table 1 North Broadway Zoning Summary ......................................................................................................................................................................................... 7 Table 2 Boulder County Employment, 2002-2012 .............................................................................................................................................................................. 11 Table 3 Population and Households in Market Areas, 2013 .............................................................................................................................................................. 13 Table 4 Housing Tenure ...................................................................................................................................................................................................................... 13 Table 5 Median Household Incomes, 2013 ........................................................................................................................................................................................14 Table 6 Median Owner-Occupied Housing Values, 2013 ................................................................................................................................................................... 15 Table 7 Median Age, 2013 ................................................................................................................................................................................................................... 15 Table 8 Full and Part Time Employment at North Broadway Businesses, 2013 .............................................................................................................................. 19 Table 9 1-Mile, Regional, and Tertiary Market Areas Population and Household Forecasts, 2013-2035 ....................................................................................... 20 Table 10 Major Developments in North Broadway Area (1995-2013) ............................................................................................................................................... 21 Table 11 1-Mile, Regional and Tertiary Market Areas Employment Forecasts, 2013-2035 ............................................................................................................... 22 Table 12 Total Household Incomes in the 1-Mile Market Area ......................................................................................................................................................... 26 Table 13 Grocery Demand in 1-Mile Market Area .............................................................................................................................................................................. 26 Table 14 Total Household Incomes in the Regional and Tertiary Market Areas ............................................................................................................................. 27 Table 15 Grocery Store Demand in Regional and Tertiary Market Areas ........................................................................................................................................ 28 Table 16 Grocery Stores and Supermarkets ..................................................................................................................................................................................... 30 Table 17 Households in 1-Mile Radius Around Independent Grocery Stores ................................................................................................................................... 31 Table 18 Current Market Area Grocery Store Estimated Share of Sales in the Regional Market Area ......................................................................................... 32 Table 19 Potential Sales Impact of New Grocery Store ................................................................................................................................................................... 33 Table 20 Commercial Establishments North to South (in the Uptown Broadway and Holiday Developments) .......................................................................... 33 Table 21 Retail Demand in 1-Mile Market Area ................................................................................................................................................................................. 35 Table 22 Unmet Retail Demand by 2035 (Non-Grocery) .................................................................................................................................................................. 36

Table 23 Potential Office Space Demand, 2010-2035 ....................................................................................................................................................................... 40 Table 24 Potential Light Industrial Flex Demand ............................................................................................................................................................................. 42 Table 25 North Boulder Subcommunity Plan Update Opportunities .............................................................................................................................................. 49 Figures Figure 1 Grocery Store / Supermarket Market Areas ......................................................................................................................................................................... 2 Figure 2 North Broadway Area............................................................................................................................................................................................................ 6 Figure 3 North Broadway Area Zoning Map ....................................................................................................................................................................................... 8 Figure 4 Boulder County Jobs and Unemployment Rate, 2002-2012 ................................................................................................................................................ 9 Figure 5 1-Mile, Regional and Tertiary Market Areas ........................................................................................................................................................................ 12 Figure 6 Household Income Breakdowns, 2013 ................................................................................................................................................................................14 Figure 7 Owner-Occupied Housing Values, 2013 ............................................................................................................................................................................... 15 Figure 8 Age Breakdowns ................................................................................................................................................................................................................. 16 Figure 9 Race and Ethnicity, 2013 ...................................................................................................................................................................................................... 16 Figure 10 Major Developments in North Broadway Area (1995-2013) ............................................................................................................................................. 21 Figure 11 High Hazard Zones in North Broadway ............................................................................................................................................................................. 23 Figure 12 City of Boulder Sales Tax Collections, 2005-2012 .............................................................................................................................................................. 29 Figure 13 City of Boulder Sales Tax Collections by Industry, 2005-2012 .......................................................................................................................................... 29 Figure 14 Grocery Stores and Supermarkets .................................................................................................................................................................................... 30 Figure 15 Boulder Office Development Trends ................................................................................................................................................................................ 38 Figure 16 North Broadway Artists and Creatives ............................................................................................................................................................................. 43

Page 1
12.18.13
I. EXECUTIVE SUMMARY ArLand Land Use Economics (ArLand) was retained by the City of Boulder in the summer and fall of 2013 to prepare a market analysis for the North Broadway area. ArLand prepared this technical report summarizing the economic conditions and market potentials of the area. The report serves as a framework and background for the development of the North Boulder Subcommunity Plan update. Project Scope
The purpose of the market study is to act as the foundation to evaluate the feasibility of developing the Village Center as currently depicted in the North Boulder Subcommunity Plan (1995 Plan), with a focus on the feasibility of a retail anchor land use, and to evaluate the redevelopment potential on North Broadway as it relates to the 1995 Plan’s vision. The information is a basis for planning the types and intensities of uses, development scenarios and preferred alternatives. As with any plan and ultimate development project, the actual mix and timing of development is going to vary. Existing Conditions and Findings
• The North Boulder Subcommunity Plan, adopted in 1995, helped facilitate a tremendous amount of change and redevelopment in the North Boulder area. While the Holiday neighborhood and Uptown Broadway followed the subcommunity’s planning process, a few significant areas have not redeveloped and outstanding questions remain regarding the Village Center and anchor land uses; role and location of a grocery store; the future of the Armory site; and the increased prominence and role of the arts in the area.
• Because the North Boulder Subcommunity is at the northern edge of Boulder and adjacent to open space, several market areas were examined including the immediate neighborhood market area (1-Mile Market Area1), as well as Regional and Tertiary Market Areas which include households in communities like Jamestown, Lake of the Pines, and county areas beyond City limits. This report closely examines the potential for a grocery store in the North Broadway area. Boulder is a jobs center and attracts a significant number of commuters, some of whom will shop while in the City. At the same time, communities like Longmont and Louisville have grown enough to support their own specialty stores, like Lucky’s and Alfalfa’s, reducing the number of residents from these communities who would shop in Boulder for specialty grocery items.
• There are higher income households in the 1-Mile Market Area, and a solid mix of income types and households. The majority of households in the 1-Mile Market Area earn between $100,000 and $200,000 annually. There are a significant percentage of households with higher incomes and higher housing values in the market areas examined relative to the City of Boulder and Boulder County. Other characteristics of the 1-Mile Market Area include a greater percentage of residents of Hispanic origin, a larger
1 For the purposes of this report, the neighborhood market area is a 1-mile radius from the intersection of Yarmouth Avenue and Broadway in North Boulder.

Page 2
12.18.13
percentage of residents aged 0-17 years, and a greater percentage of homes valued at less than $150,000 based on estimates of the current population.
• There are an estimated 1,200 to 1,300 full and part time employees in the North Broadway area (immediate NoBo neighborhood) with employees in manufacturing, landscaping and construction-related fields, wholesale and retail trades, and personal and business services. There are an estimated 225 artists and others in the creative industries located in the area, according to the NoBo Art District.
• Neighborhood-oriented retail such as grocery stores is heavily dependent on the number of neighborhood rooftops. There is a significant amount of grocery store retail square feet in the Boulder market area (over 673,000 square feet in 20 stores), however, much of it is more centrally located and in neighborhoods south and east of the North Broadway area, highlighting why some North Broadway residents feel that there is a lack of grocery services in the neighborhood. At the same time, most grocery stores, while serving a neighborhood need, also serve residents from a wide-ranging area.
• Under current conditions, the analysis indicates that there is unmet neighborhood demand for 17,000 to 28,000 square feet of grocery uses in the 1-mile radius. In evaluating the market, many stores would also evaluate potential demand in the wider Regional and Tertiary market areas which would include serving communities in the broader area such as Jamestown and Lyons shown in Figure 1. In this area, under current conditions, there is broader unmet demand for 25,700 to 42,900 square feet of grocery uses, assuming that residents here would drive to Boulder for their grocery store needs.
• At the same time, potential developers and retailers evaluating the North Boulder market have expressed concern about the significant amount of grocery retail already existing in the Boulder market, as well as the North Broadway area’s proximity to open space and lack of density relative to other Boulder neighborhoods. Potential developers and retailers have also indicated concern
Source: ArLand
Figure 1 Grocery Store / Supermarket Market Areas

Page 3
12.18.13
about the potential impact that an additional neighborhood or full-service grocery store would have on existing grocery store retailers in the area. Conversations and an impact analysis estimate that the impact would be 20-25% of current estimated revenues for those stores closest to the North Broadway area. Lucky’s, because of its geographic proximity to the North Broadway area, would potentially be the most heavily impacted.
• From now through 2035, this analysis forecasts demand for approximately 85,000 to 195,000 square feet of additional retail and restaurant development in the 1-Mile Market area, in addition to demand for grocery store retail. However, without an anchor or additional redevelopment activity, absorption is likely to be slow. Grocery store development could propel demand for commercial development adjacent to or in easy proximity to the grocery store. Without additional activities supporting redevelopment west of Broadway, Armory redevelopment would not be enough to help bolster commercial redevelopment mid-block or at the Broadway and Yarmouth Village Center intersection. Additional activities would include any activity that would accentuate the role of Yarmouth and Broadway as the Village Center in the area.
• From now through 2035, this analysis forecasts demand for approximately 25,000 to 30,000 square feet of additional office and 30,000 to 35,000 square feet of additional light industrial / flex space. Small office space has been popular in the area for business and professional services, many in the creative arena. Some of the industrial demand could be met at properties zoned industrial in the northern portion of the North Broadway area. Small office space demand could be met at redeveloped properties on the west side of Broadway.
• The Armory site and Village Center area have the greatest potential for a retail anchor land use or grocery store location, but both have significant constraints. The Armory is not as centrally located (relative to the Village Center area) and is not currently zoned to accommodate a traditional grocery store or other major retail anchor. The Village Center has not materialized as the neighborhood center and intersection as the North Boulder Subcommunity Plan identifies. There are also flood plain issues for some of the properties west of Broadway.
• At this point in time, without the addition of a significant number of households in the area, the addition of a neighborhood or full-service grocery store would potentially impact the viability of other grocery stores including Lucky’s, which is approximately one mile from Broadway and Yarmouth. There has also been an ongoing desire for neighborhood commercial services. The market for these services would be bolstered with an increased number of households in the market area which would strengthen demand.
• The NoBo Art District has a significant and growing presence in the North Broadway community.2 With an estimated 225 artists and creatives in the area, it is a potential avenue to create a brand and niche distinct from other parts of Boulder. The District has indicated a strong interest in assisting with branding, public improvements, and other activities which could potentially help the
2 The NoBo Art District is not an officially designated arts district, but is currently pursuing state and local designation.

Page 4
12.18.13
District as well as their businesses. They have organized First Friday events as well as other activities in the area. There is a particularly strong clustering of artists at 4949 Broadway and 4593 Broadway.
• Broadway can be wide and intimidating. Yarmouth doesn’t go through on the west side of Broadway. While the North Boulder Subcommunity Plan calls for Yarmouth to extend through to the west side of Broadway, that extension will be facilitated when redevelopment occurs on the affected properties. An intersection and pedestrian crossing at the Yarmouth and Broadway location will help ground the location as the neighborhood Village Center and create a better connection between the east and west sides of Broadway. Without additional improvements to the intersection of Yarmouth and Broadway like these, it is unlikely that any commercial redevelopment at the Armory would benefit the Village Center area and vice-versa. Limited retail development at the Armory should not impact any commercial development potentials at the Village Center area.
• On the west side of Broadway, there are a large number of public storage units, auto service centers, and industrial buildings, many of which house artists, construction, and other related businesses. Some of the buildings are poorly maintained and were significantly impacted by the September 2013 flood. Storage, in particular, provides income to current property owners and can be a difficult land use to transition from.
• Many of the properties in the North Broadway area were heavily impacted by the September 2013 flood. A flood study completed prior to this flood event in 2008 estimated over $5 million needed for flood plain mitigation on properties on the west side of Broadway near Four Mile Canyon Creek3. The 2013 flood event has triggered the need to reassess the flood boundaries and required mitigation which will affect this estimate. At this time, any redevelopment activity would need to address the flood plain improvement with the first redevelopment responsible for paying all the costs.
• On the west side of Broadway in the Village Center area, there are a variety of properties within County enclaves. For redevelopment to occur in accordance with the North Boulder Subcommunity Plan, the properties must annex into the City. Through annexation, city water and sewer will be provided to the properties and additional development potential is allowed. Annexation and connection to city utilities is expensive, and many of these county enclaves have additional challenges, in particular high hazard floodplain designation. Therefore, annexation and redevelopment of the properties is particularly challenging.
3 Source: City of Boulder/Urban Drainage and Flood Control District – Fourmile Canyon Creek and Wonderland Creek Major Drainageway Planning (Final Plan), May 2011, page18.

Page 5
12.18.13
II. INTRODUCTION The City of Boulder retained ArLand Land Use Economics (ArLand) in the summer and fall of 2013 to prepare a market study for the North Broadway area in preparation for the City’s planned update of the North Boulder Subcommunity plan. The purpose of the market study is to help analyze the feasibility of developing the Village Center as currently depicted in the North Boulder Subcommunity Plan and to evaluate the development potential along North Broadway. Data analysis was completed and interviews were conducted in the summer of 2013. The report is intended to serve as a framework and background for the development of an update to the subcommunity plan. Project Background
The North Boulder Subcommunity Plan, adopted in 1995, helped facilitate a tremendous amount of change and redevelopment in the North Boulder area. At the time, the area contained nearly half of the city’s total vacant residential land and several prominent vacant or under-developed commercial sites. While the Holiday Neighborhood is a result of the subcommunity planning process which envisioned an integrated, mixed-use, mixed-income community, a few significant sites in the Village Center and in the Yarmouth North areas have not redeveloped. It appears that the 100 year flood plain has impeded redevelopment in parts of the area west of Broadway. The Village Center concept, intended to be the “heart of the subcommunity” has not fully materialized. A number of questions have surfaced since the development of the 1995 Plan, relating to:
• Village Center location and anchor land uses • Role and location of a grocery store
• Future plans for the National Armory site • Increased prominence and role of arts in the area
Current Conditions
The North Broadway area is located at the northern gateway of the City of Boulder (Figure 2). The area is bordered by residential development and open space to the north. Industrial, storage and commercial uses can be found on the northern end of Broadway. The area transitions to the Holiday neighborhood on the east side of Broadway and Uptown Broadway. While there have been a few scattered redevelopment projects on the west side of Broadway, it retains its primarily industrial and warehouse orientation. Fourmile Canyon Creek also runs through the neighborhood, south of Yarmouth. It flooded significantly in September, 2013, and as a result, the City will conduct further assessments in the area to determine the need for any new mitigation strategies.
The upcoming North Boulder Subcommunity Plan update and this market study are intended to set the policy framework for the future of this area. Many in the community maintain their support for the original subcommunity plan. While there has been some disappointment that some of the original tenets of the plan have not been implemented, a clearer understanding of current market constraints and opportunities will enable a realistic update and implementation of the plan.

Page 6
12.18.13
Figure 2 North Broadway Area
1995 North Boulder Subcommunity Plan North Broadway Vision
While the original North Boulder Subcommunity Plan (1995 Plan) encompasses a much broader geographic area in North Boulder, this market study, and the subsequent North Boulder Subcommunity Plan update is a much more focused examination and plan for the North Broadway area (Figure 2).
The 1995 Plan calls for a Village Center on both sides of Broadway at Yarmouth, extending to Fourmile Canyon Creek to the south. The Center is intended to serve as the subcommunity’s core retail area and heart of the subcommunity. While the east side of the Village Center has built out, the west side has not. The areas north of the Village Center are intended for valuable service industrial uses, with some residential, neighborhood-serving small-scale retail, and office.
North Armory Site
Village Center (shaded in red)
Source: City of Boulder
Fourmile Canyon Creek

Page 7
12.18.13
Following adoption of the 1995 Plan, the City initiated a rezoning process to align current zoning with the 1995 Plan’s future land use categories on several key properties along North Broadway. These properties include the Village Center and Yarmouth North (Armory site area) areas. Table 1 below summarizes select development standards and use regulations for the three zone districts that encompass most of the Village Center area and Armory site. The zoning map for the area is shown in Figure 3.
Table 1 North Broadway Zoning Summary
Zoning District/Description Building Size Restrictions Select Use Restrictions
Business Main Street (BMS) Business areas generally anchored around a Main Street that are intended to serve the surrounding residential neighborhoods.
Maximum Building Size
15,000 s.f. • Detached and attached dwelling units allowed
• Restaurants < 1,500 s.f. allowed (> 1,500 sf requires use review)
• A variety of office uses allowed • All convenience retail allowed, over 20,000 s.f.
requires use review
Floor Area Ratio (FAR) .67
Maximum Building Height 38’
Maximum # Stories 3
Mixed Use 1 (MU-1) Mixed use areas which are primarily intended to have a mix of residential and nonresidential land uses within close proximity to each other.
Maximum Building Size
15,000 s.f.
• Attached dwelling units allowed • Detached dwelling units requires use review • No retail over 5,000 square feet • Restaurants < 1,500 s.f. allowed • Office uses allowed provided more of the building is
used for residential (otherwise requires use review) • Retail restricted primarily to convenience retail with
at least 50% of building used as residential.
Floor Area Ratio (FAR) .6
Maximum Building Height 35’
Maximum # Stories 2
Mixed Use 2 (MU-2) Mixed use residential areas adjacent to a redeveloping main street area, which are intended to provide a transition between a main street commercial area and established residential districts.
Maximum Building Size
15,000 s.f.
• Attached residential units allowed • Detached residential units require use review • Convenience retail < 2,000 s.f. allowed • Most other retail sales < 5,000 s.f. requires use review • No retail over 5,000 square feet • Restaurants < 1,000 s.f. allowed • Office uses allowed provided more of the building is
used for residential (otherwise requires use review)
Source: City of Boulder

Page 8
12.18.13
Figure 3 North Broadway Area Zoning Map
The intent of the 1995 Plan’s future land use categories and subsequent rezonings was to keep the commercial services in the Village Center area at a smaller, more neighborhood scale. However, interviews indicate that the size (square footage) limitations, in particular, for retail and restaurant uses, have been disincentives to development in some areas along North Broadway.
Market Study Scope
The market study’s scope examines local and regional economic and demographic trends and projections impacting the North Broadway area with a particular focus on the potential for commercial development as it supports a Village Center. It is organized into the following sections.
• Economic and Demographic Framework discusses relevant local, regional and market area population, demographic and employment trends and projections impacting the market potential for the North Broadway area.
• Retail Market Analysis examines the retail market and potential retail uses appropriate for the neighborhood.
• Office and Flex Analysis discusses small office potential. It also discusses the current industrial market and its role in the area’s redevelopment.
• North Broadway Barriers discusses some of the area’s redevelopment constraints as well as discusses potential tools.
• North Boulder Subcommunity Plan Update Opportunities summarizes and discusses overall land use potentials and next steps.
Source: City of Boulder

Page 9
12.18.13
III. ECONOMIC AND DEMOGRAPHIC FRAMEWORK This section describes the economic and demographic trends for the North Broadway area, the market area(s), the City of Boulder, and the region. The background information is intended to help depict North Broadway’s place within the larger economy and provide information to help inform future planning and land use opportunities in the area. 3.1 General Economic Background
Like much of the nation and the larger metropolitan region, Boulder County has seen a great fluctuation of jobs in the last decade. All aspects of the local economy have been affected, including real estate and development. After the terrorist attacks of 2001, the number of jobs declined locally and then rebounded through 2008. The County again lost jobs during the Great Recession and is now in the midst of a recovery as can be seen in Figure 4. While the national recession has officially ended, economic recovery has lagged somewhat plagued by continued relatively high levels of unemployment. Boulder County and the larger Denver-Boulder metropolitan region, in general, have fared relatively well in comparison to the rest of the country. Figure 4 Boulder County Jobs and Unemployment Rate, 2002-2012
0.0%
1.0%
2.0%
3.0%
4.0%
5.0%
6.0%
7.0%
8.0%
140,000
145,000
150,000
155,000
160,000
165,000
2002 2003 2004 2005 2006 2007 2008 2009 2010 2011 2012
Jobs Unemployment Rate
Source: BLS, ArLand

Page 10
12.18.13
In 2012, there were over 160,000 jobs in the County (Table 2). More than half are located in the City. Top industries include Professional, Scientific and Technical Services, Educational Services, Health Care and Social Assistance. Significant industry clusters include aerospace, bioscience, data storage, light manufacturing, natural and organic products, outdoor recreation, photonics, renewable energy and energy research, software and tourism. A survey conducted by the Boulder Economic Council in 2012 found that the vast majority (83%) of individuals employed in the City live within a 20 to 30 minute drive or approximately 20-mile radius of the City. This would include residents commuting to homes in Boulder County north of the North Broadway area in areas such as Jamestown, Lyons, Longmont, and other communities.

Page 11
12.18.13
Table 2 Boulder County Employment, 2002-2012
Industry 2002 2006 2012
2012 Percentage
of TotalChange 2002-
2012
Percentage Change
2002-2012
Agriculture, Forestry, Fishing and Hunting 400 334 374 0.2% -26 -6.5%Mining 237 630 250 0.2% 13 5.5%Utilities 322 307 288 0.2% -34 -10.6%Construction 7,148 5,706 4,192 2.6% -2,956 -41.4%Manufacturing 22,345 18,652 16,824 10.3% -5,521 -24.7%Wholesale Trade 5,073 5,504 5,439 3.3% 366 7.2%Retail Trade 16,555 16,162 16,455 10.1% -100 -0.6%Transportation and Warehousing 3,169 2,148 2,013 1.2% -1,156 -36.5%Information 10,822 8,863 8,683 5.3% -2,139 -19.8%Finance and Insurance 4,375 4,677 4,807 2.9% 432 9.9%Real Estate and Rental and Leasing 2,848 2,409 2,271 1.4% -577 -20.3%Professional, Scientific, and Technical Services 18,256 21,833 24,112 14.8% 5,856 32.1%Management of Companies and Enterprises 618 1,477 1,071 0.7% 453 73.3%Administrative and Support and Waste Management 7,211 6,571 6,602 4.0% -609 -8.4%Educational Services 16,656 17,555 20,286 12.4% 3,630 21.8%Health Care and Social Assistance 13,643 16,050 19,120 11.7% 5,477 40.1%Arts, Entertainment, and Recreation 2,214 2,529 2,712 1.7% 498 22.5%Accommodation and Food Services 13,483 14,141 15,645 9.6% 2,162 16.0%Other Services (except Public Administration) 4,586 4,139 4,671 2.9% 85 1.9%Public Administration 6,392 7,200 7,473 4.6% 1,081 16.9%
Total 156,353 156,887 163,288 100.0% 6,935 4.4%
Source: Colorado Department of Labor & Employment, BLS ArLand

Page 12
12.18.13
3.2 Population and Demographic Characteristics
The City of Boulder is one of ten incorporated cities and towns located in Boulder County. It is the largest City and the jobs center for the immediate region. While the City attracts commuters from throughout the County, the North Broadway area is the northern gateway to the City of Boulder particularly for travelers and commuters living in Jamestown, Lyons and other County locations to the north.
For purposes of the retail market analysis, 1-Mile, Regional and Tertiary Market Areas were designated as shown in Figure 5. The market areas are the areas from which a project will draw the majority of its retail customers. Boundaries of market areas are often irregular because they can be influenced by geographic barriers, commuting patterns, and the presence of competing or complementary retailers. Typically neighborhood oriented retail encompasses a 1 to 2 mile radius, community level retail encompasses a 3 mile radius, and regional level retail encompasses an approximate 5 mile (or larger) radius around a potential site.
The 1-Mile Market Area is the area within an approximate 1-mile radius from the intersection of Broadway and Yarmouth and represents the neighborhood market area for the North Broadway area. It also represents the market area for a neighborhood-level grocery store. It includes most of the residential areas at the northern edge of the City.
A larger supermarket or grocery store would also likely attract shoppers in a wider ranging area; not only the immediate North Broadway neighborhood, but parts of the County as shown in Figure 5 designated as the Regional Market Area. It would also
Figure 5 1-Mile, Regional and Tertiary Market Areas
Source: ArLand

Page 13
12.18.13
likely attract commuters travelling to Boulder for jobs and services. The Regional Market Area includes Jamestown, the larger north Boulder community, as well as communities in the County like Lake Valley and Lake of the Pines.
The Tertiary Market Area includes communities further north such as Lyons in Figure 5 and does not include the 1-Mile and Regional Market Area. While it is possible to shop at the local grocery stores in town, for larger items and greater selection, households in these areas are likely to travel to Boulder (as well as Longmont). Although Boulder is a jobs and services center, Longmont is attractive to these shoppers because of the presence of a full-size Walmart. Our analysis assumes that a North Broadway grocer would only be able to attract a portion of the potential spending that might be available in this area.
3.3 Market Area Demographic Characteristics
There are over 8,000 persons in 3,200 households in the 1-Mile Market Area (Table 3). The Regional Market Area (which incorporates all of the 1-Mile Market Area) is estimated at 36,800 persons in nearly 16,000 households. There are nearly 3,300 persons in 1,400 households in the Tertiary Market Area. In comparison, the City of Boulder’s 2013 population is over 100,000 persons in 43,400 households. Average household sizes in the North Broadway market areas are higher, in general, than the City as a whole, which is reflective of the household nature of the area and the higher concentrations of students in other areas of the City.
Table 3 Population and Households in Market Areas, 2013
Table 4 shows housing tenure within the 1-Mile, Regional, Tertiary Market Areas, the City of Boulder, and Boulder County. Although there is rental housing in the immediate 1-Mile Market Area, the vast majority of housing is owner occupied. Owner occupancy in the market areas and the County is much higher than the City as a whole, which is about 50% owner-occupied and 50% renter-occupied. Table 4 Housing Tenure
Persons HouseholdsPersons /
Households1-Mile Market Area 8,185 3,231 2.6Regional Market Area 36,830 15,926 2.4Tertiary Market Area 3,262 1,412 2.3City of Boulder 100,493 43,433 2.2Boulder County 305,015 124,233 2.5Source: Claritas, ArLand
Owner OccupiedRenter
Occupied1-Mile Market Area 87.3% 12.7%Regional Market Area 71.0% 29.0%Tertiary Market Area 77.5% 22.5%City of Boulder 50.1% 49.9%Boulder County 64.4% 35.6%Source: Claritas, ArLand

Page 14
12.18.13
Median household incomes are shown in Table 5 and income breakdowns are shown in Figure 6. In general, market area household incomes are much higher than the City as a whole. Average and median household incomes in the 1-Mile Market Area are estimated at nearly $112,000, indicating the presence of a number of higher income households within this market area.
Figure 6 indicates that the greatest percentage of households in all areas earn between $100,000 and $200,000 (2013). Table 5 Median Household Incomes, 2013
Median HH
Income Avg HH Income
1-Mile Market Area $71,314 $111,816 Regional Market Area $65,929 $103,865 Tertiary Market Area $73,544 $106,775 City of Boulder * $56,274 $84,225 Boulder County * $66,989 $92,308 Source: Claritas, ArLand
* 2012 American Community Survey
Figure 6 Household Income Breakdowns, 2013
Source: Claritas, ArLand

Page 15
12.18.13
Figure 7 Owner-Occupied Housing Values, 2013
Source: Claritas, ArLand Figure 7 above indicates that the highest percentage of owner occupied houses in the 1-Mile and Regional Market Areas are homes valued between $500,000 and $750,000. Both Market Areas have a significant percentage of homes valued at $300,000 and up. The 1-Mile Market Area also has a high percentage of homes valued at less than $150,000. Table 6 shows median owner occupied housing values. Of all the market areas analyzed, the 1-Mile Market Area has the highest values.
Table 6 Median Owner-Occupied Housing Values, 2013
The median ages in the market areas are older than the City and County, respectively, as shown in Table 7 at 39.5 in the 1-Mile Market Area and over 40 in the Regional and Tertiary Market Areas. Table 7 Median Age, 2013
Median Owner-Occupied Housing
Values1-Mile Market Area $507,034Regional Market Area $501,943Tertiary Market Area $425,330City of Boulder $447,204Boulder County $329,450Source: Claritas, ArLand
Median Age1-Mile Market Area 39.5Regional Market Area 40.5Tertiary Market Area 47.7City of Boulder 31.1Boulder County 36.7Source: Claritas, ArLand

Page 16
12.18.13
Figure 8 Age Breakdowns
Source: Claritas Figure 8 shows that the 1-Mile Market Area has a much higher percentage of children between 0-17 relative to the rest of the population in the area. The City’s university population shows up in the high percentage of residents in the 18-24 age categories.
Figure 9 Race and Ethnicity, 2013
The 1-Mile Market Area has a greater percentage of residents of Hispanic origin compared to the other market areas, the City and County, as a whole (Figure 9).
1-Mile Regional Tertiary City of BoulderMarket Area Market Area Market Area Boulder County
White 82.5% 87.8% 94.0% 87.7% 86.6%Black 0.8% 0.7% 0.4% 0.8% 0.8%American Indian 0.5% 0.5% 0.3% 0.4% 0.6%Asian/Pacific Islander 4.4% 3.4% 1.5% 4.9% 4.4%Other / Two or more 11.8% 7.6% 3.7% 6.2% 7.5%
Hispanic Origin* 18.5% 11.5% 5.5% 8.9% 13.9%
Source: Claritas, ArLand
* can be of any race
Page 17
12.18.13
3.4 NoBo Psychographics
Psychographics is a term to describe characteristics of people and neighborhoods, which instead of being purely demographic, reflect attitudes, interests, opinion, and lifestyles. Nielsen / Claritas is a leading system for characterizing neighborhoods into one of 66 distinct market segments. Psychographic studies of individuals or communities can be valuable in the fields of marketing, demographics, opinion research, and social research. Commercial and residential developers are increasingly interested in understanding a community’s psychographic profile. The categories and terms described below are used to describe psychographic segments nationally. The psychographic information is derived from Census data, leading consumer surveys, and other public and private sources of demographic and consumer information.
Households living in the NoBo neighborhood (1-Mile Radius) fall into the following market segments:
• The Affluentials: These residents enjoy comfortable, suburban lifestyles. The median incomes and home values are well above the U.S. median values and members of this group tend to have college degrees and white collar jobs. The Affluentials are big fans of health foods, computer equipment, consumer electronics, and the like. They are drawn to comfortable homes and apartments with a manageable commute to downtown jobs, restaurants, and entertainment.
• Inner Suburbs: Residents tend to be high school educated and downscale. This group is racially diverse, divided evenly between homeowners and renters, and filled with households that are either young or aging in place.
• Elite Suburbs: The most affluent social group, this group makes six figure incomes, have post graduate degrees, own single family homes, and are in managerial and professional occupations. They are home to America’s up and coming business class. They rank highly for owning a small business and having a home office.
• Middleburbs: The group includes a mix of homeowners and renters as well as high school and college graduates. They tend to have good jobs and discretionary incomes to visit casual-dining restaurants, shop at midscale department restaurants, and travel across the U.S. and Canada.
• Landed Gentry: This group consists of wealthy Americans who migrated to the smaller boomtowns. Many of the households contain Boomer families and couples with college degrees, expansive homes and professional jobs. They’re twice as likely as average Americans to telecommute. They can afford to spend heavily on consumer electronics, wireless and computer technology, and the like. This group tries to maintain a balanced lifestyle between high power jobs and laid-back leisure.

Page 18
12.18.13
3.5 Employment and Commercial Real Estate Characteristics
According to Info USA, there are approximately 1,200 to 1,300 full- and part-time employees in the commercial areas in an approximately ½ mile radius from the intersection of Broadway and Yarmouth.4 The commercial areas include the newer commercial east of Broadway, found mostly in the Holiday neighborhood and Uptown Broadway developments, as well as the older, industrial, warehouse area west of Broadway. Most of the businesses are small, averaging 6 or fewer employees each.
There are several landscaping and construction related firms in the area. There is manufacturing in the area although much of it has transitioned to artists working with metals, textiles, and leather. Namaste Solar is included in the Wholesale Trade category, along with several other wholesale businesses in the area. Within the retail category, restaurants have hired the most full- and part-time employees at an estimated 165 workers, according to Table 8. There are a number of businesses in the miscellaneous retail categories with many of the artists falling into these categories. There is a 1st Bank, along with small offices of insurance agents, financial advisors, and others in the Finance category. There are a number of different services in the area, including a number of personal services as well as business services, auto repair and others.
4 The ½ mile radius was chosen here to primarily analyze employment in the immediate North Broadway corridor area.

Page 19
12.18.13
Table 8 Full and Part Time Employment at North Broadway Businesses, 2013
Industries2013 Estimated
Employment Industries2013 Estimated
EmploymentAgricultural Services 33 Finance, Insurance, Real Estate 60Construction 61 Services 553Manufacturing 19 Lodging 40
Food 1 Personal Services 49Printing, Publishing 2 Business Services 42Leather / Textile Products 11 Auto Repair 69Fabricated Metals 1 Misc. Repair 2Machinery 3 Misc. Entertainment 72Transportation Equipment 1 Health Services 36
Transportation Legal Services 5Motor Freight Transportation & Warehousing 33 Educational Services 74
Wholesale Trade 106 Social Services 100Retail Trade 311 Museums / Galleries 2
Building Materials 14 Membership Organizations 2General Merchandise 6 Engineers, Architects, Accountants 54Food 33 Misc. Services 6Auto Parts 11 Public Administration 93Clothing 2Furniture and furnishings 28Restaurants 165Misc. Retail 52
Total 1,269Source: InfoUSA, ArLand
Note: Businesses in an approximately 1/2 mile radius from the Yarmouth and Broadway intersections.

Page 20
12.18.13
3.6 Population and Household Forecasts
In order to begin developing projections for future supportable grocery and other commercial development, forecasts for the market areas are developed based on population, household, and employment projections. Table 9 shows the population and households in the 1-Mile, Regional, and Tertiary Market Areas and the forecasts for population and household growth in these areas. Any developments currently under construction or in the planning pipeline are not included in the 2013 estimates. Figure 10 and Table 10 (following) provides a summary of the key developments under review or approved for construction. Table 9 1-Mile, Regional, and Tertiary Market Areas Population and Household Forecasts, 2013-2035
Current projections show relatively modest additions to the household count through 2035. The 1-Mile Market Area is projected to add approximately 550 new households, while the Regional Market Area is projected to add almost 1,300 households. Forecast annual growth rates are less than 1% per year.
2013 2035 2013-2035 CAGR 2013-2035
1 Mile Market AreaPopulation 8,185 9,386 1,201 0.6%Households 3,231 3,787 556 0.7%Persons/ HH 2.5 2.5 2.2
Regional Market AreaPopulation 36,830 38,731 1,901 0.2%Households 15,926 17,179 1,253 0.3%Persons/ HH 2.4 2.3 1.5
Tertiary Market AreaPopulation 3,262 3,432 170 0.2%Households 1,412 1,517 105 0.3%Persons/ HH 2.3 2.3 1.6
Source: Claritas, DRCOG, City of Boulder, ArLand

Page 21
12.18.13
Figure 10 Major Developments in North Broadway Area (1995-2013)
Source: City of Boulder, ArLand
Table 10 Major Developments in North Broadway Area (1995-2013)

Page 22
12.18.13
Between 1995 and 2013, a significant number of residential units were added to the North Broadway area as shown in Figure 10 in Map ID numbers 1 through 5. These select developments added 1,076 residential units to the North Broadway area during this time period.
Areas 6 through 10 in Figure 10 and Table 10 show 179 units in planned residential projects that are currently under review, or are under construction.
3.7 Employment Forecasts
Employment forecasts are also relatively modest for the area. Table 11 indicates that the market areas are forecast for jobs growth with the addition of approximately 117 jobs in the 1-Mile Market Area, 247 jobs in the Regional Market Area and 36 jobs in the Tertiary Market Area. There is a slight discrepancy between the estimates for North Broadway jobs found in Table 9 and 1-Mile Market Area estimates because of slightly different geographic areas. Table 11 1-Mile, Regional and Tertiary Market Areas Employment Forecasts, 2013-2035
3.8 High Hazard Zone
Figure 11 depicts the High Hazard Zone in the North Broadway area which encompasses a significant portion of the area north of Rosewood Street. There are a variety of storage and industrial uses and artists located in the area. No redevelopment is allowed in the high hazard areas without significant flood mitigation.
2013 2035 2013-2035CAGR 2013-
2035
1 Mile Market Area 1,570 1,687 117 0.3%Regional Market Area 17,989 18,236 247 0.1%Tertiary Market Area 964 1,000 36 0.2%
Source: DRCOG, ArLand

Page 23
12.18.13
Figure 11 High Hazard Zones in North Broadway
Source: City of Boulder

Page 24
12.18.13
The flood of September 2013 affected a number of properties in the area. The City is assessing the event and will reevaluate the need for remapping and mitigation strategies along Fourmile Canyon Creek. The City’s estimated costs for flood mitigation in the Village Center area west of Broadway (before the flood in 2008) were about $2.7 million with an additional approximately $3.1 million in estimated building flood mitigation costs. It is unclear how the September 2013 flood event will impact these estimates. The City has no current funds to help offset the costs of flood mitigation. At this time, anyone interested in redeveloping the area would be fully responsible for offsetting these expenses up-front.
Although there are a number of reasons why the area west of Broadway has not redeveloped, the lack of funding to pay for flood plain improvements is a significant barrier. Although Violet Crossing, a 98-unit multi-family apartment project at Violet and Broadway is currently under construction, some of the public flood plain mitigation funds used to improve the property were agreed upon and allocated a number of years ago. Similar funds would be unavailable now for any new flood plain improvements since the program is now focused on mitigation of flood hazards associated with existing development.

Page 25
12.18.13
IV. RETAIL MARKET ANALYSIS This section discusses the retail market potential for the North Broadway area. It examines current and future retail demand and supply in the market areas.
4.1 Retail Demand Analysis
Retail demand is calculated by:
• Estimating households and incomes in the market area in order to derive total incomes potentially available for retail expenditures; and,
• Based on current expenditure patterns, calculating the income percentage spent in retail categories by residents within the market area. This results in estimated demand by retail category.
By comparing estimated demand (both current and future) to an estimate of supply or sales by retail category, an estimate of unmet retail demand can be calculated by:
• Subtracting supply from demand to obtain an estimate of unmet demand; and • Incorporating sales per square foot averages by retail category in order to arrive at the approximate square footage of unmet retail
demand.
The estimate of unmet retail demand is considered by retailers along with other criteria in making location decisions. Retailers also consider other factors including the overall retail project format, synergy with other tenants, and location relative to other stores. Retailers locate in different types of centers, and each retailer has its own location criteria.
The next sections will focus on demand and supply for a grocery store in the neighborhood first, followed by a discussion of general retail in the North Broadway area.
4.2 Current and Future Demand for North Broadway Area Grocery Store
Table 12 shows the estimated total household incomes in the 1-Mile Market Area currently, in 2020, 2025, and 2035, based on estimated potential growth in households and average household incomes. The analysis conservatively estimates that average household incomes will remain constant. Total incomes potentially available, a portion of which will be available for retail expenditures, are currently $361 million and projected to increase to (in today’s dollars) $423 million by 2035.

Page 26
12.18.13
Table 12 Total Household Incomes in the 1-Mile Market Area
Table 13 compares expenditure potential to retail capture by existing grocery store retailers to estimate unmet retail demand for groceries. Demand is calculated by multiplying total household incomes by potential household expenditures for groceries. An estimate of current sales is subtracted out. Table 13 shows that there is current unmet demand for 17,000 to 28,000 square feet of grocery store space. By 2035, that increases to 23,000 to 34,000 square feet. Table 13 Grocery Demand in 1-Mile Market Area
2013 2020 2025 2035Growth 2013-
2035CAGR % Growth
2013-2035
1 Mile Market AreaHouseholds 3,231 3,377 3,494 3,787 556 0.7%Average Household Income $111,816 $111,816 $111,816 $111,816 $111,816 --Total Household Incomes $361,277,496 $377,612,485 $390,728,170 $423,490,663 $62,213,167 0.7%
Source: DRCOG, City of Boulder, ArLand
2013 Households 3,231Avg Household Income $111,816Total Household Income $361,277,496Annual HH Growth Rate through 2035 0.7%% Expenditures on Groceries 5.50%Grocery Demand $19,870,262Est. Sales $9,613,571Current Retail Void $10,256,691Est. Sales / SF $450
Current Retail Void (S.F.) 17,094 - 28,491Additional Demand from Household Growth (S.F.) 7,604Total Demand 2035 (S.F.) 22,797 - 33,796Source: Claritas, Census of Retail Trade for CO, ULI, ArLand

Page 27
12.18.13
4.3 Current and Future Demand for Full-Service Grocery
Table 14 shows the estimated total household incomes in the Regional and Tertiary Market Areas, in 2020, 2025, and 2035, based on estimated potential growth in households and average household incomes. The Regional and Tertiary Market Areas represent the areas that a conventional full service grocery store (60,000 square foot store and larger) would examine as part of their potential customer base.
The analysis conservatively estimates that average household incomes will remain constant at the household incomes shown. Total incomes in the Regional Market Area, a portion of which will be available for grocery store expenditures are currently $1.6 billion increasing to (in today’s dollars) nearly $1.8 billion by 2035. In the Tertiary Market Area, total incomes estimated (based on ¼ of the households in the Tertiary Market Area) are $37 million increasing to over $40 million by 2035. Table 14 Total Household Incomes in the Regional and Tertiary Market Areas
2013 2020 2025 2035Growth 2013-
2035CAGR % Growth
2013-2035
Regional Market AreaHouseholds 15,926 16,256 16,519 17,179 1,253 0.3%Average Household Income $103,865 $103,865 $103,865 $103,865 $103,865 --Total Household Incomes $1,654,153,990 $1,688,434,697 $1,715,793,338 $1,784,276,900 $130,122,910 0.3%
Tertiary Market Area (1/4 of Households)Households 353 360 366 379 26 0.3%Average Household Income $106,775 $106,775 $106,775 $106,775 $106,775 --Total Household Incomes $37,691,575 $38,440,414 $39,033,245 $40,499,676 $2,808,101 0.3%
Source: DRCOG, ArLand

Page 28
12.18.13
Table 15 Grocery Store Demand in Regional and Tertiary Market Areas
The analysis in Table 15 includes an estimate of Walmart Neighborhood grocery sales. It indicates that there is a current retail grocery void of approximately 25,700 square feet to 42,900 square feet in the Regional and Tertiary Market Areas. By 2035, assuming no additional grocery store in the wider regional area, that demand increases to 52,000 square feet to 86,600 square feet.
2013 Households 16,014Avg Household Income $103,881Total Household Income $1,663,576,884Annual HH Growth Rate through 2035 0.3%% Expenditures on Groceries 5.50%Grocery Demand $91,496,729Est. Sales $76,068,000Current Retail Void $15,428,729Est. Sales / SF $450
Current Retail Void (S.F.) 25,714 - 42,858Additional Demand from Household Growth (S.F.) 35,013Total Demand 2035 (S.F.) 51,974 - 86,624Source: Claritas, Census of Retail Trade for CO, ULI, ArLand
Page 29
12.18.13
4.4 Retail Supply Characteristics
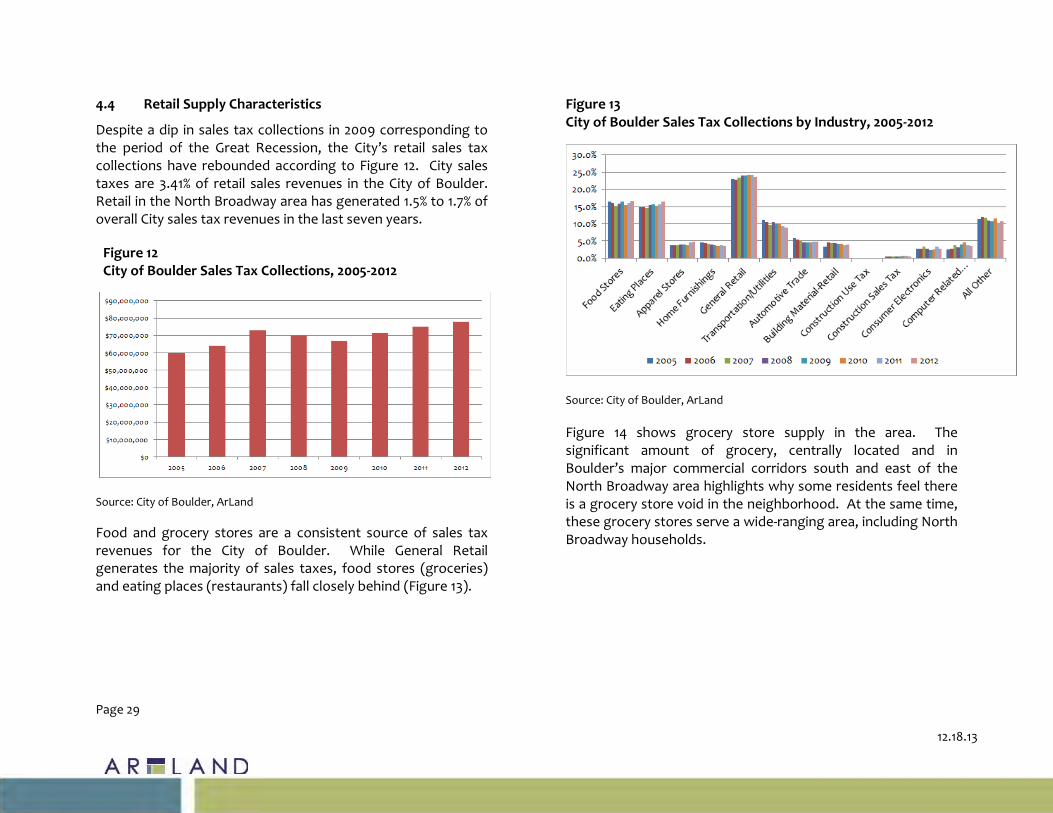
Despite a dip in sales tax collections in 2009 corresponding to the period of the Great Recession, the City’s retail sales tax collections have rebounded according to Figure 12. City sales taxes are 3.41% of retail sales revenues in the City of Boulder. Retail in the North Broadway area has generated 1.5% to 1.7% of overall City sales tax revenues in the last seven years.
Source: City of Boulder, ArLand Food and grocery stores are a consistent source of sales tax revenues for the City of Boulder. While General Retail generates the majority of sales taxes, food stores (groceries) and eating places (restaurants) fall closely behind (Figure 13).
Figure 13 City of Boulder Sales Tax Collections by Industry, 2005-2012
Source: City of Boulder, ArLand Figure 14 shows grocery store supply in the area. The significant amount of grocery, centrally located and in Boulder’s major commercial corridors south and east of the North Broadway area highlights why some residents feel there is a grocery store void in the neighborhood. At the same time, these grocery stores serve a wide-ranging area, including North Broadway households.
Figure 12 City of Boulder Sales Tax Collections, 2005-2012

Page 30
12.18.13
Figure 14 Grocery Stores and Supermarkets
Source: ArLand
Table 16 Grocery Stores and Supermarkets
ID Name Address City
Est. Grocery
SF1 Safeway 3325 28th St. Boulder 77,0002 Whole Foods Market 2905 Pearl St. Boulder 77,0003 King Soopers 1650 30th St. Boulder 58,0004 Safeway 2798 Arapahoe Ave. Boulder 55,0005 King Soopers 6550 Lookout Rd. Boulder 55,0006 Walmart Neighborhood Market 3303 30th St. Boulder 52,0007 King Soopers 4600 Table Mesa Dr. Boulder 52,0008 Safeway 4800 Baseline Boulder 50,0009 Target (with Fresh Grocery) 2800 Pearl St. Boulder 30,00010 Natural Grocers/Vitamin Cottage 2355 30th St. Boulder 25,00011 Sprouts 2525 Arapahoe Ave. Boulder 25,00012 Sprouts 2950 Baseline Boulder 24,00013 Alfalfa's Market 1651 Broadway St. Boulder 20,00014 Niwot Market 7980 Niwot Rd. Longmont 15,00015 Lucky's Market 3960 Broadway St. Boulder 14,00016 Ideal Market (Whole Foods) 1275 Alpine Ave. Boulder 14,00017 Trader Joe's 28th & Walnut. Boulder 14,00018 Whole Foods 2584 Baseline Dr. Boulder 10,00019 St. Vrain Market, Deli, Bakery 455 Main St. Lyons 3,00020 Steamboat Mtn. Natural Foods 454 Main St. Lyons 3,000
TOTAL 673,000Source: ArLand, City of Boulder
Page 31
12.18.13
4.5 Impact of New Supermarket / Grocer
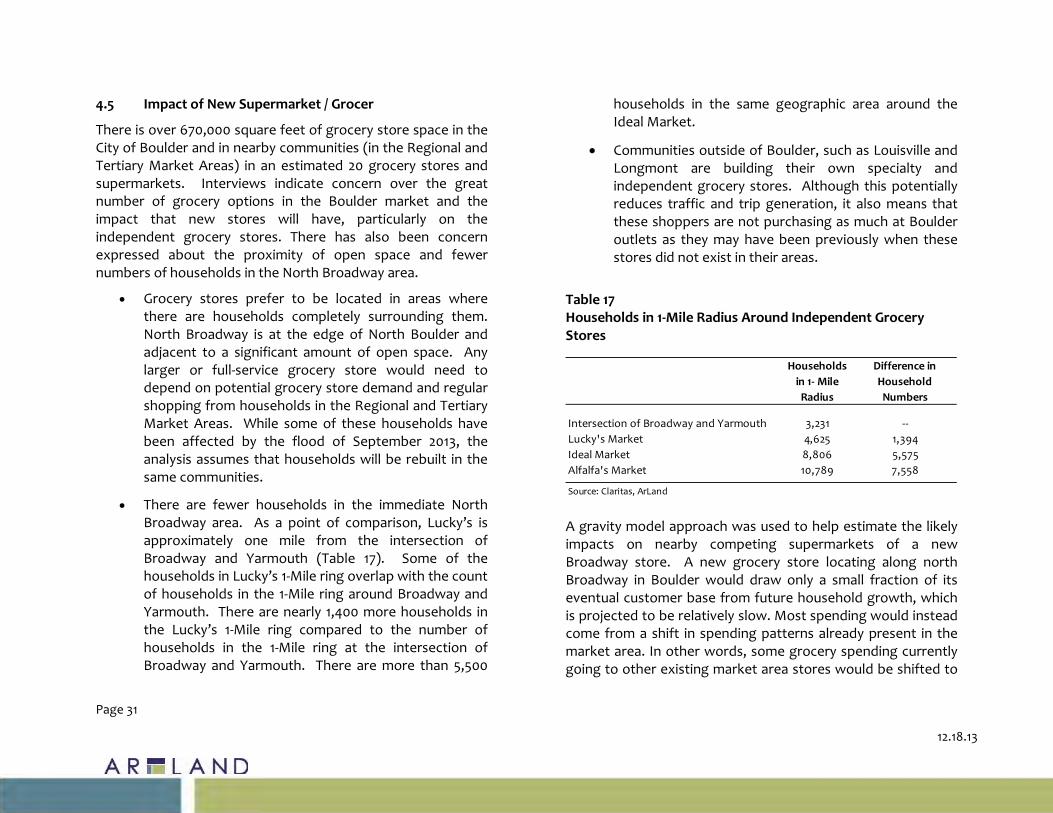
There is over 670,000 square feet of grocery store space in the City of Boulder and in nearby communities (in the Regional and Tertiary Market Areas) in an estimated 20 grocery stores and supermarkets. Interviews indicate concern over the great number of grocery options in the Boulder market and the impact that new stores will have, particularly on the independent grocery stores. There has also been concern expressed about the proximity of open space and fewer numbers of households in the North Broadway area.
• Grocery stores prefer to be located in areas where there are households completely surrounding them. North Broadway is at the edge of North Boulder and adjacent to a significant amount of open space. Any larger or full-service grocery store would need to depend on potential grocery store demand and regular shopping from households in the Regional and Tertiary Market Areas. While some of these households have been affected by the flood of September 2013, the analysis assumes that households will be rebuilt in the same communities.
• There are fewer households in the immediate North Broadway area. As a point of comparison, Lucky’s is approximately one mile from the intersection of Broadway and Yarmouth (Table 17). Some of the households in Lucky’s 1-Mile ring overlap with the count of households in the 1-Mile ring around Broadway and Yarmouth. There are nearly 1,400 more households in the Lucky’s 1-Mile ring compared to the number of households in the 1-Mile ring at the intersection of Broadway and Yarmouth. There are more than 5,500
households in the same geographic area around the Ideal Market.
• Communities outside of Boulder, such as Louisville and Longmont are building their own specialty and independent grocery stores. Although this potentially reduces traffic and trip generation, it also means that these shoppers are not purchasing as much at Boulder outlets as they may have been previously when these stores did not exist in their areas.
Table 17 Households in 1-Mile Radius Around Independent Grocery Stores
A gravity model approach was used to help estimate the likely impacts on nearby competing supermarkets of a new Broadway store. A new grocery store locating along north Broadway in Boulder would draw only a small fraction of its eventual customer base from future household growth, which is projected to be relatively slow. Most spending would instead come from a shift in spending patterns already present in the market area. In other words, some grocery spending currently going to other existing market area stores would be shifted to
Households in 1- Mile Radius
Difference in Household Numbers
Intersection of Broadway and Yarmouth 3,231 --Lucky's Market 4,625 1,394Ideal Market 8,806 5,575Alfalfa's Market 10,789 7,558
Source: Claritas, ArLand

Page 32
12.18.13
a new Broadway store based, primarily, on convenience and product selection.
This spatially-driven technique begins with an over-simplification of the competitive environment. Only households within the Regional Market Area are considered as potential customers and only those stores within the market area are considered as potential destinations. Obviously, household shopping behavior differs, however, of all the retail categories, households tend to regularly enjoy going to a neighborhood grocery store or supermarket out of habit and familiarity. It is assumed that households will allocate their supermarket spending across the handful of competing stores based solely on the distance to each store and the size (attractiveness) of each store. The model is termed a gravity model because, gravitational “pull” decreases as a function of the distance. Thus, nearby stores are much more likely to attract spending than more distant stores of a similar size.
Table 18 shows the current estimated share of market by the grocery stores in the Regional Market Area. It should be noted that these are estimates based on size of store, location of market area households and their willingness to spend at these stores based on the geographic proximity to the store.
Table 18 Current Market Area Grocery Store Estimated Share of Sales in the Regional Market Area
It is assumed that there is over $90 million of grocery store spending available across these stores in the market area based on households, incomes and spending of households in the market area. Stores and other grocery venues outside of the immediate market area at grocery stores not listed also receive some market area spending.
Assuming that a new store of approximately 40,000 square feet was constructed in the market and assuming that a new store would fare relatively well in capturing market share, Table 19 assumes that all existing stores would be equally impacted5. In reality, Lucky’s would potentially be hardest hit, given its geographic proximity and smaller size. However, in this more conservative model, all stores would suffer equally with a 20% decrease in sales. Lucky’s has estimated that a new store would affect revenues negatively by up to 25%. 5 A 40,000 square foot store was used as an example as it represents the average size of the stores listed in the table.
Name Estimated SFEst. Sales from
Market Area Market
Area Share Lucky's Market 13,000 $9,618,000 11%Ideal Market 14,000 $8,400,000 9%Safeway 77,000 $34,650,000 38%Walmart Nbhd. Mkt. 52,000 $23,400,000 26%New Market Area Store 0 $0 0%Stores Outside Market Area $15,428,729 17%Total 156,000 $91,496,729 100%Source: ArLand

Page 33
12.18.13
Table 19 Potential Sales Impact of New Grocery Store
4.6 North Broadway Inventory
Table 20 summarizes the retail tenants currently in the North Broadway area by type of business in the Holiday and Uptown Broadway developments. While there are a few scattered retail establishments west of Broadway, they tend to be construction and auto oriented establishments. Some of the artists located in these areas sell from their locations, although the majority of them do not use these locations as primary retail outlets. The newer retail space in the area (east of
Broadway) houses office, business and personal services, and restaurant uses. There is a small specialty retail niche in fitness and cycling serving patrons of the sport. North Broadway,
particularly Amante’s Coffee, is a convenient de-facto gathering spot for cycling enthusiasts. Table 20 Commercial Establishments North to South (in the Uptown Broadway and Holiday Developments)
Name Estimated SF
Est. Sales from Trade Area Households
Market Area Share
of SalesChange in Sales
Lucky's Market 13,000 $7,739,269 8% -20%Ideal Market 14,000 $6,759,187 7% -20%Safeway 77,000 $27,881,647 30% -20%Walmart Nbhd. Mkt. 52,000 $18,829,164 21% -20%New Market Area Store 40,000 $17,872,501 20% N/AStores Outside Market Area $12,414,960 14% -20%Total 196,000 $91,496,729 100%Source: ArLand
Business Name CategoryAcqua Fleur Day Spa Personal ServiceMIG Winston Business ServiceSpruce Café RestaurantWinter & Company Business ServiceAlice Cohen CPA Personal / Business ServiceNorth Boulder Studio Personal / Business ServiceOblique Business ServiceNorth Boulder Chiropractic Personal / Business ServiceLawrence & Associates CPAs Personal / Business ServiceCaledonia Wealth Management Personal / Business ServiceProto's Pizzeria RestaurantIron Works Fitness WellnessRed Pine Studios Business ServiceBacco Mozzarella Bar RestaurantAmante Coffee RestaurantBoulder Cycle Sport Wellness4580 Restaurant RestaurantSubway Restaurant1st Bank Personal / Business ServiceFasCat Coaching / Performance Cycling Wellness / RetailGamers Guild RetailChicago Hair Personal ServicePupusas Restaurant RestaurantBoulder Cycle Sport Wellness / RetailBoulder Dental Arts Personal ServiceRed Tail Wellness WellnessSource: ArLand

Page 34
12.18.13
The Holiday Neighborhood
The Holiday neighborhood is a 324-unit community in the North Broadway area that was developed by Boulder Housing Partners in partnership with seven developers and a variety of non-profit organizations on a site in the City that was originally slated for development as big box retail.
Main Street North is a mixed-use development at the gateway to the Holiday Neighborhood with buildings and uses arranged around Broadway and Yellow Pine Avenue. The non-residential space is comprised of approximately 55,000 square feet. Commercial tenants include Spruce Confections, Proto's Pizzeria, and other shops and offices. Well-defined common areas provide places for café seating and outdoor gathering. The architecture provides a traditional "Main Street" two-story scale. Office and retail spaces range in size from as small as 630 square feet to as large as 4,000 square feet.
Uptown Broadway
In 2003, while the Holiday neighborhood was building out, Uptown Broadway also commenced development on the east side of Broadway and Yarmouth. The development is comprised of approximately 40,000 square feet of mixed use commercial space and 233 residential units. Although the residential development was successful, the retail struggled for a variety of reasons. The commercial part of the development was subsequently converted to retail condos. Although approximately 800 square feet remains to be sold and is currently vacant, it has taken a number of years for the commercial space to be fully occupied.
Speculation on why the commercial development has been unsuccessful include: lack of critical mass of retail in the area,
zoning restrictions on size of retail and lack of easy parking, among other reasons.
4.7 Retail Demand without an Anchor
The relatively slow absorption of the Uptown Broadway neighborhood has been a concern and recently approved projects such as Violet Crossing and Westview have little or no ground floor commercial space. Without a strong retail anchor, more area households, or activities to help bring people into the neighborhood to shop, future retail demand would tend to be more limited with slow absorption of space.
Tables 21 and 22 shows potential retail demand in the neighborhood or 1-Mile Market Area.

Page 35
12.18.13
Table 21 Retail Demand in 1-Mile Market Area
2013 Households 3,231Avg Household Income $111,816Total Household Income $361,277,496Annual HH Growth Rate 0.7%
Category% Retail
Expenditures [1]
Demand (retail
potential) Est. SalesCurrent Retail
Void ($) Est. Sales / s.f.
[2]Current Retail
Void (s.f.)
Additional Demand
from Household
Growth (s.f.) (22-yr)
Total Demand 2035
Convenience GoodsGrocery Stores 5.50% $19,870,262 $9,613,571 $10,256,691 $450 22,793 7,604 30,396Specialty Food Stores 0.30% $1,075,811 $578,638 $497,173 $350 1,420 529 1,950Beer, Wine, and Liquor Stores 0.42% $1,503,268 $4,084,463 -$2,581,195 $300 -- 863 --Health & Personal Care Stores 1.96% $7,072,874 $3,375,045 $3,697,829 $350 10,565 3,480 14,045
Shopper's GoodsGeneral Merchandise Stores 5.53% $19,978,872 $5,727,434 $14,251,438 $500 28,503 6,881 35,384Furniture & Home Furnishings Stores 1.02% $3,679,110 $735,036 $2,944,074 $250 11,776 2,534 14,311Clothing and Clothing Accessories 2.13% $7,679,414 $2,781,159 $4,898,255 $250 19,593 5,290 24,883Sport. Goods, Hobby, Book, & Music 0.92% $3,333,981 $1,324,352 $2,009,629 $250 8,039 2,296 10,335Miscellaneous Store Retailers 1.14% $4,117,314 $3,486,893 $630,421 $250 2,522 2,836 5,358
Food Services & Drinking PlacesFull-Service Restaurants 2.13% $7,691,247 $4,309,595 $3,381,652 $350 9,662 3,784 13,446Limited-Service Eating Places 1.86% $6,713,916 $1,541,576 $5,172,340 $325 15,915 3,557 19,472Special Food Services 0.36% $1,289,823 $1,266 $1,288,557 $250 5,154 888 6,043Drinking Places (Alcoholic Bevs.) 0.22% $786,411 $1,156,314 -$369,903 $250 -- 542 --
Durable GoodsAuto Parts, Accessories, and Tires 0.68% $2,472,788 $352,252 $2,120,536 $250 8,482 1,703 10,185Bldg Mater., Garden Equip. & Supply 4.42% $15,954,058 $11,483,217 $4,470,841 $300 14,903 9,158 24,061Electronics & Appliance Stores 0.98% $3,529,721 $492,881 $3,036,840 $250 12,147 2,431 14,579
Total (without Groceries) 24.05% $86,878,606 $41,430,121 $45,448,485 148,681 194,050
Source: Claritas, Census of Retail Trade for CO, ULI, ArLand
[1] Demand percentages based on national and state averages
[2] National averages per Urban Land Institute, research and retailer interviews

Page 36
12.18.13
Table 22 Unmet Retail Demand by 2035 (Non-Grocery)
The analysis shows demand for 85,000 to 195,000 square feet in retail categories appropriate for the North Broadway area. This demand figure does not include grocery store demand.
Categories most appropriate would include:
• Specialty Food Stores • Health and Personal Care • Furniture and Home Furnishings • Clothing and Accessories • Sporting Goods, Hobby, Books and Music • Miscellaneous Store Retailers • Full-Service Restaurants • Limited Service Eating Places
Without the addition of catalyst activities, public investment, or anchor tenants to help galvanize commercial activities, potential lease up would likely be slow and incremental. 4.8 Retail Demand with an Anchor
The 8.5 acre Armory site is relatively small for a conventional grocery store anchored center; however, it is among a handful of North Broadway sites that have the potential to generate interest among retailers for a grocery store co-location. Grocery stores in conventional centers typically have square footage requirements, and developers of these centers typically add additional retail and commercial services within these centers to help with financial feasibility. Smaller, more urban grocery stores also have square footage requirements and developers of these centers will often add additional retail and commercial uses because there is strong interest among many retailers in co-location with a grocery store. For example, the planned urban grocery store at 20th and Chestnut in the
1-Mile Market
Area (s.f.) 2013
1-Mile Market
Area (s.f.) 2035
Convenience GoodsSpecialty Food Stores 1,420 1,950Beer, Wine, and Liquor Stores -- --Health & Personal Care Stores 10,565 14,045
Shopper's GoodsGeneral Merchandise Stores --- ---Furniture & Home Furnishings Stores 11,776 14,311Clothing and Clothing Accessories 19,593 24,883Sport. Goods, Hobby, Book, & Music 8,039 10,335Miscellaneous Store Retailers 2,522 5,358
Food Services & Drinking PlacesFull-Service Restaurants 9,662 13,446Limited-Service Eating Places 15,915 19,472Special Food Services 5,154 6,043Drinking Places (Alcoholic Bevs.) -- --
Total 84,646 194,488
Source: Claritas, Census of Retail Trade for CO, ULI, ArLand

Page 37
12.18.13
LoDo neighborhood of downtown Denver has an estimated 10,000 to 20,000 square feet of additional retail and office.
Banks, restaurants, dry cleaners, and other personal and business services like to be located next to grocery stores. Grocery stores may bring in a householder 2 to 3 times per week, at which time the householder is taking care of other business during the same shopping trip. A grocery store on the east side of Broadway would help support commercial activities on the Armory site and on the east side of the street, primarily.
4.9 Retail Market Analysis Conclusions
While there is grocery demand, there are trade-offs and questions regarding the feasibility of a grocery store in the neighborhood.
• Grocery stores prefer to be located in areas where there are households completely surrounding them. North Broadway is at the edge of North Boulder and adjacent to a significant amount of open space. This situation will not change.
• There is concern about the limited number of households in the North Broadway area. Additional households would make retailers more comfortable about a potential North Broadway location.
• There is ongoing concern about cannibalization of the existing and popular Lucky’s market. It is located about one-mile from the Broadway and Yarmouth intersection. Depending on the market niche of a new grocery store, the impact analysis and conversations estimate that the impact would be in the range of 20 to 25% of overall store revenues at Lucky’s. Given the thin margins under which grocery stores operate, Lucky’s could find it difficult to survive under such conditions.
• Lucky’s is currently not interested in a Lucky’s annex or a smaller store in the North Broadway area at this time.
• Locally-based retailers, in particular, are anxiously awaiting the effect of the Walmart and Trader Joe’s openings.
• Other alternatives include a smaller convenience store, offering limited fresh produce, a food co-op, and the like. There are two very limited stores in the neighborhood, which may potentially be a base for expanding neighborhood offerings.
• Grocery store development on the Armory site could propel demand for commercial development adjacent to or in easy proximity to the grocery store. However, the North Boulder Subcommunity Plan and current zoning on the Armory site are not conducive to construction of a conventional grocery store.
• Commercial development likes corners for easy accessibility. Lee Hill and Broadway is the closest intersection to the Armory, and there is development already slated for, or currently existing on these corners. However, without additional activities supporting redevelopment west of Broadway, it is unclear whether Armory redevelopment would be enough to help propel or bolster commercial redevelopment, mid-block or further south on the west side of Broadway.
• There is demand for an additional 85,000 to 195,000 square feet in retail categories appropriate for the North Broadway area, including specialty retail, restaurants, and the like. In order to facilitate lease-up, there would be the need to add catalyst activities or anchor tenants to the area such as art galleries (in conjunction with local artists), destination restaurants, entertainment offerings, brewpubs, musical venues, etc.

Page 38
12.18.13
V. OFFICE AND LIGHT INDUSTRIAL ANALYSIS This section examines the office and industrial market in the North Broadway area. There is over 500,000 square feet of non-residential space between Violet and US 36 along Broadway. Of the commercial uses at the Holiday development and Uptown Broadway neighborhoods, small office space has been the most successfully developed. Office helps promote day time activity in residential neighborhoods, and, in the case of Boulder, helps accommodate personal and business services, and other creative industries. There is a significant amount of industrial, warehouse, and storage space west of Broadway. Several of the industrial areas offer smaller, inexpensive space for artists and other craftspeople.
5.1 Office Development Trends
Downtown Boulder, which is a creative office hub for the region, is experiencing very low vacancy rates, resulting in high gross rental rates of $30 to $35 per square foot (plus parking), pushing some companies to examine other more inexpensive areas in Boulder. While there are lower lease rates on the US 36 corridor and in Longmont, many companies would prefer to remain in the City as they grow.
As of the second quarter of 2013, the Boulder office vacancy rate at an estimated 6.5% is substantially lower than the 16.5% vacancy rate in the metropolitan Denver region, as a whole. There is about 11 million square feet of office space in Boulder. Recent vacancy rates have declined and there has been recent positive absorption in the market. Office development activity has picked up recently in preparation for an improving economy (Figure 15). There are several projects currently in the planning stage including a potential 70,000 square foot mixed use redevelopment project, including office at 30th and Pearl, and a 45,000 square foot office-flex property at 3200-28th Street.
0.0%
2.0%
4.0%
6.0%
8.0%
10.0%
12.0%
14.0%
-150,000
-100,000
-50,000
0
50,000
100,000
150,000
200,000
250,000
20093Q
20094Q
20101Q
20102Q
20103Q
20104Q
20111Q
20112Q
20113Q
20114Q
20121Q
20122Q
20123Q
20124Q
20131Q
20132Q
Net Absorption Delivered Inventory Vacancy %
Figure 15 Boulder Office Development Trends
Source: CoStar

Page 39
12.18.13
Both the Holiday neighborhood and Uptown Broadway include office space. Studio Mews near Zamia Street within the Holiday neighborhood was intended to be an energizing mix of unique buildings and uses with residences above artists' studios and shops. The studios and shops have been converted to primarily office uses, although many of the businesses are in the creative realm. Dakota Ridge west of the Broadway corridor also has some office space.
5.2 Office Development Potential
The market for office is a function of growth or change in jobs among those industry sectors that typically occupy office space. Table 23 describes the current jobs in the Regional Market Area, which is the market area examined for office space potential. Approximately 250 jobs are forecast for this area.
After calculating the number of potential new jobs during this time period, an estimate was made of the portion of the workforce in industry categories and their requirements for office space. While categories such as Construction and Wholesale Trade may occupy very little traditional office space, industries such as Professional and Technical Services, for example, have an estimated high percentage of their work force in office space. Future jobs growth in the area indicates demand of approximately 25,000 to 30,000 square feet of office space, much of which would be in a small office configuration, similar to what has been developed in the area. Interviews also indicate that increasing demand for small office space has been seen as the economy returns. Studio Mews, which was originally intended to be artists’ studios in the Holiday neighborhood, does include a few artists, however, many of the users are more office-oriented.

Page 40
12.18.13
Table 23 Potential Office Space Demand, 2010-2035
Industry
Estimated Regional Jobs
2013 % Jobs
% of Total Jobs
Estimated to be Office
New Regional Market
Area Jobs 2013-2035 Office Jobs
Market Area Office Space S.F. Needs[1]
Agriculture, Forestry, Fishing and Hunting 73 0.5% 10% 1 0 32Mining 40 0.3% 60% 1 0 105Utilities 33 0.2% 15% 1 0 22Construction 669 4.7% 5% 12 1 146Manufacturing 773 5.5% 10% 14 1 338Wholesale Trade 636 4.5% 10% 11 1 278Retail Trade 1,424 10.1% 10% 25 2 622Transportation and Warehousing 58 0.4% 10% 1 0 25Information 150 1.1% 70% 3 2 459Finance and Insurance 667 4.7% 95% 12 11 2,768Real Estate and Rental and Leasing 559 4.0% 95% 10 9 2,319Professional and Technical Services 1,433 10.1% 95% 25 24 5,946Management of Companies and Enterprises 44 0.3% 95% 1 1 183Administrative and Waste Services 413 2.9% 15% 7 1 271Educational Services 855 6.0% 25% 15 4 934Health Care and Social Assistance 2,578 18.2% 65% 45 29 7,319Arts, Entertainment, and Recreation 415 2.9% 15% 7 1 272Accommodation and Food Services 961 6.8% 15% 17 3 630Other Services, Ex. Public Admin 1,058 7.5% 15% 18 3 693Public Administration 1,299 9.2% 60% 23 14 3,404Total 14,138 100.0% 43% 247 107 26,763Source: Claritaas, DRCOG, ArLand[1] CoStar estimates 250 square foot per office job

Page 41
12.18.13
5.3 Current Industrial Uses
Boulder has long been a jobs hub for the region, although there is mounting concern about the lack of quality industrial and warehouse space to accommodate growing and innovative businesses. According to interviews and the Xceligent database, lease rates for the industrial space west of Broadway are $14-$17 per square foot on a modified gross or gross basis for spaces fronting Broadway and $9-$12 per square foot towards the back of the properties. Some of the industrial space, particularly at 4593 and 4949 Broadway, are properties conducive to dividing up into 400-500 square foot spaces, attractive to artists and others in creative, start-up industries. The artists’ spaces are primarily rentals.
There are older auto-related uses interspersed among the industrial and retail uses west of Broadway. There are a number of properties used primarily for storage. There are infrastructure and maintenance issues throughout the properties. Access, parking, setbacks, etc. are inconsistent throughout the west side of the street. According to interviews, the heavier industrial uses have slowly moved out. While there have historically been more auto-oriented uses, those uses are not as lucrative anymore and have been replaced by storage, which is. Namaste Solar, the solar panel developer and installer, has their headquarters in the area. 5.4 Industrial Demand
While there is demand for industrial and light industrial flex uses in the Boulder market and the North Broadway area, further significant development of this use is precluded by the mixed use development that has already occurred in the area, and the lack of available space to adequately accommodate Boulder businesses that have outgrown their ‘start-up’ space.
Although there are more technical definitions, in general, industrial space refers to traditional industrial space with manufacturing or other uses which either need a lot of space or are generally not as desirable in a mixed use environment. Light industrial flex space is intentionally flexible where some of the space can be used for office and other space can be used for light manufacturing and warehousing. This type of space can be popular among startups because of its relatively low cost.
The market for industrial space is a function of growth or change in jobs among those industry sectors that typically occupy industrial space. Table 24 describes the current jobs in the Regional Market Area and the share that are estimated to be industrial jobs.
After calculating the number of potential new jobs forecast to be created by 2035, an estimate was made of the portion of the workforce in industry categories with requirements for light industrial flex space. While there is estimated demand for up to 30,000 square feet in the North Broadway area, it is not anticipated that traditional industrial space for significant processing or manufacturing is appropriate in the North Broadway area. Flexible commercial space appropriate for startups, businesses like Namaste Solar, light research and development, artist’s space and potentially some quasi-retail space, would be targeted light industrial users.

Page 42
12.18.13
The 1995 North Boulder Subcommunity Plan highlights the importance of the industrial uses to the area acknowledging that additional commercial and industrial space provides opportunities for people to work close to where they live. It also acknowledges the importance of upgrading the Broadway corridor, at the same time, stating that light industrial businesses are extremely valuable and should not be displaced. Rents are relatively low compared to the rest of the City, and the current uses generate relatively fewer vehicle trips per square foot of building area. The 1995 Plan also suggests the design of buildings which are structurally flexible to accommodate a mix of uses over their expected lives.
Table 24 Potential Light Industrial Flex Demand
Industry
Estimated Regional Jobs
2013 % Jobs
% of Total Jobs
Estimated to be in
Industrial Space
New Regional Market
Area Jobs 2012-2035
Industrial Jobs
Market Area Industrial Space
S. F. Needs[1]Agriculture, Forestry, Fishing and Hunting 73 0.5% 60% 1 1 306Mining 40 0.3% 25% 1 0 70Utilities 33 0.2% 85% 1 0 196Construction 669 4.7% 50% 12 6 2,630Manufacturing 773 5.5% 90% 14 12 4,862Wholesale Trade 636 4.5% 90% 11 10 12,000Retail Trade 1,424 10.1% 10% 25 2 995Transportation and Warehousing 58 0.4% 80% 1 1 973Information 150 1.1% 30% 3 1 629Finance and Insurance 667 4.7% 5% 12 1 350Real Estate and Rental and Leasing 559 4.0% 5% 10 0 244Professional and Technical Services 1,433 10.1% 5% 25 1 626Management of Companies and Enterprises 44 0.3% 5% 1 0 17Administrative and Waste Services 413 2.9% 40% 7 3 1,299Educational Services 855 6.0% 5% 15 1 336Health Care and Social Assistance 2,578 18.2% 5% 45 2 1,013Arts, Entertainment, and Recreation 415 2.9% 3% 7 0 98Accommodation and Food Services 961 6.8% 3% 17 1 227Other Services, Ex. Public Admin 1,058 7.5% 20% 18 4 1,664Public Administration 1,299 9.2% 20% 23 5 2,042Total 14,138 100.0% 21% 247 51 30,576Source: DRCOG, CoStar, Claritas, ArLand[1] Square foot per job estimates vary from 450 to 1,200 sf depending on industry

Page 43
12.18.13
5.5 Artists
The NoBo Art District is an artist-run organization dedicated to promoting the artists and creative industries in the North Boulder area. The District has a significant and growing presence in the North Boulder community. The district is not an officially designated arts district at this time, but is pursuing that designation through City and State channels. According to the district, there are over 225 artists and others in the creative industries clustered along Broadway and the North Boulder area. On the west side of Broadway, there is a particularly strong clustering of artists at 4949 Broadway and 4593 Broadway. Figure 16 North Broadway Artists and Creatives
Source: NoBo Art District

Page 44
12.18.13
The district’s initiatives include:
• Sponsoring First Friday openings and other events to support local artists;
• Offering PaintAbout classes and scholarships to support access to contemporary art and education;
• Hosting art projects and other community events like the NoBo Little Libraries at various venues within the neighborhood; and,
• Initiating the creation of a vital street-scape enlivened by sculpture, lighting and other art through the creation of a public arts program.
The group is interested in getting more involved in the “branding” of North Broadway through sculpture, lighting, painting of the street, and other activities which would not only help their respective businesses, but would also help brand and distinguish the area from the wide variety of other commercial districts in Boulder. A further description of potential artists’ involvement is discussed in the Opportunities section.
Source: NoBo Art District

Page 45
12.18.13
5.6 Potential Office and Industrial Demand Capture
Through 2035, the analysis forecasts demand for approximately 20,000 to 25,000 square feet of office and 30,000 to 35,000 square feet of light industrial / flex space. However, demand capture is going to be dependent on overcoming some of the barriers to redevelopment historically seen in the area and taking advantage of potential area opportunities. This will be discussed in the next sections on Barriers and Next Steps.

Page 46
12.18.13
VI. NORTH BROADWAY BARRIERS
The potential demand for commercial uses in the North Broadway area is described below, taking into consideration local and regional market trends, feedback from area real estate experts, developers, brokers and property owners. Competitive development projects and trends over the past ten years were examined. As with any plan and ultimate development project, the actual mix and timing of development is going to vary based upon a variety of factors, including the needs of the property owners, the development and financial markets, the timing and cost of public sector improvements and assistance, if any, and level of private sector investment.
6.1 Village Center
One of the primary challenges to the development of a Village Center in the North Broadway area is the perception in the community and in the market that it took a significant amount of time for the existing commercial to absorb. At the same time, there isn’t as much retail space to activate the area as is desirable.
• The North Broadway area is on the edge of the City, so it is not an area that many Boulder residents will traverse as they are commuting or running other errands, although some residents of outlying communities do commute through the area. While there are some bicycling shops that are a destination for those in the bicycling community, there aren’t other significant clusters of destination retailers or an anchor tenant like a supermarket. Although restaurants like 4580 and Proto’s have been successful in attracting people throughout the City, other destinations in the area are few and far between.
• There has been a discussion of a grocery anchored retail shopping center to help activate the retail spaces in the North Broadway area. North Boulder community members have expressed some interest in a grocery store, but over time they have become somewhat split on the level of support for the concept of a new store. While a grocery store with a conventional layout could serve as an anchor tenant for the area, its locational benefit would generally accrue to other retail establishments and intersections closest to the center first.
• While there appears to be market demand for a smaller convenience or grocery store, there has been a longstanding concern on the part of the grocers that there aren’t enough households to support another independent local market primarily serving the local neighborhood. Lucky’s is very close and it is estimated that another grocery store in the area similar to Lucky’s would negatively impact the store.
• Smaller grocery stores tend to carry higher priced merchandise and, although helpful for convenience items, would not be attractive for significant shopping among those with more modest incomes in the neighborhood. The introduction of the Walmart neighborhood grocery store to the Diagonal Plaza area detracts from the ability of a North Broadway grocery store to serve the local neighborhood.
• The width of Broadway, lack of pedestrian crossings, and the traffic volume are also barriers to retail synergy at the Yarmouth and Broadway intersection that includes the Village Center. Property owners on the west side of Broadway have observed that patrons

Page 47
12.18.13
of restaurants on the east side of Broadway will often park on their properties and then have to cross Broadway to get to their destinations.
6.2 Public Storage
One of the more significant challenges to the redevelopment of the West Broadway area is the number of self-storage units in the area. This particular use has been successful in the area and the growth of smaller residential units and commercial space in the immediate area has contributed to the demand. It can provide significant cash flow to property owners and can be a difficult land use to transition from because it can be financially lucrative.
Conservatively, self-storage facilities generate an estimated $8 per square foot (NNN) basis6. Gross revenues average over $1 per square foot based on posted price lists for storage facilities in the area. Assuming a capitalization rate of 7.75%, this translates to $103 per square foot for the building as well as the land on which the building is located. Any redeveloper would need to pay this price in order to acquire land in this area, in addition to paying for other needed public improvements. While prices fluctuate depending on Broadway frontage, prices appear to be in line with recent sales. The Namaste Solar building and land’s value is estimated at $115 to $125 per square foot, per Boulder County assessor’s records.
6.3 Flood Plain
Another difficult issue is the need for significant flood mitigation prior to redevelopment near Yarmouth and Broadway, west of Broadway. The estimated costs in the area west of Broadway, encompassing the commercial area fronting Broadway, are about $2.7 million. There is also an additional approximately $3.1 million in estimated building flood mitigation costs. The September 2013 floods have triggered the need to reevaluate the flood plain maps in the area. These estimates may change.
While there may be funds available through the Federal Emergency Management Agency (FEMA) for flood recovery cost reimbursement, it is unlikely that FEMA would reimburse the City for floodplain related redevelopment costs. Redevelopment in the flood plain would need to occur in a manner consistent with FEMA, State, and City of Boulder floodplain development regulations. 6.4 Annexation
Some of the properties west of Broadway in the Village Center area have not been annexed into the City. These properties are all County enclaves. The North Boulder Subcommunity Plan particularly encourages annexation of these County enclaves for a variety of reasons including provision of urban services, given that the properties are already developed at urban densities. Proposed annexations with additional development potential need to demonstrate community benefit consistent with Boulder Valley Comprehensive Plan (BVCP)
6 NNN is a triple net lease where, in addition to the stipulated rent, the lessee assumes payment of all expenses associated with the operation of the property including taxes, insurance and other operating expenses, including costs of maintenance and repair.

Page 48
12.18.13
policies. Annexations that are most strongly encouraged are those that resolve an issue of public health without creating additional development impacts.
VII. NORTH BOULDER SUBCOMMUNITY PLAN UPDATE OPPORTUNITIES Despite the barriers described throughout this study, there are significant opportunities in the North Broadway market area. The community is interested in ensuring that the intent of the existing plan for the area is carried out, with some modifications to address changing circumstances and existing conditions.
While there has been a longstanding desire for a grocery-anchored center to not only help define and to assist with the commercial activities in the community, other action items could bolster the existing retail and address some of the redevelopment barriers in the area.

Page 49
12.18.13
Table 25 North Boulder Subcommunity Plan Update Opportunities
Existing Condition Opportunity
Village Center
The Village Center is focused on the intersection of Broadway and Yarmouth, some of which overlaps with the high hazard flood zone.
The Village Center geographic area should be re-evaluated to align future land use options with the area’s market realities and post-flood assessment and conditions.
Grocery Anchor
Retailers and others are waiting to see how the grocery situation pans out in Boulder. This analysis was conducted as the Walmart Neighborhood grocery recently opened to large crowds. Trader Joe’s has yet to open as of the date of this report. While the new retailers will generate a surge in interest in the short term, and while sales and traffic will return to previous levels, there will be some impact on stores and/or merchandise directly competitive with the new offerings.
Grocery stores need rooftops and there is ongoing concern with local service providers about the general lack of rooftops in the North Broadway area. Any number of additional rooftops would help support a convenience type of market. Several North Boulder community members have expressed interest in a convenience oriented grocery in the market area. Working with the existing stores to expand their offerings (there are two very limited stores offering some fresh foods in the North Broadway area), partnering with a food co-op, farmers market, or other alternative form of supplying fresh groceries to the neighborhood would help address demand and have a much more limited impact on other area grocers.

Page 50
12.18.13
Existing Condition Opportunity
NoBo Art District
There are an estimated 225 artists and others in creative industries in the North Broadway area with a strong interest in creating / supporting a brand for the area that reflects their presence and helps bolster their creative activities. This group has indicated a strong interest in being involved in the development of public improvements and related activities. There is also inexpensive industrial space in the North Broadway area, some of which hasn’t been well-maintained. Some of the spaces are work spaces for artists. They are sized small enough to be inexpensive rentals.
Incorporate artists into the public process. Evaluate potential for a plan for funding that incorporates art into public spaces and improvements. The NoBo Art District can potentially sponsor competitions for branding ideas and other public improvements with City assistance and other support. While artists are located throughout the area, they tend to be clustered in the more inexpensive industrial spaces on Broadway. Most of the artists do not own their spaces. Work with developers to ensure that inexpensive live / work and other flex space is available to help support the arts community in the North Broadway area.
Other Anchor Tenants / Users
Need for additional “anchors” to support / bolster commercial activities in the area
Branding activities, commercial space to support the brand, working with local brokers and developers to identify additional anchors such as art galleries (in conjunction with local artists), destination restaurants, entertainment offerings, brewpubs, musical venues, and the like. Identify local retailers, based on the categories identified, in other parts of the City or region, with a potential interest in expanding. Continue to support small office space users.

Page 51
12.18.13
Existing Condition Opportunity
Street Improvements
Although Broadway can be busy, it is not a major arterial. However, it can be wide and intimidating to cross. Yarmouth doesn’t go through on the west side of Broadway yet. There is some willingness among area property owners for a Yarmouth extension across Broadway to the west.
Evaluate opportunities to create an intersection at Yarmouth and Broadway (or at the center of the geographically defined Village Center, if refined) to enhance the Village Center concept in the 1995 North Boulder Subcommunity Plan. Study the need for a pedestrian signal or other alternatives to ensure that pedestrians can traverse Broadway safely at Yarmouth, or other key intersections that may advance the Village Center concept. Work with the property owner on the west side of Broadway at Yarmouth to ensure that a Yarmouth extension would complement potential future redevelopment plans.
Public Storage And Other Potential Redevelopment Sites
Public storage sites are scattered throughout the area west of Broadway and there are a variety of other underutilized sites in the area west of Broadway including auto service centers, etc.
The economics of public storage are difficult to address. In the short term, there are locations in front of some of the storage and/or industrial facilities that could facilitate some redevelopment. During the North Boulder Subcommunity Plan update and with the help of developers currently located in the neighborhood, reach out to property owners on the west side of Broadway regarding their redevelopment interests and potentials.
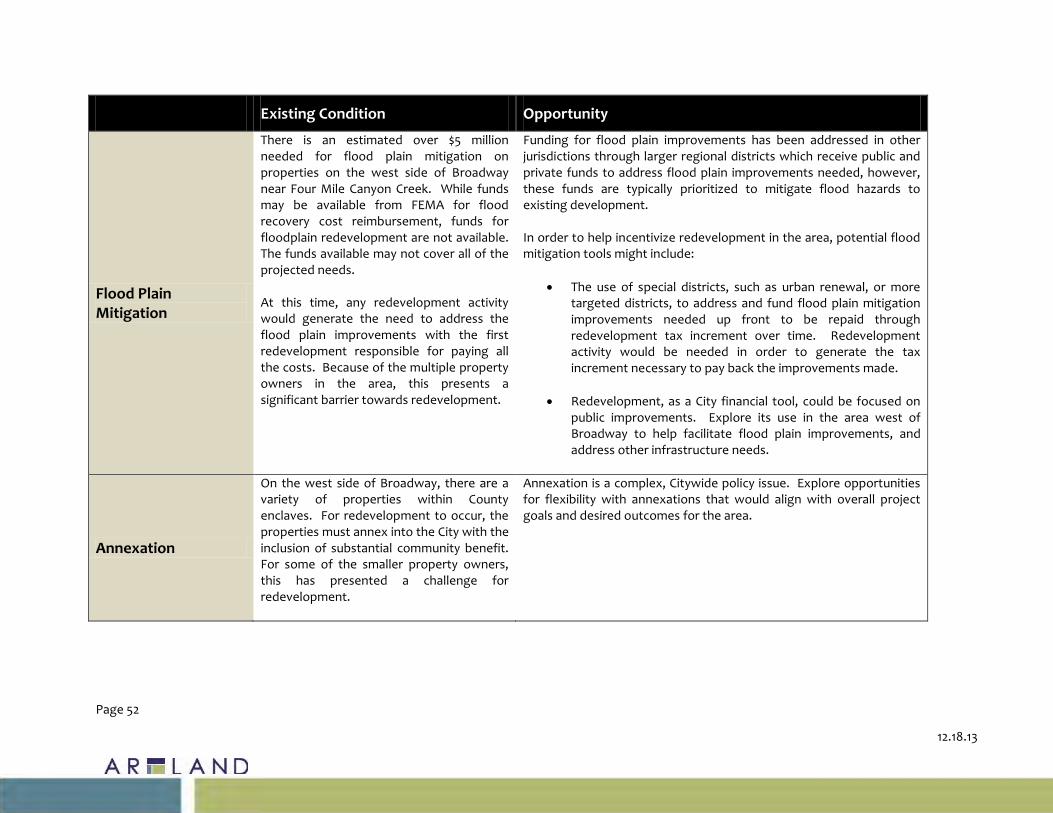
Page 52
12.18.13
Existing Condition Opportunity
Flood Plain Mitigation
There is an estimated over $5 million needed for flood plain mitigation on properties on the west side of Broadway near Four Mile Canyon Creek. While funds may be available from FEMA for flood recovery cost reimbursement, funds for floodplain redevelopment are not available. The funds available may not cover all of the projected needs. At this time, any redevelopment activity would generate the need to address the flood plain improvements with the first redevelopment responsible for paying all the costs. Because of the multiple property owners in the area, this presents a significant barrier towards redevelopment.
Funding for flood plain improvements has been addressed in other jurisdictions through larger regional districts which receive public and private funds to address flood plain improvements needed, however, these funds are typically prioritized to mitigate flood hazards to existing development. In order to help incentivize redevelopment in the area, potential flood mitigation tools might include:
• The use of special districts, such as urban renewal, or more targeted districts, to address and fund flood plain mitigation improvements needed up front to be repaid through redevelopment tax increment over time. Redevelopment activity would be needed in order to generate the tax increment necessary to pay back the improvements made.
• Redevelopment, as a City financial tool, could be focused on
public improvements. Explore its use in the area west of Broadway to help facilitate flood plain improvements, and address other infrastructure needs.
Annexation
On the west side of Broadway, there are a variety of properties within County enclaves. For redevelopment to occur, the properties must annex into the City with the inclusion of substantial community benefit. For some of the smaller property owners, this has presented a challenge for redevelopment.
Annexation is a complex, Citywide policy issue. Explore opportunities for flexibility with annexations that would align with overall project goals and desired outcomes for the area.

Page 53
12.18.13
Existing Condition Opportunity
Armory
Developers have entered into an agreement with the Colorado Department of Military and Veterans Affairs (DMVA) to explore the purchase and redevelopment of the Army National Guard Armory. Various site plans and options have been discussed with the community over a number of years. North Boulder community members have expressed some interest in a grocery store, but over time, they have been somewhat split on the level of support for the concept of a new store.
Without additional improvements to the intersection of Yarmouth and Broadway, including improvements that would make Yarmouth a true intersection, it is unlikely that commercial redevelopment at the Armory would benefit the Village Center area. At the same time, allowing limited retail development at the Armory should not negatively impact the market potential for commercial development at the Village Center area since its challenges, in some respects, are unrelated. At this point in time, without a significant number of additional households in the North Broadway area, the addition of a neighborhood or full-service grocery store would potentially impact the viability of other grocery stores including Lucky’s, which is less than one mile from Broadway and Yarmouth. With or without the grocery anchor, there has also been an ongoing desire for neighborhood commercial services. While there is a market, their potential viability would be strengthened, in general, with an increased number of households in the North Broadway area.

North Boulder Subcommunity Action Plan 1 Appendix 2: Community Input Summary October 7, 2014
APPENDIX 2: 2013-2014 COMMUNITY INPUT SUMMARY
This appendix summarizes community input on the North Boulder Subcommunity Plan from small group discussions, two public
meetings in October 2013 and April 2014, and an open house in September 2014. The table below organizes community input into
key themes and how the Action Plan or parallel city initiatives are addressing it.
Key Themes from Community Input
Action
Plan Items
(if applicable)
Notes
Gen
era
l C
om
men
ts
1995 Plan’s Vision is Still Valid The 1995 Plan’s overarching vision for the North Broadway area is still valid, including:
Strengthening established areas;
Redevelopment with a focus on walkable, connected, and mixed use places;
A diversity of housing choices;
New community and civic attractions;
Improved design quality;
An integrated network of parks and open space; and
Preservation and enhancement of sensitive environmental areas
All The plan update focuses on a new generation of action items that further advances the 1995 Plan’s vision.
Action Oriented Approach
Support for an action oriented approach that further implements the 1995 Plan’s
vision.
Geographic Focus Support for the targeted geographic focus on the North Broadway area as this is the area with the most potential for change.
All The plan update focuses on the North Broadway area (see Figure 1: Study Area).
Keep North Broadway Eclectic Concerns about North Broadway losing its “funkiness” and eclectic atmosphere as redevelopment occurs.
All The Action Plan has arts and placemaking strategies throughout. Additionally, the Action Plan recommends protections for service industrial and arts oriented land uses, which have contributed towards the area’s eclectic appeal.
North Broadway as Human Scale Place
Support for North Broadway as a pedestrian friendly, human-scaled main street, as presented in the 1995 plan.
Transportation, Access, and Parking Action
Items (2.1-2.8)
The Action Plan recommends streetscape improvements and pedestrian and bicycle
enhancements. Additionally, the 1995 Plan’s vision and policies support this concept.
Art
s an
d P
lacem
akin
g
Co
mm
en
ts
Strong Support for NoBo Arts District 1.1-2.2, 2.5, 3.1-3.3
The Action Plan contains numerous recommendations to support the growing arts scene in North Boulder. The city’s Library and Arts Department is also launching two key related initiatives – the Community Cultural Plan and Creative Districting
project in 2014 that will evaluate opportunities for the city to support formation of local creative districts like NoBo. The city is also supporting formation of NoBo Arts District including meeting facilitation, utilizing a consultant to support the
district, and other forthcoming support.
US 36 and Broadway Gateway Continued support for community process to design a new vision for this area.
1.7 The 1995 Plan’s vision for the US 36 and Broadway gateway reflects a “focus on landform and landscape design rather than on any architectural treatment or
statement.” The Action Plan process indicated support for a new type of gateway that includes placemaking and integration with a mobility hub.

North Boulder Subcommunity Action Plan 2 Appendix 2: Community Input Summary October 7, 2014
Key Themes from Community Input
Action
Plan Items
(if applicable)
Notes
CDOT has expressed interest in maintenance facilities in the gateway area. City
staff is currently working with CDOT to evaluate other locations for maintenance facilities that would meet their needs and the city’s wishes for the gateway area.
Losing Affordable Artists and Service Industrial is a Key Concern
The community is concerned that as redevelopment continues to occur along North Broadway, the affordable spaces that have accommodated artists, creative industries, and service industrial businesses will disappear.
3.1
The Action Plan recommends strategies to further this priority throughout. The
city’s Library and Arts Department is also launching the Community Cultural Plan that will evaluate opportunities to advance these strategies. The 1995 Plan also supports “methods to strengthen service industrial areas” that yielded related
zoning code changes in the late 1990s to implement the plan that are still in effect.
Arts Anchor Land Use An arts anchor land use would bolster the economic vitality of the area and
foster the growing North Broadway arts community.
1.6 The North Broadway Market Study (see Appendix A) also supports this strategy, and the Action Plan addresses this. The Community Cultural Plan will also evaluate
opportunities to advance this strategy.
Arts-Oriented Placemaking Along North Broadway Support for arts oriented placemaking along North Broadway as an opportunity
for branding, to unify the area, and support the growing North Boulder arts scene. This could include streetscape improvements and art integrated into infrastructure (e.g., artistic crosswalks).
1.2-2.2; 2.5, 3.3 The Action Plan recommends these strategies throughout, including the potential for a more comprehensive strategy with a North Broadway Streetscape Plan.
Creative Signage The city’s sign code may be too rigid and should support creative signage to
foster the growing North Boulder arts scene and placemaking opportunities. This includes business and arts district identification signs and directional signs to the businesses less visible off of Broadway.
1.2 The Action Plan contains specific recommendations addressing this.
Live/Work Support for more allowances for live/work units, particularly for artists.
1.1 The Action Plan contains specific recommendations addressing this.
North Broadway Streetscape Plan
Support for a comprehensive evaluation and strategies to achieve a variety of goals for North Broadway around arts, placemaking, walkability/bikeability, and access management.
2.5 The Action Plan contains specific recommendations addressing this.
Tra
nsp
ort
ati
on
, A
ccess
, an
d P
ark
ing
Transportation Connectivity
The 1995 Plan’s vision for connectivity has not been fully realized—there are several missing multi-modal connections.
Transportation,
Access, and Parking Action Items (2.1-2.6)
The 1995 Plan’s connections plan is still being implemented as redevelopment
occurs. Specific new or enhanced transportation connections are discussed below.
Specific Transportation Connections
East-West Pedestrian Connectivity
Broadway is a major barrier to cross with the existing limited pedestrian crosswalks.
2.1 The Action Plan recommends evaluating new or enhanced crossings at the
Broadway and Yellow Pine, Yarmouth, Violet, and Lee Hill Road intersections and as improved lighting and safety measures at the Fourmile Canyon Creek path Broadway underpass.
North-South Bicycle Connectivity
Bicycling along or near Broadway north-south is challenging and needs improvement because of traffic speeds and lack infrastructure to make it easy
and safe.
2.2 The Action Plan recommends related enhancements and the city’s GO Boulder staff
is evaluating separated or buffered bicycle facilities along North Broadway that has been included in the 2014 Transportation Master Plan. The Violet Crossing
development at the northeast corner of Violet and Broadway has also facilitated a connection across Fourmile Canyon Creek.
Boulder Meadows Bicycle/Pedestrian Connection
The community supports a direct bicycle and pedestrian connection from this mobile home park west to the Uptown mixed use development. No connection currently exists without going north to Yarmouth.
2.1 The 1995 Plan (connections plan) shows two proposed connections west to the
Uptown mixed use area. The Action Plan further recommends implementing this connection.

North Boulder Subcommunity Action Plan 3 Appendix 2: Community Input Summary October 7, 2014
Key Themes from Community Input
Action
Plan Items
(if applicable)
Notes
Signalized Intersection at Broadway and Yarmouth
Support for a new signalized intersection at this location.
2.1, 2.5 The 1995 Plan calls for a stoplight at this intersection that redevelopment on the
west side of Broadway at Yarmouth will facilitate. The Action Plan further emphasizes facilitating this connection.
Placemaking and Transportation Infrastructure
Support for placemaking with infrastructure – e.g., artistic crosswalks.
2.1-2.2 The Action recommends art integrated with transportation infrastructure.
North Broadway B-Cycle The community supports an additional B-Cycle station(s) in the North Broadway
area to link in with the growing citywide network of stations.
2.2 The Action Plan contains specific recommendations addressing this.
Broadway Traffic Calming
The community agrees North Broadway is wide an intimidating to cross, in part because of high speed traffic.
1.7, 2.1-2.2, 2.5 The Action Plan contains a recommendation for a North Broadway Streetscape
Plan that should include traffic calming measures.
North Broadway Streetscape Plan
Strong support for a comprehensive evaluation and strategies with a streetscape plan to achieve a combination of goals around walkability, placemaking, etc.
2.5 The Action Plan contains specific recommendations addressing this.
Inadequate Parking
The community indicated that there may be inadequate parking for businesses in the redeveloped areas along North Broadway (e.g., Main Street North, Uptown). While there is support for minimizing parking lots from an urban design
standpoint, these businesses depend on patrons arriving by car.
2.6 The Action Plan contains specific recommendations addressing this, first starting
with a parking utilization analysis to better understand the problem before identifying potential solutions.
Enhanced Transit The community supports extending the SKIP terminus north away from the
current location at the homeless shelter. The current terminus feels unsafe and does not integrate well into the neighborhood. The community also supports evaluating a new transit route along US 36 east connecting the North Broadway
area to the commercial areas along 28th Street and Boulder Junction.
2.3-2.4 The Action Plan and Transportation Master Plan contain specific recommendations addressing this.
Lan
d U
se a
nd
Develo
pm
en
t
Affordable and Special Needs Housing
The community supports the diversity of housing choices that has emerged
since 1995, but there may now be an overconcentration of affordable and/or special needs housing in the North Boulder Subcommunity.
The citywide Comprehensive Housing Strategy (CHS) will develop a new generation of housing
strategies and related implementation tools. The city’s Housing Division has been actively involved with the North Boulder Subcommunity Plan and these comments have been communicated to them to consider with the CHS project. Community members support the mission of special needs housing but have
stated there is an overconcentration in North Boulder.
Higher Density Housing Mixed opinions on whether or not higher density housing along Broadway
between Violet and Sumac is desirable.
The Boulder Valley Comprehensive Plan and Comprehensive Housing Strategy (which includes an opportunity site component) will further evaluate the feasibility of new housing.
View Protection
Mixed opinions on the west side of Broadway regarding avoiding the “canyon” effect with redevelopment and view protection to the west.
The city’s zoning code has several mechanisms to support view protection. First, the citywide charter
limiting any building to a maximum of 55 feet in height, and all zone districts abutting the west side of Broadway have floor area ratio (FAR) standards, setbacks, and open space requirements.
Village Center
Mixed opinions on the 1995 Plan’s concept of keeping the retail and mixed use areas concentrated in one area along North Broadway, on both sides of the street, while others have stated that North Broadway should act more as a
corridor.
The ongoing flood mitigation and mapping process will delay evaluation of the village center.
Annexations Community support for providing more flexibility and fostering annexations of
county enclaves in the study area.
3.2 Action Plan Item 3.2 directly addresses this item.

North Boulder Subcommunity Action Plan 4 Appendix 2: Community Input Summary October 7, 2014
Key Themes from Community Input
Action
Plan Items
(if applicable)
Notes
Anchor Land Use
The community (and the North Broadway Market Study) support the importance of an anchor land use to bolster the economic vitality of the area.
1.6 Action Plan Item 1.6 directly addresses this item. The current proposal for the
Armory site’s redevelopment includes several new tenants, one of which is a destination brew pub that may act as a future anchor.
Armory Site
The Armory site is an important opportunity, but the community has mixed opinions on what is appropriate there. However, there is strong support for integrating the arts and placemaking into the site and an urban, walkable concept.
The Armory site developer has submitted plans to redevelop the site as a mixed use project with
residential, retail, artists space, and a brew pub. To date, the concept has received strong community support. The proposal is slated for Planning Board and City Council hearings in 2014.
Large Scale Retail The community continues to support neighborhood scale retail, rather than any “big box” type of retail, consistent with the community’s vision with the 1995
Plan.
The current zoning along North Broadway restricts retail uses to a neighborhood scale. This zoning has been in place since the late 1990s as a 1995 Plan implementation item. The Business Main Street is intended to be the highest density area along North Broadway (part of the Village Center) and requires
a use review for any retail over 20,000 square feet, and the MU-1 district that includes the Armory site and Main Street North only allows retail in a mixed use building, and no more than 5,000 square feet of retail.
Affordable Service Industrial and Artists Space The community supports strategies to address protection and promotion of affordable artists, service industrial, and live-work space.
1.1, 3.1 Action Plan items 1.1 and 3.1 directly address this item.
Library Community support for a library, which was an implementation item from the
1995 Plan.
Since the Action Plan project has begun, the NoBo Corner Library has opened at Violet and Broadway.
Need Outdoor Space for Events Community support for more outdoor gathering areas for events.
The Main Street North and Uptown developments have some outdoor public plaza areas, and the redevelopment plan submitted for the Armory includes substantial outdoor plaza areas.
Public Safety Issues with Homeless Shelters The community expressed safety concerns, particularly as it relates to the transient population in the North Broadway area.
2.1 Action Plan Item 2.1 (Fourmile Canyon Creek underpass lighting) directly addresses this. City staff has also relayed these concerns to the existing homeless shelter and soon to be completed transitional housing at 1175 Lee Hill, and learned that both
facilities have detailed codes of conduct that addresses behavior of their tenants outside of the shelter in the North Broadway area. The City’s Police Department has also been involved with this project, having supported community meetings to
listen and respond to these concerns.
General Improvement District Community support for exploring formation of a North Broadway improvement
district to support numerous goals throughout this Action Plan.
3.3 Action Plan Item 3.3 directly addresses this.
Flood Mitigation
Community support for financing Fourmile Canyon Creek flood mitigation improvements, in addition to already completed sediment removal and cleanup after the September 2013 floods.
The city has applied for Community Development Block Grant (Disaster Recovery) funding through the
Colorado Resiliency Planning Grant Program for a “West Fourmile Canyon Creek Annexation Study and Design Charrette” that includes the Ponderosa Mobile Home park.

North Boulder Subcommunity Action Plan 5 Appendix 2: Community Input Summary October 7, 2014
GROWING UP BOULDER INPUT
A sample of child, youth and parent perspectives (2013-2014)
For the North Boulder Subcommunity Plan Update, Growing Up Boulder used a variety of methods to ask young people and
their parents, “What do you like or not like about North Broadway? What are the key opportunities for that area?”
While the information collected is not part of a scientific study, we believe the views shared here still represent meaningful
input into the Update, and they include an important subset of the community that is often not represented at public meetings
or in more traditional forms of outreach.
Community Engagement methods employed include:
Drawing sessions with elementary and middle school children and the public meeting on October 30, 2013 (n=3
elementary school children, n=1 middle school student)
Questions for parents of young children via Boulder Rock’n Moms Yahoo Group post on November 7, 2013 (n=24)
Questions for high school student acquaintances via email on November 7, 2013 (n=4)
“City-on-a-wall” activity and individual drawings with Foothill Elementary School 1st grade class on May 5, 2014 (n=24)
Answers varied significantly by age group. Below is a summary of the most frequently requested design elements, in descending
order of importance.
Group Ideas/Design elements
Elementary School
children
Fields, trees and flowers
Zoo or space for animals
Toy store
Youth (middle
school + high
school)
Increased safety at the Front Range/Broadway bus stop
Safer paths to walk and ride bikes in North Boulder
Parents
Indoor play space
Water features (pool and/or splash pad)
Inexpensive restaurants
General store
Shade on playgrounds
The rest of this document provides the detailed information collected from children, youth and families.

North Boulder Subcommunity Action Plan 6 Appendix 2: Community Input Summary October 7, 2014
Design elements
Elementary
School
Middle
School
High
School
Parents of
children
n=56 27 1 4 24
Businesses
Ice cream/frozen yogurt 2 2
Inexpensive restaurant 1 6
healthy drive through 1
"Fun" store like Apple Store 1
Toy store 5 1
Artisan shop 1
museum 1
mall 1
general/small grocery store 2 6
Candy store 4 1
Book store 1
winding pedestrian shopping areas 5
Clothing store 1
Recreation
zoo and/or space for animals 11
water features (pool and/or splash pad) 2 1 8
playground 2 1
indoor play area 1 1 1 14
teen hangout 3
skate park 2
library--regular-sized 5
improve Holiday playground 5
outdoor community space 1
shade on playgrounds 6
interactive trail 1
movie theater 1
fields, trees and flowers 17 1 1 2
Transportation 1
Safer paths to walk and bike (Dakota Ridge to Broadway scary) 2 3 2
Ecopass 1
Increased safety at Front Range/Broadway stop 4 3
More walkable destinations 3
Safety
Increased safety in Dakota Ridge 2 2
Complete responses
During the October 2013 North Boulder Subcommunity Meeting, facilitators worked with several elementary school and
middle school students to collect their ideas for the North Boulder Subcommunity Plan. The instructions were:
1. Draw a picture of North Broadway which answers these questions:
a. (All ages) What do you see yourself doing in the main North Boulder downtown area? What would it look
like, smell like, feel like? With whom would you be doing it? How would you get there? (Bus, bike,
scooter, walk, car, roller skates, skateboard?)
b. (First grade and older) Would the North Broadway area be a corridor (one straight line of stores down
Broadway) or more of a town center (spread out to side streets perpendicular to Broadway and on
Broadway)?
These are the children’s responses:
Elementary School Child (n=3)
Recreational spaces o A place to play hide and seek and tag
o Field

North Boulder Subcommunity Action Plan 7 Appendix 2: Community Input Summary October 7, 2014
o Play on tree trunks
o A pool in our neighborhood (Dakota Ridge) or nearby (three kids requested this)
o Park designed with giant candy corn sculptures (giant candyland playground)
o toys outside, both big and little
o zoo
Businesses
o toy store
o Candy store
Transportation o Better places to bike and walk; too scary to bike from home in Dakota Ridge down Broadway to shops
there
Middle School Youth
Business:
o Bookstore
Transportation
o Bike path
Recreational spaces o Park with a field
o More trees
High School Youth (n=4)
Mara Mintzer, Dakota Ridge neighborhood resident, sent the following email to high school students she knew within the
neighborhood:
I am working with the City of Boulder to update their plans for how North Boulder/North Broadway (the area near and across
from Protos and Spruce Confections) should develop. I want to make sure the voices of teens are heard in this plan. If you
have a few minutes, could you please send me your answers to the following questions, and I’ll pass your ideas along to the City:
What do you like or not like about North Broadway? What would make it more teen-friendly?
Your answers might include ideas for new businesses, places to hang out, things to do, or ways to get around. You might also
think about how the National Guard Armory could redevelop.
Thank you in advance for taking the time to answer these questions. Your answers will help shape the future of your town!
Also, feel free to share these questions with your friends living in North Boulder.
These are their responses:
It would be really cool to have a safe bike route from Dakota ridge to Protos area. Also, the location of the bus stop
can sometimes be scary due to the characters that hang around there, and is such a bummer if you want to go into
town via RTD by yourself (with out friends/ parents). Making that environment more secure feeling. I think if some
popular business came to attract more people, there would be others around and teens would feel safer. I'll pass this
along to some of my other North Boulder friends!
A small business for local artists would be cool. Just a place where people can sell things they have made (art, toys,
jewelry etc.).
More ice cream or frozen yogurt shops—a place like Sweet Cow, where the ice cream is good and you can hang out on the astroturf lawn; also would be good to be able to hold an event there
Less professional/adult places and more new and fun places, like the Apple Store
The homeless shelter: it feels very uncomfortable to be near there at the bus stop, but additional businesses would
make the area feel safer. I think it makes sense that homeless people share our community, but I don’t want our
community to be dominated by them to the point that I don’t feel safe. I think they should treat Boulder with the
same respect that other citizens have (i.e. don’t talk too loudly or rudely on the bus or in the library). I don’t feel
safe taking the bus in the night or the early morning. The city should have an Ecopass for everyone so that more
people take the bus and it feels more populated. I would also feel better if there were more police around and/or if
there were a police person that the whole neighborhood knows.
In the Dakota Ridge neighborhood: I walk my dog early in the morning (5:45 am) and sometimes late at night, and I don’t feel safe. I saw a guy peeing in the bushes on 5th Street, I have seen people tagging the neighborhood, and I have
seen people sleeping on the benches.
The strip club is a real problem! Turn that area into an RTD hub.
Parent perspective (n=24)

North Boulder Subcommunity Action Plan 8 Appendix 2: Community Input Summary October 7, 2014
On 11/7/2013, Mara Mintzer posted the following question to “Boulder Rock’n Moms Yahoo Group,” a group utilized by a
large number of parents (usually of small children) in the Boulder area:
North Boulder families: What do you like or not like about North Broadway? What are the key opportunities for that area?
What actions can the City take in the new flood context?
The City of Boulder is updating the North Boulder Subcommunity Plan, and they are looking for feedback from North Boulder
residents about how the area of North Broadway (near, around and across from Protos) should continue to develop over the
next 20 years. I want to make sure the voices of families and children are heard in this process. Please send me your ideas
and the ideas of your children (no idea is too ridiculous) so that I can send them along to the City. I work for Growing Up
Boulder (www.growingupboulder.org), in case you are wondering why I am asking these questions! Thank you in advance for
your time.
Twenty-four parents responded:
There have been many voices to have some sort of water feature in north boulder and i completely agree. Although, I
would take it a bit further than a splash pad... Boulder is lacking in quality outdoor aquatics! We have lived in a
number of communities and this is the first where there isn't a great outdoor pool! We need a 50 meter/yard
swimming pool, diving well, baby pool, and kid water play area. Please help bring this to north boulder!! I have seen
other communities combine it with a skating rink and that would be great for skating and hockey... but please help
with the pool!
We would also love to see a play area for young kids. This town does a great job with fitness for adults and older
kids, but there is hardly anything for young kids and practically nothing for toddlers and babies. A Gymboree or
Peekadoodle would be amazing!
More restaurants, please!! I know it may never happen but how about a healthy drive through? :) A Starbucks! We are always driving out of this community because there just aren't enough options. Believe me, if there were - we would
be there bc it;s no fun to drive an hour round trip with little ones for food in the evening!
I would love an arboretum or a botanic garden. The Chicago Botanic Garden is located in a suburb of Chicago so
maybe we could have something like that here :) They had amazing train garden in the summer and moved it inside
for the winter months (holiday theme). Kids loved it and it was amazing!!
There need to be more teen hangouts. It would be great to have a skate park for teens in North Boulder. Scott Carpenter park is too crowded, with BMX bikes and skateboarders competing for space. Many of the skater kids
hang out at Installation, a skating shop next to Whole Foods. The owner, Raoul, lets kids hang out there because
they have nowhere else to go.
A pool complex! With a splash pad play area, a kiddy pool and a big pool, and hot tub. Either public or private pool
and tennis club.
Indoor play space, with an indoor playground for crummy days. Look at
Peekadoodle or Urban Recess as models. Both in San Francisco.
I think relocating the Bus Stop strip club would be a great idea in a neighborhood where single family home prices are
fetching upwards of 650k. I would assume that plan is in the works but know in general its better not to assume
anything. Just my 2c. :)
Yes! A huge splash pad in North Boulder Park.
Another Lucky's grocer (sorry to whomever owns Lucky's; unless, they want a new project;) where the ROTC lot is
(didn't it sell?).
A pavilion at the community garden to block sunlight
BURY the POWER-LINES ON GRAPE!!!
I would love to see a library branch in north boulder.
I think an indoor play space for the winter would be great and more storefronts, restaurants, shops would be great.
I REALLY want to encourage folks to RESPOND TO THIS! In Boulder, suggestions from the community are often
taken very seriously and actually implemented.
My five-year-old's preschool class at Boulder Journey School, recently partnered with Growing Up Boulder on
submitting ideas to revamp the Boulder Civic Area (around bandshell/Library/Dushanbe Teahouse/Boulder Creek).
Not only did the City Council and designers listen to the kids and take their ideas seriously, the winning bid for the
design consists mostly of ideas that came FROM THE KIDS! How cool is that?! When Boulder has an amazing,
functional, family-friendly Civic Area to enjoy, you'll have a bunch of five-year-olds (among others) to thank :).
A library would be great. And I second the indoor play space, retail storefronts, more cafés & restaurants. I'd love to
see it all laid out in an interesting way, though. Like a winding pedestrian shopping area that one enters into, rather
than just straight rows of shops along Broadway, would be cool. I'd love to hear other folk's ideas.

North Boulder Subcommunity Action Plan 9 Appendix 2: Community Input Summary October 7, 2014
Me too - an indoor play space (so lacking in Boulder) would be GREAT! There are so many families up here. And yes,
more storefronts and placing for us to wander and visit during the day.
I live in the Holiday neighborhood and think the big playground/park that was built down the street from Protos is
terrible. It has no slides or swings or great climbing structures. It doesn't really make sense - Holiday is so community
oriented and has so many families - but b/c the playground is pretty useless, no families with kids congregate there. I
think it would make a HUGE difference to upgrade the park so people could have a place for kiddos of all ages to
come and be with each other.
My husband would like to see: at least one crosswalk and some kind of interactive trail for kids. Also, a playground with a splash pad or water play of some kind. There's so little shade up north because all the trees
are so young. It's hot up there!
So ladies my husband and I are considering opening an indoor playspace and would love to get feedback from people
as to the type of things they are looking for. I have a concept but would love more input.
Are people looking for a place to drop kids and come back or a fun place to hang while their kids play? Any input
appreciated.
It is so true- I don't understand that playground at all! We've visited it a couple of times when we stopped to check
out the little library right there and my kids were done after about 2 minutes. They were more interested in running
around the large grassy area.
For the indoor playspace, this is a great model. I've been to the one in Oakland, CA several times and loved
it. http://www.tumbleandteacafe.com/
There used to be a place in N. Boulder called Playgrounds - from what I understand, it was a profitable business, but
the people who started it had to move back east for family reasons and no bought it from the.
Me personally, I love to hang with other parents and I am not comfortable dropping my kiddos off somewhere - so I
am looking for a nice space that serves tea/snacks/etc - has lots of places for mommas and papas to chat and lots of
safe, soft toys for kiddos to play on (think play - the new grandrabbits place), but with wifi, tea, food and tables for
parents that don't have to supervise their kids 100% of the time. On that note, I'd also put out some really strong
rules about kiddos who do need supervision and have parents that don't provide it, impacting everyone else, but
that's another story.
I would be happy to share more about playgrounds and/or other ideas (in my pre-children life, I was a pretty sharp
marketing/business chick)...
I had a similar idea a while back, but I wasn't prepared to raise funds, do a biz plan, etc., back then. When I visit my
parents in Holland, MI, I take my daughter to Deanna's Playhouse, and I based my idea on
it: http://lifeservicessystem.org/deannasplayhouse/index.html
While Deanna's is a Christian-based, non profit combination play space and Parenting Place with wonderful parenting
support and resources, I wanted to create just the play space. But now that Parenting Place is closed, perhaps this is
an opportunity for you to pick up where they left off and provide similar services as well as a play space.
Deanna's is huge, and is sponsored by local businesses with a $5 per person entry fee, keeping it accessible to lower
income families. There are different activities and areas for babies and kids up to age 5, including an art room, music
room and dress-up/stage. I think the liability of drop-off places is pretty big, and you would have to have highly trained
employees, but it sure is convenient for parents. Deanna's is not drop-off, and in fact, they encouraged parents to play
with their kids and not sit on the sidelines. You would have to decide if you want to keep the price low to allow
economic diversity, or if you want it to be a premium destination. I would love for a play place to have a breadth of
activities from non-electronic media to creativity zones to indoor play structures. Birthday parties too!
My husband and I were just talking about this because we were in Westminster at JumpCity. There isn't a lot of
indoor options for kids in Boulder. You have to go to the burbs. I looked into this once as business to possibly open.
The challenge was the amount of space needed and the CRAZY prices here for leasing a building like that. The math
just did not add up. Especially having to account for the slower summer months. I'm wondering if a space like that
could get a bit of a price break? But, if offered some parenting services, maybe some grants would help.
I think it would be awesome to have some sort of play place that was indoor and outdoor. If we are throwing out our
ultimate wish list. I would love to have a super awesome indoor and outdoor pool. North Boulder Rec is pretty good,
but it would be great to have something like that Indoor, but than an awesome outdoor pool for the summer.
Something with fountains, slides, etc.
But, something like that at our end of town would bring people from other parts of Boulder to our hood to eat,
drink, shop, etc.
Does anyone know if there is going to be any type of community meeting or anything to discuss?
Mara- I love that you posted this question here, you know I have an opinion:)

North Boulder Subcommunity Action Plan 10 Appendix 2: Community Input Summary October 7, 2014
o An outdoor pool. Please. There are plenty of people from the South in the N. Boulder hoods and we just
want our dang neighborhood pool like we had when when we grew up. A modern one like at Colorado
Athletic Club. Not a horrible 1970's pool. Not directly in Dakota Ridge but close too it :)
o Indoor play space- would love to have a Little Monkey business somewhere, just not sure if I want in N.
Boulder. I don't want N. Boulder to become big box-ish or chain store-ish. Commercial but like W. or E.
Pearl.
o Walkable. N. Boulder destinations need to be walkable and connected by walking paths.
o Something that encapsulates outdoor living, but not necessarily another playground. An amphitheater and
park like Chastain Park in Atlanta.
o Trees. Plant lots and lots of trees. Again a Southern thing.
o More restaurants and small cafes.
o Less industrial feel. Something to balance all the auto shops and storage units and U-haul establishments.
Happy to co-exist but they are an industrial eye sore in my opinion. Not to make it too Stepford but I do
in fact like that Connecticut towns require business and storefronts to adhere to a certain aesthetic for
signage, building facades, etc. N. Boulder is the place to do that if Boulder ever did.
I agree with a lot of what has already been said but would like to throw in my support for the following:
o improvement of Holiday Park with better play structures;
o an outdoor pool or at least a splash pad/fountain/water play area for kids (maybe at Foothills Community
Park?);
o an indoor play area would also be great (there used to be a place in Denver called The Village that had an
indoor play area with an attached cafe that served food, coffee, wine and beer, etc.; it also held music, art,
and other classes for kids and cooking classes for adults. Parents had to stay with their kids but I think a
place where you could drop your kids off would also be great);
o grocery store;
o more retail, including restaurants. A family-friendly burger-beer place would be awesome (something like
Southern Sun up here!);
o library branch (more than what is going in at Yarmouth and Broadway).
That's great you are considering opening a play space in N. Boulder. I had some feedback from indoor play
spaces that I have bad experiences at to try to know what parents AREN'T looking for:
o Parents that don't supervise their children, who are on their electronic devices and oblivious to
everything else going on around them. I would almost say you should have a no-electronic device rule
at the door.
o Parents that have a kid that is too sick to go to daycare, or who has been sent home from daycare and
bring their visibly sick kid (mucus running down their face, coughing, etc.) to the play space. The play
space needs to be vigilant about cleaning.
o Playspaces that have dangerous or not maintained pieces. I went to bouncetown one time in Longmont
and one of the bounce castles was not inflated enough, and no employees or parents were supervising
the kids, and one kid managed to push a stick up tube, down inside the bounce castle and then got
himself stuck face down in the hole and almost suffocated before I had to go get his parents/store
employees to get him out.
o The JCC has a very simple tumbling room with lots of padded shapes that you can re-arrange and
climb over which i really like.
My husband and I feel we need:
o More shade at all the parks, especially over the play structures
o Water features, such as a pool and splash pad (most other Boulder neighborhood have this as part of their
HOA or in the form of a public pool within easy walking/biking distance)
o A fun, kid-friendly playground in Holiday
o A safe bike-route on or near North Broadway (not safe for kids or cautious adults right now)
o Indoor play space—both for little kids and another for bigger kids
o Increased safety at the bus stop in front of the homeless shelter
o More family-friendly restaurants—similar to Proto’s (but we get sick of pizza every week and Proto’s can be
expensive)

North Boulder Subcommunity Action Plan 11 Appendix 2: Community Input Summary October 7, 2014
FOOTHILLS ELEMENTARY: CHILD INPUT FOR NORTH-BOULDER SUB-COMMUNITY PLAN
Sample: 24 6-7 year-old children in grade 1 class at Foothills Elementary, Boulder, CO. (Note: This was a small convenience
sample).
I. The City on the Wall
Method
This activity was based on Stanley King’s method The City on the Wall (http://youthmanual.blogspot.com/p/city-on-wall.html)
The facilitator drew an ‘original wild landscape,’ and a person (you) arriving in a canoe, then asked the question: “What do
you see, feel and smell here?” Next, the first house was built, then some friends’ houses, and finally the glue factory, which
children asked to be placed further away.
Next, children were asked to draw on this landscape what they would like to see in their city (results in section a. below).
This took place in groups of six. During this process the other three groups were asked where they currently like to go,
and what activities they like to do in their actual city (results in section b. below).
A discussion followed, where children were asked the following questions: “What do you see, or smell now?” “What do
you like that would make you want to live here?” “Why would you not want to live here?” (Results in section c. below).
In the final section of this activity children were asked: “What is the most important thing you would like to see in your
city?” (Results below in section d.).
Results
a) City on the Wall drawing (see below). This drawing has numerous buildings, some parks, trees and play-structures,
and is quite crowded and chaotic (which is generally the result of this activity). The children did not include any mode
of transport other than walking (i.e. there were no depictions of cars, bikes or roads).
b) Answers to the question “Where do you like to go/what do you like to do in your city” fell under three general categories:
City-based retail activities, city-based indoor/outdoor activities, and nature-based outdoor activities (see Table 1.).
Table 1. Children’s Favoured Activities
City-based Retail City-based Indoor/Outdoor Activities Nature-based Outdoor Activities
Ice Cream Swimming Pool Boulder Reservoir
Toy Store Football Hike
Museum School Kayak
Mall Roller-coaster Camping
Gymnastics Summer Camps
Swing on bars Fishing
Tag Boulder creek – walk dog
Sand Box
Play cops and robbers
Play hide and seek
Play with friends in park

North Boulder Subcommunity Action Plan 12 Appendix 2: Community Input Summary October 7, 2014
Carnival
c) Discussion of The City on the Wall image: Children’s answers to the four questions are presented in Table 2.
Table 2. Children’s perception of their ‘City on the Wall’
What do you smell? What do you see? Why would you live
here?
Why would you not live here?
Smoke Happiness Like trees Too crowded
Bagels Crowded Too polluted
Garbage Lots of trees Small place with lots in it
Ice Cream Glue factory nicely separated Hard to find your way with all the
houses
Homes, spread out
Big difference from when it
started – now it is a lot more
polluted
d) Table 3 shows the important things children said they would like to see in their city. The responses were divided into three
major categories: Built structure, Nature/Environment, Other.
Table 3. Children’s choices of important things in a city
Built Structure Nature/Environment Other
Pickle store Nature Peaceful song
Ice Cream Store Crystal Cave Skydiving off roofs
Animal Shelter Hills
Zoo* Zoo*
Mall Waterfall
American Girl Doll Store Nature and green to be pretty
Bakery Park
Big outdoor pool Woods to be alone, with only birds
around you
Children’s Library ** No pollution
* Response included in two categories
** Teacher’s response
II. Drawing Activity
Methods
The second activity was an extension of the first, asking children to create individual drawings of what they would like to see in
their ideal city.
Results
The majority of children depicted their homes (n = 16) or themselves (n = 13) surrounded by nature (19). Most
common forms of nature were the combination of green fields, trees and flowers (14). Many children also drew rivers and
mountains, some included forests, one a green roof, one a vegetable garden, and one a crystal or diamond cave.
Two other major themes emerged with the analysis of the drawings: Built structures, other than one’s home, were
highly prevalent. These structures were most commonly a friend’s house (4), or a store. Stores would be the following: candy
store (2), general store (2), a toy store, rock store, bakery, and a pickle store. Other buildings included a homeless shelter, two
animal shelters, dog-houses, a zoo, the White House, and a factory. Outdoor built structures were two playgrounds, two
football fields, a pool, and a soccer field. Animals were also commonly depicted (in 10 drawings), mainly showing companion
animals such as dogs, but birds or fish were also present, and in one case a ladybug, and one a monkey.
A large portion of children who drew themselves and other people, had the person pictured in an outdoor
environment, about half the time participating in an outdoor activity (12 drawings). Only two children drew a person inside a
building (one in own home, one in toy store). Most common outdoor activities were walking, riding a bike and riding in a boat.
Other activities were hiking, paddle-boarding, climbing, walking a dog, swimming, playing in a garden or playground, sky-diving,
and climbing a tree.

North Boulder Subcommunity Action Plan 13 Appendix 2: Community Input Summary October 7, 2014
Less than half the children (n=9) included modes of transportation in their pictures. The major form of
transportation depicted was walking, followed by riding a bike. Although roads or path were drawn in many cases, only two
children drew cars, and neither put themselves in the vehicle. Public transportation was not depicted in any of the drawings.
About half of the children (n = 12) also used words, sentences or phrases to describe their ideas and
recommendations. Listed below are the children’s relevant quotes:
“Trees, nature.”
“Zoo animals.”
“I love biking!”
“I want to live in the mountains and get food from nature! I’ll visit the animal shelter every day! I’ll lay on the warm
grass and listen and look at the birds!”
“I love my Mama. I love an love an love!”
“No polluted air.”
“Make airplanes, make boats.”
“Peaceful cabin in the woods.”
“Not polluted air.”
“I love to bike and swim and a peaceful song.”
“I love the hot.”

North Boulder Subcommunity Action Plan 1 Appendix 3: Plan Implementation Background October 7, 2014
APPENDIX 3: 1995 PLAN IMPLEMENTATION
BACKGROUND
The North Boulder Subcommunity Plan contains numerous recommendations, many of which have been
implemented. These recommendations range from new development and design standards, capital investments in
civic facilities, and new transportation connections. Some of the key items from the 1995 Plan that the city has
implemented include:
Five new zoning districts, including a Business Main Street (BMS) district that was used for a rezoning
for the Village Center area;
Numerous new parks in accordance with the 1995 Plan, including Foothills Community Park and
Holiday Neighborhood Park;
Several annexations of county enclaves consistent with the 1995 Plan; and
New transportation connections made in accordance with the 1995 Plan as redevelopment has
occurred.
1999 AND 2012 NORTH BOULDER AERIAL IMAGES
1999 2012

North Boulder Subcommunity Action Plan 2 Appendix 3: Plan Implementation Background October 7, 2014
1995 PLAN IMPLEMENTATION SUMMARY
Category Implementation Item and
Description
Implementation Status
Zoning and Land
Use
New Zone Districts and
Development Standards
The 1995 Plan contains
numerous recommendations
for new North Boulder zone
districts and development
standards.
Five new zoning districts were created and properties were subsequently rezoned to:
A business main street zone, patterned after historic ‘Main Street’ business districts;
Three mixed use zones that provide a transition between the higher intensity business ‘Main Street’ and surrounding
residential or industrial areas; and
A mixed density residential zone district.
North Broadway
Area (Village
Center and
Yarmouth North)
Village Center
The 1995 Plan calls for a Village
Center concept on both sides
of Broadway at around
Yarmouth Avenue.
The city has rezoned properties in the Village Center and Yarmouth North areas to BMS, MU-1, and RMX-2 (see current
zoning map to the right).
The east side of the Village Center has seen significant redevelopment, but the west side has not.
These redevelopment areas have been largely consistent with the plan’s goals for vertical mixed use and pedestrian-oriented design.
Community
Facilities, Parks,
and Open Space
Parkland
The 1995 Plan recommends
several new parks throughout
the subcommunity.
Since 1995, the following parks have been built or are in the process of being built:
Foothills Community Park
Neighborhood Park on the Mann property
Holiday Neighborhood Park
The Elks Neighborhood Park is in the 2013-2018 Capital Improvements Plan
Dakota Ridge Neighborhood Parks
North Boulder Library
The 1995 Plan recommends a
new Boulder Library branch in
North Boulder
The NoBo Corner Library opened in 2014 at the corner of Yarmouth and Broadway. The 1995 Plan and many community
members still supports a full service library in North Boulder.

North Boulder Subcommunity Action Plan 3 Appendix 3: Plan Implementation Background October 7, 2014
1995 PLAN IMPLEMENTATION SUMMARY
Category Implementation Item and
Description
Implementation Status
Annexation The 1995 Plan supports
annexation of county enclaves
(Area II properties) in the
North Boulder Subcommunity.
Since 1995, several county enclaves have annexed into the city in the North Boulder Subcommunity. The map below highlights
these areas:
ANNEXATIONS SINCE 1995 (OUTLINED IN RED)
Transportation
and Streetscape
Development Compliance
with Transportation Plan
The 1995 Plan recommended a
new requirement for
compliance with the
Transportation Plan during
development or
redevelopment.
The city adopted an ordinance that requires dedication or reservation of Rights-of-Way in conformance with the North Boulder
Subcommunity Transportation Plan.

North Boulder Subcommunity Action Plan 4 Appendix 3: Plan Implementation Background October 7, 2014
1995 PLAN IMPLEMENTATION SUMMARY
Category Implementation Item and
Description
Implementation Status
North Broadway
Streetscape
The 1995 Plan recommended
development and
implementation of streetscape
improvements along North
Broadway
A draft North Broadway Streetscape Plan was developed and has been used as a guide to establish the streetscape design for
Broadway from US 36 to Upland and improvements that were required when properties redeveloped (e.g., street trees, benches,
lighting, on-street parking).
Auto/Transit
Improvements Right-of-
Way Plan
The 1995 Plan calls for
transportation connections
that encourage walking, biking,
and transit use.
Connectivity: As new development has occurred in North Boulder (particularly north of Violet Avenue), connectivity has been
enhanced by introducing more of a street grid consistent with the Auto/Transit Improvements Right-of-Way Plan. Streets have
generally been designed to be narrower and more pedestrian friendly.
Enhanced Transit: The 1995 Plan calls for enhanced transit service in North Boulder. The Auto/Transit Improvements Right-
of-Way Plan recommends circulator transit routes through some of the North Boulder neighborhoods along with a route along
US 36 connecting to shopping areas along 28th Avenue. Currently, bus service along Broadway only extends to Front Range
Avenue and Broadway (one block north of Lee Hill Road).
US 36 Gateway: The city has also not implemented a gateway feature where Broadway intersects with US 36, as recommended
by the plan.1
Stormwater
Utilities
The 1995 Plan recommends
protection for riparian areas
and utilization of flood plain
areas for bicycle and pedestrian
travel.
While not a specific implementation item from the 1995 Plan, the city completed the Fourmile Canyon Creek and Wonderland
Creek Major Drainageway Planning effort in 2011. This document will inform future planning and development decisions in North
Boulder, particularly in the Village Center area. Staff does not anticipate any updates to this study.
1 See page 22 of the 1995 North Boulder Subcommunity Plan.

North Boulder Subcommunity Action Plan 5 Appendix 3: Plan Implementation Background October 7, 2014
North Boulder Subcommunity Development Activity
(1995-2013)
The 1995 Plan sets forth specific estimates for
future growth in the North Boulder
Subcommunity. Staff analysis of building permit
records from 1995-2013 reveal the North
Boulder Subcommunity is:
Approaching the 1995 Plan’s
Estimate for New Residential Units -
The 1995 Plan approximated between
1,629-1,784 new housing units would be
built within “about 13-17 years” in the
subcommunity based on a number of
factors.2. According to city building
permit records, approximately 1,700 new
housing units have been built since the
1995 Plan. The city’s growth projections
for the North Boulder Subcommunity estimate an additional approximately 550 housing units by
2035.3
Adding More Retail than the 1995 Plan Estimated – The 1995 Plan estimated 85,000
square feet of new retail subcommunity-wide. Since 1995, about 178,000 square feet of new
retail has been built.
Adding Office Space at Faster Rate than the 1995 Plan Estimated – From 1995 to
2013, the amount of new office space increased by 291% from approximately 100,000 square
feet to approximately 391,000 square feet, exceeding the 1995 Plan’s estimated new office space
of approximately 299,000 square feet.
The tables that follow provide a more detailed summary of residential and nonresidential development
activity since the 1995 Plan, along with existing land use and zoning.4
2 These factors included Boulder Valley Comprehensive Plan density assumptions by zone district and growth rates consistent with the North Boulder projections from the Integrated Planning Project. 3 The city’s growth projections use a variety of factors from current zoning to future land use, to more qualitative analysis of specific sites with growth potential. 4 SOURCES: North Boulder Subcommunity Plan, city building permit records. The numbers reflect building permits
where Certificates of Occupancy (C.O.) were issued between 1995 and 2013. There are several developments under review that have not received C.O.’s to date.
1995 Plan Concept
for Lee Hill Road
Area
2013 Development
Pattern
The above images illustrate how the 1995 Plan helped
shaped development patterns.

North Boulder Subcommunity Action Plan 6 Appendix 3: Plan Implementation Background October 7, 2014
NORTH BOULDER SUBCOMMUNITY-WIDE RESIDENTIAL DEVELOPMENT
ACTIVITY (1995-2013)
1995
Total
Percent
of 1995
Total
1995 Plan
Estimate
for
Future
Units
New
Since
1995
Total
Units
2013
Percent of
Total
Units 2013
Increase
1995-
2013
Attached Units 1,084 27% n/a 1,096 2,180 38% 101%
Detached Units (includes
mobile homes) 2,930 73% n/a 635 3,566 62% 22%
Total North Boulder
Subcommunity Wide
Housing Units 4,014 100%
1,629-1,784
New Units 1,731 5,745 100% 43%
NORTH BOULDER SUBCOMMUNITY NONRESIDENTIAL DEVELOPMENT
ACTIVITY
1995
Count
(sq. ft)
Percent
of 1995
Total
1995 Plan
Estimate for
Future Square
Footage
New
Square
Feet
Since
1995
Total
Square
Footage
2013
Percent
of Total
2013
Increase
1995-2013
Retail 200,000 27% 85,000 178,177 463,177 28% 89%
Office 100,000 13% 299,000 291,057 690,057 42% 291%
Industrial 450,000 60% n/a 45,969 495,970 30% 10%
Total 750,000 100%
515,203 1,265,203 100% 69%

North Boulder Subcommunity Action Plan 7 Appendix 3: Plan Implementation Background October 7, 2014
Existing Zoning and Land Use in the North Boulder Subcommunity
The following tables illustrate the current zoning and land use conditions in the North Boulder
Subcommunity. Generally, the data shows that:
Most of the subcommunity is zoned low or medium density residential;
A significant portion of the subcommunity is zoned and used as public (open space, parks, etc);
A higher percentage of land is classified as a commercial land use than the amount of land that is
zoned for commercial, and
A lower percentage of land is classified as an industrial land use than is actually zoned industrial.
EXISTING LAND USE BY LAND AREA, NORTH BOULDER
SUBCOMMUNITY5
Name Acres Percent
Agricultural 1.0 0.07%
Commercial 103.7 6.9%
Industrial 3.7 0.2%
Mixed Use 11.4 0.8%
Residential 1,088.5 72.4%
Public/Institutional 204.7 13.6%
Vacant 90.7 6%
EXISTING ZONING BY LAND AREA, NORTH
BOULDER SUBCOMMUNITY
Zone District Category Acres Percent
Agricultural 17.8 1.0%
Commercial 23.9 1.2%
Industrial 120.1 6.0%
Mixed Use 34.8 1.7%
Residential 1,391.1 69.9%
Public/Institutional 222.5 11.2%
5 SOURCE: Boulder County Assessors Office (based on how the county classifies land uses, which may not align with city zoning classifications).

North Boulder Subcommunity Action Plan 8 Appendix 3: Plan Implementation Background October 7, 2014

North Boulder Subcommunity Action Plan 1 Appendix 4: Improvement District Background October 7, 2014
APPENDIX 4: IMPROVEMENT DISTRICT BACKGROUND
An improvement district is a private sector initiative to manage and improve the environment of a business district with
services financed by a self-imposed and self-governed assessment. Similar to a common area maintenance (CAM) charge
commonly found in shopping malls and office parks, improvement districts can help a business district increase its
competitiveness in the regional marketplace. Services financed by an improvement district are intended to enhance, not
replace, existing city services.
Benefits of Improvement Districts
Benefits from improvement districts, which can stretch well beyond their boundaries, include:
Creating and maintaining a cleaner, safer and more attractive business district;
Ensuring stable and predictable revenues;
Providing innovative management;
Responding quickly to market changes and community needs;
Promoting distinct identities in business districts;
Leveraging resources; and
Creating a unified voice to increase a business district’s influence.
Colorado Improvement Districts Law
Colorado’s Improvement District Law of 19881 includes the following key provisions:
Improvement districts can finance a wide variety of services, including marketing, maintenance, economic
development, public safety, planning, events, and parking management.
Improvement districts are accountable to those who pay through an improvement district board of directors
comprised of property and business owners within the district.
Services financed by an improvement district are usually provided by a private sector organization, not
government.
Improvement districts require demonstrated support from owners of personal and real property representing
more than 50% of assessed value and acreage.
The “Taxpayers Bill of Rights” (TABOR) requires a vote by owners of real and personal property and lessees
and residents of commercial property within a district to approve the assessment.
Controls and safeguards can include a cap on assessments and a periodic review to ensure that improvement
district services are effective.
Boulder Improvement Districts
Current city improvement districts and their purposes include:
o Boulder Junction Access and Parking Districts: Created in 2010 for parking related services and improvements
and providing travel demand management programs such as EcoPasses, car share, and bike share. Property tax
based with parking revenues and bonding capacity.
o Central Area (CAGID): Created in 1970s for parking and related improvements, property tax based with
bonding capacity.
o University Hill (UHGID): Created in 1970s for parking and related improvements, expanded in 1987 to include
public right of way maintenance, streetscaping, landscaping, signage, etc. Property tax based with parking
revenue and bonding capacity.
o Downtown Business Improvement District: Created in 1999 in the downtown for enhanced maintenance,
marketing, and business development. Property tax based.
o Forest Glen EcoPass District: Created to pay for EcoPasses for residents, property tax based.
1 C.R.S 31-25-602.

North Boulder Subcommunity Action Plan 2 Appendix 4: Improvement District Background October 7, 2014
Colorado Special Financing Districts Summary
Business Improvement District
(BID)
Downtown Development
Authority (DDA)
Urban Renewal
Authority (URA)
General Improvement
District (GID)
Special Improvement
District (SID)
Background
Quasi-municipal organization is a subdivision
of the state. All property assessed in a BID
must be commercial. Boundary may or may
not be contiguous.
Quasi-municipal organization
intended to halt or prevent deterioration of property values or structures in Central Business District.
Established to eliminate
blighted areas for redevelopment by purchasing, rehabilitating, and selling land for development.
Quasi-municipal organization that is a subdivision of the state. Can provide a wide range of services.
An assessment district which is not a subdivision of the state, nor is it separate from the
municipality.
Focus Areas Management, Marketing, Advocacy,
Economic Development
Real Estate Development, Infrastructure, Operations
Real Estate Development, Rehab, Financing,
Infrastructure
Capital Improvements, Public Facilities, Maintenance
Capital Improvements, Infrastructure
Formation Process
Approval by petition of property owners
representing 50% of acreage and 50% of
value of proposed district; Council
ordinance; TABOR election.
City ordinance subject to vote
by affected property owners; TABOR election.
Finding of blight; Petition by
25 electors; Council resolution.
At least 200 or 30% of, whichever is less, electors of the proposed district
must sign petitions; If all taxable property owners in the district sign a petition, public hearing can be waived.
Need petitions from property owners who will bear at least
50% of the cost of the improvement; ordinance forms district.
Assessment Method Assessment or mill levy on commercial
property TIF on property and/or sales and 5 mill property tax for operations
TIF on property and/or sales
tax
Property tax and income from
improvements Assessments on property
Pros/Cons Very flexible entity that can finance
improvements and provide services.
Ability to finance improvements
and provide services; through general mill levy and TIF increment. Needs approval from
other county entities to collect increment.
Can generate sales and/or tax increment to finance future
development. Increment needs approval from county entities.
Only those in district can authorize and
pay for improvements. Requires petition and election.
Equitable: only those who benefit pay. Difficult to form – requires election. City
constructs improvements.
Governance
Minimum 5-member board appointed by
Mayor or governing body; Can also
be elected.
5-11 member board appointed
by City Council.
5-11 member commission
appointed by City Council. Governing body is ex-officio board. City Council
Can they…
Operate Facilities? Yes Yes Yes Yes No
Levy property tax with voter approval?
Yes 5 mill property tax for operations
No, but can use TIF Yes No
Levy sales tax with voter
approval?
No, but may create SID within BID No, but can use TIF No, but can use TIF No No
Issue GO bonds with voter approval?
Yes Bonds secured by property tax Yes Yes No
Issue revenue bonds? Yes Increment can be issued by municipality
Yes Yes Yes
Issue special assessment
bonds?
Yes No No Yes Yes
Source: Progressive Urban Management Associates, Colorado Revised Statutues 31-25