north carolina: an environmental overview env knisley presentation.pdf · ri 1400 sc 29,900 nc...
TRANSCRIPT
http
://u
ploa
d.w
ikim
edia
.org
/wik
iped
ia/c
omm
ons/
5/58
/USA
_Nor
th_C
arol
ina_
relie
f_m
ap_c
ut.jp
g
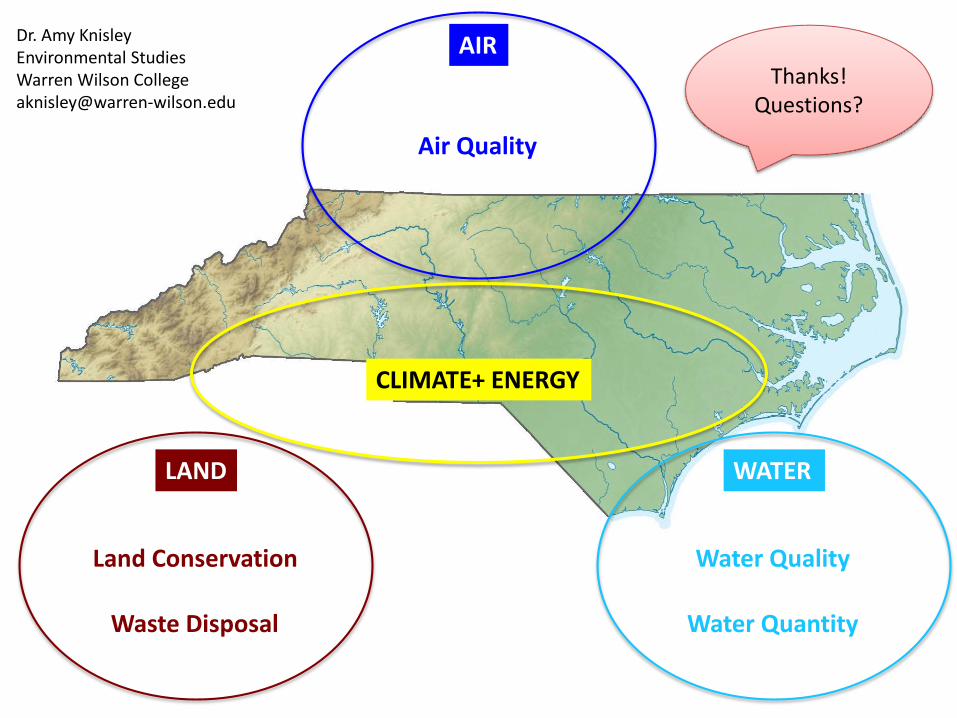
Dr. Amy KnisleyEnvironmental StudiesWarren Wilson College
Leadership North Carolina Class XXVI Environment Session, 03 April 2019
North Carolina: An Environmental Overview
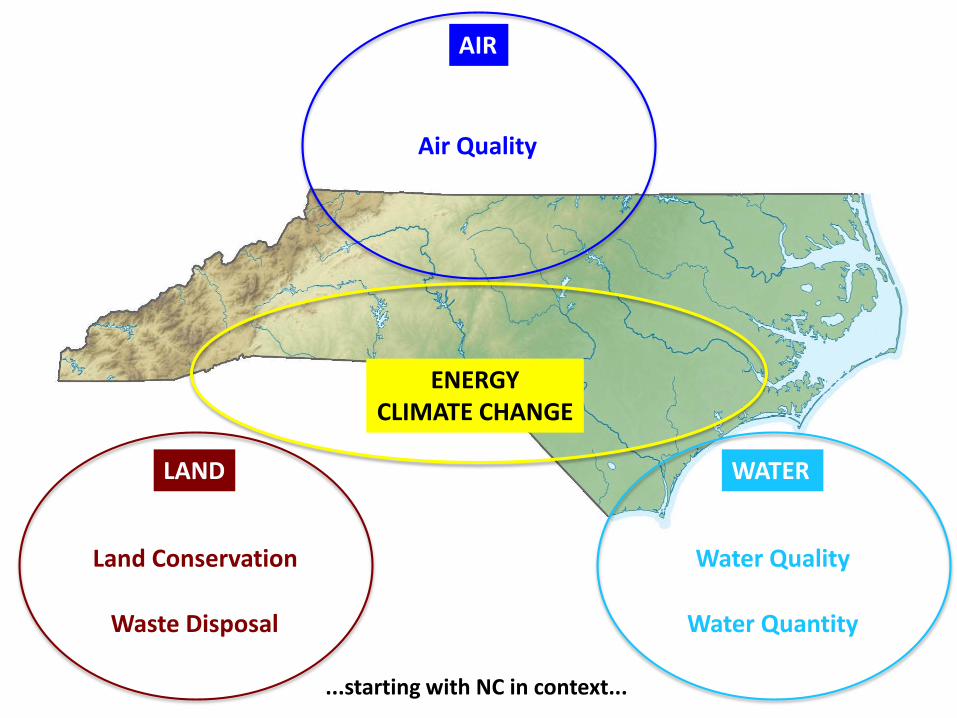
...starting with NC in context...
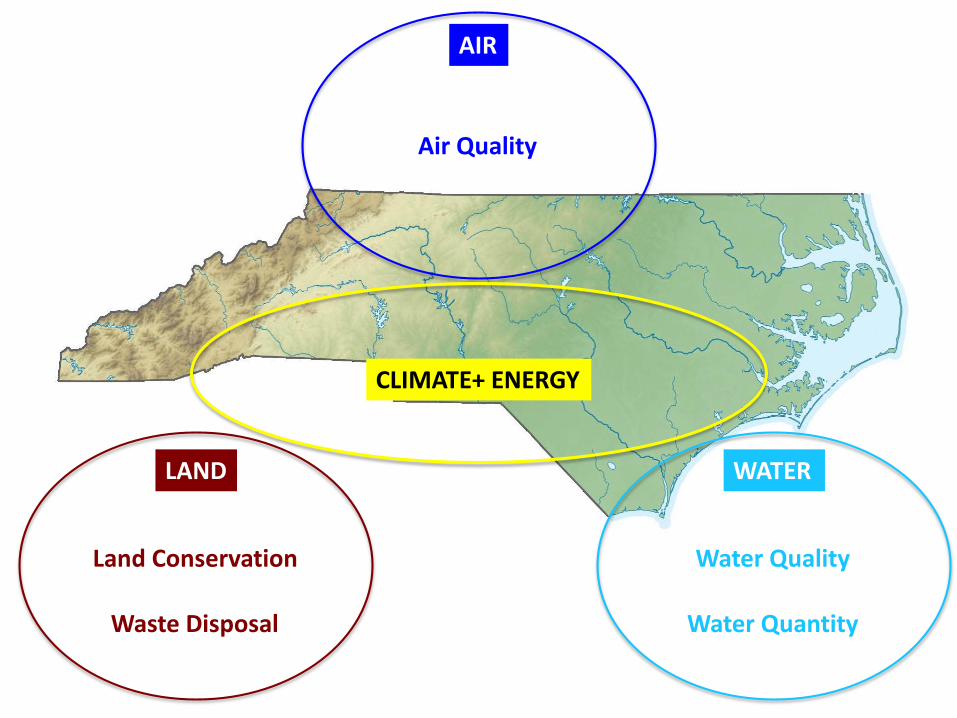
AIR
Air Quality
LAND
Land Conservation
Waste Disposal
WATER
Water Quality
Water Quantity
ENERGYCLIMATE CHANGE
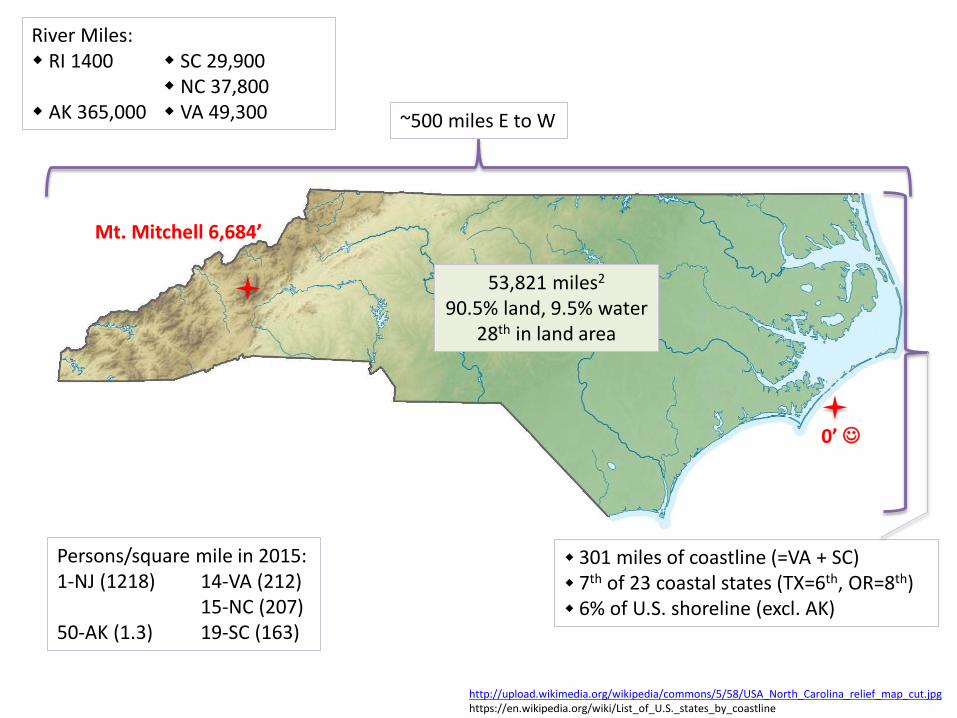
~500 miles E to W
53,821 miles2
90.5% land, 9.5% water28th in land area
Mt. Mitchell 6,684’
River Miles: RI 1400 SC 29,900
NC 37,800 AK 365,000 VA 49,300
Persons/square mile in 2015:1-NJ (1218) 14-VA (212)
15-NC (207)50-AK (1.3) 19-SC (163)
0’
301 miles of coastline (=VA + SC) 7th of 23 coastal states (TX=6th, OR=8th) 6% of U.S. shoreline (excl. AK)
http://upload.wikimedia.org/wikipedia/commons/5/58/USA_North_Carolina_relief_map_cut.jpghttps://en.wikipedia.org/wiki/List_of_U.S._states_by_coastline
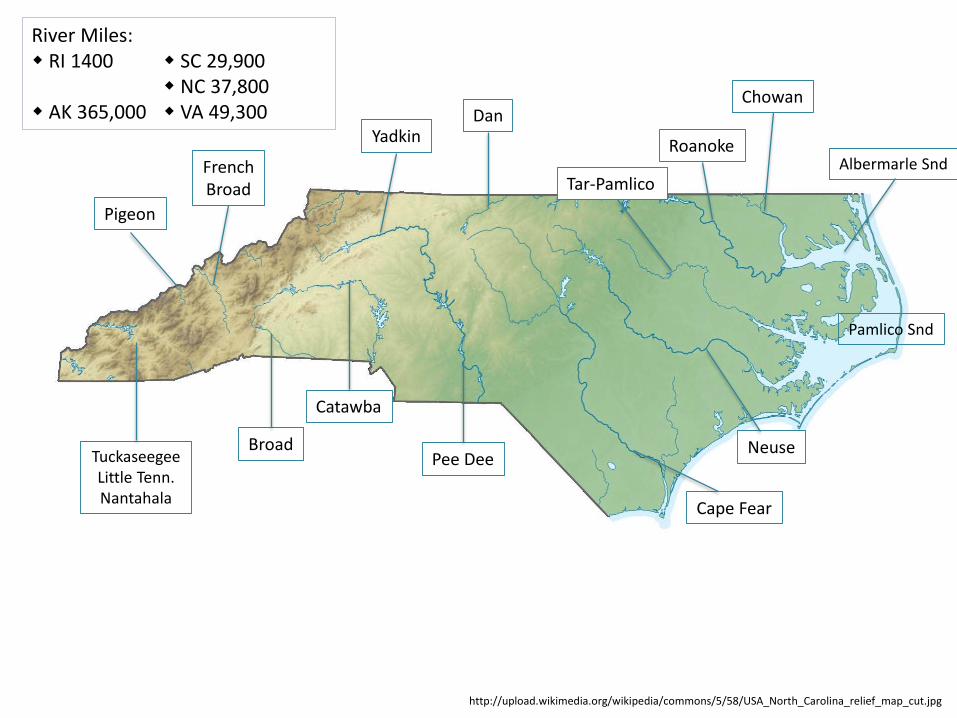
Albermarle Snd
Pamlico Snd
Chowan
Tar-Pamlico
Roanoke
Neuse
Cape Fear
Pee Dee
Catawba
Broad
FrenchBroad
Pigeon
TuckaseegeeLittle Tenn.Nantahala
YadkinDan
River Miles: RI 1400 SC 29,900
NC 37,800 AK 365,000 VA 49,300
http://upload.wikimedia.org/wikipedia/commons/5/58/USA_North_Carolina_relief_map_cut.jpg

Population Growth 1940-2018
VA 20%
SC 27%
NC 29%
U.S. 16%
2000-2018
U.S. Census Bureau
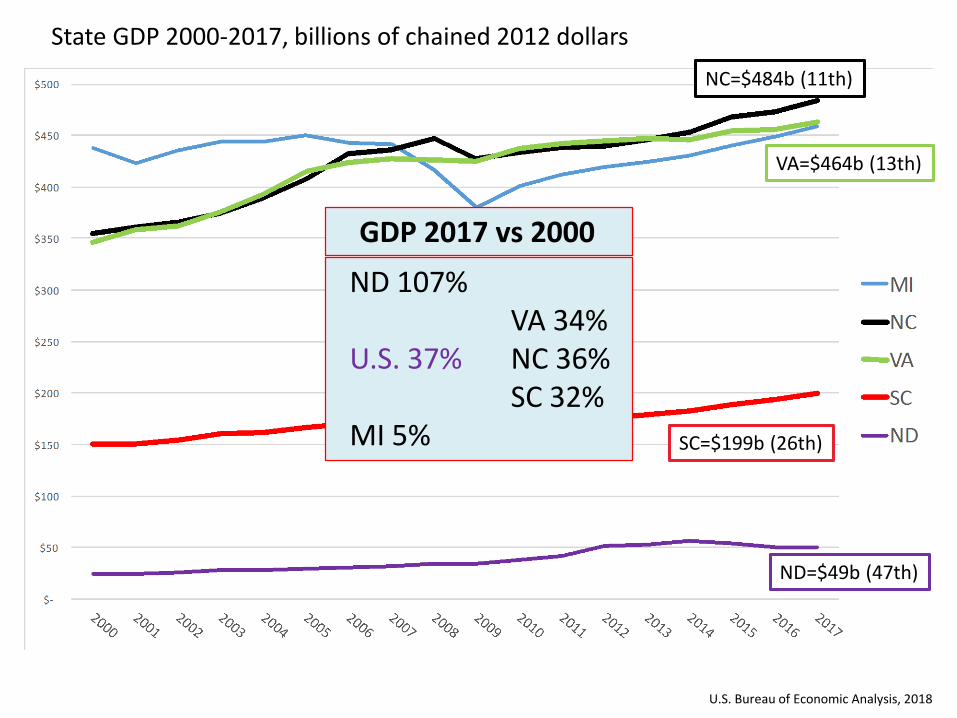
State GDP 2000-2017, billions of chained 2012 dollars
U.S. Bureau of Economic Analysis, 2018
ND=$49b (47th)
NC=$484b (11th)
VA=$464b (13th)
SC=$199b (26th)
ND 107%VA 34%
U.S. 37% NC 36%SC 32%
MI 5%
GDP 2017 vs 2000
U.S. Bureau of Economic Analysis, 2018
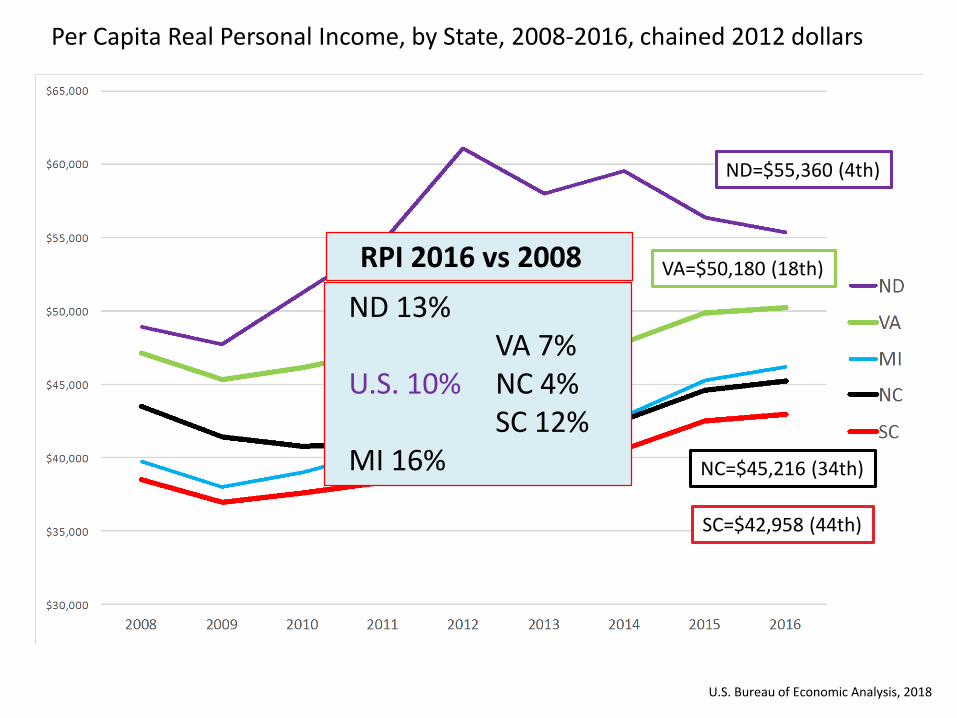
Per Capita Real Personal Income, by State, 2008-2016, chained 2012 dollars
ND=$55,360 (4th)
NC=$45,216 (34th)
VA=$50,180 (18th)
SC=$42,958 (44th)
ND 13%VA 7%
U.S. 10% NC 4%SC 12%
MI 16%
RPI 2016 vs 2008

Question: Is economic growth good
for the environment?

AIR
Air Quality
LAND
Land Conservation
Waste Disposal
WATER
Water Quality
Water Quantity
CLIMATE+ ENERGY
NC
DEN
R, S
tate
of t
he E
nviro
nmen
t Rep
ort 2
011,
p58
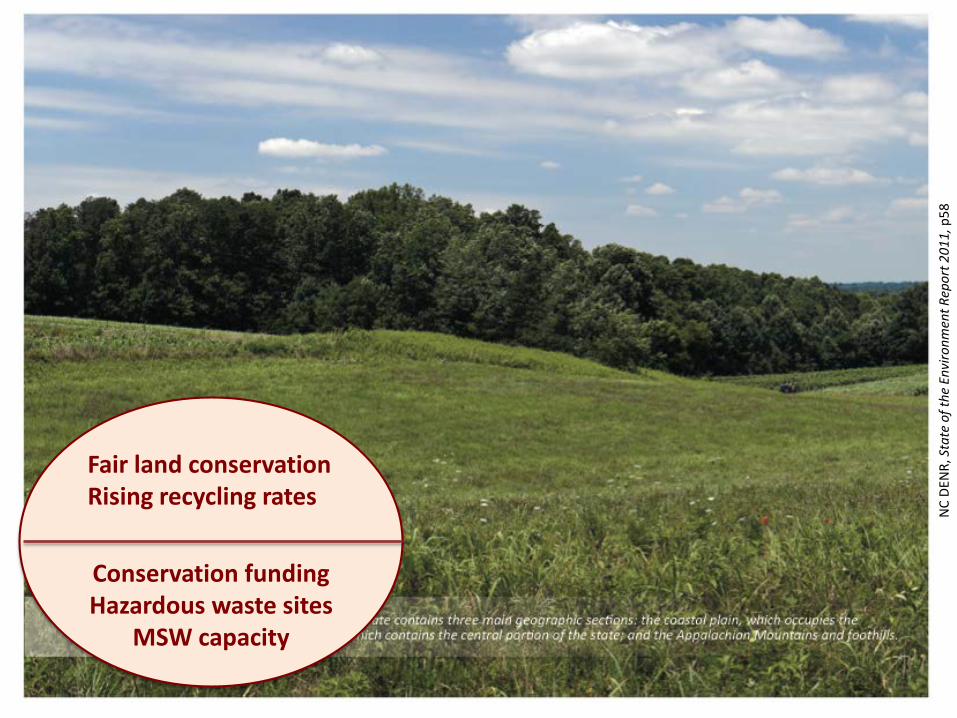
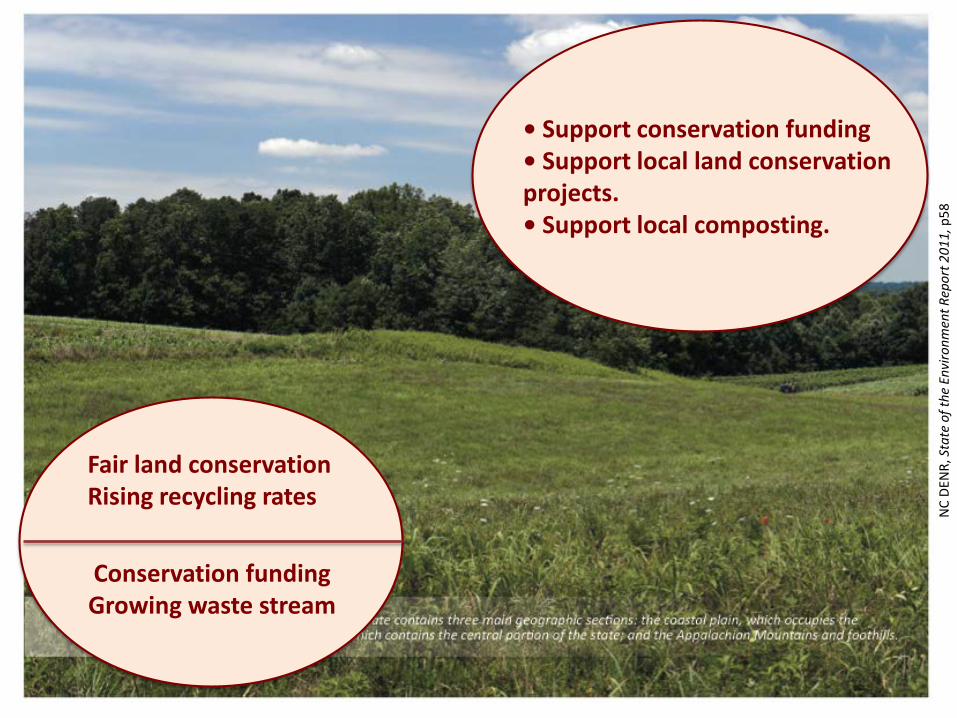
Fair land conservationRising recycling rates
Conservation fundingHazardous waste sites
MSW capacity

U.S. Department of Agriculture. 2018. Summary Report: 2015 National Resources Inventory. Excludes Alaska
Developed land 1982-2015VA +75%
U.S. +60% NC +106%SC +98%
Land Use
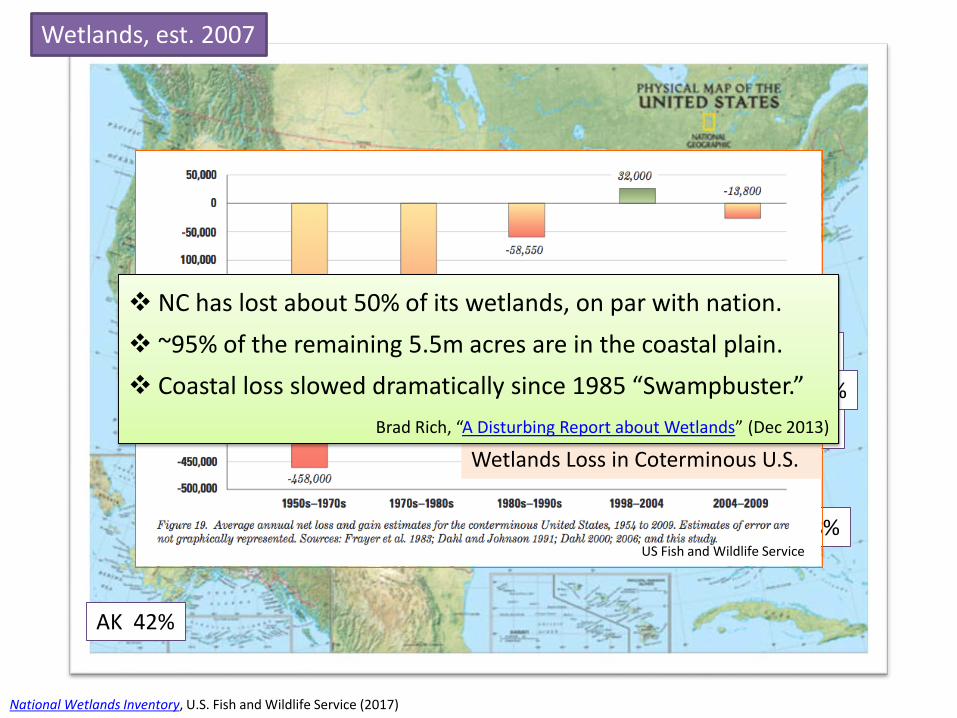
National Wetlands Inventory, U.S. Fish and Wildlife Service (2017)
FL 28%
NC 16%
SC 20%
VA 6%
WI 14%
AK 42%
Wetlands Loss in Coterminous U.S.
US Fish and Wildlife Service
NC has lost about 50% of its wetlands, on par with nation. ~95% of the remaining 5.5m acres are in the coastal plain. Coastal loss slowed dramatically since 1985 “Swampbuster.”
Brad Rich, “A Disturbing Report about Wetlands” (Dec 2013)
Wetlands, est. 2007

USFS Forest Inventory and Analysis (2012), https://www.fia.fs.fed.us/
AK 35.2%
NV 3.2%VA 62.9%
NC 59.7%
SC 68.2%
MI 55.6%
WA 52.7%
On average, 21.5% of forest land has been lost in the U.S. since 1630. DE, IN and OH are estimated to have lost 60% or more; other states,
such as ID and CO, have lost 5% or less. But in the 20th century, steady state or reforestation have been the trend. 34 of 50 states
have seen gains averaging 8% between 1920 and 2012.
Net forested land, 1920 to 2012:MD = 0% VA = 6.6%US = 4% NC = 2.2%VT = 26% SC = 14.7%
Forest, 2012

“Baseline Estimates of Carbon Stocks in Forests and Harvested Wood Products for National Forest System Units; Southern Region.” USDA Forest Service (2015) http://www.fs.fed.us/climatechange/documents/SouthernRegionCarbonAssessmentTwoBaselines.pd
One Tg (teragram) = 1 trillion grams! 1 paperclip = 1 gram!
Great Pyramid of Giza = 6 Tg.
Carbon Sequestered in southern forests, 2015
AL, KY, GA, TN, FL, LA, MS, VA, AR, OK, NC, SC, TX, P.R. 4 Natl For units, 2 special units

USGS Protected Areas Data Portal (2017): https://gapanalysis.usgs.gov/padus/data/statistics/USGS Protected Areas Database/Viewer: https://maps.usgs.gov/padus/
AK 55% (35%)
NV 80% (15%) VA 10% (4%)
NC 9% (4%)
SC 8% (4%)
MN 23% (7%)
ME 11% (5%)
“...15-30% of the land in any state or ecoregion will need to be [protected] in order for our native biodiversity to be effectively
conserved.” Conservation in America: A Status Report. Defenders of Wildlife (2002)
TX 3% (2%)
Protected Land, 2017
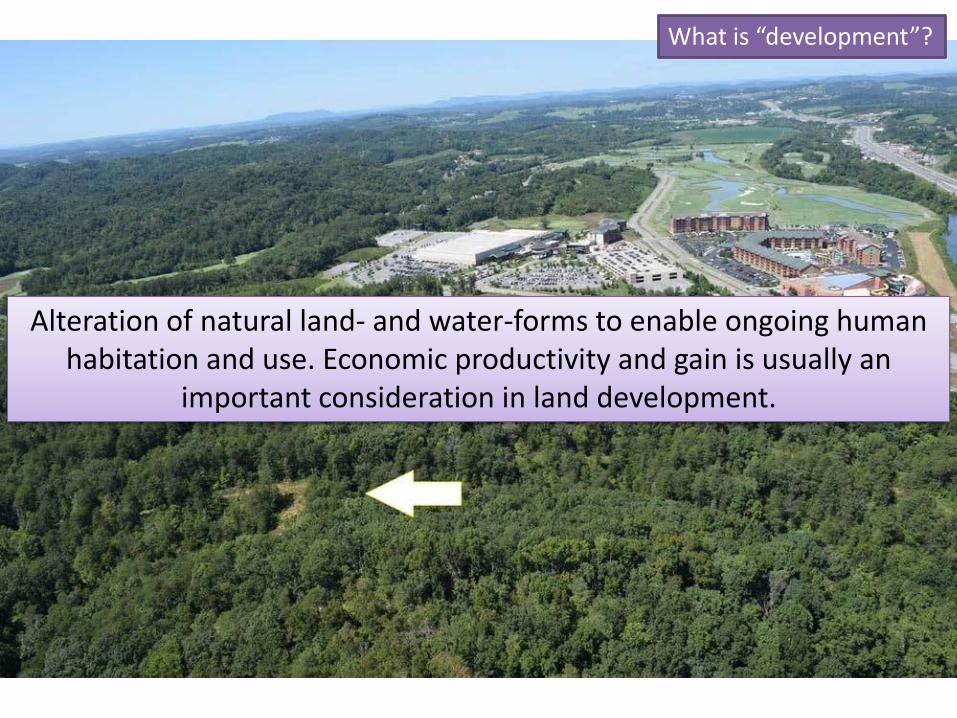
What is “development”?
Alteration of natural land- and water-forms to enable ongoing human habitation and use. Economic productivity and gain is usually an
important consideration in land development.

U.S
. Cen
sus B
urea
u Bu
ildin
g Pe
rmits
Sur
vey
(201
6)
N.C. Building Permits issued 1960-2018, in thousands
What is “development”?
Hog and Pig Sales as % of Agricultural Sales, by County, 2012
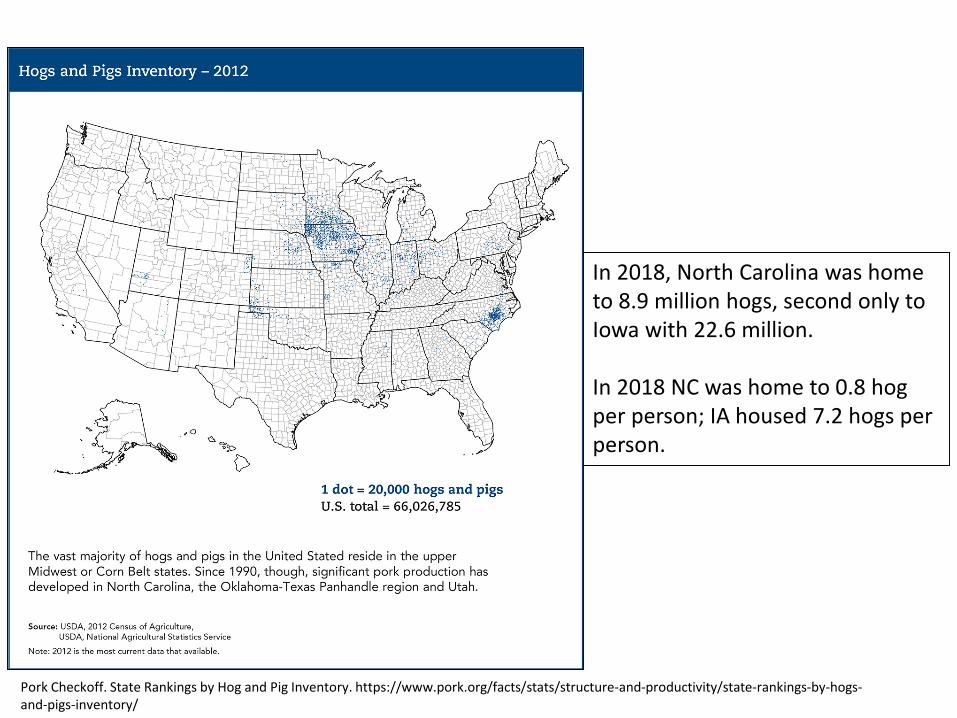
Pork Checkoff. State Rankings by Hog and Pig Inventory. https://www.pork.org/facts/stats/structure-and-productivity/state-rankings-by-hogs-and-pigs-inventory/
In 2018, North Carolina was home to 8.9 million hogs, second only to Iowa with 22.6 million.
In 2018 NC was home to 0.8 hog per person; IA housed 7.2 hogs per person.
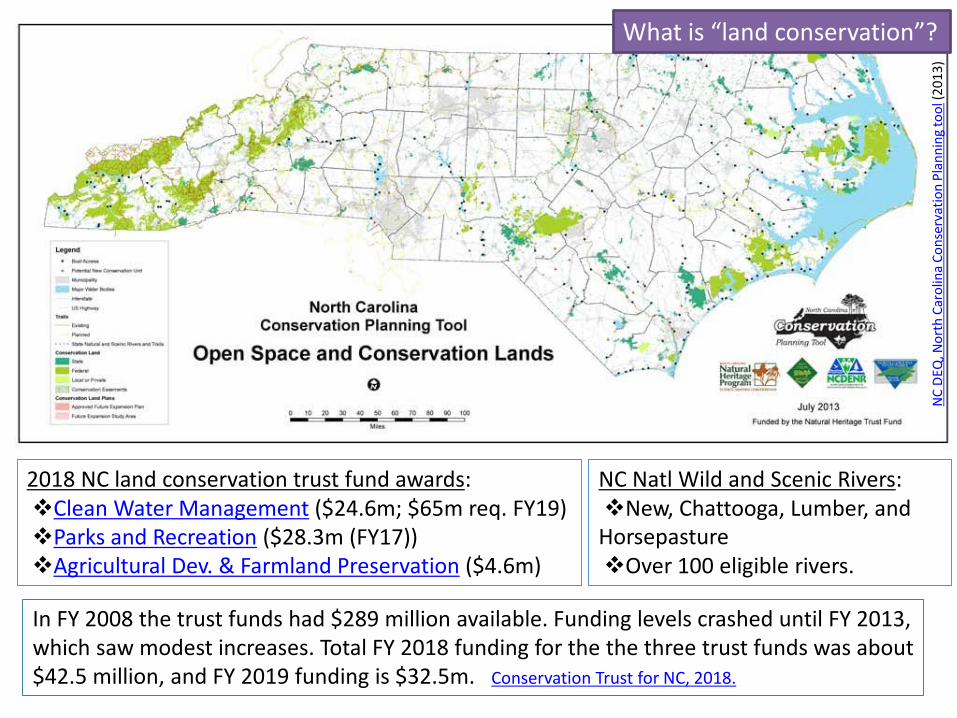
2018 NC land conservation trust fund awards:Clean Water Management ($24.6m; $65m req. FY19)Parks and Recreation ($28.3m (FY17))Agricultural Dev. & Farmland Preservation ($4.6m)
NC Natl Wild and Scenic Rivers: New, Chattooga, Lumber, and
HorsepastureOver 100 eligible rivers.
NC
DEQ
, Nor
th C
arol
ina
Cons
erva
tion
Plan
ning
tool
(201
3)
In FY 2008 the trust funds had $289 million available. Funding levels crashed until FY 2013, which saw modest increases. Total FY 2018 funding for the the three trust funds was about $42.5 million, and FY 2019 funding is $32.5m. Conservation Trust for NC, 2018.
What is “land conservation”?
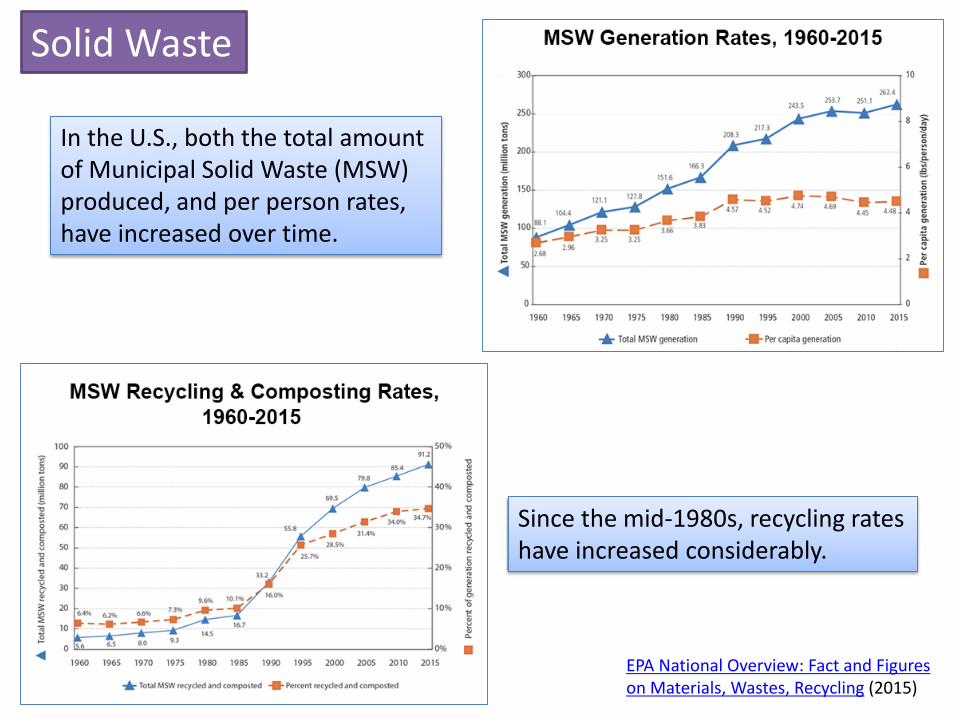
In the U.S., both the total amount of Municipal Solid Waste (MSW) produced, and per person rates, have increased over time.
Since the mid-1980s, recycling rates have increased considerably.
Solid Waste
EPA National Overview: Fact and Figures on Materials, Wastes, Recycling (2015)

1990 2005 2010 2015MSW/Person/Day: U.S. 4.6 4.7 4.4 4.5MSW/Person/Day: N.C. 5.6 7.2 5.1 6.1Recycling Rate: U.S. 16% 31% 34% 35%Recycling Rate: N.C. 6% 11% 14% 15%
EPA. Advancing Sustainable Materials Management: Facts and Figures (2015)NC DEQ, Div of Waste Management. Legislative Reports (2017)
NC Solid Waste, 2016-17• 11,385,939 tons of waste, total• 1,678,882 tons of CCR’s from 6 electrical plants
• 48 municipal waste landfills• 51 construction and demolition landfills• 15 industrial landfills
• 42 years of landfill capacity remaining
• 47 composting operations• 16 mulching operations• 7 commercial medical waste operators• 0 waste-to-energy incinerators
Solid Waste

EPA. Advancing Sustainable Materials Management: Facts and Figures (2015)NC DEQ, Div of Waste Management. Legislative Reports (2017)
How many Waste To Energy incinerators are there in N.C.?
71 WTE plants0.5% of U.S. electricity
reduce waste volume by ~85%
Check out this 2017 story about Florida’s newest WTE plant.
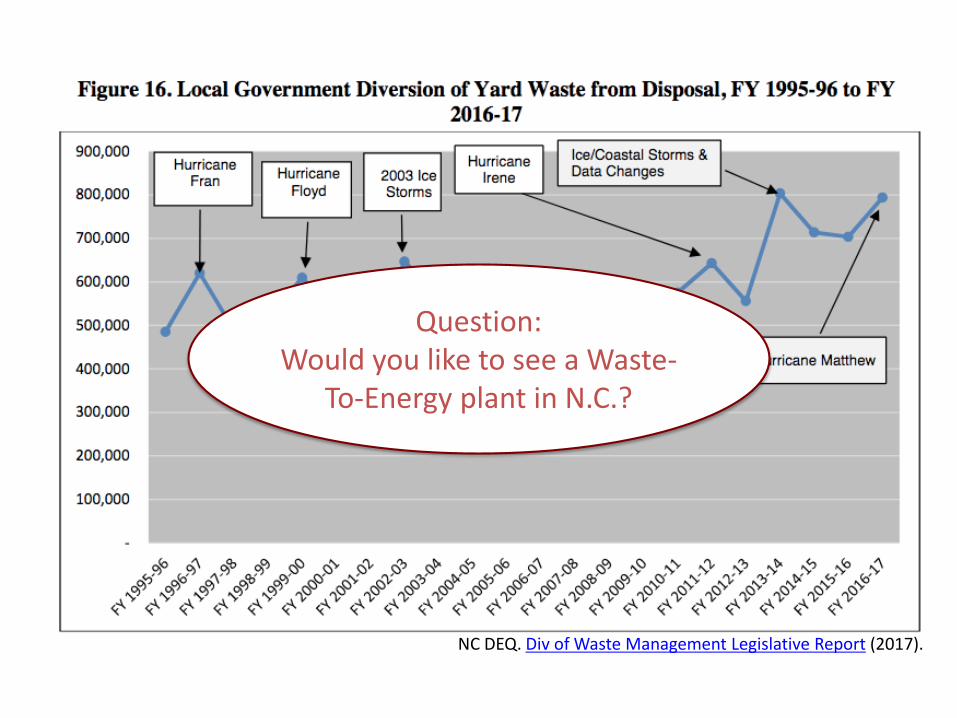
NC DEQ. Div of Waste Management Legislative Report (2017).
Question: Would you like to see a Waste-
To-Energy plant in N.C.?
NC
DEN
R, S
tate
of t
he E
nviro
nmen
t Rep
ort 2
011,
p58
Fair land conservationRising recycling rates
Conservation fundingGrowing waste stream
• Support conservation funding• Support local land conservation projects.• Support local composting.

AIR
Air Quality
LAND
Land Conservation
Waste Disposal
WATER
Water Quality
Water Quantity
CLIMATE+ ENERGY•
Question: What are the main
causes of air pollution?

NC
Dept
of E
nvt a
nd N
at R
esou
rces
, Nor
th C
arol
ina
Stat
e of
the
Envi
ronm
ent R
epor
t 201
1, p
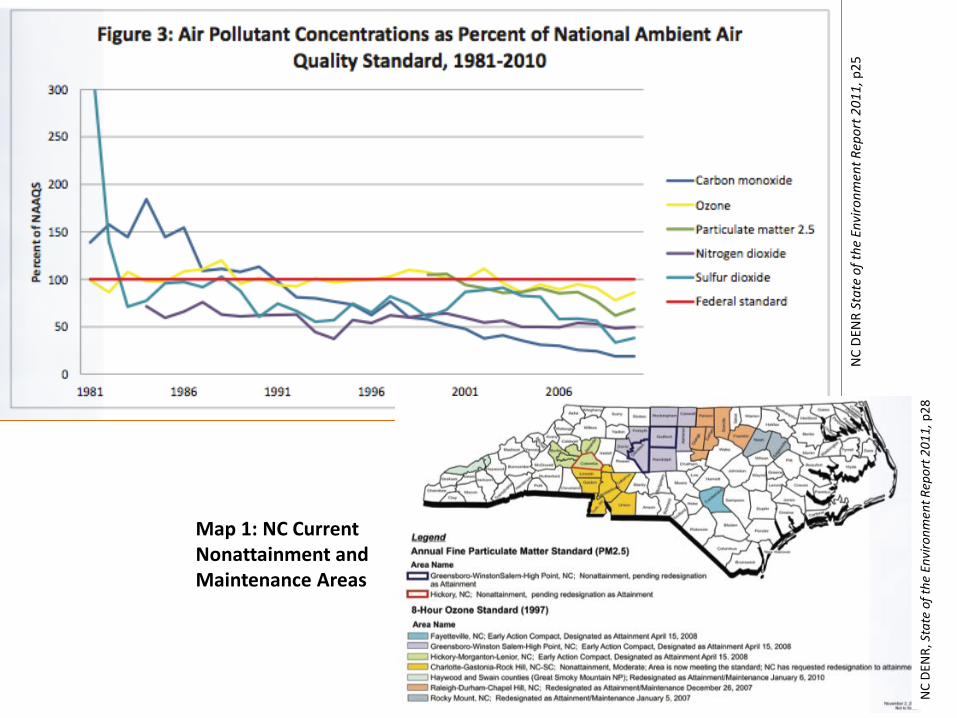
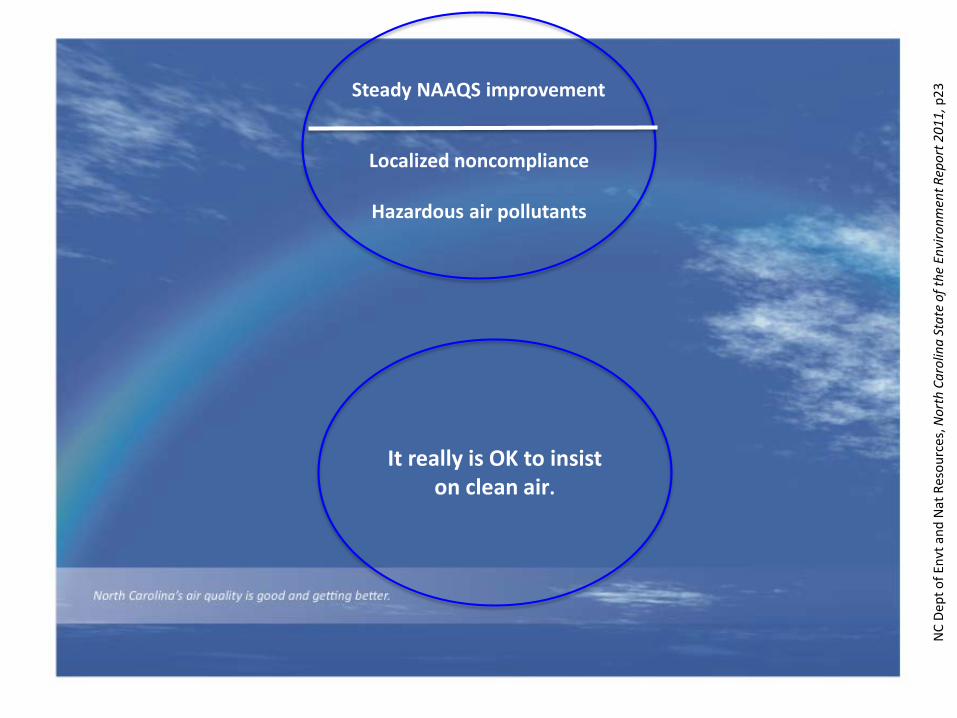
23Steady NAAQS improvement
Localized noncompliance
Hazardous air pollutants
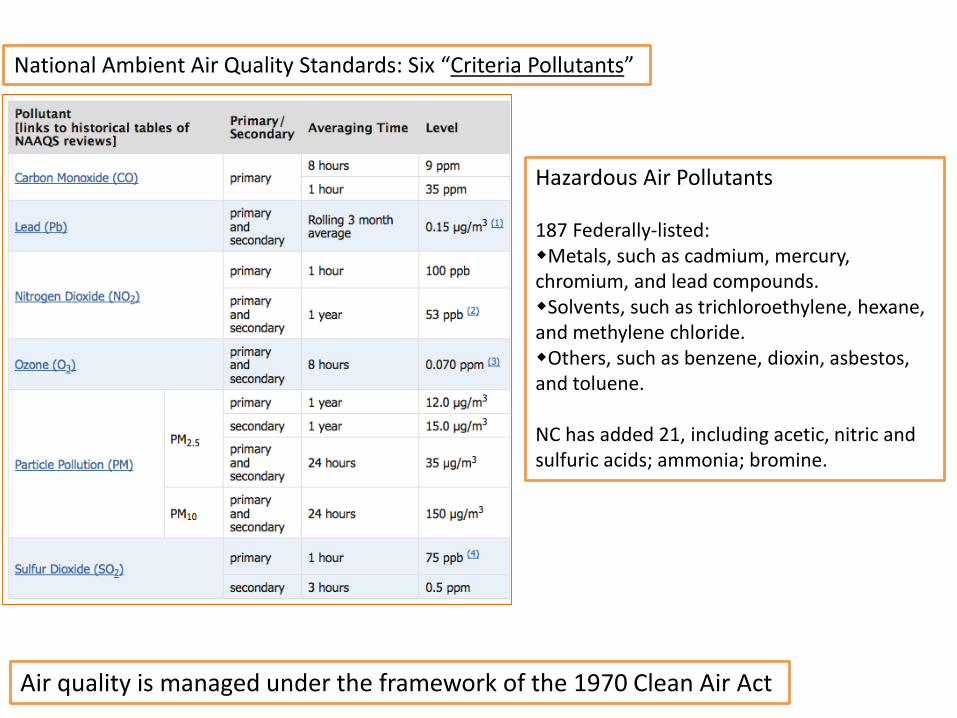
National Ambient Air Quality Standards: Six “Criteria Pollutants”
Hazardous Air Pollutants
187 Federally-listed:Metals, such as cadmium, mercury, chromium, and lead compounds.Solvents, such as trichloroethylene, hexane, and methylene chloride.Others, such as benzene, dioxin, asbestos, and toluene.
NC has added 21, including acetic, nitric and sulfuric acids; ammonia; bromine.
Air quality is managed under the framework of the 1970 Clean Air Act

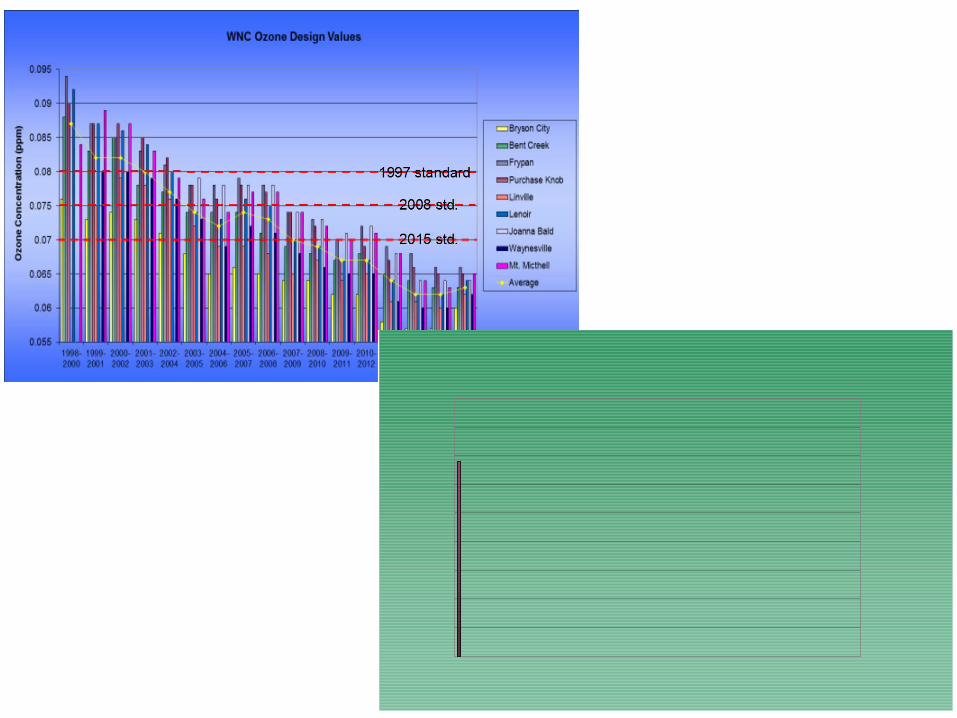
Ozone (03) (~30)
Particulate Matter 2.5 (~25)
Particulate Matter 10.0 (~12)
Sulfur Dioxide (SO2) (~12)
Nitrogen Dioxide (NO2) (~6)Carbon Monoxide (CO) (~4)
Nitrogen Oxides (NOy) (~2)
Live track NC AQ monitors here:https://deq.nc.gov/about/divisions/air-quality/air-quality-monitoring
Locations of NC Ambient Air Quality Monitors

NC
DEN
R St
ate
of th
e En
viro
nmen
t Rep
ort 2
011,
p25
NC
DEN
R, S
tate
of t
he E
nviro
nmen
t Rep
ort 2
011,
p28
Map 1: NC Current Nonattainment and Maintenance Areas
NC
DEN
R, S
tate
of t
he E
nviro
nmen
t Rep
ort 2
011,
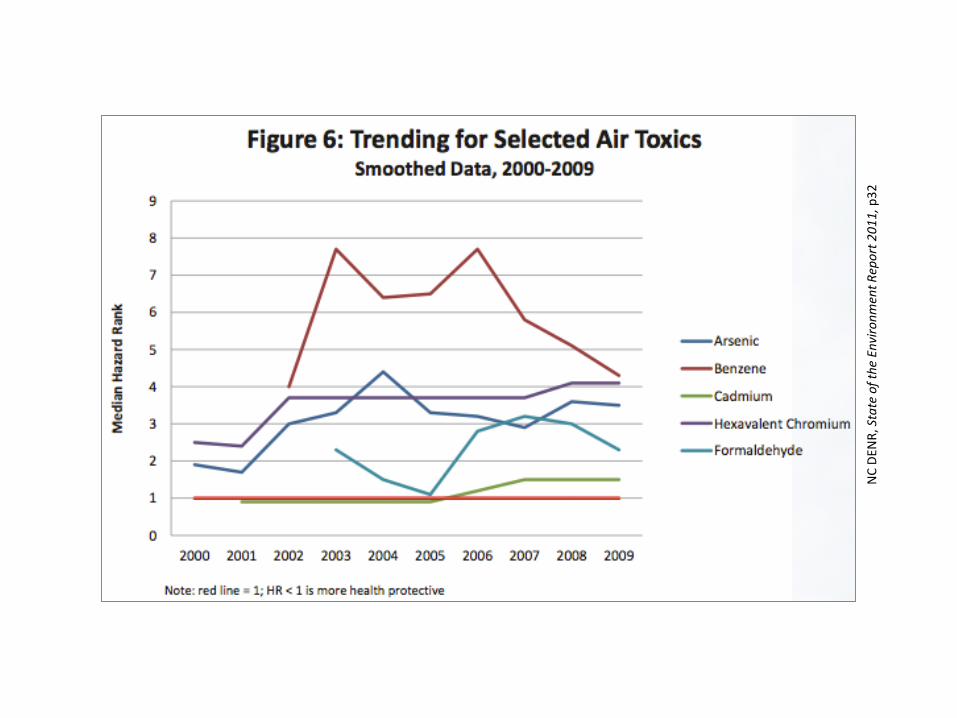
p32

National Hazardous Air Pollutant Standards: 187 regulated “Air Toxics”
2011 National Air Toxics Assessment – evaluates 138 air toxics for which EPA has health benchmarks; estimates “excess” cancer and non-cancer health risks attributable to them. In each census tract, maximum exposure is assumed over a 70 year lifetime.
Elevated risk of cancer, persons per million (2011)
U.S. 39.9
NC 41.0 VA 41.6 SC 43.8 D.C. 59.7
WY 19.8
LA is home to 8 of the 10 riskiest census tracts in the country, ranging from 4 to 20 times the average national risk.
58% of NC census tracts have risk above the national average; compared to 49% of VA tracts, and 74% of SC tracts.
97% of Mecklenburg County is above the national average; 6% is at 1.5 times the national average, or higher.
NC
Dept
of E
nvt a
nd N
at R
esou
rces
, Nor
th C
arol
ina
Stat
e of
the
Envi
ronm
ent R
epor
t 201
1, p
23Steady NAAQS improvement
Localized noncompliance
Hazardous air pollutants
It really is OK to insist on clean air.
AIR
Air Quality
LAND
Land Conservation
Waste Disposal
WATER
Water Quality
Water Quantity
CLIMATE+ ENERGY
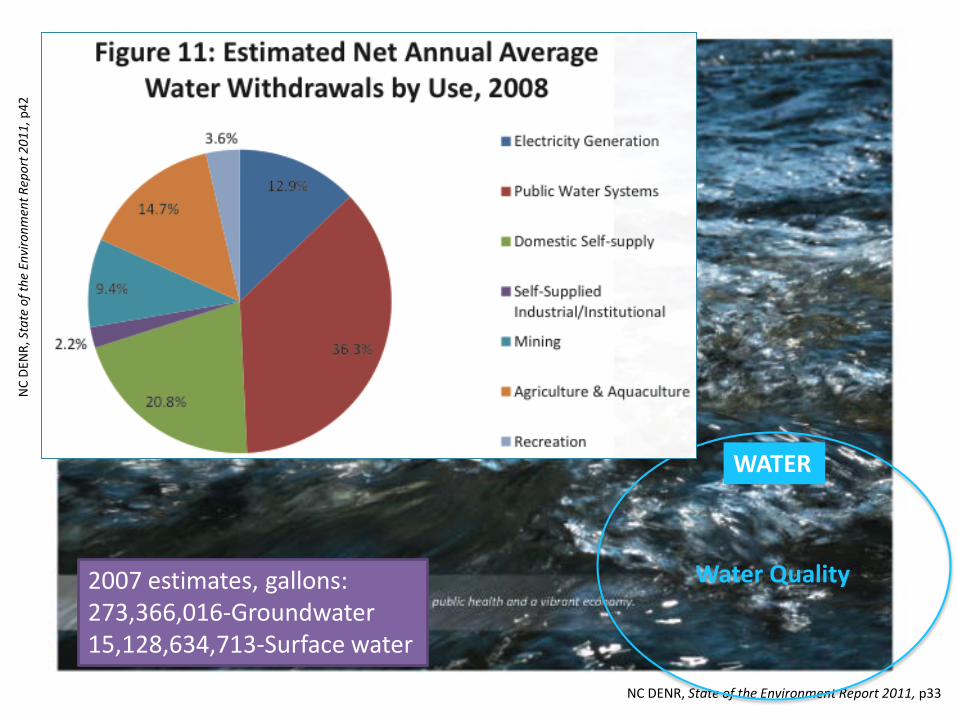
NC DENR, State of the Environment Report 2011, p33
WATER
Water Quality
NC
DEN
R, S
tate
of t
he E
nviro
nmen
t Rep
ort 2
011,
p42
2007 estimates, gallons:273,366,016-Groundwater15,128,634,713-Surface water
NC
DEN
R, S
tate
of t
he E
nviro
nmen
t Rep
ort 2
011,
p35
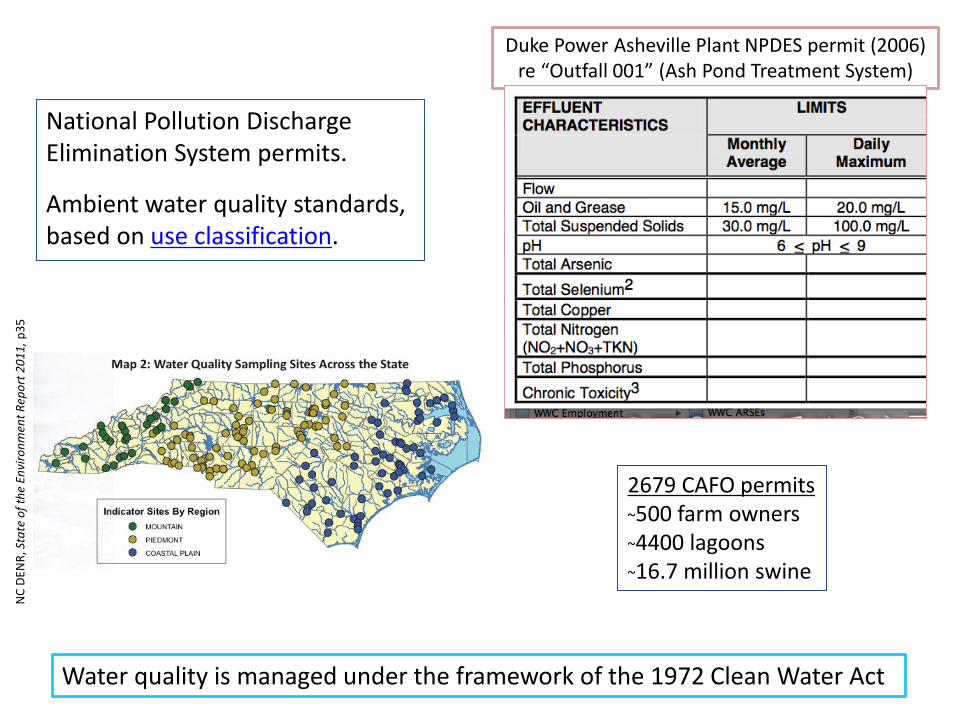
Water quality is managed under the framework of the 1972 Clean Water Act
Duke Power Asheville Plant NPDES permit (2006)re “Outfall 001” (Ash Pond Treatment System)
2679 CAFO permits~500 farm owners~4400 lagoons~16.7 million swine
National Pollution Discharge Elimination System permits.
Ambient water quality standards, based on use classification.

NC DENR, State of the Environment Report 2011, pp36-37
1970s 1980s

NC
DEN
R, S
tate
of t
he E
nviro
nmen
t Rep
ort 2
011,
p38
39% of the state’s surface
waters are considered “impaired.”

NC DENR, State of the Environment Report 2011, p41
Groundwater is in much better shape.

Southern Environmental Law Center (2016)
A couple of key issues...coal ash...
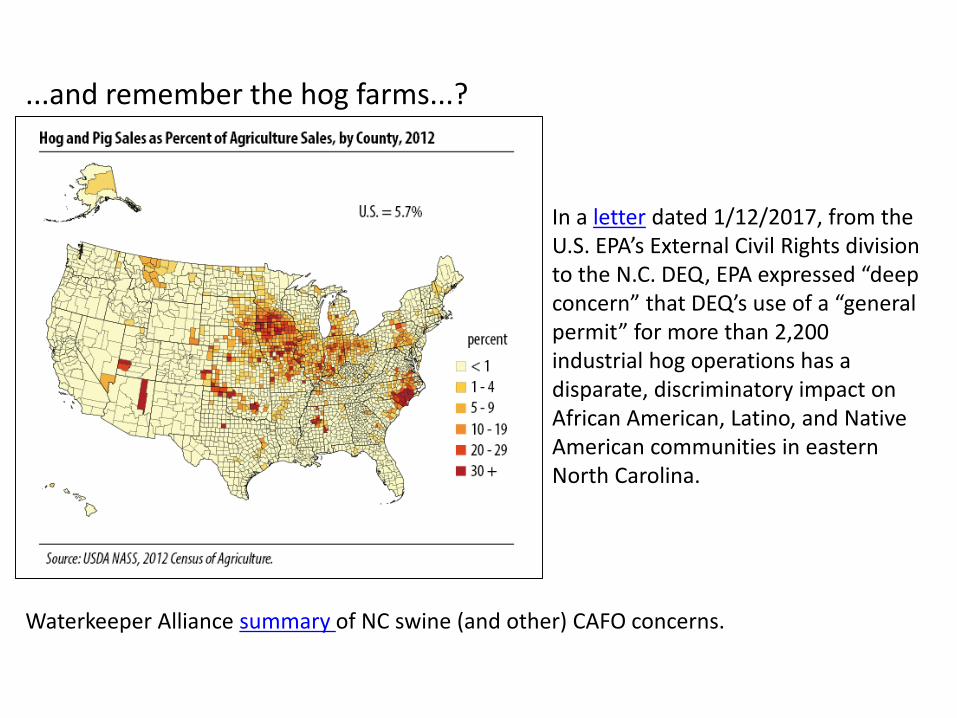
Waterkeeper Alliance summary of NC swine (and other) CAFO concerns.
In a letter dated 1/12/2017, from the U.S. EPA’s External Civil Rights division to the N.C. DEQ, EPA expressed “deep concern” that DEQ’s use of a “general permit” for more than 2,200 industrial hog operations has a disparate, discriminatory impact on African American, Latino, and Native American communities in eastern North Carolina.
...and remember the hog farms...?
NC
Dept
of E
nvta
nd N
at R
esou
rces
, Nor
th C
arol
ina
Stat
e of
the
Envi
ronm
ent R
epor
t 201
1, p
49
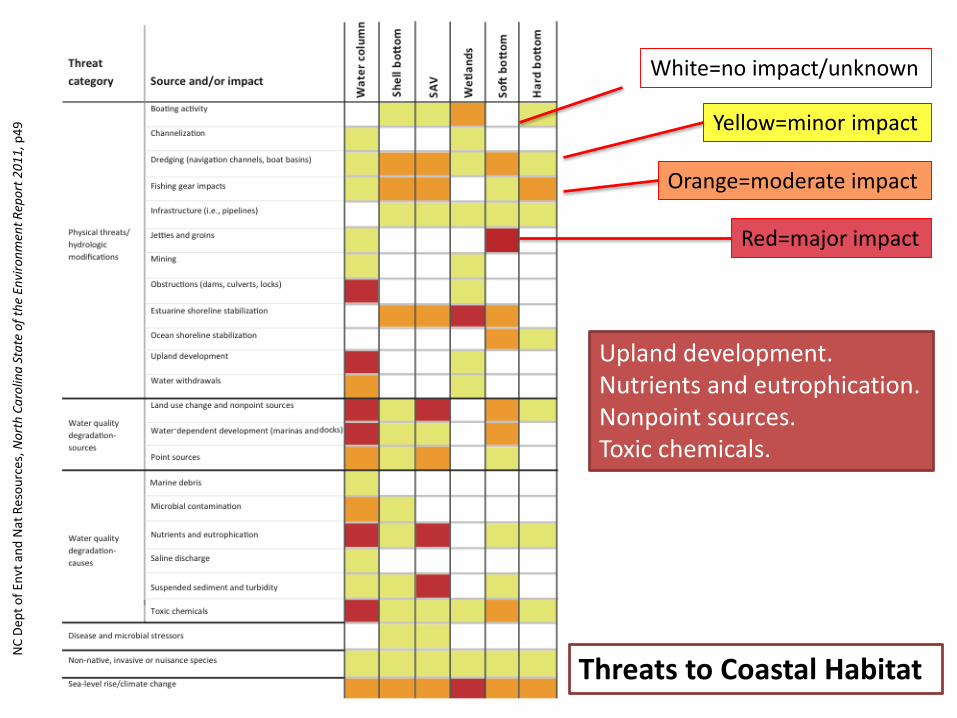
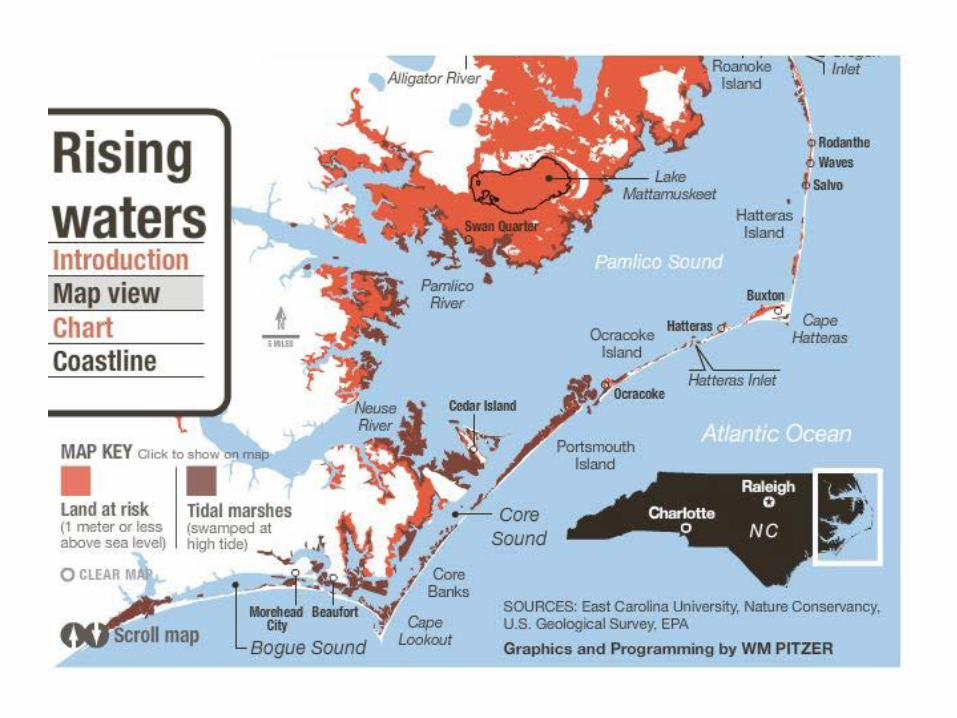
Threats to Coastal Habitat
White=no impact/unknown
Yellow=minor impact
Orange=moderate impact
Red=major impact
Upland development.Nutrients and eutrophication.Nonpoint sources.Toxic chemicals.

NC DENR Div of Marine Fisheries coastal water quality sampling, interactive map: http://portal.ncdenr.org/web/mf/testing-sites
NC DENR, State of the Environment Report 2011, p52

NC DENR, State of the Environment Report 2011, p33
We have enough water, and it is mostly clean.
A lot of it is dirty, and we must plan
for shortages.
It’s OK to ask farming and utilities to be
accountable.

AIR
Air Quality
LAND
Land Conservation
Waste Disposal
WATER
Water Quality
Water Quantity
CLIMATE+ ENERGY

Question: What can you do about
climate change?

U.S. Energy Consumption, Quadrillion Btus, 1949-2015by
SO
URC
E
TOTA
L

N.C. Energy Consumption, Trillion Btus, 1960-2014by
SO
URC
E
TOTA
L
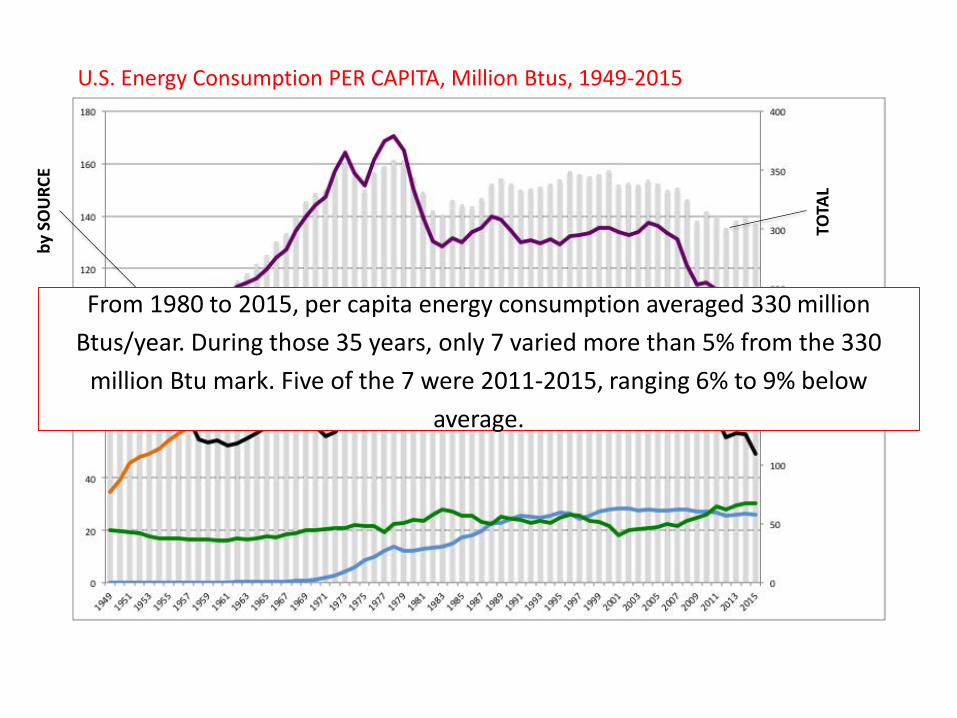
U.S. Energy Consumption PER CAPITA, Million Btus, 1949-2015by
SO
URC
E
TOTA
L
From 1980 to 2015, per capita energy consumption averaged 330 million Btus/year. During those 35 years, only 7 varied more than 5% from the 330
million Btu mark. Five of the 7 were 2011-2015, ranging 6% to 9% below average.

2016 Energy UsemBtu/Capita
U.S. EIA (2018)
WY 860 (2)
RI176 (51)
SC 333 (18)
NC 251 (37)
VA 277 (31)CA 199 (48)
2014 Energy-Related CO2 emission
metric tons/Capita
WY 112.3 (1)NY 8.6 (50)
SC 15.5 (28)
NC 12.8 (34)
VA 12.5 (38)
CA 9.2 (49)
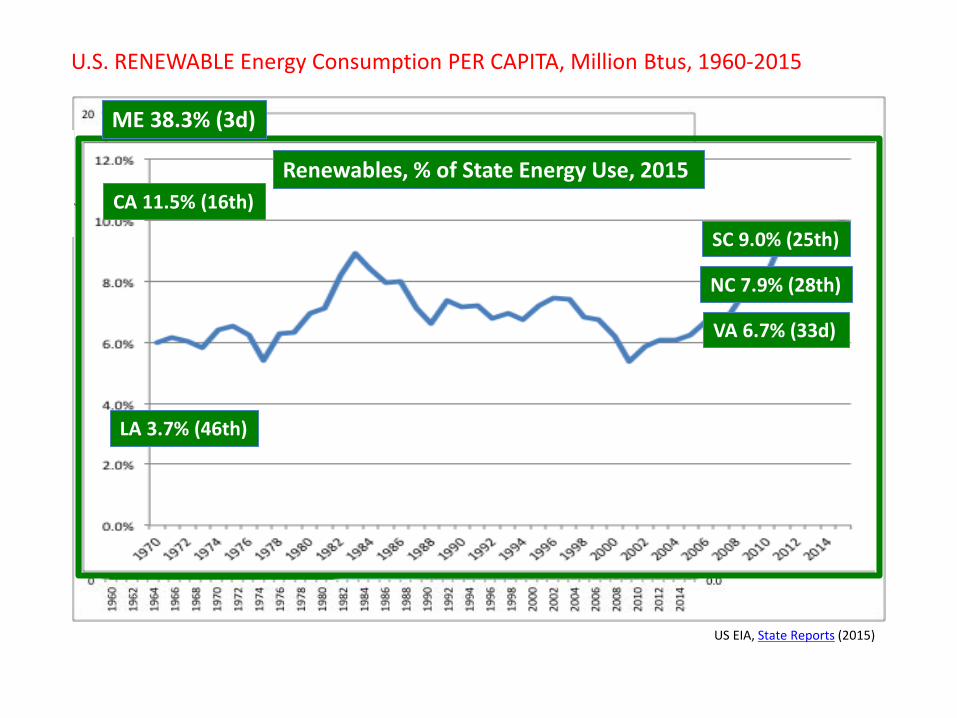
U.S. RENEWABLE Energy Consumption PER CAPITA, Million Btus, 1960-2015by
SO
URC
E
TOTA
LRenewables as % of Total, 1970-2015
VA 6.7% (33d)
NC 7.9% (28th)
SC 9.0% (25th)
ME 38.3% (3d)
US EIA, State Reports (2015)
CA 11.5% (16th)
LA 3.7% (46th)
Renewables, % of State Energy Use, 2015
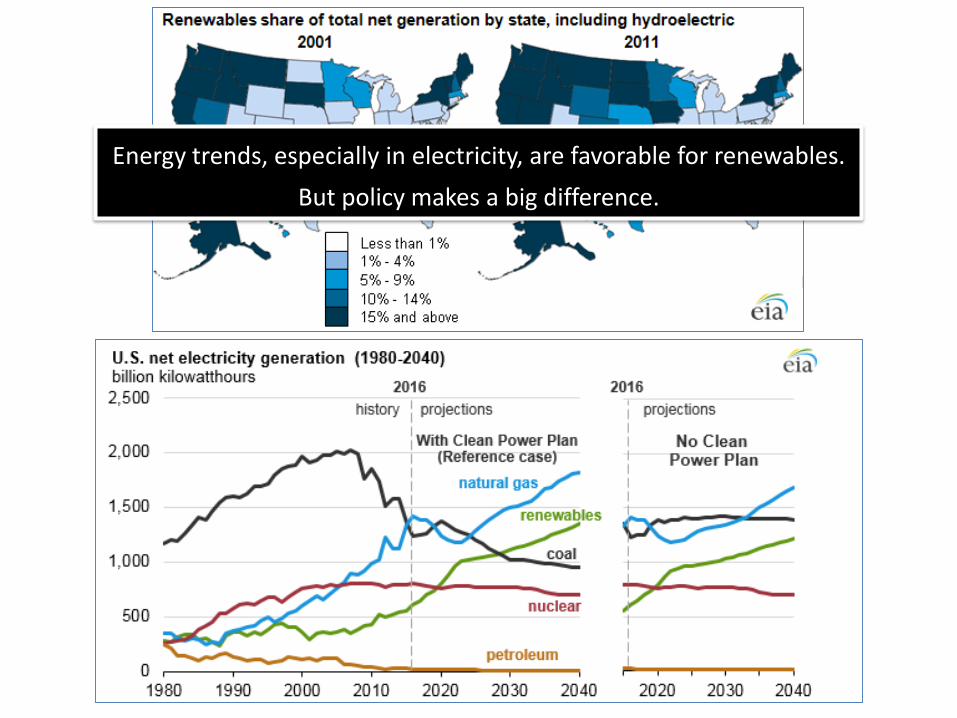
Energy trends, especially in electricity, are favorable for renewables. But policy makes a big difference.
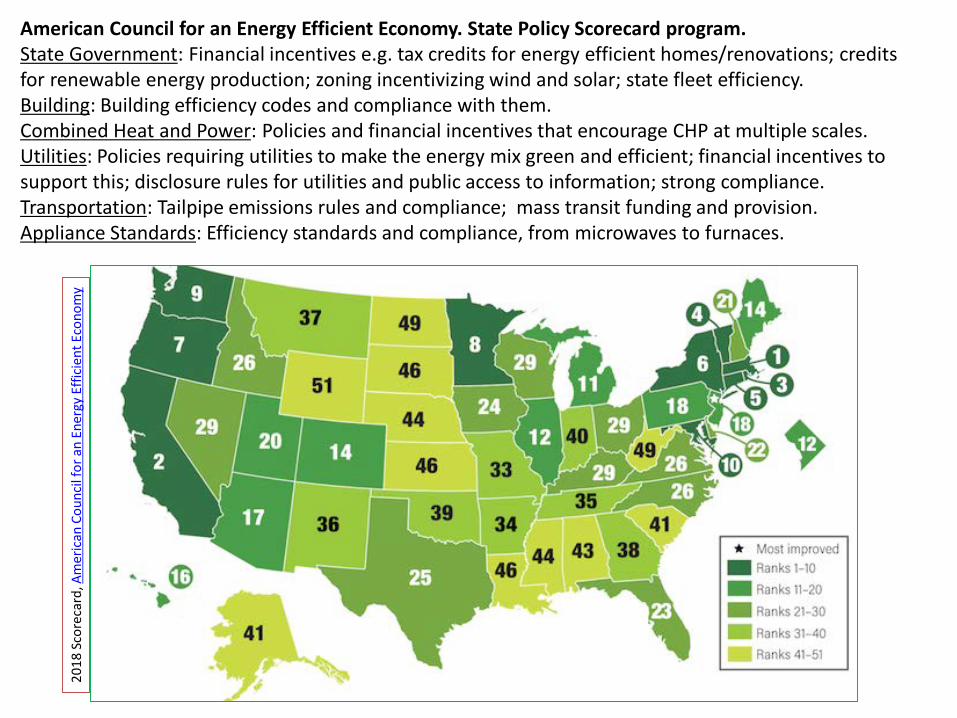
American Council for an Energy Efficient Economy. State Policy Scorecard program.State Government: Financial incentives e.g. tax credits for energy efficient homes/renovations; credits for renewable energy production; zoning incentivizing wind and solar; state fleet efficiency.Building: Building efficiency codes and compliance with them.Combined Heat and Power: Policies and financial incentives that encourage CHP at multiple scales.Utilities: Policies requiring utilities to make the energy mix green and efficient; financial incentives to support this; disclosure rules for utilities and public access to information; strong compliance.Transportation: Tailpipe emissions rules and compliance; mass transit funding and provision.Appliance Standards: Efficiency standards and compliance, from microwaves to furnaces.
2018
Sco
reca
rd, A
mer
ican
Cou
ncil
for a
n En
ergy
Effi
cien
t Eco
nom
y
N.C
. Coa
stal
Res
ourc
es C
omm
issio
n Sc
ienc
e Pa
nel o
n Co
asta
l Haz
ards
, Nor
th C
arol
ina
Sea
Leve
l Ri
se A
sses
smen
t Rep
ort (
2010
), p1
1 (u
nder
aus
pice
of N
CDEN
R D
ivof
Coa
stal
Man
agem
ent
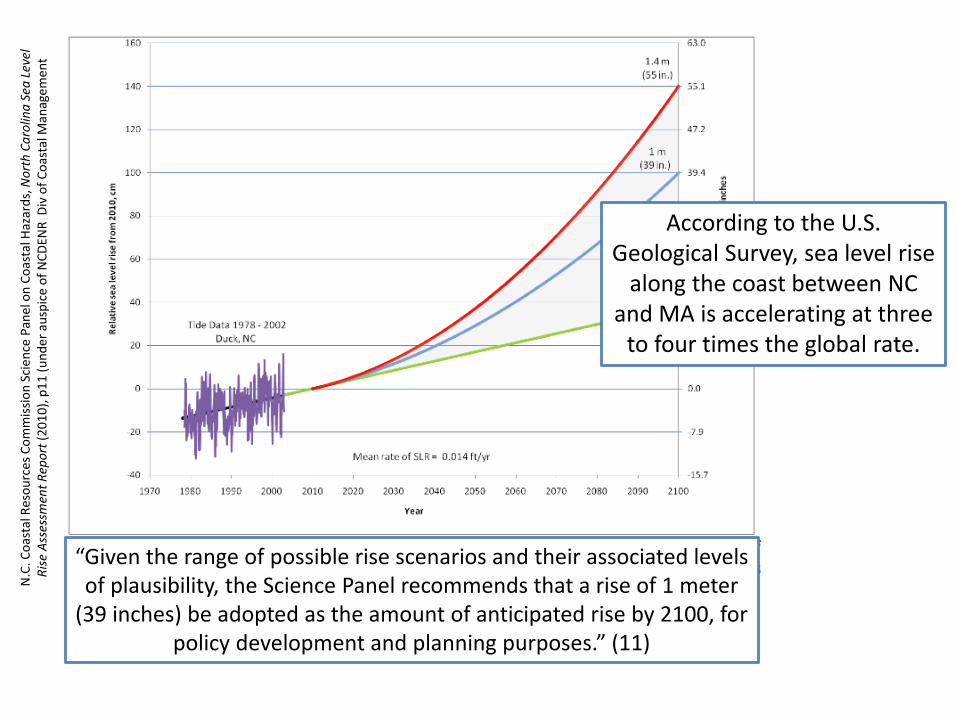
“Given the range of possible rise scenarios and their associated levels of plausibility, the Science Panel recommends that a rise of 1 meter
(39 inches) be adopted as the amount of anticipated rise by 2100, for policy development and planning purposes.” (11)
According to the U.S. Geological Survey, sea level rise
along the coast between NC and MA is accelerating at three
to four times the global rate.

Policy has successfully driven market forces in the direction of renewables.
And it can do more!!
Look into solarizing your house!Buy a used electric vehicle!
AIR
Air Quality
LAND
Land Conservation
Waste Disposal
WATER
Water Quality
Water Quantity
Thanks!Questions?
CLIMATE+ ENERGY
Dr. Amy KnisleyEnvironmental StudiesWarren Wilson [email protected]


NC Agricultural Development and Farmland Preservation Trust (2013)
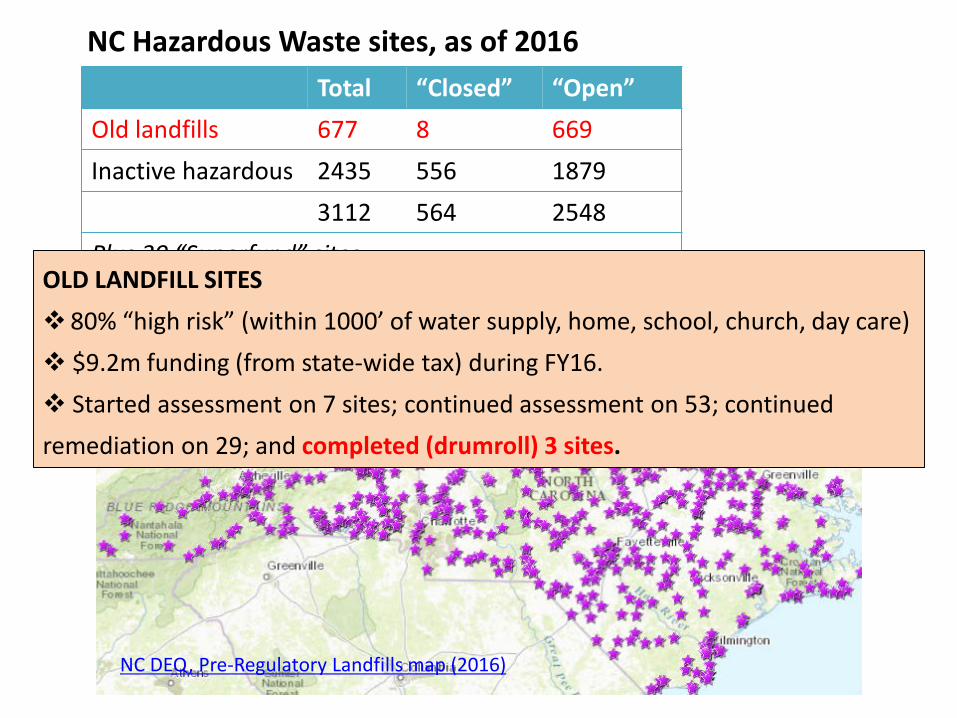
NC DEQ, Pre-Regulatory Landfills map (2016)
Total “Closed” “Open”Old landfills 677 8 669Inactive hazardous 2435 556 1879
3112 564 2548Plus 39 “Superfund” sites.
NC Hazardous Waste sites, as of 2016
NC DEQ , Inactive Hazardous Sites Report to the Legislature (2016).OLD LANDFILL SITES80% “high risk” (within 1000’ of water supply, home, school, church, day care) $9.2m funding (from state-wide tax) during FY16. Started assessment on 7 sites; continued assessment on 53; continued remediation on 29; and completed (drumroll) 3 sites.

NC DEQ , Inactive Haz Waste Sites Map (2016)
Total “Closed” “Open”Old landfills 677 8 669Inactive hazardous 2435 556 1879
3112 564 2548Plus 39 “Superfund” sites.
NC Hazardous Waste sites, as of 2016
NC DEQ , Inactive Hazardous Sites Report to the Legislature (2016).INACTIVE HAZARDOUS SITES360 (~20%) of the open sites are “orphaned.” 314 of those are “high risk” $400,000 annual appropriations for these sites; plus bankruptcy recoveries. $670,500 estimated for each cleanup (so $241m needed).