north fork spring river jasper county, missouri · u.s. environmental protection agency region 7...
TRANSCRIPT
U.S. Environmental Protection Agency Region 7
North Fork Spring River Jasper County, Missouri
Total Maximum Daily Load
October, 2006
Approved by: __________/s/__________________ __11/22/06___ William A. Spratlin Date Director Water, Wetlands and Pesticides Division

North Fork Spring River TMDL - 1 -
Total Maximum Daily Load (TMDL) For North Fork Spring River
Pollutant: Sediment
Name: North Fork Spring River Location: Dade, Barton, and Jasper Counties, Missouri Hydrologic Unit Code (HUC): 11070207 Water Body Identifications (WBID): 3188 Missouri Stream Classification: Class C1
Beneficial Uses2:
• Livestock and Wildlife Watering • Protection of Warm Water Aquatic Life • Human Health Protection (Fish Consumption) • Whole Body Contact Recreation (Category B)
Impaired Use: Protection of Warm Water Aquatic Life Size of Impaired Segment: 51.5 miles Location of Impaired Segment: From Section 1, T29N, R32W in Jasper County to Section 20, T30N, R28W in Dade County. Pollutant Source: Agricultural Nonpoint Sources Pollutant: Sediment TMDL Priority Ranking: Low 1. Introduction This North Fork Spring River Total Maximum Daily Load (TMDL) for sediment is being established in accordance with Section 303(d) of the Clean Water Act. The State of Missouri placed North Fork Spring River on the 1998 and 2002 303(d) lists of impaired waters because water quality standards (WQS), were exceeded due to sediment. To meet the milestones of the 2001 Consent Decree, American Canoe Association, et al. v. EPA, No. 98-1195-CV-W in consolidation with No. 98-4282-CV-W, February 27, 2001, EPA is establishing this TMDL. 1 Class C streams may cease to flow in dry periods but maintain permanent pools that support aquatic life. See Missouri Water Quality Standards (WQS) 10 Code of State Regulations 20-7.031(1)(F). The WQS can be found at the following uniform resource locator (URL): http://www.dnr.mo.gov/env/wpp/rules/index.html#Chap7 2 For beneficial uses, see 10 CSR 20-7.031(1)(C) and Table (H)

North Fork Spring River TMDL - 2 -
The purpose of a TMDL is to determine the pollutant loading a waterbody can assimilate without exceeding the WQS for that pollutant. The TMDL also establishes the pollutant load allocation necessary to meet the WQS established for each waterbody based on the relationship between pollutant sources and in-stream water quality conditions. The TMDL consists of a wasteload allocation (WLA), a load allocation (LA), and margin of safety (MOS). The WLA is the fraction of the total pollutant load apportioned to point sources. The LA is the fraction of the total pollutant load apportioned to nonpoint sources. The MOS can be expressed as percentage of the TMDL that accounts for the uncertainty associated with the model assumption and data inadequacies. 2. Background and Water Quality Problems Background
North Fork Spring River is located in the Spring River Basin (HUC 11070207), and flows from Dade to Jasper County. Fifty-one and a half miles of North Fork Spring River is listed as impaired by sediment. The associated watershed is approximately 470 square miles with predominant land use of grassland, cropland, and deciduous forest (Table 1 and Figure 1). The primary cause of the sediment impairment to North Fork Spring River has been identified as pollution caused by agricultural nonpoint sources. North Fork Spring River originates in western Dade County near the town of Golden City and is located within the Ozark/Elk/Spring Ecological Drainage Unit (EDU). A biological assessment and habitat study was done on North Fork Spring River. The study area was split and included Dade-Barton Counties (upper)3 and Barton-Jasper Counties (lower).4 The 24 miles of upper North Fork Spring River are listed as Class C waters, and constitute approximately the upper half of the listed segment. The 24 miles of lower North Fork Spring River are also listed as Class C waters, and constitute approximately the lower half of the listed segment.
Table 1: North Fork Spring River Land Use Distribution
% Class 47 Cropland 41 Grassland
5.9 Deciduous
forest/woody/herbaceous 2.3 wetland
1.9 Impervious 0.7 open water 0.7 low intensity urban 0.4 Barren
3 Biological Assessment and Habitat Study, Upper North Fork Spring River, Dade and Barton Counties, 2003-2004. Department of Natural Resources, Environmental Services Program. 4 Biological Assessment and Habitat Study, Lower North Fork Spring River, Barton and Jasper Counties, 2004. Department of Natural Resources, Environmental Services Program.

North Fork Spring River TMDL - 3 -
All waters of the State, as per Missouri WQS, must provide suitable conditions for aquatic life. The conditions include both the physical habitat and the quality of the water. TMDLs are not written to address habitat, but are written to correct water quality conditions. Because the water body addressed by this TMDL was assessed as to its biological function, many factors may have contributed to the impairment. The State of Missouri continues to do field evaluation, and in the future, may define the role sediment is playing in the potential biological impairment of this waterbody. However, the water quality condition for which North Fork Spring River is currently listed is sedimentation; therefore, this TMDL addresses sediment. The State of Missouri may submit and EPA may approve another TMDL or a modified 303(d) listing for this water at a later time to address new information on the impairment.
Water Quality The quality and quantity of habitat for aquatic life have been affected generally in
Missouri. A combination of natural geology and land use in the Ozark portions of the State (where North Fork Spring River is located) is believed to have incurred these habitat alterations. In the Spring River basin, the most serious nonpoint pollution problem is degradation of aquatic habitat. The lack of infiltration of rainfall, when combined with local soil tillage and other land uses, leads to a large amount of surface runoff during wet weather. This contributes to soil erosion and high levels of sediment deposition in streams. The quality of aquatic habitat is further impaired by removal of wooded riparian vegetation elevating water temperatures in the summer, and by the channelization, or straightening, of streams. Excessive rates of sediment deposition due to stream bank erosion and sheet erosion from agricultural lands, as well as changes in basin hydrology increasing flood flows and prolonged low flow conditions, all are impacting the habitat. The most compelling evidence of loss or impairment of aquatic habitat has been demonstrated by the change in historical distribution of fishes in Missouri. Many species of fish no longer appear in portions of the State where they once lived.5
North Fork Spring River was placed on the 1998 and 2002 Missouri 303(d) lists for
sedimentation. This was primarily based on best professional judgment because little sediment data exists to directly document sediment impacts to the stream. General fisheries data and the effect of sediment on fish were the initial data used to consider North Fork Spring River for 303(d) listing. For this TMDL, sediment targets were derived using generalized information from the ecological drainage unit (EDU).
Since the 303(d) listing, Missouri Department of Natural Resources (MDNR) has developed a sediment protocol to determine if sediment is actually the pollutant in the streams listed and to arrive at a standard way to measure sediment. The first step of that protocol is a biological assessment to see if the biological community is actually impaired. In the case of North Fork Spring River, the studies measured habitat quality, water quality, and macroinvertebrate (like larval mayflies and crayfish) communities. Biological assessments were
Figure 1: Land Use Map for North Fork Spring River Watershed
5 Missouri Department of Natural Resources (MDNR) (2005). Total Maximum Daily Load (TMDL) Information Sheet for Streams with Aquatic Habitat Loss that are Listed for Sediment, http://www.dnr.mo.gov/env/wpp/tmdl/info/habitat-info.pdf

North Fork Spring River TMDL - 4 -

North Fork Spring River TMDL - 5 -
conducted in 2003-2004. Ten stations were assessed in the 51.5-mile impaired segment. The biological assessment results indicated that North Fork Spring River is biologically impaired.6 3. Description of Sources Point Sources
Three site-specific National Pollutant Discharge Elimination System (NPDES) permitted municipal wastewater treatment facilities (WWTF) are located within the watershed (Table 2): Lamar WWTF, Jasper WWTF, and Golden City WWTF.
Livestock in the watershed includes many horses, cattle, and hogs held in pastures,
feedlots, and Concentrated Animal Feeding Operations (CAFO). Five operations are registered, certified or permitted within the watershed (Table 2). CAFOs are animal feeding operations in which animals are confined to areas that are totally roofed. CAFOs typically utilize earthen or concrete structures to contain and store manure prior to land application.
All permitted livestock facilities have waste management systems designed to minimize
runoff entering their operations or detaining runoff emanating from their areas. Such systems are designed for the 25-year, 24-hour rainfall/runoff event. NPDES permits, also non-discharging, are issued for facilities with more than 1,000 animal units (AU). For all facilities, total potential numbers are approximately 6,322 AU. The actual number of AUs on site is variable, but typically less than potential numbers.
Table: 2 Permitted Facilities in North Fork Spring River Watershed
Facility Permit number County Design Flow
HARTMAN, LAWRENCE & DEBRA MO-G010136 JASPER Non discharging RITCHHART, RUSSELL MO-G010403 JASPER Non discharging JOYCE, MATT-REYOYCE NRSRY MO-G010558 JASPER Non discharging JOYCE, BILL MO-G010559 JASPER Non discharging MISSOURI FARMS DAIRY MO-G010586 JASPER Non discharging GOLDEN CITY WWTF MO-0031658 BARTON 0.125 MGD LAMAR WWTF MO-0044172 BARTON 0.9 MGD JASPER WWTF – outfall #001 MO-0044202 JASPER Emergency discharge only JASPER WWTF – outfall #002 MO-0044202 JASPER 0.135 MGD MFA BULK PLANT-JASPER MO-G350160 JASPER Storm water, dewatering MFA BULK PLANT-GOLDEN CTY MO-G350161 BARTON Storm water, dewatering MIDWEST MINERALS-JASPER Q MO-G490063 BARTON Storm water, dewatering G & H REDI-MIX - LAMAR MO-G490944 BARTON Storm water, dewatering LAMAR MUNICIPAL WTP MO-G640014 BARTON filter backwash JASPER PRODUCTS MO-G822142 JASPER Non discharging
6 Biological Assessment and Habitat Study, Upper North Fork Spring River, Dade and Barton Counties, 2003-2004. Department of Natural Resources, Environmental Services Program.
Biological Assessment and Habitat Study, Lower North Fork Spring River, Barton and Jasper Counties, 2004. Department of Natural Resources, Environmental Services Program.

North Fork Spring River TMDL - 6 -
BLUE TOP MOTEL & CAFE WWT MO-0034410 BARTON 0.0095 MGD FELTENBERGER ENTERPRISES/ MO-0096270 BARTON 0.0054 MGD
LAMAR CLOSED SANI LANDFIL MO-0110272 BARTON 2.44 MGD, 10yr-24hr
precipitation SUPER 8 MOTEL MO-0120456 BARTON 0.0061 MGD SILVER OAK SENIOR LIVING MO-0121941 BARTON Non discharging WILLIAM EMMERLING JR. MO-0124028 BARTON Non discharging EPOCH COMPOSITE PRODUCTS, MO-0129879 BARTON 0.03 MGD
NonPoint Sources
Most of the watershed is cropland (47%), grassland (41%), or woodland (6%). Much of the main stem is near or adjacent to cropland in the watershed. Cropland that is adjacent to and drains into North Fork Spring River could contribute to the sediment impairment. In addition to the five NPDES-permitted CAFOs in the watershed, there is other livestock (Table 3).
Overland runoff can easily carry sediment into the stream. Soil from exposed land runs
into the creek, increasing the turbidity and concentration of total suspended solids (TSS) and decreasing the transparency. Background levels of TSS come from natural fluvial processes. Sediment becomes suspended during high flow events as soil along the banks is eroded and bed sediment is resuspended. Sediment loading in North Fork Spring River comes predominantly from nonpoint source pollution. Sediment from urban land may get transported into the watershed, but less than one percent of the watershed is urban (Table 1).
Table 3: Livestock Estimates per County7
Dade Barton Jasper Cattle Animal Units Beef 37,979 23,832 30,573 Milk 1,103 458 1,863 Cow/Calf 69,500 45,618 61,531 Hogs/Pigs 7,394 59,674 18,123 Sheep/Lambs 233 394 955 Poultry Layers 456 310 852 Broilers (D) 15 (D)
(D) Withheld to avoid disclosing data for individual farms.
7 USDA- NASS Quick Stats (Livestock) 2002 Census of Agriculture, Volume 1 Chapter 2: Missouri County Level Data http://www.nass.usda.gov/census/census02/volume1/mo/st29_2_001_001.pdf

North Fork Spring River TMDL - 7 -
4. Description of the Applicable WQS and Water Quality Targets Beneficial Uses: North Fork Spring River has the following beneficial uses:
• Livestock and Wildlife Watering • Protection of Warm Water Aquatic Life • Human Health Protection (Fish Consumption) • Whole Body Contact Recreation (Category B)
The stream classifications and designated uses may be found at 10 CSR20-7.031(1)(C) and (F) and Table H. Use that is impaired: Protection of Warm Water Aquatic Life Antidegradation Policy: Missouri’s WQS include the EPA “three-tiered” approach to antidegradation, and may be found at 10 CSR 20-7.031(2).
Tier 1 – Protects existing uses and provides the absolute floor of water quality for all waters of the United States. Existing instream water uses are those uses that were attained on or after November 29, 1975, the date of EPA’s first WQS Regulation, or uses for which existing water quality is suitable unless prevented by physical problems such as substrate or flow.
Tier 2 – Protects the level of water quality necessary to support propagation of fish, shellfish, and wildlife and recreation in and on the water in waters that are currently of higher quality than required to support these uses. Before water quality in Tier 2 waters can be lowered, there must be an antidegradation review consisting of: (1) a finding that it is necessary to accommodate important economical or social development in the area where the waters are located; (2) full satisfaction of all intergovernmental coordination and public participation provisions; and (3) assurance that the highest statutory and regulatory requirements for point sources and best management practices (BMPs) for nonpoint sources are achieved. Furthermore, water quality may not be lowered to less than the level necessary to fully protect the “fishable/swimmable” uses and other existing uses. Tier 3 – Protects the quality of outstanding national resources, such as waters of national and state parks, wildlife refuges and waters of exceptional recreational or ecological significance. There may be no new or increased discharges to these waters and no new or increased discharges to tributaries of these waters that would result in lower water quality (with the exception of some limited activities that result in temporary and short-term changes in water quality).

North Fork Spring River TMDL - 8 -
Specific Criteria: The impairment of this waterbody is based on exceedence of the general, or narrative, criteria contained in Missouri’s WQS, 10 CSR 20-7.031(3)(A), (C) and (G). These criteria state:
(A) Waters shall be free from substances in sufficient amounts to cause the formation of putrescent, unsightly or harmful bottom deposits or prevent full maintenance of beneficial uses.
(C) Waters shall be free from substances in sufficient amounts to cause unsightly color or turbidity, offensive odor or prevent full maintenance of beneficial uses.
(G) Waters shall be free from physical, chemical or hydrologic changes that would impair the natural biological community.
When the WQS is expressed as a narrative value, a measurable indicator of the pollutant may be selected to express the narrative as a numeric value. There are many quantitative indicators of sediment, such as, TSS, turbidity, and bedload sediment, which are appropriate to describe sediment in rivers and streams.8 TSS was selected as the numeric target for this TMDL because it enables the use of the highest quality data available, including permit conditions and monitoring data.
5. Calculation of Load Capacity
Load capacity (LC) is defined as the maximum pollutant load that a waterbody can assimilate and still attain WQS. This total load is then divided among a WLA for point sources, a LA for nonpoint sources and a MOS. The LC for this TMDL has been defined as a curve over the range of flows for North Fork Spring River; see Figure 2, where the solid (red) curve is the TMDL. The TMDL targets up to a 94% reduction in sediment load over the range of flows, as seen in Figure 2. Measurements are shown in Figure 2, where round (black) points are loads calculated from TSS concentrations in North Fork Spring River and any corresponding horizontal bars (red) are the percent reduction required to meet the TMDL. Turbidity measurements taken during the biological assessment were used to estimate TSS concentrations using relationships developed by Doisey and Rabeni.9 These estimates along with measured TSS data are shown in Figure 2.
Modeling Approach In the case of North Fork Spring River where narrative standards are targeted for the
impaired stream, a reference approach is used. In this approach, the target for pollutant loading is the 25th percentile of the current EDU condition calculated from all data available within the EDU in which the waterbody is located. Therefore, the 25th percentile is targeted as the TMDL load duration curve (LDC). For a full description of the development of suspended sediment 8 Framework for Developing Suspended and Bedded Sediments (SABS) Water Quality Criteria, U.S. Environmental Protection Agency, EPA-822-R-06-001, May 2006. 9 Effects of Suspended Sediment on Native Missouri Fishes: A Literature Review and Synthesis. 2004. K.E. Doisey and C.F. Rabeni. University of Missouri

North Fork Spring River TMDL - 9 -
targets using reference LDC refer to Appendix A. Specific data sources for this TMDL’s flow and EDU-wide TSS data are listed in Appendix B. Table 4 shows estimates of discharge at flow percentiles.
Table 4: Estimated flow for range of percentiles at the impaired segment outlet
Percent of Flow Discharge (cubic feet per second)
10 65.5 30 125 50 207 70 360
Flow estimate for North Fork Spring River based on drainage area and synthetic
ecological drainage unit flow. 90 879
Figure 2: TMDL curve over the range of flows
North Fork Spring River Sediment Load
0.00
010.
001
0.00
5
0.05 0.1
0.2
0.3
0.5
0.6
0.7
0.8
0.9
0.95
0.99
0.99
5
0.99
90.
9995
0.99
99
0.01
0.1
1
10
100
1000
Low Flow Percentile Flow High Flow
Tons
/day
0%
10%
20%
30%
40%
50%
60%
70%
80%
90%
100%
Per
cent
Red
uctio
n
6. Load Allocation (Nonpoint Source Loads) LA is the allowable amount of the pollutant that can be assigned to nonpoint sources. The LA is set to 90% of the TMDL (Figure 2). Based on measured data from the river, the percentage of reduction in sediment load ranges to 94% over the range of flows.

North Fork Spring River TMDL - 10 -
7. Waste Load Allocation (Point Source Loads) WLA is the allowable amount of the pollutant that can be assigned to point sources. The WLA is set to the lesser of current permit limits or technology based effluent limits (TBELs). TBELs are defined in a permit based on facility type. Mechanical WWTFs’ permit limits are a weekly average TSS concentration of 45 mg/L and a monthly average TSS concentration of 30 mg/L. Secondary equivalent WWTFs’ permit limits are a weekly average TSS concentration of 60 mg/L and a monthly average TSS concentration of 45 mg/L. Waste water treatment lagoon facilities’ permit limits are up to a weekly average TSS concentration of 120 mg/L and a monthly average TSS concentration of 80 mg/L. Additionally, permits can be written to target lower limits if the specific facility is capable of performance exceeding TBELs. Table 5 lists the site specific permitted point sources in the watershed and WLAs based on their current permit limits and permitted design flows. Based on the assessment of sources, point sources do not contribute to water quality impairment relative to sediment impacts on stream biology. Thus, the WLAs are zero percentage net reduction in sediment load. These facilities’ WLAs are set at the current permit limits and conditions. The WLAs listed in this TMDL do not preclude the establishment of future point sources of sediment loading in the watershed. Any future point sources should be evaluated in light of the TMDL established and the range of flows into which any additional load will impact.
Table 5: Permitted Facilities’ WLAs
Facility Permit number WLA (tons/day) d/w/m*
GOLDEN CITY WWTF MO-0031658 NA/0.031/0.021 LAMAR WWTF MO-0044172 NA/0.41/0.26 JASPER WWTF – outfall #001 MO-0044202 NA/0.09/NA JASPER WWTF – outfall #002 MO-0044202 NA/0.04/0.025 BLUE TOP MOTEL & CAFE WWT MO-0034410 NA/0.005/0.003 FELTENBERGER ENTERPRISES/ MO-0096270 NA/0.001/0.0007 LAMAR CLOSED SANI LANDFIL MO-0110272 0.669/NA/0.502 SUPER 8 MOTEL MO-0120456 NA/0.001/0.0008 SILVER OAK SENIOR LIVING MO-0121941 Non discharging WILLIAM EMMERLING JR. MO-0124028 Non discharging EPOCH COMPOSITE PRODUCTS, MO-0129879 NA/0.006/0.006
*Permit limits based on current design loads where d=daily, w=weekly average, m=monthly average.
All permitted livestock facilities (CAFOs) “MO-G01” and all land application permits “MO-G822” are non-discharging permits (Table 2). Their WLAs are set at zero.
All other listed facilities (Table 2) have general permits. The WLAs are set at present loads and listing of permit-specific BMPs. Additionally, these permits should be reevaluated to determine if general permits are sufficient to protect the impaired segment. General Permits MO-G49xxxx limit non-stormwater discharges to a TSS concentration of 70 mg/L, and storm water discharges of settleable solids at a daily maximum of 1.5mL/L/Hr. General Permits MO-G64xxxx limit backwash outfalls to settleable solids of 1.0mL/L/Hr.

North Fork Spring River TMDL - 11 -
Stormwater runoff from all permitted facilities, also discharge to the stream. Compliance with the Missouri Storm Water Permit will ensure construction sites meet the TMDL area weighted loadings. Permittees with a general permit MOG35xxxx will develop a Storm Water Pollution Prevention Plan (SWPPP). The SWPPP ensures the design, implementation, and maintenance of BMPs. EPA assumes that construction activities in the watershed will be conducted in compliance with Missouri’s Storm Water Permit including monitoring and discharge limitations. Compliance with this permit should lead to sediment loadings from the construction site at or below applicable targets. 8. Margin of Safety A MOS is added to a TMDL to account for the uncertainties inherent in the calculations and data gathering. The MOS is intended to account for such uncertainties in a conservative manner. Based on EPA guidance, the MOS can be achieved through one of two approaches: (1) Explicit – Reserve a numeric portion of the LC as a separate term in the TMDL. (2) Implicit – Incorporate the MOS as part of the critical conditions for the WLA and the LA calculations by making conservative assumptions in the analysis.
Available data for North Fork Spring River shows instances where loads exceed the TMDL (Figure 2). The biological assessment results indicated that North Fork Spring River is biologically impaired. To account for uncertainties in the modeling an explicit 10% MOS is assigned to this TMDL. For example, at a flow probability of 0.5 (median flow), the TMDL is approximately 2.80 tons per day. The MOS would be 0.28 tons per day. 9. Seasonal Variation The TMDL curve represents flow under all seasonal conditions. The LA and TMDL are applicable at all flow conditions, hence all seasons. The advantage of a LDC approach is to avoid the constraints associated with using a single-flow critical condition during the development of a TMDL. Therefore, all flow conditions, including seasonal variation, are taken into account for TMDL calculations.
Bioassessment data used in this TMDL was generated by MDNR’s Environmental
Services Program (ESP). Invertebrate sampling was collected for two seasons, September (fall) 2003 upper, March (spring) 2004 upper, and August/September/October (fall) 2004 lower.

North Fork Spring River TMDL - 12 -
10. Monitoring Plans for North Fork Spring River A bioassessment was conducted on North Fork Spring River in 2003-2004. Ten stations were assessed in the 51.5-mile impaired segment. No future monitoring has been scheduled for North Fork Spring River at this time. However, MDNR will routinely examine physical habitat, water quality, invertebrate community, and fish community data collected by the Missouri Department of Conservation under its Resource Assessment and Monitoring (RAM) Program. This program randomly samples streams across Missouri on a five to six year rotating schedule. 11. Public Participation EPA regulations require that TMDLs be subject to public review (40 CFR 130.7). EPA is providing public notice of this TMDL for North Fork Spring River on the EPA, Region 7, TMDL website: http://www.epa.gov/region07/water/tmdl_public_notice.htm. The response to comments and final TMDL will be available at: http://www.epa.gov/region07/water/apprtmdl.htm#Missouri. This water quality limited segment of North Fork Spring River in Dade, Barton, and Jasper Counties, Missouri, is included on the EPA approved 1998 and 2002 303(d) lists for Missouri. This TMDL is being produced by EPA to meet the requirements of the 2001 Consent Decree, American Canoe Association, et al. v. EPA, No. 98-1195-CV-W in consolidation with No. 98-4282-CV-W, February 27, 2001. EPA is developing this TMDL in cooperation with the State of Missouri, and EPA is establishing this TMDL at this time to fulfill the American Canoe consent decree obligations. Missouri may submit and EPA may approve another TMDL for this water at a later time. As part of the public notice process, MDNR assists EPA by providing a distribution list of interested persons to which EPA will provide an announcement of the North Fork Spring River TMDL. Groups that receive the public notice announcement include the Missouri Clean Water Commission, the Missouri Water Quality Coordinating Committee, Stream Team Volunteers in the county, county legislators, and potentially impacted cities, towns and facilities. . The EPA public noticed this TMDL from October 6, 2006, to November 5, 2006, and the Summary of Response to Comments is posted on the EPA website: http://www.epa.gov/region07/water/apprtmdl.htm#Missouri. 12. References
• Quality Assurance Project Plan for Wasteload Allocations/Special Studies, 2007, MDNR.
• USDA- NASS Quick Stats (Livestock) 2002 Census of Agriculture, Volume 1 Chapter 2: Missouri County Level Data http://www.nass.usda.gov/census/census02/volume1/mo/st29_2_001_001.pdf
• Framework for Developing Suspended and Bedded Sediments (SABS) Water Quality
Criteria, U.S. Environmental Protection Agency, EPA-822-R-06-001, May 2006.

North Fork Spring River TMDL - 13 -
• Missouri Department of Natural Resources (MDNR) (2005). Total Maximum Daily
Load (TMDL) Information Sheet for Streams with Aquatic Habitat Loss that are Listed for Sediment, http://www.dnr.mo.gov/env/wpp/tmdl/info/habitat-info.pdf
• Biological Assessment and Habitat Study, Upper North Fork Spring River, Dade and
Barton Counties, 2003-2004. Department of Natural Resources, Environmental Services Program.
• Biological Assessment and Habitat Study, Lower North Fork Spring River, Barton and
Jasper Counties, 2004. Department of Natural Resources, Environmental Services Program.
• Effects of Suspended Sediment on Native Missouri Fishes: A Literature Review and
Synthesis. 2004. K.E. Doisey and C.F. Rabeni. University of Missouri. 13. Appendices
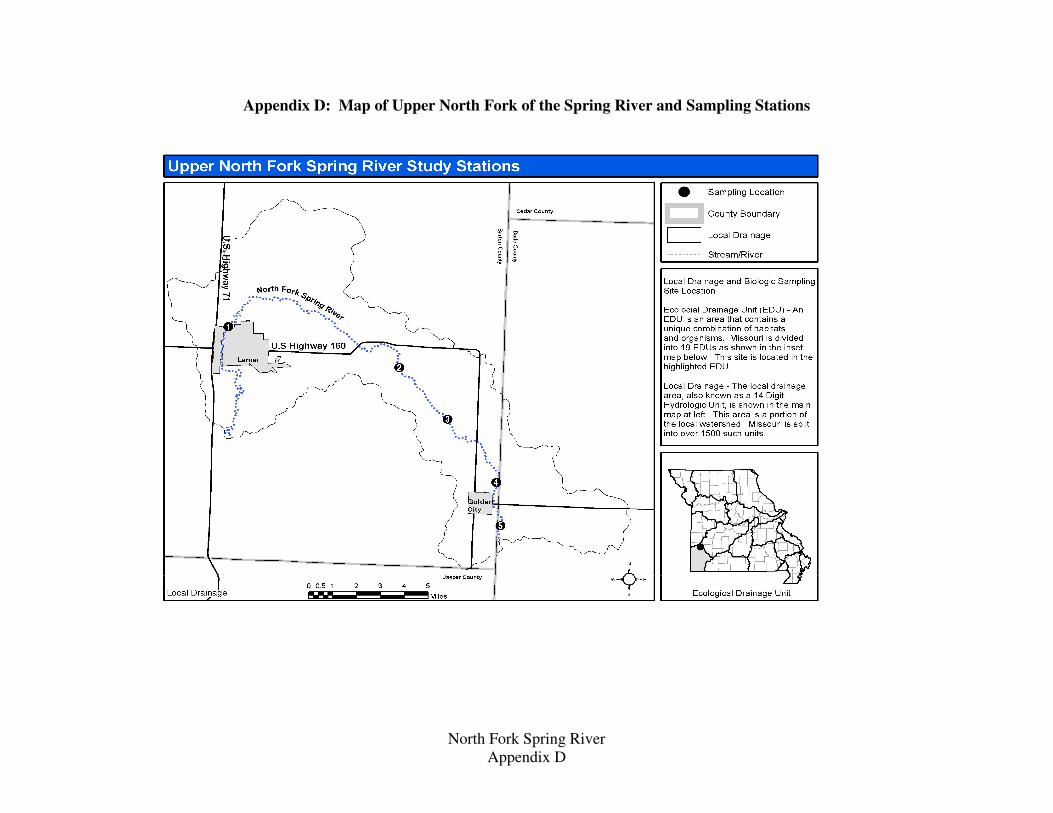
Appendix A – Development of Suspended Sediment Targets using Reference LDC. Appendix B – List of Sites used for TMDL methodology Appendix C – Total Maximum Daily Load Information Sheet for North Fork Spring River Appendix D – Map of Upper North Fork of the Spring River and Sampling Stations Appendix E – Map of Lower North Fork of the Spring River and Sampling Stations

North Fork Spring River TMDL Appendix A
Appendix A
Development of Suspended Sediment Targets using Reference Load Duration Curves
Overview This procedure is used when a lotic system is placed on the 303(d) impaired waterbody list for a pollutant and the designated use being addressed is aquatic life. In cases where pollutant data for the impaired stream is not available a reference approach is used. The target for pollutant loading is the 25th percentile calculated from all data available within the ecological drainage unit (EDU) in which the waterbody is located. Additionally, it is also unlikely that a flow record for the impaired stream is available. If this is the case a synthetic flow record is needed. In order to develop a synthetic flow record calculate an average of the log discharge per square mile of USGS gaged rivers for which the drainage area is entirely contained within the EDU. From this synthetic record develop a flow duration from which to build a load duration curve (LDC) for the pollutant within the EDU. From this population of load durations follow the reference method used in setting nutrient targets in lakes and reservoirs. In this methodology the average concentration of either the 75th percentile of reference lakes or the 25th percentile of all lakes in the region is targeted in the TMDL. For most cases available pollutant data for reference streams is also not likely to be available. Therefore follow the alternative method and target the 25th percentile of load duration of the available data within the EDU as the TMDL LDC. During periods of low flow the actual pollutant concentration may be more important than load. To account for this during periods of low flow the LDC uses the 25th percentile of EDU concentration at flows where surface runoff is less than 1% of the stream flow. This results in an inflection point in the curve below which the TMDL is calculated using this reference concentration. Methodology The first step in this procedure is to locate available pollutant data within the EDU of interest. These data along with the instantaneous flow measurement taken at the time of sample collection for the specific date are recorded to create the population from which to develop the load duration. Both the date and pollutant concentration are needed in order to match the measured data to the synthetic EDU flow record. Secondly, collect average daily flow data for gages with a variety of drainage areas for a period of time to cover the pollutant record. From these flow records normalize the flow to a per square mile basis. Average the log transformations of the average daily discharge for each day in the period of record. For each gage record used to build this synthetic flow record calculate the Nash-Sutcliffe statistic to determine if the relationship is valid for each record. This relationship must be valid in order to use this methodology. This new synthetic record of flow per square mile is used to develop the load duration for the EDU. The flow record should be of sufficient length to be able to calculate percentiles of flow.
North Fork Spring River TMDL Appendix A
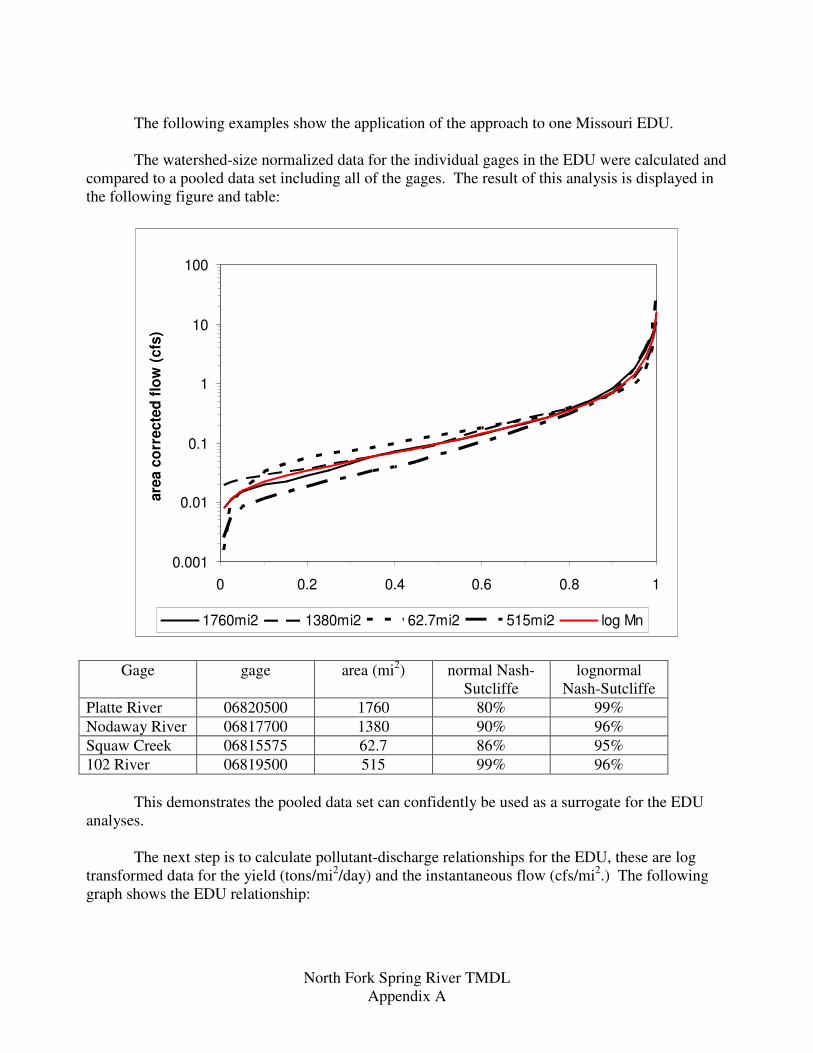
The following examples show the application of the approach to one Missouri EDU. The watershed-size normalized data for the individual gages in the EDU were calculated and compared to a pooled data set including all of the gages. The result of this analysis is displayed in the following figure and table:
0.001
0.01
0.1
1
10
100
0 0.2 0.4 0.6 0.8 1
area
cor
rect
ed fl
ow (c
fs)
1760mi2 1380mi2 62.7mi2 515mi2 log Mn
Gage gage area (mi2) normal Nash-
Sutcliffe lognormal
Nash-Sutcliffe Platte River 06820500 1760 80% 99% Nodaway River 06817700 1380 90% 96% Squaw Creek 06815575 62.7 86% 95% 102 River 06819500 515 99% 96% This demonstrates the pooled data set can confidently be used as a surrogate for the EDU analyses. The next step is to calculate pollutant-discharge relationships for the EDU, these are log transformed data for the yield (tons/mi2/day) and the instantaneous flow (cfs/mi2.) The following graph shows the EDU relationship:

North Fork Spring River TMDL Appendix A
Estimate of Power Function from Instantaneous Flowy = 1.3461x - 0.5093
R2 = 0.8695
-20
-15
-10
-5
0
5
10
-14 -12 -10 -8 -6 -4 -2 0 2 4
Flow
Sed
imen
t Yie
ld (t
/day
)
Further statistical analyses on this relationship are included in the following Table:
m 1.34608498 b -0.509320019 Standard Error (m) 0.04721684 Standard Error (b) 0.152201589
r2 0.86948229 Standard Error (y) 1.269553159 F 812.739077 DF 122
SSreg 1309.94458 SSres 196.6353573 The standard error of y was used to estimate the 25%ile level for the TMDL line. This was done by adjusting the intercept (b) by subtracting the product of the one-sided Z75 statistic times the standard error of (y). The resulting TMDL Equation is the following: Sediment yield (t/day/mi2) =exp(1.34608498 * ln (flow) - 1.36627)

North Fork Spring River TMDL Appendix A
A resulting pooled TMDL of all data in the watershed is shown in the following graph:
Enter EDU designation here
0.00
010.
0005
0.00
5
0.05 0.1
0.2
0.3
0.4
0.6
0.7
0.8
0.9
0.95
0.99
0.99
50.
999
0.99
99
0.00001
0.0001
0.001
0.01
0.1
1
10
100
Low Flow Percentile Flow High Flow
Tons
/day
/mi^
2
0%
10%
20%
30%
40%
50%
60%
70%
80%
90%
100%
Sur
face
Run
off
To apply this process to a specific watershed would entail using the individual watershed data compared to the above TMDL curve that has been multiplied by the watershed area. Data from the impaired segment is then plotted as a load (tons/day) for the y-axis and as the percentile of flow for the EDU on the day the sample was taken for the x-axis. For more information contact: Environmental Protection Agency, Region 7 Water, Wetlands, and Pesticides Division Total Maximum Daily Load Program 901 North 5th Street Kansas City, Kansas 66101 Website: http://www.epa.gov/region07/water/tmdl.htm

North Fork Spring River TMDL Appendix B
Appendix B
List of Sites used for TMDL methodology USGS stream gages used to generate synthetic flow 07185765 Spring River at Carthage 07187000 Shoal Creek above Joplin 07189000 Elk River nr Tiff City 07186000 Spring River at Waco 07186400 Center Creek nr Carterville 07188653 Big Sugar Creek nr Powell USGS stream sample sites used to generate EDU TMDL 07186600 Turkey Creek near Joplin, MO 07186400 Center Creek near Carterville, MO 07186180 Center Creek above Fidelity, MO 07186480 Center Creek near Smithfield, MO 06917630 East Drywood Creek at Prairie State Park, MO 07186250 Grove Creek near Scotland, MO 07185350 Honey Creek near Hoberg, MO 07186195 Jones Creek near Fidelity, MO 07187000 Shoal Creek above Joplin, MO 07185300 Spring River near Hoberg, MO 07185700 Spring River at LaRussell, MO. 07185250 Spring River below Verona, MO 07186000 Spring River near Waco, MO

North Fork Spring River Appendix C
Appendix C
Missouri Department of Natural Resources Total Maximum Daily Load Information Sheet
For Streams with Aquatic Habitat Loss that are Listed for Sediment
Waterbody Segment at a Glance: Location: Streams in Northern and West Central Missouri and in the Mississippi Embayment of Southeast Missouri and the Missouri and Mississippi Rivers. Impairment: In 1998 the Department of Natural Resources listed 38 streams with habitat impairment due to agricultural nonpoint source problems. Twelve of them were delisted because new data showed they were higher quality reference streams, not impaired by sediment. One of them was retained on the list for “unknown” pollutants. The other 25 of them appear on the 2002 US EPA 303(d) list for Missouri as being impaired by “sediment”. Description of the Problem All of these waters, as per Missouri Water Quality Standards, must provide a suitable home for aquatic life. A combination of natural geology and land use in the prairie portions of the state and the Mississippi Embayment is believed to have reduced the amount and impaired the quality of aquatic habitat. The major problems are excessive rates of sediment deposition due to streambank erosion and sheet erosion from agricultural lands, loss of stream length and loss of stream channel heterogeneity due to channelization, and changes in basin hydrology that have increased flood flows and prolonged low flow conditions. Loss of tree cover in riparian zones has caused elevated water temperatures in summer and a reduction in woody debris, a critical aquatic habitat component in prairie streams. The most compelling evidence of loss or impairment of aquatic habitat is the historical change in distribution of fishes in Missouri. Many species of fish no longer appear in portions of the state where they once lived. The department proposed changing the listing of “sediment” to “habitat loss.” This change was proposed because sediment is often an important, but certainly not the only, pollutant or condition causing degradation of aquatic habitat in these streams. With this proposed change, other problems such as channelization, alteration of streambanks and riparian zones, and alteration of normal flow regimes would be included as conditions contributing to impairment. The US Environmental Protection Agency denied this change because habitat loss is “pollution”, not a specific “pollutant” that can be measured and calculated. This is necessary because a TMDL (Total Maximum Daily Load) is a numeric calculation. The department is developing a sediment protocol to determine if sediment is actually the pollutant in these streams and a standard way to measure sediment.

North Fork Spring River Appendix C
Missouri Streams with Loss of Habitat due to Agricultural Non-Point Source Pollution
31
4
82
5
9
10
11
12
13
14
15
16
17
18
19
20
21
22
23
24
25
6
7
# Waterbody County
(lower section)
Miles affected
# Waterbody County (lower section)
Miles affected
1 3rd Fork Platte River Buchanan 31.5 14 M. Fork Grand River Gentry 25 2 Big Creek Henry 49 15 M. Fork Salt River Monroe 49 3 Big Muddy Creek Daviess 8 16 Miami Creek Bates 18 4 Blackbird Creek Adair 10.5 17 Mill Creek Lincoln 4 5 Clear Creek Vernon 18 18 Mussel Fork Macon 29 6 E. Fork Medicine
Cr. Grundy 36 19 N. Fabius River Marion 82
7 Elkhorn Creek Montgomery 19 20 N. Fork Spring River Jasper 51.5 8 Flat Creek Pettis 20 21 Old Channel Little R. New Madrid 20 9 Honey Creek Livingston 23 22 S. Fork Blackwater
R. Johnson 5
10 Little Medicine Creek
Grundy 40 23 S. Wyaconda River Clark 9
11 Little Tarkio Creek Holt 17.5 24 Spillway Ditch New Madrid 13.5 12 Lake Creek Pettis 5 25 Troublesome Creek Marion 3.5 13 Lateral #2 Main
Ditch Stoddard 11.5
For more information call or write: Missouri Department of Natural Resources Water Protection Program P.O. Box 176, Jefferson City, MO 65102-0176 1-800-361-4827 or (573) 751-1300 office or (573) 751-9396 fax Program Home Page: www.dnr.state.mo.us/deq/wpcp
North Fork Spring River Appendix D
Appendix D: Map of Upper North Fork of the Spring River and Sampling Stations

North Fork Spring River Appendix E
Appendix E: Map of Lower North Fork of the Spring River and Sampling Stations
Highw
ay 71
Station #1
Station #2
Station #3
Station #4
Station #5
Lamar
Jasper
#WWTF
# WWTF