north pacific gyre oscillation links ocean climate and...
TRANSCRIPT

North Pacific Gyre Oscillation links ocean climate and ecosystem
change
E. Di Lorenzo,1 N. Schneider,2 K. M. Cobb,1 P. J. S. Franks,3 K. Chhak,1 A. J. Miller,4
J. C. McWilliams,5 S. J. Bograd,6 H. Arango,7 E. Curchitser,7 T. M. Powell,8
and P. Riviere9
Received 29 November 2007; revised 31 January 2008; accepted 19 February 2008; published 30 April 2008.
[1] Decadal fluctuations in salinity, nutrients, chlorophyll, avariety of zooplankton taxa, and fish stocks in the NortheastPacific are often poorly correlated with the most widely-usedindex of large-scale climate variability in the region - thePacific Decadal Oscillation (PDO).We define a new pattern ofclimate change, the North Pacific Gyre Oscillation (NPGO)and show that its variability is significantly correlated withpreviously unexplained fluctuations of salinity, nutrients andchlorophyll. Fluctuations in the NPGO are driven by regionaland basin-scale variations in wind-driven upwelling andhorizontal advection – the fundamental processescontrolling salinity and nutrient concentrations. Nutrientfluctuations drive concomitant changes in phytoplanktonconcentrations, and may force similar variability in highertrophic levels. The NPGO thus provides a strong indicator offluctuations in the mechanisms driving planktonic ecosystemdynamics. The NPGO pattern extends beyond the NorthPacific and is part of a global-scale mode of climate variabilitythat is evident in global sea level trends and sea surfacetemperature. Therefore the amplification of the NPGOvariance found in observations and in global warmingsimulations implies that the NPGO may play an increasinglyimportant role in forcing global-scale decadal changes inmarine ecosystems.Citation: Di Lorenzo, E., et al. (2008), North
Pacific Gyre Oscillation links ocean climate and ecosystem change,
Geophys. Res. Lett., 35, L08607, doi:10.1029/2007GL032838.
1. Introduction
[2] Indices of large-scale climate variability such as thePacific Decadal Oscillation (PDO) [Mantua et al., 1997]
and the El Nino Southern Oscillation (ENSO) are ofteninvoked to explain physical and biological fluctuations inthe Northeast Pacific Ocean [Lynn et al., 1998; Lavaniegosand Ohman, 2003, 2007; McGowan et al., 1998]. Changesin the magnitude and sign of the indices have been corre-lated with variations in biological properties such as zoo-plankton displacement volume [Roemmich and McGowan,1995] and fish populations [Hare et al., 1999]. Particularlydramatic physical and biological excursions occurred duringthe 1976–77 change in the PDO [Hare and Mantua, 2000][McGowan et al., 2003] and during the 1997–99 ENSOcycle [Peterson and Schwing, 2003]. However, the mech-anisms coupling fluctuations in the PDO to changes inbiological variables remain unclear. Furthermore, both thePDO and ENSO fail to explain decadal variations of keyoceanic variables in the North Pacific, particularly theprominent salinity and nutrient variations seen in the Califor-nia Cooperative Oceanic Fisheries Investigations (CalCOFI;www.calcofi.org) records from 1949 to 2005 [Schneider et al.,2005; Di Lorenzo et al., 2005].[3] In this study, we present evidence that interannual and
decadal variations of salinity, nutrient upwelling, and sur-face chlorophyll-a (Chl-a) in the Northeast Pacific areassociated with fluctuations in a climate pattern that weterm the North Pacific Gyre Oscillation (NPGO). We usethe term NPGO because its fluctuations reflect changes inthe intensity of the North Pacific gyre circulations.
2. Methods
[4] The PDO and NPGO modes of climate variabilityemerge from analyses of Northeast Pacific sea-surfacetemperature anomalies (SSTa) and sea-surface heightanomalies (SSHa) over the region (180�W–110�W;25�N–62�N). Using empirical orthogonal function (EOF)techniques, these oceanic fields are each decomposed into aset of independent/uncorrelated spatial modes (the EOFs)whose temporal fluctuations are given by the correspondingPrincipal Components (PCs). The first EOF and PC spatialand temporal pattern explain the highest fraction of thevariance; subsequent sets of EOFs and PCs explain succes-sively less variance of the field. The PDO climate patternemerges as the first EOF/PC of both SSTa and SSHa, whilethe NPGO represents the second EOF/PC. Because the firstPCs of SSTa and SSHa are highly correlated (R�0.85), wedefine a PDO index as the first PC of SSHa and the NPGOindex as the second PC of SSHa (Figure 1). (The NPGOindex can be downloaded at http://www.ocean3d.org/npgo.)The NPGO index closely tracks the second PC of SSTa,which is also known as the ‘‘Victoria Mode’’ index [Bond et
GEOPHYSICAL RESEARCH LETTERS, VOL. 35, L08607, doi:10.1029/2007GL032838, 2008ClickHere
for
FullArticle
1School of Earth and Atmospheric Sciences, Georgia Institute ofTechnology, Atlanta, Georgia, USA.
2International Pacific Research Center and Department of Oceanogra-phy, School of Ocean and Earth Science and Technology, University ofHawaii at Manoa, Honolulu, Hawaii, USA.
3Scripps Institution of Oceanography, University of California, SanDiego, La Jolla, California, USA.
4CASPO Division, Scripps Institution of Oceanography, University ofCalifornia, San Diego, La Jolla, California, USA.
5Institute of Geophysics and Planetary Physics and Department ofAtmospheric and Oceanic Sciences, University of California, Los Angeles,California, USA.
6Southwest Fisheries Science Center, NMFS, NOAA, Pacific Grove,California, USA.
7Institute of Marine and Coastal Sciences, Rutgers University, NewBrunswick, New Jersey, USA.
8Department of Integrative Biology, University of California, Berkeley,California, USA.
9LEMAR, IUEM Thechnopole Brest-Iroise, Plouzane, France.
Copyright 2008 by the American Geophysical Union.0094-8276/08/2007GL032838$05.00
L08607 1 of 6
al., 2003], although the NPGO index exhibits more prom-inent low-frequency fluctuations than the ‘‘Victoria Mode’’.Following these definitions the NPGO is statistically inde-pendent of the PDO. We also verify that these modes aredistinct and separate in both SSHa and SSTa by performing
an analysis of the eigenvalues spectrum from the EOFdecompositions [North et al., 1982].[5] We investigate the NPGO and PDO climate patterns
and their underlying dynamics using a high-resolutionmodel of the Northeast Pacific Ocean. The Regional OceanModeling System (ROMS) [Shchepetkin and McWilliams,2005] is used in a nested configuration representing theNortheast Pacific (180�W–110�W; 25�N–62�N). The mod-el grid has 15 km average horizontal resolution and 30vertical terrain-following layers. The model is forced withsurface wind stresses and heat fluxes from the US NationalCenter for Environmental Prediction (NCEP) [Kalnay et al.,1996] over the period 1950–2004. The SST boundarycondition includes a time-dependent relaxation to SSTreanalysis [Smith and Reynolds, 2004] with a timescale �1 month to account for errors in the NCEP surface heatfluxes [Josey, 2001]. The SSS boundary condition is acorrected monthly climatology of freshwater flux, whichensures that changes in salinity on periodicities larger thanthe seasonal cycle are only controlled by changes in oceanadvection. Chl-a and NO3 are modeled with a simplenutrient-phytoplankton-zooplankton-detritus (NPZD) eco-system model [Powell et al., 2006].[6] The numerical model has significant skill in recon-
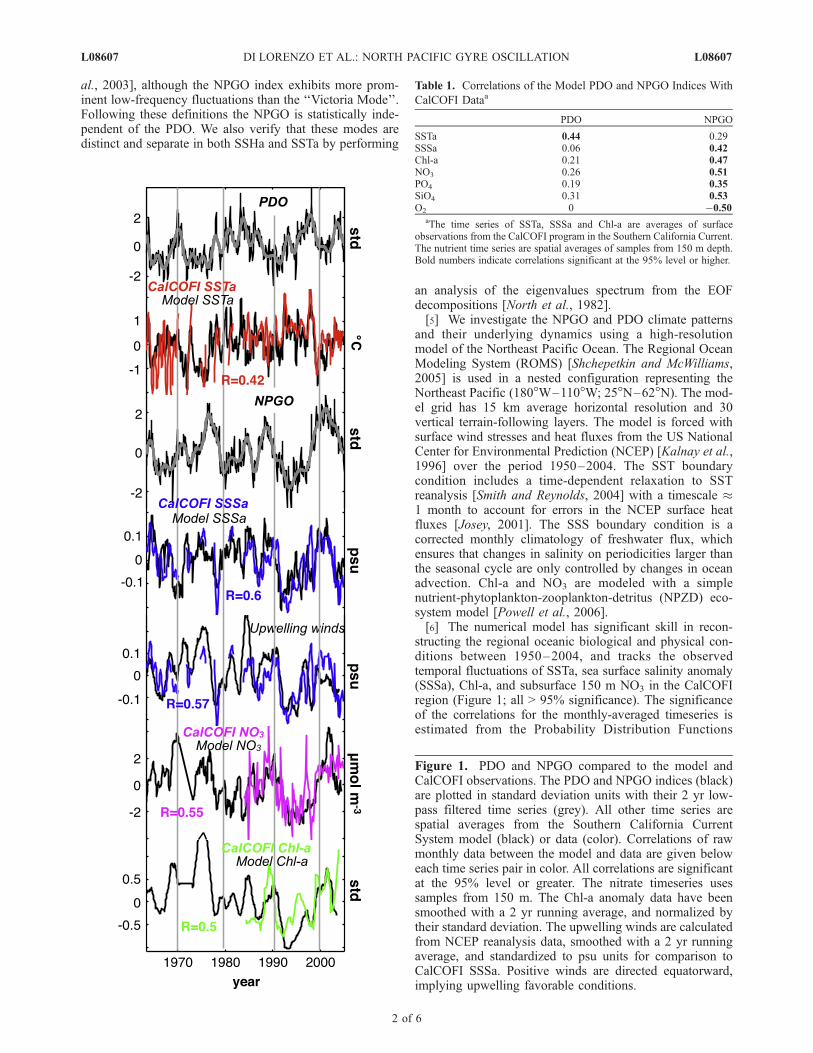
structing the regional oceanic biological and physical con-ditions between 1950–2004, and tracks the observedtemporal fluctuations of SSTa, sea surface salinity anomaly(SSSa), Chl-a, and subsurface 150 m NO3 in the CalCOFIregion (Figure 1; all > 95% significance). The significanceof the correlations for the monthly-averaged timeseries isestimated from the Probability Distribution Functions
Table 1. Correlations of the Model PDO and NPGO Indices With
CalCOFI Dataa
PDO NPGO
SSTa 0.44 0.29SSSa 0.06 0.42Chl-a 0.21 0.47NO3 0.26 0.51PO4 0.19 0.35SiO4 0.31 0.53O2 0 �0.50
aThe time series of SSTa, SSSa and Chl-a are averages of surfaceobservations from the CalCOFI program in the Southern California Current.The nutrient time series are spatial averages of samples from 150 m depth.Bold numbers indicate correlations significant at the 95% level or higher.
Figure 1. PDO and NPGO compared to the model andCalCOFI observations. The PDO and NPGO indices (black)are plotted in standard deviation units with their 2 yr low-pass filtered time series (grey). All other time series arespatial averages from the Southern California CurrentSystem model (black) or data (color). Correlations of rawmonthly data between the model and data are given beloweach time series pair in color. All correlations are significantat the 95% level or greater. The nitrate timeseries usessamples from 150 m. The Chl-a anomaly data have beensmoothed with a 2 yr running average, and normalized bytheir standard deviation. The upwelling winds are calculatedfrom NCEP reanalysis data, smoothed with a 2 yr runningaverage, and standardized to psu units for comparison toCalCOFI SSSa. Positive winds are directed equatorward,implying upwelling favorable conditions.
L08607 DI LORENZO ET AL.: NORTH PACIFIC GYRE OSCILLATION L08607
2 of 6

(PDFs) of the correlation coefficient of two red noisetimeseries that possessed same autoregression coefficientsas the original signals. The PDFs are computed numericallyby generating 3000 realizations of the correlation coefficientof two random red noise timeseries.
3. Results and Discussion
[7] Consistent with previous observational analyses wefind that the PDO is the dominant mode of variability ofmonthly SSTa and SSHa in the ocean model: the first EOFaccounts for 34% of the variance of SSTa and 22% of thevariance of SSHa. The NPGO mode – the second EOF ofSSTa and SSHa – explains 22% and 8% of the variance ofthose fields, respectively. However, while the PDO index issignificantly correlated with the observed CalCOFI SSTarecord (Figure 1 and Table 1), only the NPGO is signifi-cantly correlated with observed fluctuations of CalCOFISSSa, Chl-a, and subsurface NO3, PO4, SiO4 and O2
concentrations (Figure 1 and Table 1). The coastal times-eries of SSTa and SSSa collected at the La Jolla Scripps Pier(32�N, 117�W), which are continuous in time, show similar
correlations to the PDO and NPGO respectively (Figure 2).These correlations speak to the different dynamics under-lying the two indices.[8] In the California Current System (CCS) the NPGO
reflects changes in wind stress, in particular the winds thatforce coastal upwelling. This is evident in the strongcorrelation of the NPGO index with CalCOFI SSSa overthe past 50 years: observed fluctuations in SSSa are verystrongly correlated with alongshore wind stress, the driverof coastal upwelling in the CalCOFI region (Figure 1).These results strongly support the use of the NPGO as theprimary indicator of upwelling strength, nutrient fluxes, andthe potential for ecosystem change in the CalCOFI region.[9] Changes in nutrient fluxes drive fluctuations in mod-
eled Chl-a that are highly correlated to observed Chl-a. Inthe model the primary mechanism for change of the Chl-a isthrough variations in wind-driven vertical nutrient flux.Therefore, the high correlation of modeled and observedChl-a (Figure 1) supports the hypothesis that fluctuations inphytoplankton biomass in the CalCOFI region are primarilydriven by changes in wind-driven upwelling correlated with
Figure 2. PDO and NPGO patterns from model and data. (a) Time series of La Jolla Scripps Pier (32�N, 117�W) SSTa(red) compared to the PDO index (correlation R = 0.4; 99% significance), defined as the first PC of model SSHa (black).(b) Time series of La Jolla Scripps Pier SSSa (blue) compared to the NPGO index (correlation R = 0.51, 99% significance),defined as the second PC of model SSHa (black). Thin black lines are 2 yr running averages of the model PCs. The SSTaand SSSa records are detrended and a 12 months running mean is applied. (c, d) Regression maps of model PDO andNPGO indices with the model SSHa. The white (black) contours indicate regions of positive (negative) wind stress curl(Ekman upwelling) as inferred from a regression of the model PCs with the NCEP wind stress curl. The % varianceaccounted for by each regression map is indicated. (e, f) Regression maps of the model PDO and NPGO indices withsatellite altimeter data gathered between 1993–2004. The colour range is modified to [�3.5 3.5] in Figure 2f to properlydisplay the map (black contours are satellite/drifter-derived mean dynamic height [Niiler et al., 2003]).
L08607 DI LORENZO ET AL.: NORTH PACIFIC GYRE OSCILLATION L08607
3 of 6

the NPGO. This ‘‘bottom-up’’ forcing is consistent with theconclusions from previous analyses of fish catch dataand satellite-derived Chl-a [Ware and Thomson, 2005;Rykaczewski and Checkley, 2008], and underscores the needto better understand the influences of physically forcednutrient fluxes on higher trophic levels in the ocean.[10] Fluctuations of the PDO have often been implicated in
major physical-biological regime shifts in the North Pacific(e.g. 1976, 1999) [Hare and Mantua, 2000; Lavaniegos andOhman, 2003]; however, the NPGO mode shows equallydramatic transitions during these periods (Figure 1). Indeedthese recent major ecosystem regime shifts have occurredwhen the PDO and NPGO show strong, simultaneous, andopposite sign reversals (Figure 1). The alternating impor-tance between the PDO and NPGO fluctuations on decadaltimescales may explain why some changes in the sign of thePDO index did not correspond to dramatic ecological shifts.Diagnosing and predicting ecosystem climate variability inthe North Pacific will depend on determining the effects ofthe phase relationship between fluctuations of the PDO andNPGO modes.[11] The regional spatial patterns of the PDO and NPGO
in the SSHa are distinct, and give further insights into thedynamics they represent (Figure 2). Assuming that theSSHa reflect changes in the geostrophic flow, the PDOmode shows a single large gyre north of 25�N and ananomalously strong poleward flow along the entire coast
from 25�N to 55�N (Figure 2c). This flow is forced bypredominantly downwelling conditions at the coast; apositive PDO results in a strengthening of the Alaskan Gyrebut a weakening of the California Current. In contrast, theNPGO mode in its positive phase shows a pair of counter-rotating gyres that reflect the gyre-scale mean geostrophiccirculation inferred from satellite [Niiler et al., 2003](Figure 2d). The northernmost Alaskan Gyre is separatedfrom the more southerly Subtropical Gyre by the NorthPacific Current (NPC), which flows eastward along �40�N.The NPC bifurcates at the coast, flowing northward to formthe Alaskan Coastal Current, and southward to form theCalifornia Current. When positive, the NPGO represents anintensification of the geostrophic circulation, that is astrengthening of the NPC, and (in contrast to the PDO) anincrease in the transport of both the Alaskan Coastal Currentand California Current (Figure 2). This intensification ofboth the subpolar and subtropical gyres is driven in themodel by open-ocean wind stress curl anomalies (Figures 2cand 2d, contour lines) and by variations in wind-drivencoastal upwelling. The spatial structure of the wind anoma-lies is consistent with the positive phase of the North PacificOscillation (NPO) [Walker and Bliss, 1932], which is adominant mode of variability in atmospheric sea levelpressure. This suggests that the NPGO is the oceanicexpression of the atmospheric NPO. When the NPGO ispositive, the associated changes in wind forcing (Figure 3)
Figure 3. Atmospheric forcing patterns of the PDO and NPGO modulate decadal changes in coastal upwelling.Regression maps of (a) PDO and (b) NPGO indices with NCEP windstress vectors and sea level pressure (color scale). (c)Coastal upwelling depth index from inverse model calculations [Chhak and Di Lorenzo, 2007] averaged from 38N to 48N(area denoted by red circle in Figures 3a and 3b) compared to PDO index. (d) Coastal upwelling depth index averaged from30N to 38N (area denoted by blue circle in Figures 3a and 3b) compared to NPGO index. A positive upwelling indeximplies a deeper upwelling cell.
L08607 DI LORENZO ET AL.: NORTH PACIFIC GYRE OSCILLATION L08607
4 of 6

create upwelling-favorable conditions in the CaliforniaCurrent and Alaskan Gyre, but downwelling conditions inthe Subtropical Gyre and the Alaskan Coastal Current.However, upwelling variability along the Northeast Pacificcoast is strongly correlated with NPGO only south of 38�N;farther north, upwelling is more strongly controlled bychanges in alongshore winds correlated with the PDO(Figure 3), as indicated by previous findings [Chhak andDi Lorenzo, 2007].
[12] The PDO and NPGO spatial patterns found in ourmodel are clearly seen in observations such as satellite-derived sea level data (Figures 2e and 2f). Over the period1993–2005 a regression of the model-reconstructed PDOand NPGO indices with the merged satellite altimeteranalysis from AVISO (http://www.jason.oceanobs.com/)reproduces the spatial patterns of the modeled NPGO andPDO modes (Figure 2). Interestingly, both the satelliteregression maps and our model show that the NPGOamplitude was larger than the PDO amplitude during thelast decade, a finding confirmed by independent analyses ofboth in situ and other satellite data [Cummins and Freeland,2007]. This recent strengthening of the NPGO mode is alsorevealed by the fact that the second EOF of SSTa (which isan expression of the NPGO and is referred to in theliterature as the ‘‘Victoria’’ mode) explains more wintertimeNorth Pacific SSTa variance than the PDO pattern duringthe 1990–2002 period [Bond et al., 2003].[13] The NPGO spatial pattern extends well beyond the
Northeast Pacific and CalCOFI regions, and is part of aglobal climate pattern. This is apparent in correlations of theNPGO index with global SSTa reanalysis [Smith andReynolds, 2004] and satellite SSHa (http://www.jason.ocea-nobs.com/) (Figure 4). The global NPGO SSHa patternexplains a trend uncovered in global sea-level data duringthe period 1990–2000 [Kohl et al., 2007], when the NPGOindex shows a near monotonic increase (Figure 4c). TheNPGO SSTa pattern corresponds to the second EOF ofPacific SSTa that is isolated in both observations and globalocean model integrations [Doney et al., 2007]. Indeed, theNPGO index shows a significant correlation with the secondPC of Pacific SSTa (Figure 4c). The SSTa NPGO spatialpattern is strongly symmetric across the equator, suggestingthat tropical coupled dynamics are involved in forcing theNPGO fluctuations. The large-scale structure of the NPGOpattern also suggests that its underlying dynamics drivespatially coherent decadal fluctuations in ecosystems acrossthe Pacific Ocean.[14] The observed strengthening of the NPGO mode
since 1993 reported here and in other studies [Cumminsand Freeland, 2007; Bond et al., 2003; Douglass et al.,2006] may represent a response to anthropogenic forcingand global warming. This hypothesis is supported bypreliminary analyses of climate projections from the GFDL2.0 coupled climate model (experiments GFDL CM2.0,20C3M and GFDL CM2.0, SRES A2), which show anamplification of the NPGO variance by 38% and a reductionof the PDO variance by 58% between the periods 1900–2000 and 2000–2100. If true, we expect the dynamicsunderlying the NPGO to play an increasingly importantrole in Pacific-wide ecosystem transitions in coming deca-des. Further work is in progress to explore the utility andimplications of the NPGO for understanding past, andpredicting future global climate and ecosystem change.
[15] Acknowledgments. We acknowledge the support of theNational Science Foundation grants OCE-0550266, GLOBEC-0606575,OCE-0452654, OCE-0452692, CCS-LTER, NASA NNG05GC98G, DOEDE-FG02-04ER63857 and the French CNRS CYBER-LEFE Programme.We also thank Mark Ohman and Patrick Cummins for their discussions. Aspecial thanks to Tessa Di Lorenzo for motivating and inspiring this work.
Figure 4. Global patterns of the NPGO in the SSHa andSSTa fields. Correlation map of the model NPGO indexwith (a) satellite altimetry and (b) SSTa reanalysis duringthe period 1993–2004. The double-gyre structure of theNortheastern Pacific NPGO is apparent in both maps, and ispart of a global pattern that is symmetric across the equator,which suggest that coupled dynamics in the tropics areinvolved in the dynamics of the NPGO. The correlationbetween the NPGO index and the second PC of PacificSSTa (c) is R = 0.47 and is significant at the 99% level.
L08607 DI LORENZO ET AL.: NORTH PACIFIC GYRE OSCILLATION L08607
5 of 6

ReferencesBond, N. A., J. E. Overland, M. Spillane, and P. Stabeno (2003), Recentshifts in the state of the North Pacific, Geophys. Res. Lett., 30(23), 2183,doi:10.1029/2003GL018597.
Chhak, K., and E. Di Lorenzo (2007), Decadal variations in the CaliforniaCurrent upwelling cells, Geophys. Res. Lett., 314, L14604, doi:10.1029/2007GL030203.
Cummins, P. F., and H. J. Freeland (2007), Variability of the North PacificCurrent and its bifurcation, Prog. Oceanogr., 75(5), 253–265.
Di Lorenzo, E., et al. (2005), The warming of the California Current Sys-tem: Dynamics and ecosystem implications, J. Phys. Oceanogr., 35(3),336–362.
Doney, S. C., et al. (2007), Mechanisms governing interannual variability ofupper-ocean temperature in a global ocean hindcast simulation, J. Phys.Oceanogr., 37(7), 1918–1939.
Douglass, E., D. Roemmich, and D. Stammer (2006), Interannual variabil-ity in northeast Pacific circulation, J. Geophys. Res., 111, C04001,doi:10.1029/2005JC003015.
Hare, S. R., and N. J. Mantua (2000), Empirical evidence for North Pacificregime shifts in 1977 and 1989, Prog. Oceanogr., 47(2–4), 103–145.
Hare, S. R., et al. (1999), Inverse production regimes: Alaska and WestCoast Pacific salmon, Fisheries, 24(1), 6–14.
Kalnay, E., et al. (1996), The NCEP/NCAR 40-year reanalysis project, Bull.Am. Meteorol. Soc., 77(3), 437–471.
Kohl, A., et al. (2007), Interannual to decadal changes in the ECCO globalsynthesis, J. Phys. Oceanogr., 37(2), 313–337.
Josey, S. A. (2001), A comparison of ECMWF, NCEP-NCAR, and SOCsurface heat fluxes with moored buoy measurements in the subductionregion of the northeast Atlantic, J. Clim., 14, 1780–1789.
Lavaniegos, B. E., and M. D. Ohman (2003), Long-term changes in pelagictunicates of the California Current, Deep Sea Res., Part II, 50(14–16),2473–2498.
Lavaniegos, B. E., and M. D. Ohman (2007), Coherence of long-termvariations of zooplankton in two sectors of the California Current System,Prog. Oceanogr., 75(1), 42–69.
Lynn, R. J., et al. (1998), The state of the California Current, 1997–1998:Transition to El Nino conditions, Calif. Coop. Oceanic Fish. Invest. Rep.39, pp. 25–49, La Jolla, Calif.
Mantua, N. J., et al. (1997), A Pacific interdecadal climate oscillation withimpacts on salmon production, Bull. Am. Meteorol. Soc., 78(6), 1069–1079.
McGowan, J. A., et al. (1998), Climate-ocean variability and ecosystemresponse in the northeast Pacific, Science, 281(5374), 210–217.
McGowan, J. A., et al. (2003), The biological response to the 1977 regimeshift in the California Current, Deep Sea Res., Part II, 50(14–16), 2567–2582.
Niiler, P. P., N. A. Maximenko, and J. C. McWilliams (2003), Dynamicallybalanced absolute sea level of the global ocean derived from near-surfacevelocity observations, Geophys. Res. Lett., 30(22), 2164, doi:10.1029/2003GL018628.
North, G. R., et al. (1982), Sampling errors in the estimation of empiricalorthogonal functions, Mon. Weather Rev., 110(7), 699–706.
Peterson, W. T., and F. B. Schwing (2003), A new climate regime in north-east Pacific ecosystems, Geophys. Res. Lett., 30(17), 1896, doi:10.1029/2003GL017528.
Powell, T. M., C. V. W. Lewis, E. N. Curchitser, D. B. Haidvogel, A. J.Hermann, and E. L. Dobbins (2006), Results from a three-dimensional,nested biological-physical model of the California Current System andcomparisons with statistics from satellite imagery, J. Geophys. Res., 111,C07018, doi:10.1029/2004JC002506.
Roemmich, D., and J. McGowan (1995), Climatic warming and the declineof zooplankton in the California current, Science, 267(5202), 1324–1326.
Rykaczewski, R. R., and D. M. Checkley (2008), Influence of ocean windson the pelagic ecosystem in upwelling regions, Proc. Natl. Acad. Sci.,105(6), 1965–1970, 10.1073/pnas.0711777105.
Schneider, N., et al. (2005), Salinity variations in the Southern CaliforniaCurrent, J. Phys. Oceanogr., 35(8), 1421–1436.
Shchepetkin, A. F., and J. C. McWilliams (2005), The regional oceanicmodeling system (ROMS): A split-explicit, free-surface, topography-fol-lowing-coordinate oceanic model, Ocean Modell., 9(4), 347–404.
Smith, T. M., and R. W. Reynolds (2004), Improved extended reconstruc-tion of SST (1854–1997), J. Clim., 17, 2466–2477.
Walker, G. T., and E. W. Bliss (1932), World weather V, Mem. R. Meteorol.Soc., 4, 53–84.
Ware, D. M., and R. E. Thomson (2005), Bottom-up ecosystem trophicdynamics determine fish production in the northeast Pacific, Science,308(5726), 1280–1284.
�����������������������H. Arango and E. Curchitser, Institute of Marine and Coastal Sciences,
Rutgers University, 71 Dudley Road, New Brunswick, NJ 08901-8521,USA.S. Bograd, SWFSC, NMFS, NOAA, 1352 Lighthouse Avenue, Pacific
Grove, CA 93950, USA.K. Chhak, K. M. Cobb, and E. Di Lorenzo, School of Earth and
Atmospheric Sciences, Georgia Institute of Technology, 311 Ferst Drive,Atlanta, GA 30332, USA. ([email protected])P. J. S. Franks, Scripps Institution of Oceanography, University of
California, San Diego, 9500 Gilman Drive, La Jolla, CA 92093-0218, USA.J. C. McWilliams, Dept. of Atmospheric and Oceanic Sciences,
University of California Los Angeles, 405 Hilgard Avenue, Los Angeles,CA 90095-1565, USA.A. J. Miller, CASPO Division, Scripps Institution of Oceanography,
University of California, San Diego, 439 Nierenberg Hall, La Jolla, CA92093-0224, USA.T. M. Powell, Dept. of Integrative Biology, University of California,
#3140, Rm 3060 VLSB, Berkeley, CA 94720-3140, USA.P. Riviere, LEMAR, IUEM Thechnopole Brest-Iroise, Place Nicolas
Copernic, Plouzane F-29280, France.N. Schneider, International Pacific Research Center and Department of
Oceanography, School of Ocean and Earth Science and Technology,University of Hawaii at Manoa, 1680 East-West Road, Honolulu, HI 96822,USA.
L08607 DI LORENZO ET AL.: NORTH PACIFIC GYRE OSCILLATION L08607
6 of 6