north slope gas & lng symposium -...
TRANSCRIPT

North Slope Gas & LNG Symposium
Anchorage, AK
August 5-9, 2013

North Slope Gas & LNG Symposium | © PFC Energy 2013 | Page 2 | August 2013
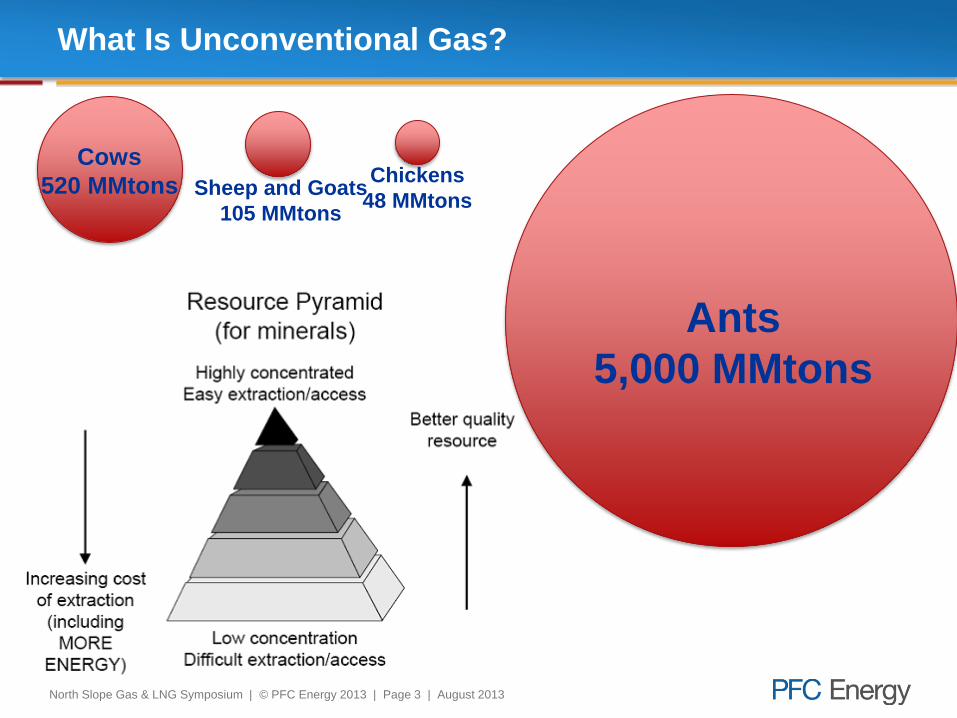
Conventional versus Unconventional Resources
1. Unconventional oil and gas are down the resource pyramid – more
difficult and expensive
2. Very few, if any, outright dry holes, but many disappointing wells that
fail to break even
3. Within an unconventional play, there is enormous variability between
winners from losers
4. Operational competence is important but rarely a source of long-term
comparative advantage as best practices and technology spread
easily
5. Value creation is mostly captured in the initial de-risking phases
6. Unconventional assets are extremely modular – companies can stop
and start without impacting project economics
North Slope Gas & LNG Symposium | © PFC Energy 2013 | Page 3 | August 2013
Chickens
48 MMtons Sheep and Goats
105 MMtons
Cows
520 MMtons
Ants
5,000 MMtons
What Is Unconventional Gas?

North Slope Gas & LNG Symposium | © PFC Energy 2013 | Page 4 | August 2013
Better Technology to the Rescue
The Solution
The Problem with Ants (and Unconventional Resources):
If you pick
them up and
eat them one at
a time, energy
output is
greater than
input.
Horizontal
Drilling

Life Stage and Value Creation Framework
Ingredients of Successful Plays
Skill Sets
Play Reviews
Table of Contents

North Slope Gas & LNG Symposium | © PFC Energy 2013 | Page 6 | August 2013
Plays pass through distinct life stages as they mature.
Pace of maturation varies tremendously
Life Stages of Unconventionals
Life Stages of Unconventional Plays
Prove It (Infancy)
~100 wells
Optimize It (Adolescence)
~1000-1500 wells
Standardize It (Adulthood)
Re-invent It (2nd Career)
Ga
ss
y
<
Flu
id T
yp
e>
O
ily
Granite Wash
Barnett
Tuscaloosa
Fayetteville
Bakken
Haynesville
DJ Niobrara Eagleford Oil
Eagleford
Gas
Utica
Bone Spring Smackover
Wolfcamp
Mississippian
Pinedale/
Jonah Marcellus
Cline
Monterey
PRB Niobrara
Uinta Tight Oil
North Slope Gas & LNG Symposium | © PFC Energy 2013 | Page 7 | August 2013
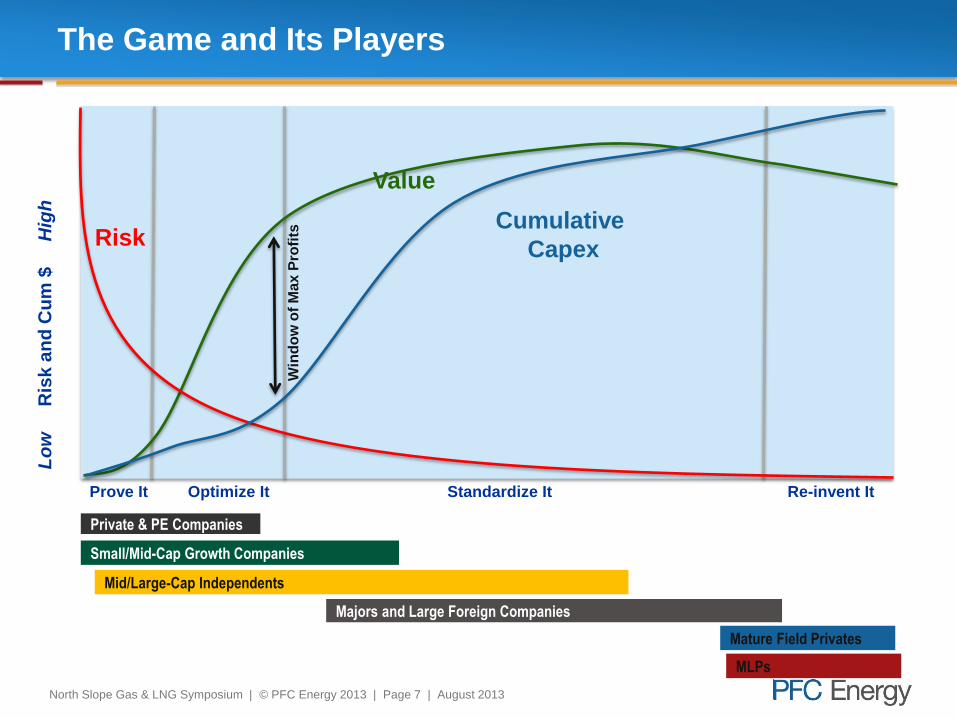
The Game and Its Players L
ow
R
isk
an
d C
um
$
H
igh
Risk
Prove It Optimize It Standardize It Re-invent It
Value
Cumulative
Capex
Private & PE Companies
Small/Mid-Cap Growth Companies
Mid/Large-Cap Independents
Majors and Large Foreign Companies
Mature Field Privates
MLPs
Win
do
w o
f M
ax P
rofi
ts
North Slope Gas & LNG Symposium | © PFC Energy 2013 | Page 8 | August 2013
Lo
w
R
isk a
nd
Cu
m $
Hig
h
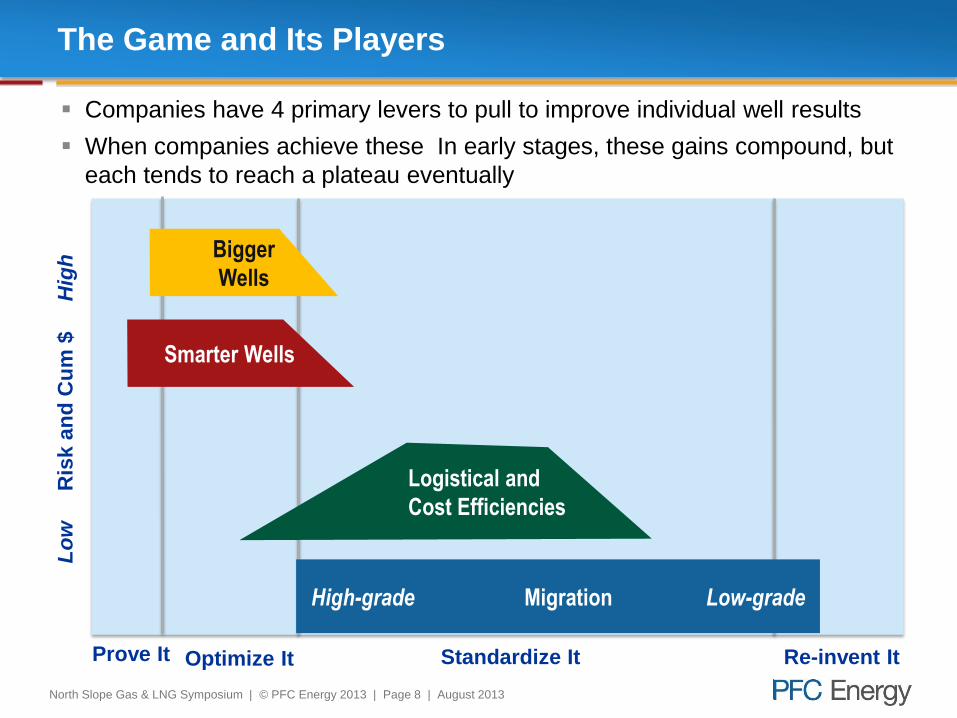
The Game and Its Players
Prove It Optimize It Standardize It Re-invent It
High-grade Migration Low-grade
Companies have 4 primary levers to pull to improve individual well results
When companies achieve these In early stages, these gains compound, but
each tends to reach a plateau eventually
Bigger
Wells
Smarter Wells
Logistical and
Cost Efficiencies

Life Stage and Value Creation Framework
Ingredients of Successful Plays
Skill Sets
Play Reviews
Table of Contents

North Slope Gas & LNG Symposium | © PFC Energy 2013 | Page 10 | August 2013
Big 4 US Shale Gas Type Well Curves
0
50,000
100,000
150,000
200,000
250,000
300,000
350,000
1 3 5 7 9 11 13 15 17 19 21 23 25 27 29 31 33 35 37 39 41 43 45 47
Production Month
(mcf/mo)
Haynesville Fayetteville Marcellus Barnett Core Barnett non-Core
• Petrophysics means that production is front-loaded
– Enhances NPV significantly by reducing payout time
• Profile creates treadmill effect, forcing constant reinvestment to avoid decline
Characteristics of Shale/Tight Gas Plays
Declines moderate, eventually
settling at 3-5% per year.
Well life often 30+ years.
There is debate about
industry estimates of well
reserves and life
PFC analysis suggests
– Core areas volumes are in
line with company claims
– Different areas within play
can diverge sharply
– Well life should be
measured in decades
Ⓒ PFC Energy 2012

North Slope Gas & LNG Symposium | © PFC Energy 2013 | Page 11 | August 2013
Three Kinds of Factors Seem Necessary for
Success
Geo-technical Potential
Macro Enablers
Pace Accelerants / Retardants

North Slope Gas & LNG Symposium | © PFC Energy 2013 | Page 12 | August 2013
The Top Ten Countries with Largest Shale Gas Resources
While there is a large range in the distribution of shale gas resources among
the top ten, no single country is overwhelmingly dominant.
900 - 1200
600 - 900
300 - 600
0 -
300
Shale Gas
(trillion cubic feet)
0
200
400
600
800
1,000
1,200
tcf Top 10 Countries By Technically
Recoverable Shale Gas Resources
Source: EIA Report, June 10 2013

North Slope Gas & LNG Symposium | © PFC Energy 2013 | Page 13 | August 2013
0
1
2
3
4
5
6
7
8
9
10C
anad
aU
nite
d K
ing
dom
Austr
alia
No
rwa
yU
nite
d S
tate
sG
reen
lan
dU
rug
uay
Qata
rU
AE
Fre
nch G
uia
na
Trin
ida
d &
Tob
ago
Ch
ileC
ypru
sC
hin
aM
ala
ysia
Bra
zil
Peru
Tha
iland
Om
an
Cu
ba
Tim
or-
Leste
Saud
i A
rabia
Co
lom
bia
Gha
na
Bahra
inR
ussia
Guyan
aM
adag
asca
rM
exic
oA
ze
rbaija
nE
qua
toria
l G
uin
ea
South
Afr
ica
Co
ngo
Bra
zzavill
eK
uw
ait
Phili
ppin
es
Gab
on
Mo
za
mb
iqu
eK
azakhsta
nK
urd
ista
n (
Iraq
)In
dia
Tan
za
nia
Ango
laT
urk
men
ista
nP
apu
a N
ew
Guin
ea
Le
ban
on
Boliv
iaV
ietn
am
Kenya
Ma
urita
nia
Indon
esia
Sao T
om
e &
Prin
cip
eA
lge
ria
Ug
and
aC
ote
d'Iv
oire
Arg
entina
Egypt
Surin
am
eC
am
bo
dia
Ira
qB
ang
lad
esh
Lib
ya
Pakis
tan
Myan
ma
rY
em
en
Ecu
ado
rS
outh
Suda
nIr
an
Ch
ad
Vene
zu
ela
Suda
nS
yri
aD
RC
Nig
eri
a
PRM 2013 Overall Risk Scores
Top 10 Shale Oil and Gas Resources: Span the Gamut
of Above-Ground Risk
Countries identified by the EIA with the largest unconventional resources vary
widely in terms of overall above-ground risk – but those in the top ten for both
shale gas and shale oil are mostly found in the top half of the risk range.
Low Risk
High Risk
Top 10 Shale Oil and Gas
Top 10 Shale Oil
Top 10 Shale Gas

North Slope Gas & LNG Symposium | © PFC Energy 2013 | Page 14 | August 2013
Top 10 Shale Gas Countries per EIA Study
Shale gas resources are concentrated in the countries with the most
manageable above-ground risk as well as strong infrastructure/service sector
capacity. The two main outliers are Argentina and South Africa.
Low Risk
Environment High Risk
Environment
Significant Service
Sector/Logistical
Capacity
Minimal Service
Sector/Logistical
Capacity
Canada
United States
Australia Argentina
Mexico
Brazil
China
Algeria
Russia
South Africa
Size of bubble denotes size of
resources according to the EIA

North Slope Gas & LNG Symposium | © PFC Energy 2013 | Page 15 | August 2013
Unconventional Success Has Resulted from a Complex
System of Favorable Factors
Critical Ingredients of the System Lwr-48 China Alaska Geo-
tech
Macro
Enabler
Pace
Governor
Rock characteristics/ resource base quality X
Resource base quantity X
Responsiveness to frack X
Well control X
Land Tenure/Parcel Size X
Local advocates and beneficiaries X
Lease structure forcing establishment of
production X
High number of operators/dispersion X
Company ability /willingness to spend significant
capital quickly X
High company risk appetite for trial and error X
Service sector availability X
Rapid transmission of learnings via leaky service
sector and external company orientation X
Pipes, Gathering to allow processing/delivery X
Water and other essential frac materials X
Skilled oil and gas labor pool X
Favorable natural gas prices and available markets X
Cooperative governments and incentives X

Life Stage and Value Creation Framework
Ingredients of Successful Plays
Skill Sets
Play Reviews
Table of Contents

North Slope Gas & LNG Symposium | © PFC Energy 2013 | Page 17 | August 2013
• What is Happening?
– Companies proving the reservoir will flow in likely commercial quantities.
• Major Activities
– Geoscience/ Basin studies
– Land acquisition
– Pilot wells
• Strategies for Success: Violate the Usual Rules of Oil and Gas
– Run a Science Experiment
– Attract other operators
– Capture acreage even where geo scientists don’t suspect sweet spot
– Select service sector partner based on science/experience, not cost
• Key Metrics to Evaluate
– $/acre of land acquired
– Quantity and distribution of leasehold
– Reservoir information derived from each drilling dollar
Stage 1: Prove It

North Slope Gas & LNG Symposium | © PFC Energy 2013 | Page 18 | August 2013
• What is Happening?
– Derive the optimal recipe for drilling and fracing wells in this particular
play
– Establish the limits and quality map of the play
• Major Activities
– Try everything
– Gain scale & scope
– Ramp drilling/create hubs
• Strategies for Success: Creative Engineering for Peak Efficiency
– Integrate diverse data streams and draw correct conclusions
– Orient externally: collect and share information and scout heavily
– Choose multiple service sector companies to maximize creativity
• Key Metrics to Evaluate
– $/acre paid during consolidation of companies w/ weaker results
– Change in standard deviation of frac techniques and results
– Slope of IP evolution
Stage 2: Optimize It

North Slope Gas & LNG Symposium | © PFC Energy 2013 | Page 19 | August 2013
• What is Happening?
– Play is turned from potential into cash flow by massive investment with
cookie cutter approach
• Major Activities
– Large, steady programs
– Focus on above ground efficiencies
• Strategies for Success: Standardize to Grind Down Unit Costs
– Coordinate chain of resources and companies flawlessly
– Ensure ancillary infrastructure such as midstream and transport
– Apply no-frills approach to service partners & seek volume discount
• Key Metrics to Evaluate
– Cost of capital and free cash flow at bottom of cycle
– Spud to market timing efficiency
– Speed of convergence vs. peers and predictability of well results
– Sequential unit cost reduction (opex and capex)
Stage 3: Industrialize It

North Slope Gas & LNG Symposium | © PFC Energy 2013 | Page 20 | August 2013
• What is Happening?
– Rejuvenate the play and manage its operations
• Major Activities
– Transfer of ownership
– Choose between three paths
Downspace further Rework and refrac Expansion
• Strategies for Success: Sweat the Small Stuff… and Bring
Imagination
– Keep it cheap and focus
– Leverage existing well bores, infrastructure, and field personnel
– Find new zones and new technology
• Key Metrics for Investors to Evaluate
– $/boe attributed to probables and possibles
– Use of existing wellbores and infrastructure
– Success rate in finding overlooked sweet spots
– Change in rate of base decline
Stage 4: Rethink It

North Slope Gas & LNG Symposium | © PFC Energy 2013 | Page 21 | August 2013
• All of these athletes won gold medals in London. Guess the sport.
What Does It Take to Win?
Deep excellence comes from thorough-going specialization, but that also
shapes the entity in a way that makes it difficult to succeed in a different contest.
• If the London gold medal decathlete had entered all the event finals,
he would have placed last in 8 and in the bottom half of the other two.
• Retraining is difficult (think Michael Jordan in baseball or Lance
Armstrong in the NYC marathon).
100m Sprint
Marathon
Weightlifting

Life Stage and Value Creation Framework
Ingredients of Successful Plays
Skill Sets
Play Reviews
Table of Contents

North Slope Gas & LNG Symposium | © PFC Energy 2013 | Page 23 | August 2013
Lower 48 Map of Producing Wells
Woodford
Fayetteville
Marcellus
Eagleford
Bakken
Haynesville
Barnett

North Slope Gas & LNG Symposium | © PFC Energy 2013 | Page 24 | August 2013
Lower 48 Shale Gas is Primary Contributor to Growth
Marcellus production, primarily in Pennsylvania, is projected to be a
key driver of growth in domestic natural gas through 2020.
67.669.7 70.6
72.4 72.1 71.8 72.173.9
75.377.3
79.280.9
82.283.6 83.8 84.4 84.7 85.5 85.8 86.3
0
10
20
30
40
50
60
70
80
90
100
Ja
n-1
1
Ap
r-11
Ju
l-11
Oct-
11
Ja
n-1
2
Ap
r-1
2
Ju
l-1
2
Oct-
12
Ja
n-1
3
Ap
r-1
3
Ju
l-1
3
Oct-
13
Ja
n-1
4
Ap
r-1
4
Ju
l-1
4
Oct-
14
Ja
n-1
5
Ap
r-1
5
Ju
l-1
5
Oct-
15
Ja
n-1
6
Ap
r-1
6
Ju
l-1
6
Oct-
16
Ja
n-1
7
Ap
r-1
7
Ju
l-1
7
Oct-
17
Ja
n-1
8
Ap
r-1
8
Ju
l-1
8
Oct-
18
Ja
n-1
9
Ap
r-1
9
Ju
l-1
9
Oct-
19
Ja
n-2
0
Ap
r-2
0
Ju
l-2
0
Oct-
20
Production in bcf/d
Lwr-48 Gross Natural Gas Production Estimate
Haynesville DUC
Marcellus DUC
Marcellus PA
Marcellus WV
Eagleford
Granite Wash
Haynesville
Woodford
Pinedale
Fayetteville
Barnett
GOM Deepwater
GOM Shelf
CBM
Oil (Other)
Gassy Oil (Other)
Wet Gas (Other)
Dry Gas (Other)
Total
North Slope Gas & LNG Symposium | © PFC Energy 2013 | Page 25 | August 2013
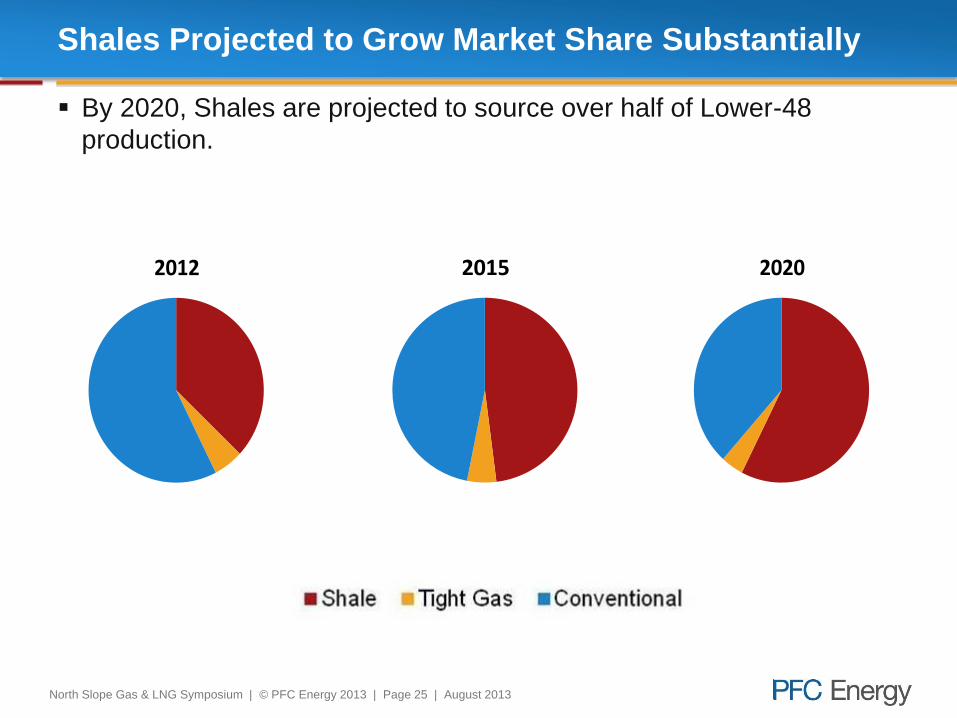
Shales Projected to Grow Market Share Substantially
By 2020, Shales are projected to source over half of Lower-48
production.
2012 2015 2020

Haynesville Shale Play

North Slope Gas & LNG Symposium | © PFC Energy 2013 | Page 27 | August 2013
Haynesville: Key Facts
Life Cycle Though the Haynesville has a large inventory of wells still to be
drilled, low gas prices are not incentivizing operators to return to
the play. Thus, though it has quite mature technologically, it may
never reach its full potential.
Well Count By March of 2013, nearly 3,500 wells were producing from the
Haynesville.
Competitive
Landscape
Over 40 operators have producing assets, though the larges six
operators hold nearly 50% of the wells
Oil vs. Gas Haynesville production is more than 98% gas.
Sweet Spot Activity in the sweet spot of the play has nearly exhausted the
inventory of best acreage. Given the current pricing environment,
focused activity is expected to continue.
Productivity
Distribution
1st quintile wells are 1.5 times as productive as 2nd quintile wells
and 4.3 times more productive than 5th quintile.
Type Curve Trends Minor improvements in peak production are still observed, while
newer vintage wells outperform older wells nearly 7-to-1 after 12
months (2011 vs. 2007).

North Slope Gas & LNG Symposium | © PFC Energy 2013 | Page 28 | August 2013
Highly Concentrated Area of Peak Productivity
Centralized Activity
Most efficient wells are concentrated geographically in a very small
area in LA. Rock productivity decreases significantly in a radial
manner as operators have delineated the expanses of the play.

North Slope Gas & LNG Symposium | © PFC Energy 2013 | Page 29 | August 2013
Peak Gas Production Has Hit Plateau
Productivity in the play is at best stagnant being that it has not
improved and operator results are converging on the plays inherent
average. Additionally recent trends have shown operators are high-
grading within their individual portfolios which further supports a
bearish outlook. Avg. Peak mcf/d
Avg. Peak mcf/d

North Slope Gas & LNG Symposium | © PFC Energy 2013 | Page 30 | August 2013
Lateral Lengths Showing Incremental Gains Only
Despite operators having determined an optimal lateral length for the
play during attractive gas prices. The decline in pricing has seen
operators attempt multilaterals as an effort to buoy economic results.
Lateral Length (ft)
Lateral Length (ft)

North Slope Gas & LNG Symposium | © PFC Energy 2013 | Page 31 | August 2013
Well Productivity per Lateral Foot is Highly Predictable
Resulting from longer laterals and stagnant peak rates, peak
productivity has slightly declined. Operators are drilling more lower
quintile assets showing possible exhaustion of higher quintile sites.
mcf/d/latft mcf/d/latft
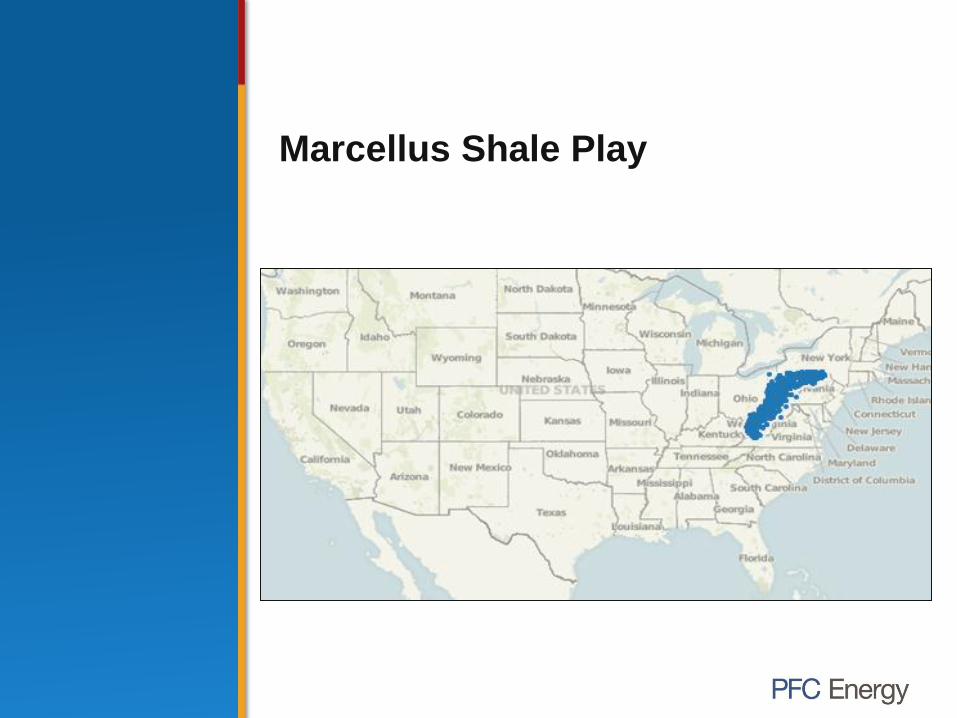
Marcellus Shale Play

North Slope Gas & LNG Symposium | © PFC Energy 2013 | Page 33 | August 2013
Marcellus: Play Conclusions
Life Cycle Developing in two main sub-regions, operators have found their
best results in the northeast and southwest extents of
Pennsylvania. Though much of the geographical footprint remains
undeveloped, the core areas are clearly seeing standardized
operations.
Well Count The latest data, capturing the majority of the play through the end
of 2012, accounted for over 5,600 producing wells.
Competitive
Landscape
130 operators generate volumes from the Marcellus, though only
seven operators have more than 200 wells
Oil vs. Gas Though some operators have found substantial NGL volumes,
Marcellus production is more than 96% gas at the wellhead
Sweet Spot Operators have found the most economic production in the
northeast and southwest portions of Pennsylvania.
Productivity
Distribution
1st quintile wells are 2 times as productive as 2nd quintile wells and
8 times more productive than 5th quintile.
Type Curve Trends Type curves have shown no meaningful improvements in the past
3 years.

North Slope Gas & LNG Symposium | © PFC Energy 2013 | Page 34 | August 2013
Marcellus: Map of Peak/Latft Gas Quintiles
Despite the large areal extent of the play, high quality wells are
concentrated in the northeast and southwest regions of the play.
Operators continue to delineate the most productive areas of the
play, leaving the middle portion of Pennsylvania largely undeveloped.

North Slope Gas & LNG Symposium | © PFC Energy 2013 | Page 35 | August 2013
Marcellus: Peak Gas
Peak rates have shown incredible consistency since early 2012,
though the variance in peaks has increased. Omitting the “super
wells”, mainly drilled by Cabot and EQT, the play’s average peak has
slightly declined.
Avg Peak mcf/d
North Slope Gas & LNG Symposium | © PFC Energy 2013 | Page 36 | August 2013
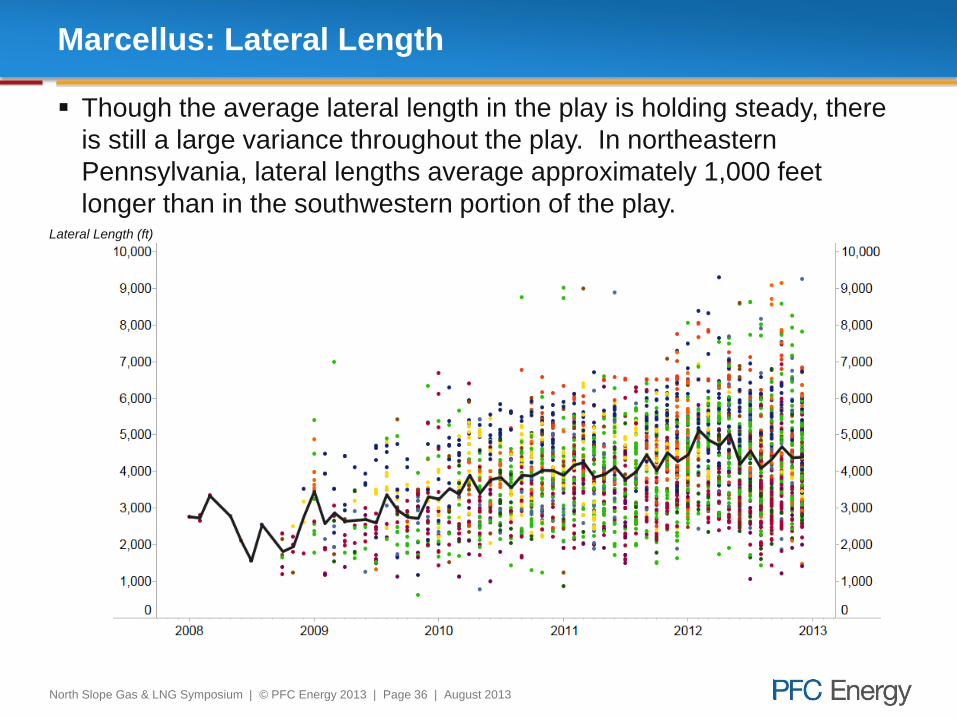
Marcellus: Lateral Length
Though the average lateral length in the play is holding steady, there
is still a large variance throughout the play. In northeastern
Pennsylvania, lateral lengths average approximately 1,000 feet
longer than in the southwestern portion of the play. Lateral Length (ft)

North Slope Gas & LNG Symposium | © PFC Energy 2013 | Page 37 | August 2013
Marcellus: Peak/Latft Gas
The natural result of peak production rates and lateral lengths both
holding steady is that peak per lateral foot has been flat as well.
Operators have largely delineated and held quality acreage and are
content to develop those areas and hope for higher gas prices to
justify more exploration. Avg Peak mcf/d/1000latft
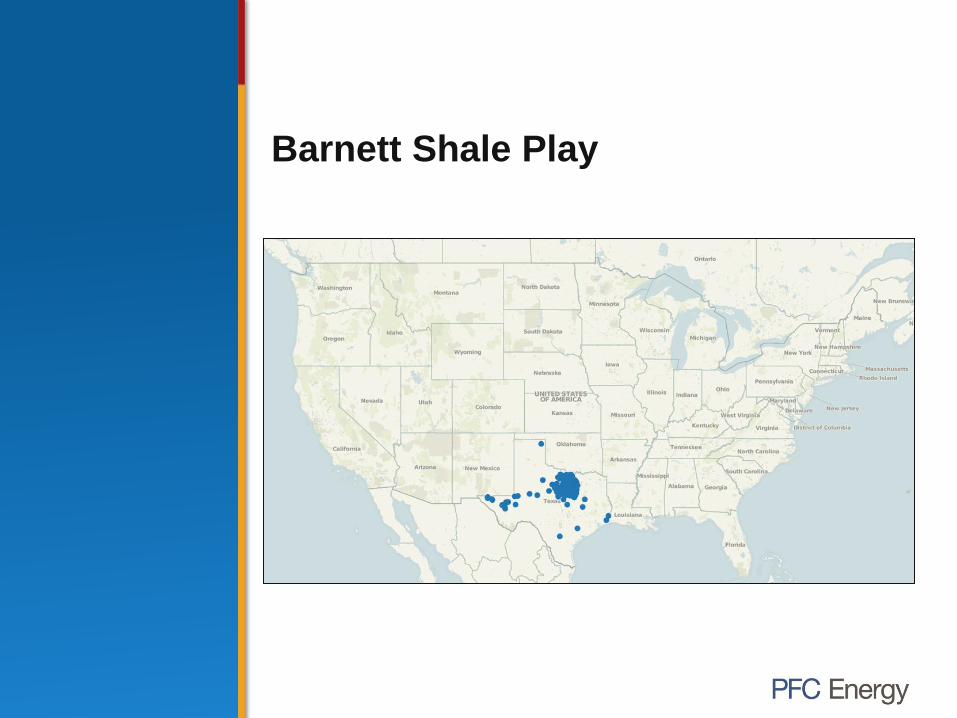
Barnett Shale Play

North Slope Gas & LNG Symposium | © PFC Energy 2013 | Page 39 | August 2013
Barnett: Key Facts
Life Cycle The Barnett is well into the optimization phase, and may be
experiencing some sweet spot exhaustion. Liquids production in
the northern portion counties have breathed new life into the play.
Well Count Since 2001, over 17,000 wells have begun production in the play.
Competitive
Landscape
Since 2008, over 130 operators have drilled at least one active
well. However, of the 9,000 wells drilled since 2008, Chesapeake,
Devon, EOG, and ExxonMobil combine to account for 6,000 of
them.
Oil vs. Gas Over 91% of the wells in the Barnett produce dry gas (wellhead
volumes >90% gas at 6-1 conversion). However, in the northern
reaches of the play, liquids production has been increasing.
Sweet Spot The sweet spot in parts of Wise, Johnson, and Tarrant counties
have seen the most activity, though activity in all three has been
decreasing from the peak in 2008.
Productivity
Distribution
1st quintile wells in the Barnett are nearly twice as productive as 2nd
quintile wells, and are 8 times as productive as 5th quintile wells.
Type Curve Trends 2012 was the first year the Barnett type curves did not improve.

North Slope Gas & LNG Symposium | © PFC Energy 2013 | Page 40 | August 2013
Core Located on Eastern Edge of Play, With
Productivity Delineations Clearly Visible to the West
As the oldest unconventional play in the US, the Barnett has seen
over 18,000 wells produce volumes. Though overall production has
grown, an exhaustion of best drill sites and a reduction in activity
point to a possible decline in production.

North Slope Gas & LNG Symposium | © PFC Energy 2013 | Page 41 | August 2013
Peak Production Rates Still Holding Steady
As operators are unable to drill top producing wells, overall gas
productivity has experienced a significant decline in recent years.
Avg. Peak mcf/d

North Slope Gas & LNG Symposium | © PFC Energy 2013 | Page 42 | August 2013
Lateral Lengths Continue to Grow, Despite Play’s Age
Lateral lengths in the play have been trending upwards, as operators
seek to generate more production per well bore by drilling larger
wells. The current average is nearly 4,000 feet, though some
operators have clearly experimented with multi-laterals Ft

North Slope Gas & LNG Symposium | © PFC Energy 2013 | Page 43 | August 2013
Production per Lateral Foot Falling, Partly Driven by
Longer Lateral Lengths
As operators drill longer laterals with lower peak gas rates, the
compounding effect has eroded overall productivity in the play. As
sweet-spot exhaustion becomes more of an issue in the play,
operators will have to drill a larger number of wells to compensate for
lower productivity.
Avg. Peak
mcf/d/1000 lat ft
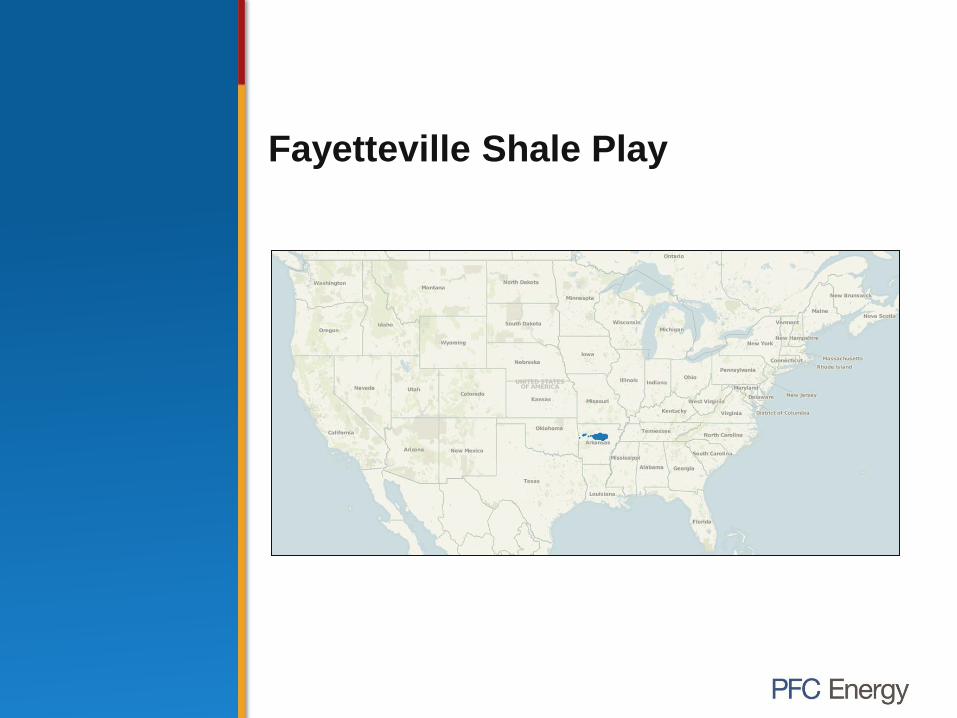
Fayetteville Shale Play

North Slope Gas & LNG Symposium | © PFC Energy 2013 | Page 45 | August 2013
Fayetteville: Key Facts
Life Cycle With the play dominated by one operator, Southwestern,
standardized operations have been seen for several years.
However, Southwestern appears to have recently ceased acreage
holding activities and is now focusing on infill drilling
Well Count 5,500 wells currently generate production in the Fayetteville
Competitive
Landscape
Southwestern rules the play with nearly 60% of producing assets.
Oil vs. Gas No liquids are found in the Fayetteville
Sweet Spot Several areas of highly productive rock have been identified,
though no core sweet spot has been determined.
Productivity
Distribution
1st quintile wells are 1.5 times more productive than 2nd quintile
wells and five times as productive as 5th quintile.
Type Curve Trends Type curves have shown no significant improvements since 2010,
though if Southwestern’s acreage holding is complete, high-
grading is expected.
North Slope Gas & LNG Symposium | © PFC Energy 2013 | Page 46 | August 2013
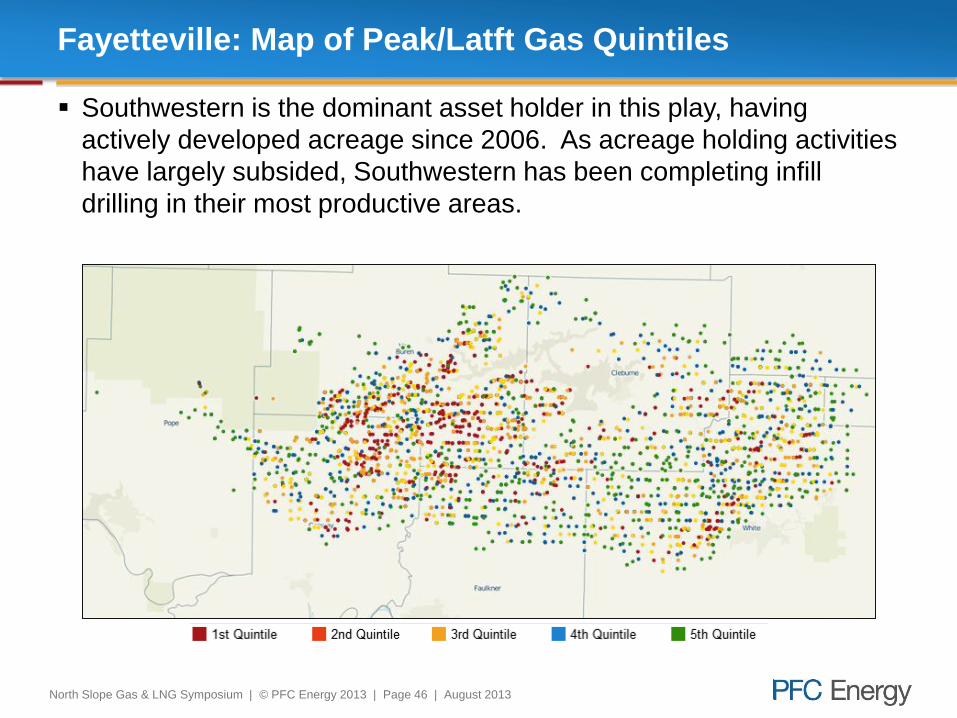
Fayetteville: Map of Peak/Latft Gas Quintiles
Southwestern is the dominant asset holder in this play, having
actively developed acreage since 2006. As acreage holding activities
have largely subsided, Southwestern has been completing infill
drilling in their most productive areas.

North Slope Gas & LNG Symposium | © PFC Energy 2013 | Page 47 | August 2013
Fayetteville: Peak Gas
Operators have shown small but steady improvements in peak gas
rates. Additionally, the variance in peak rate is decreasing, implying
operators have been at least modestly successful in high-grading
efforts.
Avg. Peak mcf/dAvg. Peak mcf/d
North Slope Gas & LNG Symposium | © PFC Energy 2013 | Page 48 | August 2013
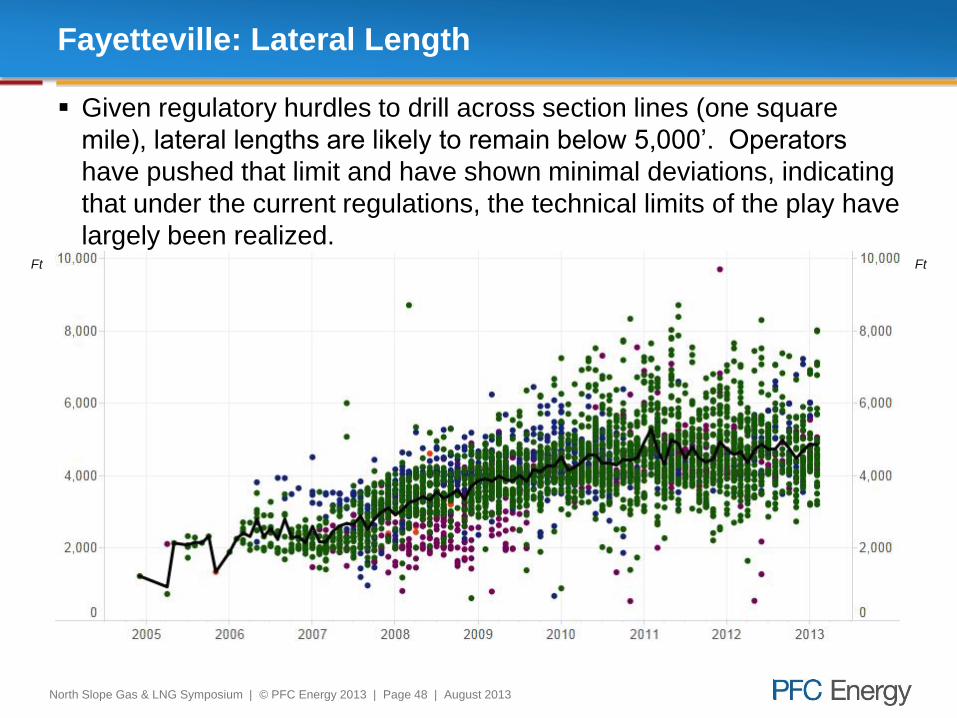
Fayetteville: Lateral Length
Given regulatory hurdles to drill across section lines (one square
mile), lateral lengths are likely to remain below 5,000’. Operators
have pushed that limit and have shown minimal deviations, indicating
that under the current regulations, the technical limits of the play have
largely been realized. Ft Ft

North Slope Gas & LNG Symposium | © PFC Energy 2013 | Page 49 | August 2013
Fayetteville: Peak/Latft Gas
Peak productivity has remained predictable, and in much the same
as peak rates and lateral lengths, the variability in results has
decreased. As Southwestern continues a methodological
development of the play, results will maintain their predictability.
Avg. Peak
mcf/d/1000 latft
Avg. Peak
mcf/d/1000 latft

Pinedale-Jonah Play
North Slope Gas & LNG Symposium | © PFC Energy 2013 | Page 51 | August 2013
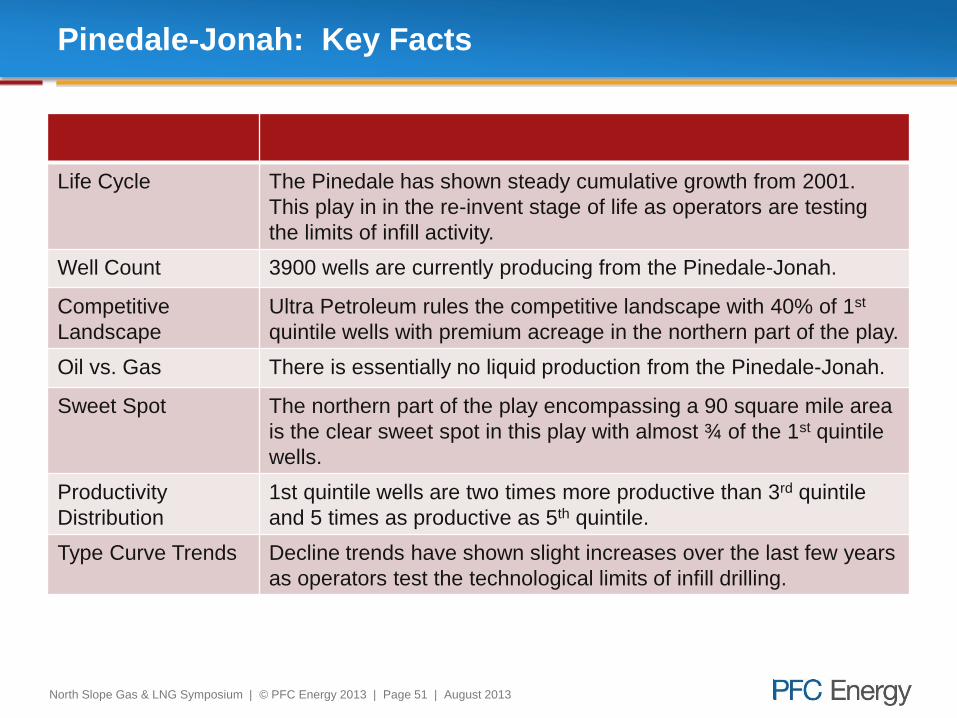
Pinedale-Jonah: Key Facts
Life Cycle The Pinedale has shown steady cumulative growth from 2001.
This play in in the re-invent stage of life as operators are testing
the limits of infill activity.
Well Count 3900 wells are currently producing from the Pinedale-Jonah.
Competitive
Landscape
Ultra Petroleum rules the competitive landscape with 40% of 1st
quintile wells with premium acreage in the northern part of the play.
Oil vs. Gas There is essentially no liquid production from the Pinedale-Jonah.
Sweet Spot The northern part of the play encompassing a 90 square mile area
is the clear sweet spot in this play with almost ¾ of the 1st quintile
wells.
Productivity
Distribution
1st quintile wells are two times more productive than 3rd quintile
and 5 times as productive as 5th quintile.
Type Curve Trends Decline trends have shown slight increases over the last few years
as operators test the technological limits of infill drilling.

North Slope Gas & LNG Symposium | © PFC Energy 2013 | Page 52 | August 2013
Pinedale-Jonah: Map of Peak/Boe Gas Quintiles
The Pinedale field dominates this play with almost 75% of the 1st
quintile wells. Ultra Petroleum operates the majority of the Pinedale
wells, while Encana is the dominant operator in the Jonah.
Pinedale
Jonah

North Slope Gas & LNG Symposium | © PFC Energy 2013 | Page 53 | August 2013
Pinedale-Jonah: Peak Gas
As the play has been experiencing infill drilling, peak rates have
slightly declined due to communication and interference between
wells. This, combined with low gas prices, has led to a significant
reduction in activity in the play.
Avg. Peak mcf/d Avg. Peak mcf/d