north south university tutorial 2individual.utoronto.ca/ahmed_3/index_files/nsu/bio2_2.pdfnorth...
TRANSCRIPT

NORTH SOUTH UNIVERSITY
TUTORIAL 2
AHMED HOSSAIN,PhD
Data Management and Analysis
AHMED HOSSAIN,PhD - Data Management and Analysis 1

Correlation AnalysisINTRODUCTION
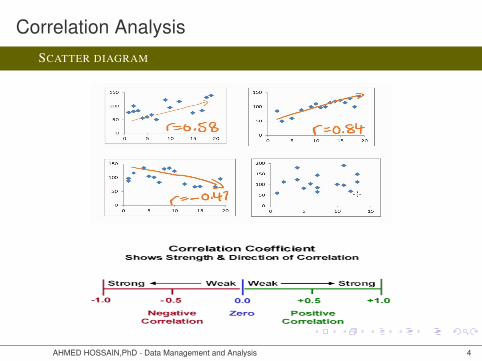
In correlation analysis, we estimate a sample correlation coefficient, morespecifically the Pearson Product Moment correlation coefficient. The samplecorrelation coefficient, denoted r , ranges between -1 and +1.
r quantifies the direction and strength of the linear relationship between thetwo variables.
The sign of the r indicates the direction of the association.
The magnitude of the r indicates the strength of the association.
For example, a correlation of r = 0.9 suggests a strong, positive associationbetween two variables, whereas a correlation of r = -0.2 suggest a weak,negative association. r close to zero suggests no linear association between twocontinuous variables.
Limitations: There may be a non-linear association between two continuousvariables, but computation of a r does not detect this.
AHMED HOSSAIN,PhD - Data Management and Analysis 2

Correlation AnalysisSCATTER DIAGRAM
We wish to estimate the association between gestational age and infant birthweight. In this example, birth weight is the dependent variable and gestationalage is the independent variable. Thus Y =birth weight and X=gestational age.Note that the independent variable is on the horizontal axis (or X-axis), and thedependent variable is on the vertical axis (or Y-axis).
AHMED HOSSAIN,PhD - Data Management and Analysis 3
Correlation AnalysisSCATTER DIAGRAM
AHMED HOSSAIN,PhD - Data Management and Analysis 4

Simple Linear RegressionINTRODUCTION
In simple linear regression we are concerned about the relationship between twovariables, X and Y .
There are two components to such a relationship1 The strength of the relationship.2 The direction of the relationship.
We shall also be interested in making inferences about the relationship.
We will be assuming here that the relationship between X and Y is linear (or hasbeen linearized through transformation).
AHMED HOSSAIN,PhD - Data Management and Analysis 5

RegressionINTRODUCTION
Technique used for the modeling and analysis of numerical data.Exploits the relationship between two or more variables so that we can gaininformation about one of them through knowing values of the other.Regression can be used for prediction, estimation, hypothesis testing, andmodeling causal relationships.
AHMED HOSSAIN,PhD - Data Management and Analysis 6

Simple Linear RegressionASSUMPTIONS
Suppose that we have a dataset (y1, x1), (y2, x2), · · · , (yn, xn).Our interest is in using our model to predict values of Y for any given value ofX = x .If we know the values of β0 and β1 then the fitted value for the observation yiwould be β0 + β1xi .The error in the fitted value can be measured by the vertical distance
εi = yi − β0 − β1xi
We would like to make these errors as small as possible.
AHMED HOSSAIN,PhD - Data Management and Analysis 7

Simple Linear RegressionEXAMPLE
AHMED HOSSAIN,PhD - Data Management and Analysis 8

Simple Linear RegressionEXAMPLE
AHMED HOSSAIN,PhD - Data Management and Analysis 9

Multiple Linear RegressionINTRODUCTION
Extension of the simple linear regression model to two or more independentvariables
y = β0 + β1x1 + β2x2 + · · ·+ βnxn + ε
For example, Expression = Baseline + Age + Tissue + Sex + Error.
Partial Regression Coefficients: βi effect on the dependent variable whenincreasing the i th independent variable by 1 unit, holding all other predictorsconstant.
AHMED HOSSAIN,PhD - Data Management and Analysis 10

Multiple Linear RegressionCATEGORICAL INDEPENDENT VARIABLES
AHMED HOSSAIN,PhD - Data Management and Analysis 11
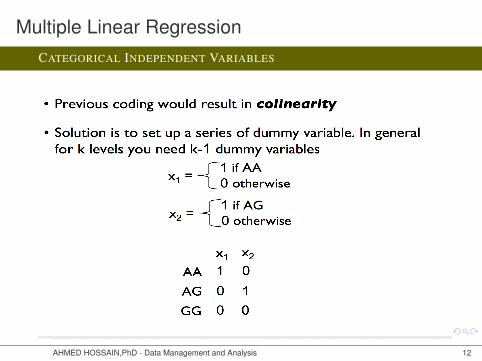
Multiple Linear RegressionCATEGORICAL INDEPENDENT VARIABLES
AHMED HOSSAIN,PhD - Data Management and Analysis 12
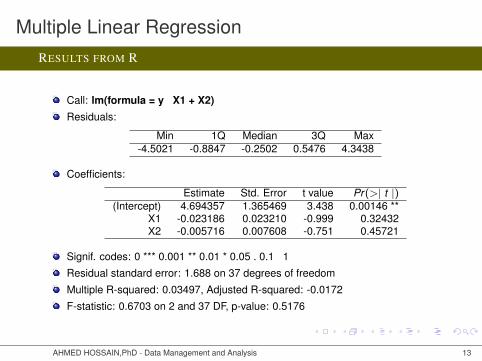
Multiple Linear RegressionRESULTS FROM R
Call: lm(formula = y X1 + X2)Residuals:
Min 1Q Median 3Q Max-4.5021 -0.8847 -0.2502 0.5476 4.3438
Coefficients:
Estimate Std. Error t value Pr(>| t |)(Intercept) 4.694357 1.365469 3.438 0.00146 **
X1 -0.023186 0.023210 -0.999 0.32432X2 -0.005716 0.007608 -0.751 0.45721
Signif. codes: 0 *** 0.001 ** 0.01 * 0.05 . 0.1 1
Residual standard error: 1.688 on 37 degrees of freedom
Multiple R-squared: 0.03497, Adjusted R-squared: -0.0172
F-statistic: 0.6703 on 2 and 37 DF, p-value: 0.5176
AHMED HOSSAIN,PhD - Data Management and Analysis 13

Multiple Linear RegressionHYPOTHESIS TESTS: INDIVIDUAL REGRESSION COEFFICIENTS
AHMED HOSSAIN,PhD - Data Management and Analysis 14
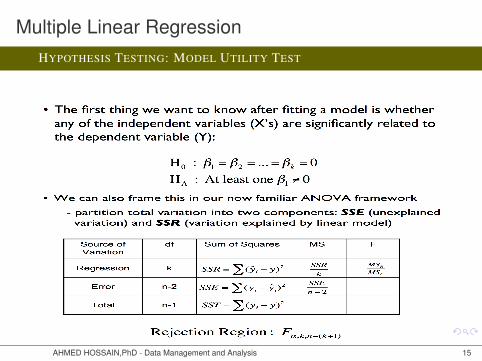
Multiple Linear RegressionHYPOTHESIS TESTING: MODEL UTILITY TEST
AHMED HOSSAIN,PhD - Data Management and Analysis 15
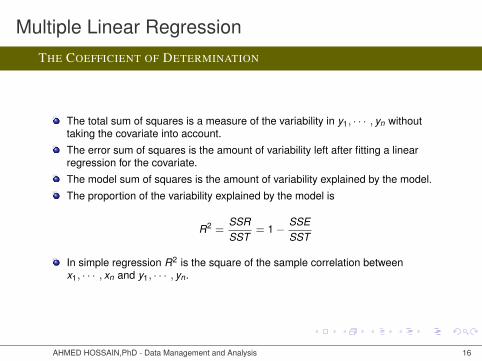
Multiple Linear RegressionTHE COEFFICIENT OF DETERMINATION
The total sum of squares is a measure of the variability in y1, · · · , yn withouttaking the covariate into account.
The error sum of squares is the amount of variability left after fitting a linearregression for the covariate.
The model sum of squares is the amount of variability explained by the model.
The proportion of the variability explained by the model is
R2 =SSRSST
= 1 −SSESST
In simple regression R2 is the square of the sample correlation betweenx1, · · · , xn and y1, · · · , yn.
AHMED HOSSAIN,PhD - Data Management and Analysis 16

Multiple Linear RegressionBIRTHWEIGHT IS CONTINIOUS AND CATEGORICAL INDEPENDENT VARIABLES
AHMED HOSSAIN,PhD - Data Management and Analysis 17
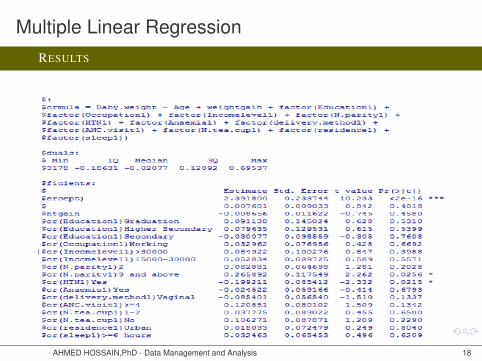
Multiple Linear RegressionRESULTS
AHMED HOSSAIN,PhD - Data Management and Analysis 18
Multiple Linear RegressionINTERACTION
INTERACTION Interaction effects represent the combined effects of variables on thecriterion or dependent measure. When an interaction effect ispresent, the impact of one variable depends on the level of the othervariable.
EXAMPLE 1 Interaction between adding sugar to coffee and stirring the coffee.Neither of the two individual variables has much effect on sweetnessbut a combination of the two does.
EXAMPLE 2 Interaction between smoking and inhaling asbestos fibres: Both raiselung carcinoma risk, but exposure to asbestos multiplies the cancerrisk in smokers and non-smokers. Here, the joint effect of inhalingasbestos and smoking is higher than the sum of both effects.
AHMED HOSSAIN,PhD - Data Management and Analysis 19

Multiple Linear RegressionIDENTIFYING INTERACTION
CATEGORICAL PREDICTORS If the researcher is interested in whether the treatment isequally effective for females and males. That is, is there a differencein treatment depending on gender group? This is a question ofinteraction. Interaction results whose lines do not cross .
CONTINUOUS PREDICTORS : Single slope test.
AHMED HOSSAIN,PhD - Data Management and Analysis 20