northeast business parkeisdocs.dsdip.qld.gov.au/northeast business park/eis/… · ·...
TRANSCRIPT

Northeast Business Park
Stormwater Management Plan
October, 2007
Northeast Business Park Pty ltd
Parsons Brinckerhoff Australia Pty Limited ABN 80 078 004 798
Level 4, Northbank Plaza 69 Ann Street GPO Box 2907 Brisbane QLD 4001 AUSTRALIA Telephone +61 7 3854 6200 Facsimile +61 7 3854 6500 Email [email protected] NCSI Certified Quality System ISO 9001
2138171B-RPT002-B:ag

© Parsons Brinckerhoff Australia Pty Limited (PB) [2007].
Copyright in the drawings, information and data recorded in this document (the information) is the property of PB. This document and the information are solely for the use of the authorised recipient and this document may not be used, copied or reproduced in whole or part for any purpose other than that for which it was supplied by PB. PB makes no representation, undertakes no duty and accepts no responsibility to any third party who may use or rely upon this document or the information.
Author: Anthony Gaffney, Senior Water Engineer ....................................
Signed: .....................................................................................................
Reviewer: Bill Johnson, Senior Water Engineer ...........................................
Signed: .....................................................................................................
Approved by: Anthony Gaffney, Senior Water Engineer ....................................
Signed: .....................................................................................................
Date: October 2007 ...............................................................................
Distribution: Northeast Business Park Pty Ltd .................................................
2138171B-RPT002-B:ag

Northeast Business Park Stormwater Management Plan
Contents
Page Number
1. Introduction..........................................................................................................................................1
2. Existing environment ..........................................................................................................................2 2.1 Topography and drainage characteristics 2 2.2 Catchments 3
3. Development scenario ........................................................................................................................4
4. Environmental values and water quality / quantity objectives .......................................................5 4.1 Background 5 4.2 Water quality in the Caboolture River 5 4.3 Water quality values and objectives 6
4.3.1 Background 6 4.3.2 South East Queensland Regional Water Quality Management Strategy 6 4.3.3 Queensland Water Quality Guidelines and Caboolture River Environmental Values and Water Quality Objectives 7 4.3.4 Caboolture Shire Council desired mean annual load reductions 9 4.3.5 Water sensitive urban design – design objectives for urban stormwater management (Healthy Waterways – Draft Implementation Guideline No. 7) 9 4.3.6 Adopted water quality objectives 10
4.4 Water quantity objectives 10 4.4.1 Caboolture Shire Council Shire Plan 10 4.4.2 Water sensitive urban design – design objectives for urban stormwater management (Healthy Waterways – Draft Implementation Guideline No. 7) 11 4.4.3 Adopted water quantity objectives 11
5. Stormwater management strategy...................................................................................................12 5.1 General 12 5.2 Framework 12 5.3 Design criteria 13
5.3.1 Water sensitive urban design (WSUD) 14 5.4 Best management practice 15 5.5 Key design constraints and opportunities 15
6. Water quality modelling ....................................................................................................................16 6.1 Background 16 6.2 Available data 16
6.2.1 Rainfall 16 6.2.2 Evaporation 16 6.2.3 Model parameters 17
6.3 Modelling approach 18 6.4 Existing case assessment 18 6.5 Post development conditions assessment 20 6.6 Developed case assessment – conceptual design 23
6.6.1 Overview 23 6.6.2 Proposed stormwater management measures 23 6.6.3 Treatment efficiencies 26 6.6.4 Pollutant modelling results 27
6.7 Additional pollutants 29 6.8 Comment on water quality objectives 29
7. Water quantity....................................................................................................................................30 7.1 Estimation of peak flows 30
7.1.1 Peak flows 30 8. Cost estimate .....................................................................................................................................32
9. Conclusions and recommendations................................................................................................33 9.1 Water quality 33
PB 2138171B-RPT002-B:ag Page i

Northeast Business Park Stormwater Management Plan
Contents (continued) Page Number
PB 2138171B-RPT002-B:ag Page ii
9.2 Water quantity 34 9.3 Recommendations 34
References .................................................................................................................................................35 List of tables Table 4-1: Water quality objectives for aquatic ecosystems – mid estuary 8 Table 4-2: Design objectives for water quantity 11 Table 6-1: Impervious Area Parameters 18 Table 6-2: Major catchment areas and land use, existing site conditions 19 Table 6-3: Mean annual pollutant loads – Undeveloped case 20 Table 6-4: Catchment areas and land use, development site conditions 22 Table 6-5: Mean annual pollutant loads – Post-development (unmitigated) case 23 Table 6-6: Representative treatment trains for each catchment 24 Table 6-7: Pollutant reduction efficiencies – BCC Guidelines 26 Table 6-8: Mean annual pollutant loads – Post-development (mitigation) case 27 Table 6-9: Reduction of mean annual pollutant loads – Post-development (mitigation) case 27 Table 6-10: Land requirements of treatment elements 28 Table 6-11: Applied pollutant reduction efficiencies 29 Table 7-1: Pre- and post-development peak flows 31 List of figures Figure 1-1: Site locality, Nolan Drive, Morayfield 1 Figure 2-1: Catchment plan showing external catchment boundaries 3 Figure 3-1: Schematic of proposed development 4 Figure 6-1: Rainfall and evaporation data 17 Figure 6-2: Catchment boundaries – existing conditions, development site only 19 Figure 6-3: Catchment boundaries – Developed conditions 21 Figure 6-4: Conceptual design of treatment trains – Developed conditions 25 List of appendices Appendix A Ecosystem constraints plan Appendix B Master plan layout Appendix C Best Practice Management Appendix D Base and storm flow concentrations parameters (BCC)

Northeast Business Park Stormwater Management Plan
Executive summary Northeast Business Park Pty Ltd is proposing to develop a 326 ha multiuse precinct on 790 ha of privately owned land located at Nolan Drive, Morayfield. This degraded site is a former pine plantation on the southern banks of the Caboolture River near Burpengary. The development will have a marine industry and business focus and provide new public access to the riverfront.
The main philosophy of this stormwater management plan is that the proposed development will feature the protection and enhancement of riparian and wetland vegetation. The overall stormwater management objective is to preserve natural flows to the waterways and wetlands and to minimise the increase in pollutant loads. Northeast Business Park has a commitment to managing stormwater in terms of best practice for water sensitive urban design and the overall development has an environmental focus.
The stormwater management and reporting strategy adopted for the Northeast Business Park is guided by a framework of management plans. Two levels of management plans have been identified and described in this report.
Master Plan (this report) – provides a framework for water quality management and reporting for the entire development site. It identifies the adopted water quality reporting objectives, relevant design constraints and appropriate management strategies for the development site. Water quality modelling is undertaken at the conceptual level, based on appropriate water quality treatment measures for each catchment.
Catchment Stormwater Management Plans – developed as part of the initial area development plan for the first stage of development in each catchment. These plans address water quality and quantity management at the catchment level and provide detailed design and modelling of all adopted management measures.
This report outlines the stormwater management strategy adopted to achieve the Caboolture Shire Council’s (CSC) pollution reduction targets and the Queensland Water Quality Objectives (WQO) for Caboolture River.
Water quality
A MUSIC water quality model was developed for the assessment of TSS, TN and TP for existing and post-development site conditions. The modelling parameters for the various land uses (urban, rural, commercial, industrial and undeveloped) were adopted from the Brisbane City Council’s ‘Guidelines for Pollutant Export Modelling in Brisbane Version 7 – Draft’ as referenced in Caboolture Shire Plan Design and Development Manual – Stormwater Code.
Treatment trains are a series of stormwater treatment measures located in a catchment to provide a staged approach to removal of stormwater pollutants from runoff. The proposed treatment trains were incorporated into the MUSIC model. The key measures include (but not limited to) grass swales, bio-retention swales and constructed wetlands.
Model results showed that runoff from the site meets the CSC reduction targets for TSS, TP and TN. Therefore best management practice can be adopted within the constraints of the site to meet the CSC requirements.
PB 2138171B-RPT002-B:ag Page iii

Northeast Business Park Stormwater Management Plan
Water quantity
The development will cause an increase in peak stormwater flows as the level of imperviousness within the development site will increase. The Rational Method was adopted to estimate the increase in peak flows for the sub-catchments within the development. As WSUD practices are being adopted, it is expected that the bio-retention and wetlands will provide the attenuation required. It is difficult to calculate detention requirements until a more detailed layout (street scale) is adopted. Further design stages will need to ensure that sufficient flow attenuation will be provided to limit impacts on the Caboolture River. This will be undertaken in accordance with the Council’s Stormwater Code. However, conservative estimates of the attenuation required are provided for a range of ARI events.
Recommendations
The following recommendations are made:
adoption of best management treatment measures to meet stormwater quality targets
adoption of WSUD practices at the street scale to meet stormwater quantity targets
completion of catchment stormwater plans for each development area that adopt the detailed layout (street scale) and address the stormwater quality and quantity design criteria.
PB 2138171B-RPT002-B:ag Page iv
Northeast Business Park Stormwater Management Plan
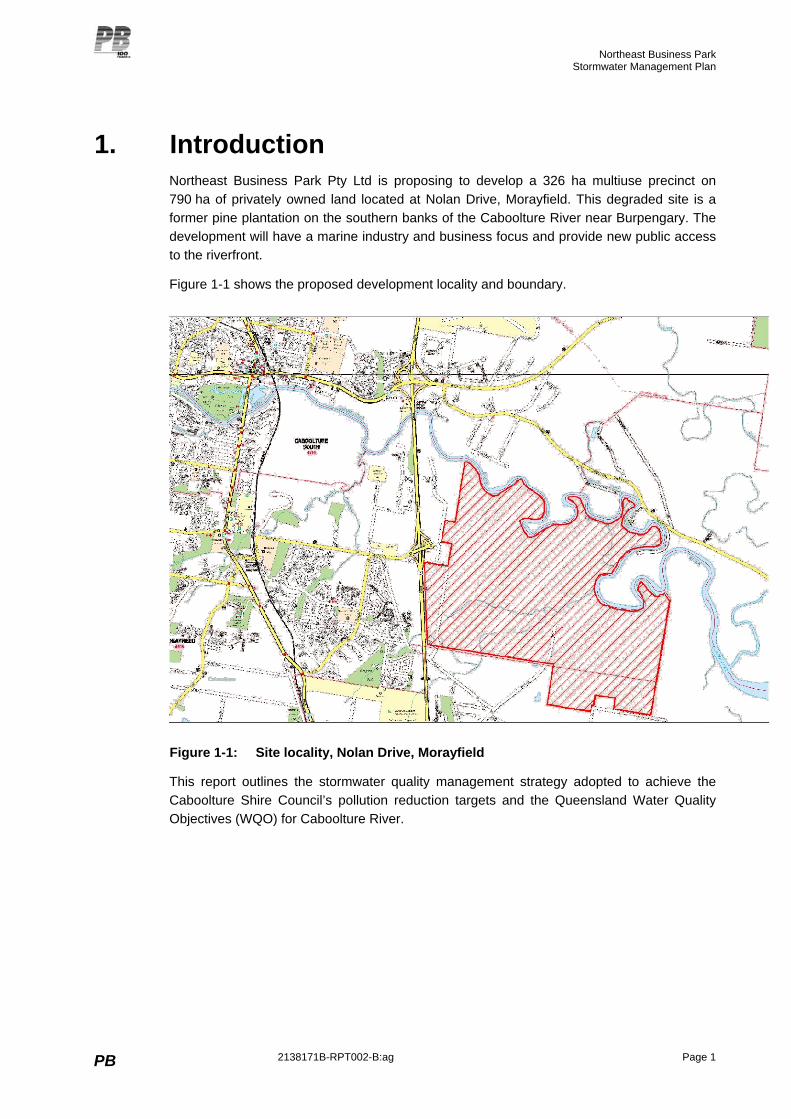
1. Introduction Northeast Business Park Pty Ltd is proposing to develop a 326 ha multiuse precinct on 790 ha of privately owned land located at Nolan Drive, Morayfield. This degraded site is a former pine plantation on the southern banks of the Caboolture River near Burpengary. The development will have a marine industry and business focus and provide new public access to the riverfront.
Figure 1-1 shows the proposed development locality and boundary.
Figure 1-1: Site locality, Nolan Drive, Morayfield
This report outlines the stormwater quality management strategy adopted to achieve the Caboolture Shire Council’s pollution reduction targets and the Queensland Water Quality Objectives (WQO) for Caboolture River.
PB 2138171B-RPT002-B:ag Page 1

Northeast Business Park Stormwater Management Plan
2. Existing environment The proposed development site is located adjacent to the middle estuary of the Caboolture River as shown in Figure 2-1. Large parts of the site are within the Caboolture River floodplain and tidal and freshwater wetlands occur throughout the lower areas of the site. Raft Creek traverses the site along with several natural, unnamed channels and some constructed channels.
Vegetation has been largely cleared from the terrestrial areas. The site was last used as a softwood plantation and prior to that was variously grazed and cropped. Previous crops include sugar cane (4Site Natural Solutions, 2004).
Natural vegetation occurs generally in the low lying areas of the site, including drainage lines, freshwater swamps, tidal creeks and banks of the Caboolture River. Appendix A shows the Ecosystem Constraints Plan (PMM GROUP, 2004) that identifies key vegetation communities.
Soils generally have a sandy loam surface and fall into three categories – red massive, deep yellow massive and deep grey poorly drained soils. They soils vary from well drained to poorly drained and parts of the site have been identified as being subject to potential actual acid sulfate soils (4Site Natural Solutions, 2004). This is discussed in further detail in the Geological Report undertaken by J.E. Siemon (September 2005).
2.1 Topography and drainage characteristics The site slopes north-east from the Bruce Highway towards the Caboolture River which forms the northern site boundary. Ground levels vary between sea level and 5 m Australian Height Datum (AHD) and small hills rise up to 14.0 m and 17.5 m AHD along the southern and western boundaries.
Raft Creek enters the site approximately 600 m to the east of the south-western site corner and flows in a northeast direction towards the Caboolture River (4Site Natural Solutions, 2004). The largest constructed channel traverses through the site in an east-northeast direction from the western border.
Stormwater runoff generally flows to the waterways on site where it is directed to the Caboolture River via natural drainage paths. Significant catchment areas external to the development boundary generate overland stormwater flows that enter Caboolture River via the development site. Due to the relatively flat topography, low lying areas on the southern part of the site are poorly drained with minor ponding of water occurring after significant rainfall events (4Site Natural Solutions, 2004).
Low lying areas adjacent to the Caboolture River are inundated during high tides. This has been highlighted by the presence of marine vegetation within these areas which consists of tidal mangroves and salt marsh communities.
PB 2138171B-RPT002-B:ag Page 2

Northeast Business Park Stormwater Management Plan
2.2 Catchments The development site is at the downstream end of a larger catchment that is approximately 2554 ha.
The external catchment is comprised of undeveloped, previously agricultural land with residential areas of minor impervious surfaces comprising of residential buildings, pavements and roads. It is expected that minimal water quality treatment exists for the external catchments and therefore is expected that the water quality flowing through the proposed developed site is fairly poor. The extents of the external catchments are shown in Figure 2-1.
Figure 2-1: Catchment plan showing external catchment boundaries
PB 2138171B-RPT002-B:ag Page 3

Northeast Business Park Stormwater Management Plan
3. Development scenario The proposed development is based on the cut and fill diagram provided by Northeast Business Park Pty Ltd. (Appendix B - Drawing 0304 SK36, issue SD04, dated 30 July 2007 Ref 20430-10D).
Figure 3-1 shows the developable land and marina basin. As can be seen there is an increase in the developed land and therefore a potential increase in stormwater runoff from impervious areas. Stormwater quality may also be affected by the proposed land uses.
Therefore, adoption of this stormwater management plan is essential to maintain, and potentially improve, the existing, undeveloped levels of stormwater quantity and quality within the development site.
Flooding is addressed in a separate report (2138171B-RPT001-A:ag).
Figure 3-1: Schematic of proposed development
PB 2138171B-RPT002-B:ag Page 4

Northeast Business Park Stormwater Management Plan
4. Environmental values and water quality / quantity objectives
4.1 Background Caboolture is experiencing rapid urbanisation. As a result increased stormwater and sewage discharges have boosted the sediment and nutrient loads flowing into the Caboolture River. The city of Caboolture sources its water supply from the Caboolture River, extracting from just upstream of the Caboolture weir, which is below the main population area. Sewage is discharged upstream of the Bruce Highway Bridge. There are limited flows in the river and there is very little flushing of nutrients. The nutrients tend to accumulate leading to algal blooms.
Therefore compliance with the provisions made in Caboolture Shire Council’s Stormwater Code (Division 19, CSC Shire Plan) is warranted such that the existing conditions of the Caboolture River are not worsened by any development proposal.
4.2 Water quality in the Caboolture River The 4Site Solutions Information Request Response document (2004) presents water quality data obtained from Caboolture Shire Council’s Environmental Monitoring Program for five sites within the section of the Caboolture River adjacent to the site. This data indicates that overall water quality of the Caboolture River adjacent to the site is poor. This is primarily a result of a combination of poor concentrations of dissolved oxygen, turbidity and nutrients. Monitoring was undertaken between October 2000 and September 2001 and relates well with the Healthy Waterways Report Card for 2001.
The SEQ Environmental Health Monitoring Program produced a 2006 Report Card for Caboolture River (Estuarine) with a grading of D. The main conclusions of the water quality were:
increased concentrations of nutrients in the middle and upper reaches compared to 2005
turbidity generally low throughout
degraded bank and riparian habitats
some nutrient processing.
Previous years’ results include:
2001: C
2002: C
2003: C-
2004: C-
2005: D+.
PB 2138171B-RPT002-B:ag Page 5

Northeast Business Park Stormwater Management Plan
4.3 Water quality values and objectives
4.3.1 Background
A number of water quality studies and reports have been completed for the Caboolture River and Pumicestone Region catchments and receiving waters. The studies include broad catchment scale assessments and the identification of various environmental values and WQO. WQO’s are measurable yardsticks that need to be achieved to maintain or restore the selected environmental objectives (See Environmental Protection (Water) Policy 1997, Caboolture River – Environmental values and water quality objectives, March 2007).
The five documents referenced in this study include:
South East Queensland Regional Water Quality Management Strategy – Volume 3 Moreton Bay Catchment Region, Healthy Water Ways, 2001
Queensland Water Quality Guidelines 2006, Queensland Government, 2006
Caboolture River – Environmental values and water quality objectives, Environmental Protection Agency, 2007
Caboolture Shire Plan – Part 7, Division 19 Stormwater, Caboolture Shire, 2005
Guidelines on Identifying and Applying Water Quality Objectives in Brisbane City, Brisbane City Council, 2000.
A previous report completed for Lensworth Group Pty Ltd for the proposed development titled ‘Caboolture Waters: Waterways, Soils and Water Quality Management’ (4Site Natural Solutions, 2004) was also referenced for preliminary water management issues and considerations.
4.3.2 South East Queensland Regional Water Quality Management Strategy
The South East Queensland Regional Water Quality Management Strategy (SEQRWQMS) is the first integrated water quality planning document for the protection and restoration of south-east Queensland waterways and catchments. The Strategy forms part of the South East Queensland Regional Framework for Growth Management (RFGM).
Riparian and stormwater management
The Strategy outlines riparian priority areas, actions and equity principles. Priority actions specifically for ‘developing urban areas’ are detailed in the strategy for stormwater management. Principles include:
1. use “soft” engineering approaches, such as retention of natural waterways and water sensitive urban design
2. use best land use management practices
3. use additional “hard” engineering approaches, such as Stormwater Quality Improvement Devices (SQIDs), where warranted.
This Stormwater Quality Management Plan has adopted the principles of SEQRWQMS.
PB 2138171B-RPT002-B:ag Page 6

Northeast Business Park Stormwater Management Plan
4.3.3 Queensland Water Quality Guidelines and Caboolture River Environmental Values and Water Quality Objectives
The principal legislative basis for water quality management in Queensland is the Environmental Protection (Water) Policy 2007 (EPP Water), which embodies the principles for the National Water Quality Management Strategy. The EPP Water includes a process for determining environmental values (EVs) (or uses) of waterways and corresponding WQOs for different indicators of water quality such as pH, nutrients and toxicants. Protecting or achieving the identified WQOs for a waterway means the corresponding environmental values and uses of that waterway will be protected.
The Queensland Water Quality Guidelines (QWQG) was adopted after the need was identified in the ANZECC Guidelines for more specific and locally relevant guidelines that apply to local environmental conditions. Main purposes of the QWQG are:
to provide guideline values that are tailored to Queensland regions and water types
to provide a framework for deriving local guidelines for waters in Queensland.
Environmental values
The EPP Water Policy has been used to identify the environmental values for the Caboolture River. These environmental values are used to determine the WQOs relevant to the development site. They are based on the importance of protecting the environmental values as determined by local stakeholders. Under the EPP Water Policy all environmental values require protection; the ratings indicate the preference by local stakeholders. The values that are relevant to the tidal estuary include:
high value: secondary recreation, visual recreation, cultural heritage, aquaculture, drinking water
moderate to high: human consumer
moderate value: aquatic ecosystem, wildlife habitat, irrigation, stock water, farm supply, oystering
low value: primary recreation, industrial use.
Water quality objectives – operational phase
The proposed development land uses are primarily made up of industrial, commercial and residential land uses. The potential pollutants expected in stormwater runoff from the site are referred to in Table 4-1 (4Site Natural Solutions, 2004) together with the relevant WQOs for Caboolture River based on the QWQG and the “Caboolture River Environmental Values and Water Quality Objectives” report (EPA, 2007). Mid-estuary objectives are adopted as the site is draining into the Caboolture River.
PB 2138171B-RPT002-B:ag Page 7

Northeast Business Park Stormwater Management Plan
Table 4-1: Water quality objectives for aquatic ecosystems – mid estuary
Indicator WQO Environmental Value
Suspended solids median < 20 mg/L Primary contact recreation
Total Phosphorous median 0.025 mg/L Aquatic ecosystem
Total Nitrogen median 0.30 mg/L Aquatic ecosystem
Chlorophyll ‘a’ median < 4 µg/L Aquatic ecosystem
Dissolved Oxygen Between 85-100 % saturation over a 24 hour period
Aquatic ecosystem
pH Between 7.0 – 8.4 Primary contact recreation
Chemical contaminants Free from chemicals or pollutants that are either toxic to humans, animals, plants and other organisms or irritating to the skin or mucus membranes
Refer to ANZECC (1992) guidelines for chemical contaminants and tainting substances.
Aquatic ecosystem, Primary contact recreation.
Aquatic Foods (cooked)
Surface films and debris
Oils and petrochemical films should not be noticeable as a visible film nor detected by odour.
Free from floating debris and litter.
Aquatic ecosystem
Primary contact recreation
Faecal coliforms 1,000cfu/100 mL
Primary contact recreation
Aquaculture
Turbidity < 8 NTU Primary contact recreation
Current WQOs for litter, hydrocarbons, heavy metals and faecal coliforms are not comparable with the output of current best practice models. Until more appropriate WQOs are available for these pollutants, the maximum possible reduction in litter, faecal coliforms, hydrocarbons and heavy metals must be achieved, given site topography and other constraints. Construction WQOs
During the construction phase of the project, measures to minimise erosion and control sediment export from the site will be implemented. The measures will be designed using the Institution of Engineers Soil Erosion and Sediment Control Guidelines.
A detailed erosion and sediment control (ESC) plan will be produced before the construction phase of development to meet the above WQOs. The plan will address the following items:
an assessment or erosion hazard, considering soils, topography, climate, timing and type of development
plans showing existing and final site contours
plans showing temporary and final drainage works
plans showing all earthworks, including all roads, re-grading and areas of cut and fill
plans showing location and type of all ESC treatment measures
PB 2138171B-RPT002-B:ag Page 8
Northeast Business Park Stormwater Management Plan
plans showing diversions drains and bund to divert “clean” runoff around areas of disturbance
revegetation and rehabilitation program for the site
maintenance program for all ESC treatment measures
details of construction methods, schedule and sequence for all ESC treatment measures.
4.3.4 Caboolture Shire Council desired mean annual load reductions
The Caboolture Shire Plan Stormwater Code (December 2005) gives specific outcomes required for water quality control in the Caboolture region. Specific outcomes of the Stormwater code (SO4) states:
The total effect of permanent water quality control measures [should] achieve reductions in the mean annual load generated by the development site at a minimum of:
a) 80% for Suspended Sediment
b) 45% for Total Phosphorus
c) 45% for Total Nitrogen
The code notes that ‘should the overall effectiveness of the optimal treatment train for the development catchment not meet mean annual load reduction targets then specific concentrations as defined by local water quality or Brisbane City Council Water Quality Guidelines should be used as the water quality objective for stormwater discharging from development sites’ (Stormwater Code – Caboolture Shire Plan, 2005).
4.3.5 Water sensitive urban design – design objectives for urban stormwater management (Healthy Waterways – Draft Implementation Guideline No. 7)
The Draft Implementation Guideline is currently under consideration by the Office of Urban Management in consultation with several South East Queensland councils and working groups. Caboolture Shire Council is noted in this list.
The document adopts a total water cycle management approach as the framework for managing urban water quality in SEQ. This approach endorses water sensitive design and is supported by State legislation.
The purpose of the draft document is to ‘put forward a series of design objectives for use in the best practice management or operational urban stormwater quality and quantity across SEQ, as part of an overall WSUD approach’. The following extract detailed the stormwater quality design objectives:
80% reduction in total suspended solids
60% reduction in total phosphorous
45% reduction in total nitrogen
90% reduction in gross pollutants
PB 2138171B-RPT002-B:ag Page 9
Northeast Business Park Stormwater Management Plan
4.3.6 Adopted water quality objectives
The mean annual load reduction targets, as defined by the Caboolture Shire Plan are used as the benchmark for stormwater treatment design for this conceptual Stormwater Management Plan. However additional criteria, such as the best practice guidelines noted in the Healthy Waterways guidance, are used as this is the most up-to-date guidance in relation to urban stormwater management. Therefore, the following reduction targets are adopted as water quality objectives for this development:
80% reduction in total suspended solids
60% reduction in total phosphorous
45% reduction in total nitrogen
90% reduction in gross pollutants.
“The application of WSUD principles through best management practices are a practical means of significantly contributing to the protection and achievement of Environmental Values and Water Quality Objectives in South East Queensland waterways and Moreton Bay” (Healthy Waterways, 2007).
Therefore the median pollutant concentrations as detailed in the EPP Water are not used as an assessment benchmark in this report as they will be achieved through the principles of WSUD.
4.4 Water quantity objectives
4.4.1 Caboolture Shire Council Shire Plan
The Caboolture Shire Plan Stormwater Code (December 2005) gives specific outcomes required for water quantity control in the Caboolture region. Specific outcomes of the Stormwater code (SO14) states:
Stormwater discharge is disposed of adequately and achieves the following:
no worsening of downstream conditions
no adverse impacts on adjoining or upstream lots
discharge from the site does not cause nuisance to any person, property of premises
any discharge onto downstream properties does not result in an increase in concentration of stormwater
any discharge does not cause erosion.
PB 2138171B-RPT002-B:ag Page 10

Northeast Business Park Stormwater Management Plan
4.4.2 Water sensitive urban design – design objectives for urban stormwater management (Healthy Waterways – Draft Implementation Guideline No. 7)
As discussed in Section 4.3.5 Table 4-2 summarises the design objectives in terms of water quantity outlined in the Healthy Waterways guidance document.
Table 4-2: Design objectives for water quantity
Criterion Design Objective
Frequency flow management Capture and manage the first 15 mm/day of runoff from all impervious surfaces
Waterway stability management Limit the post-development peak one-year Average Recurrence Interval (ARI) event discharge to the receiving waterway to the pre-development peak one-year Average Recurrence Interval (ARI) event discharge.
4.4.3 Adopted water quantity objectives
The Caboolture Shire Plan Stormwater Code is used as the primary guide to achieve water quantity objectives. However, it is acknowledged that the Healthy Waterways guidance will be undertaken during the next design stage as the application of WSUD principles (capturing of runoff and limiting the peak one-year ARI flow) are a practical means of stormwater management. Allowance is made in this report for conceptual design of any post-development structures required for meeting WSUD principles.
PB 2138171B-RPT002-B:ag Page 11

Northeast Business Park Stormwater Management Plan
5. Stormwater management strategy
5.1 General Division 19 of the Draft Caboolture Shire Plan details the Stormwater Code for developments and activities within the Caboolture Shire. The overall outcomes sought for stormwater management as written in the Stormwater Code are:
1. cumulative impacts of discharged water from new development does not adversely affect the quality, environmental values or ecosystem functions of downstream receiving waters
2. contamination of stormwater and the release of pollutants in runoff is prevented
3. the structure and condition of drainage lines and riparian areas is maintained or improved
4. stormwater is managed to minimise the impact of flooding
5. development occurs where the impact of flooding is minimised.
The minimum information required by Caboolture Shire Council includes (4Site Natural Solutions, 2004):
a. the identification of flow paths over the site. Consideration should be given to the principals of water sensitive urban design and the incorporation of natural drainage paths within the ultimate development
b. the characteristics and quality of the area or waterway to which stormwater from this development will be released
c. technologies, structures or practices that will be employed to prevent contamination of stormwater and to mitigate the impact of stormwater discharge at each progressive stage of the proposal, and for the continued occupation of the development.
(Section 6.1 of Information Request, 2002, 4Site Natural Solutions, 2004)
5.2 Framework This stormwater management plan provides the strategic direction at the master plan level. This report outlines the conceptual treatment train that will be adopted throughout the design process in order to meet Caboolture Shire Council’s pollution reduction targets and the water quality objectives.
The stormwater management and reporting strategy adopted for the Northeast Business Park is guided by a framework of management plans. Two levels of management plans have been identified and described in this report.
Master plan (this report) – provides a framework for water quality management and reporting for the entire development site. It identifies the adopted water quality reporting objectives, relevant design constraints and appropriate management strategies for the development site. Water quality modelling is undertaken at the conceptual level, based on appropriate water quality treatment measures for each catchment.
PB 2138171B-RPT002-B:ag Page 12

Northeast Business Park Stormwater Management Plan
Catchment stormwater management plans – developed as part of the initial area development plan for the first stage of development in each catchment. These plans address water quality and quantity management at the catchment level and provide detailed design and modelling of all adopted management measures.
Note that a site based plan may be undertaken that shows exact locations of each treatment element.
5.3 Design criteria The design criteria will be used to provide an outline of the intended nature and form of development for the Northeast Business Park. The design criteria listed in the Design Report (PMM Group, 2004) specific to this stormwater management planning report are listed below.
Water management
Harvesting of roof water for landscaping and other on-site non-potable use opportunities.
Use of water quality treatment measures within site’s street networks and key outlet locations.
Landscaping to support low water demand vegetation and limited maintenance.
Treatment and re-use of non-potable water and water supplies.
Use of water efficient fixtures, fittings and systems.
Vegetation
Rehabilitate disturbed, degraded and un-managed areas.
Use of endemic species to encourage biodiversity.
Maintain buffer distances to waterways and river areas.
Weed control and management.
Open space networks
Contribute a significant portion of land for parkland uses.
Create a corridor of open space along the Caboolture River.
Public access to areas of currently restricted riverfront.
Community benefit.
Potential for partnerships in management of open space areas, facilities, vegetation and waterways.
Incorporate pedestrian, cyclist, recreation, education and history elements of open space areas.
The main theme derived from these design criteria is that the proposed development will feature the protection and enhancement of riparian and wetland vegetation, with a large portion of the site dedicated to protected open space. The overall stormwater management objective is to preserve natural flows to the waterways and incorporate water sensitive urban design and wetland philosophies into the detailed design to achieve these goals.
PB 2138171B-RPT002-B:ag Page 13

Northeast Business Park Stormwater Management Plan
5.3.1 Water sensitive urban design (WSUD)
WSUD is the integration of urban water cycle management with urban planning and design. A key element in WSUD is managing urban stormwater as a resource and for the protection of receiving ecosystems.
The incorporation of WSUD allows the collection and management of stormwater runoff in an efficient, cost effective and environmentally friendly way. The purpose of WSUD is to reduce the quantity, while improving the quality of stormwater runoff to the Caboolture River, thus improving environmental outcomes for the Caboolture River estuary.
Combinations of WSUD elements will be used to form a ‘treatment train’ to effectively manage stormwater quality from a range of different land uses. WSUD elements may include the following (but not limited to).
Swales (incorporating buffer strips) – used to convey stormwater and to remove coarse and medium sediment and are generally part of the overall treatment train to reduce pollutant loads.
Bioretention swales – located at the downstream end of a swale to provide efficient treatment through fine filtration, extended detention treatment and some biological uptake. Particularly efficient at removing nitrogen and other soluble or fine particulate contaminants.
Sedimentation basins – used to retain coarse sediments from runoff and are typically the first element in a treatment train.
Constructed wetlands – shallow, extensively vegetated water bodies that use vegetation enhanced sedimentation, fine filtration and biological pollutant uptake processes to improve stormwater quality.
Treatment ponds and lakes – urban features that can provide a healthy, aesthetic environment. These are generally at the end of the treatment train and require significant pre-treatment to minimise the loading of organic carbon and particulate bound nutrients.
Rainwater tanks
Recent studies by the Gold Coast City Council have indicated that the average water use per allotment is 693 L/ET.day (Pimpama Study, 2003). The same study concluded that rainwater could be used to supplement between 30% of external use only to 90% of all water except kitchen use.
A previous MUSIC modelling study by PB (Tweed Area E, 2003) indicated that rainwater tanks as part of a WSUD system will improve the quality of stormwater slightly, however will not reduce stormwater pollutants to sufficiently meet WQOs without other treatment measures such as wetlands and swales.
Using rainwater tanks on the Northeast Business Park site would reduce the impact of the volume of stormwater runoff (particularly small frequent events), also improving the quality slightly, in particular nitrogen.
WSUD within the streetscapes has proven to be a very effective stormwater management tool in meeting water quality objectives and can be used to increase the aesthetic value of the development.
PB 2138171B-RPT002-B:ag Page 14

Northeast Business Park Stormwater Management Plan
5.4 Best management practice Appendix C provides an explanation of the main pollutants that impact on stormwater quality, the typical sources of the pollutants and identifies the best management WSUD practices for treatment of the pollutants.
5.5 Key design constraints and opportunities The EPA report nutrient trading in Moreton Bay states that ‘reducing pollutant loads in the Caboolture catchment could have a [significant] impact on the health of the Caboolture Estuary as well as Deception Bay. However, to meet water quality objectives, substantial reductions in current pollutant loads will be required. This will be made particularly challenging due to anticipated increases in pollutant loads associated with ongoing development in SE Queensland’ (EPA, 2005).
Ecosystem health within the Ramsar listed Moreton Bay is significantly impacted by poor water quality. There is also poor water quality in several estuaries and catchments that flow into the Bay. The pollutants of greatest concern have been identified as nutrients and sediments.
The location of the development will impact on the sediment and nutrient loads within the Caboolture Estuary. The key constraints for this development to be successful in reducing the pollutant loads to the receiving waters include:
the low lying nature of the site
sensitive ecological areas
limited infiltration capacity of the sub-strata; attenuation of water quality within the subsoils is therefore limited as well (4Site Natural Solutions, 2004).
The developable areas will need to incorporate WSUD elements. The integration of which drive the type of treatment train elements required based on area, slope, and land use. This has the benefit of enhancing the landscape of the site whilst providing essential stormwater treatment measures (quantity and quality).
It is intended that the areas within the floodplain will include areas of constructed wetlands at the downstream end of the treatment train. The underlying factor in the success of this integration is to design wetlands such that they provide dual benefits of reducing stormwater pollutants while not reducing flood conveyance. The following will need to be addressed during detailed design:
flow velocities within the wetlands as well as surrounding the wetlands
flow depth if the wetland will be inundated (0.2 m – 0.5 m)
what flood event will the wetland be protected against
establishment of wetlands after flood event.
PB 2138171B-RPT002-B:ag Page 15

Northeast Business Park Stormwater Management Plan
6. Water quality modelling
6.1 Background PB has used the MUSIC modelling package developed by CRC for Catchment Hydrology (2005 Version 3.01) to estimate the impacts of development and evaluate the relative performance of various management options. The model can be used to generate both pollutant concentrations and long term pollutant loads and is recognised as the most appropriate modelling software for the planning of stormwater treatment measures for urban catchments.
The model can generate pollutants loads and event mean concentrations for Total Suspended Solids (TTS), Total Phosphorous (TP), and Total Nitrogen (TN) and gross pollutants. Other pollutants can be modelled, such as Chlorophyll ‘a’ however long term statistical data on the generation of these pollutants is required.
Model parameters do not currently exist for hydrocarbons, heavy metals and faecal coliforms. These pollutants were qualitatively assessed for the fully developed scenarios using reductions estimated for the proposed stormwater quality controls/treatment measures.
The stormwater management philosophy for the development of the Northeast Business Park is based on treating the stormwater prior to discharge to achieve the reduction targets.
6.2 Available data
6.2.1 Rainfall
Six minute rainfall data was obtained from the Bureau of Meteorology for the period 1989-2004 as shown in Figure 6-1. The period post 1999 was removed from the data set as there were large periods of missing data. Therefore, the time series used in the modelling ranged from 1989 to 1998 as this was the longest period of reliable data. The mean annual rainfall for this 10 year period is 883 mm.
6.2.2 Evaporation
Monthly average areal evapotranspiration data was obtained from the Bureau of Meteorology for the period 1989-2004 as shown in Figure 6-1. As per the rainfall data above, the data set adopted for the modelling was 1989 to 1998. The mean annual evapotranspiration for this period is 1519 mm.
PB 2138171B-RPT002-B:ag Page 16

Northeast Business Park Stormwater Management Plan
Figure 6-1: Rainfall and evaporation data
6.2.3 Model parameters
The modelling parameters for the various land uses within the development (urban, rural, commercial, industrial and undeveloped) were adopted from the Brisbane City Council’s ‘Guidelines for Pollutant Export Modelling in Brisbane Version 7 – Draft’ as referenced in Caboolture Shire Plan Design and Development Manual – Stormwater Code.
The base and storm flow pollutant concentrations adopted in this study are presented in Appendix D and are used as the input data for the stormwater quality modelling. The runoff generation parameters are also contained in Appendix D. These parameters along with the rainfall data determine the runoff generation for each type of land use.
The pervious and impervious fractions of each catchment were derived from the Queensland Urban Drainage Manual (QUDM, 1992) and the BCC Guidelines for Pollutant Export Modelling. The percentage used in MUSIC is an estimation of the effective impervious area that is a percentage of the total impervious area. That is, the impervious area used in MUSIC is a percentage of that used in QUDM. Table 6-1 presents the percentages for each land use from QUDM and the reduction factors applied for MUSIC modelling.
PB 2138171B-RPT002-B:ag Page 17

Northeast Business Park Stormwater Management Plan
Table 6-1: Impervious Area Parameters
Land Use Development Land Uses
Total impervious percentage - QUDM (%)
Reduction percentage – BCC Guidelines (%)
Overall effective impervious percentage adopted (%)
Urban Residential Residential 70 31 22
Urban Residential Multi-residential 80 31 25
Urban Residential Existing Residential 40 55 22
Commercial Business park, commercial
90 50 45
Industrial marine industrial park, hardstand
90 76 68
Agricultural Pre-development 20 55 11
Agricultural Golf Course 20 55 11
Forested Open space 10 0 0
6.3 Modelling approach The study was broken up into six catchments as shown in Figure 6-1. The catchment areas were determined and used together with parameters for undeveloped and developed areas to estimate the existing and developed pollutant loads. Two cases were modelled:
existing conditions within the development boundaries to determine the existing pollutant loads within the development boundary
development conditions with applicable water quality management.
Water quality management options include wetlands in low lying flood plains including swales, bio-retention swales and trash racks using major drainage channels and gullies as swales for flow conveyance into wetlands.
The reduction targets achieved by applying the treatment methods are reported for the development conditions.
The modelling case that includes catchment areas upstream of the development site is not undertaken as the external catchments do not drain into the treatment devices proposed for the development.
6.4 Existing case assessment A stormwater model was developed using MUSIC for existing site conditions based on catchments detailed in Table 6-2. This excludes any external catchments. The catchment break-up is presented in Figure 6-2. The site was divided into six major sub-catchments, with a total area of 794 ha. The existing catchments for the development site are predominantly large areas of pervious surfaces, typically comprising of remnant vegetation occurring in low lying areas including drainage lines, freshwater swamps, tidal creeks and banks of the Caboolture River.
PB 2138171B-RPT002-B:ag Page 18

Northeast Business Park Stormwater Management Plan
Table 6-2: Major catchment areas and land use, existing site conditions
Catchment Total Area (ha) Open Space (ha)
A 52.9 52.9
B 104.3 104.3
C 457.7 457.7
D 97.8 97.8
E 54.1 54.1
F 26.8 26.8
Total 794 794
Figure 6-2: Catchment boundaries – existing conditions, development site only
Note that the adopted existing catchment land use is agriculture. Adopted BCC MUSIC parameters are provided in Appendix D.
Table 6-3 shows the mean annual pollutant loads for existing site conditions at the downstream boundary of each catchment. The total mean annual load discharged to Caboolture River is also shown. The results in the table are considered the background pollutant loads for this study and are representative of the mean annual pollutant loads for the development catchment.
PB 2138171B-RPT002-B:ag Page 19

Northeast Business Park Stormwater Management Plan
Table 6-3: Mean annual pollutant loads – Undeveloped case
Catchment ID Mean Annual Loads A B C D E F Total
Flow (ML/yr) 135 267 1170 251 138 68.6 2030
Total Suspended Solids (kg/yr) 26300 50500 225000 49700 25700 13200 390000
Total Phosphorous (kg/yr) 71.9 139 609 133 70.5 36.8 1060
Total Nitrogen (kg/yr) 504 978 4240 922 509 257 7410
Gross Pollutant (kg/yr) 2320 4590 20100 4300 2380 1180 34900
6.5 Post development conditions assessment The existing catchments were adjusted to reflect post development drainage (see Appendix B). Table 6-4 presents the catchment break up for the post development case and exclude the external catchments. There is an extra catchment due to the proposed break up (see Figure 6-3) where the developed land form changes the drainage paths. This effectively means that the marina and the immediate land uses around the marina become one catchment. Consequently the downstream boundaries for each catchment have also changed. The discharge location for catchments D and E form one point of discharge and include the commercial and marine industry land uses within Catchment M. Catchments A and F are undeveloped and therefore remain consistent with the pre-development scenario.
Also shown in Table 6-4 are the node names for cross referencing to Figure 6-4.
PB 2138171B-RPT002-B:ag Page 20

Northeast Business Park Stormwater Management Plan
Figure 6-3: Catchment boundaries – Developed conditions
PB 2138171B-RPT002-B:ag Page 21

Northeast Business Park Stormwater Management Plan
Table 6-4: Catchment areas and land use, development site conditions
Catchment ID Land use in hectares
(Node name) A B C D E F M
Total area 52.9 104.3 457.7 48.5 55.9 26.8 47.6
Open space - - 2.67
(C4)
- - - -
Business park - 57.6
(B2)
93.0
(C1)
- - - -
Marine Industrial Park
- - 26.5
(C3 & C6)
- - - -
Commercial - - 5.8
(C7)
- - - 2.0
(M1)
Marina Basin - - - - - - 28.7
(M3)
Multi-residential - - 6.4
(C8 & C9)
6.4
(D1 & D3)
8.0
(E1, E3 & E4)
- 6.5
(M2)
Residential - - 78.3
(C2)
30.3
(D2)
7.8
(E2)
- -
Existing land (Agriculture)
52.9 46.7
(B1)
129.1 (C10)
- 24.4
(E6)
26.8 10.5
(M4)
Golf Course (agriculture)
- - 116.0
(C5)
11.8
(D4)
15.6
(E5)
- -
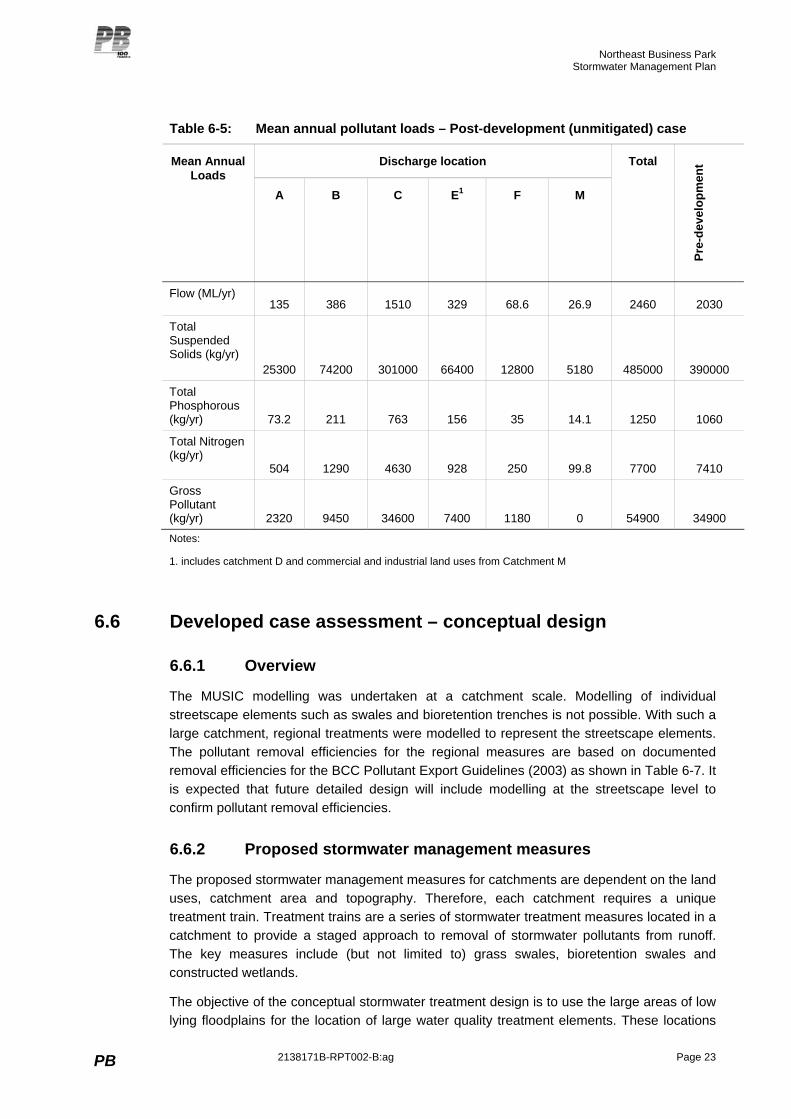
The marine basin was included in the ‘no-mitigation’ (no treatment measures) model configuration because it is already a part of the proposed development. The marine basin is modelled as a sedimentation basin with a large 100 m wide outlet to more accurately reflect the true characteristics of the marina. The MUSIC model was run using the BCC MUSIC parameters applicable to the developed catchment land use. The results in Table 6-5 show that the mean annual pollutant loads have increased for developed site conditions.
Comparing the total for all catchments with the pre-development totals there is a significant increase in the pollutant loads for all pollutants due to the significant increase in impervious areas and changes in land use types. Mitigation measures need to be incorporated in to the development site conditions to comply with the CSC reduction targets for TSS, TP and TN.
PB 2138171B-RPT002-B:ag Page 22
Northeast Business Park Stormwater Management Plan
Table 6-5: Mean annual pollutant loads – Post-development (unmitigated) case
Discharge location Mean Annual Loads
A B C E1 F M
Total
Pre-
deve
lopm
ent
Flow (ML/yr) 135 386 1510 329 68.6 26.9 2460 2030
Total Suspended Solids (kg/yr)
25300 74200 301000 66400 12800 5180 485000 390000
Total Phosphorous (kg/yr) 73.2 211 763 156 35 14.1 1250 1060
Total Nitrogen (kg/yr)
504 1290 4630 928 250 99.8 7700 7410
Gross Pollutant (kg/yr) 2320 9450 34600 7400 1180 0 54900 34900 Notes:
1. includes catchment D and commercial and industrial land uses from Catchment M
6.6 Developed case assessment – conceptual design
6.6.1 Overview
The MUSIC modelling was undertaken at a catchment scale. Modelling of individual streetscape elements such as swales and bioretention trenches is not possible. With such a large catchment, regional treatments were modelled to represent the streetscape elements. The pollutant removal efficiencies for the regional measures are based on documented removal efficiencies for the BCC Pollutant Export Guidelines (2003) as shown in Table 6-7. It is expected that future detailed design will include modelling at the streetscape level to confirm pollutant removal efficiencies.
6.6.2 Proposed stormwater management measures
The proposed stormwater management measures for catchments are dependent on the land uses, catchment area and topography. Therefore, each catchment requires a unique treatment train. Treatment trains are a series of stormwater treatment measures located in a catchment to provide a staged approach to removal of stormwater pollutants from runoff. The key measures include (but not limited to) grass swales, bioretention swales and constructed wetlands.
The objective of the conceptual stormwater treatment design is to use the large areas of low lying floodplains for the location of large water quality treatment elements. These locations
PB 2138171B-RPT002-B:ag Page 23

Northeast Business Park Stormwater Management Plan
PB 2138171B-RPT002-B:ag Page 24
will need to be finalised in detailed design to ensure that they are suitably separate from the site’s ecologically sensitive areas highlighted in previous studies.
The following outlines the treatment measures incorporated into this conceptual design.
Swales (incorporating buffer strips) are used to convey stormwater and to remove coarse and medium sediment. They are included in most treatment trains to reduce pollutant loads. Swales can be incorporated into urban designs along streets, (within the median strip or footpaths), in parklands and between allotments where maintenance access can be preserved. Swales are typically at the upstream end of the treatment train.
Bio-retention swales are located at the downstream end of a swale to provide efficient treatment through fine filtration, extended detention treatment and some biological uptake. They are particularly efficient at removing nitrogen and other soluble or fine particulate contaminants. They also provide conveyance.
Constructed wetlands are shallow, extensively vegetated water bodies that use vegetation enhanced sedimentation, fine filtration and biological pollutant uptake processes to improve stormwater quality.
The treatment trains adopted for each catchment for post development (mitigated) conditions are presented in Table 6-6. These are conceptual treatment trains and are not absolute.
Table 6-6: Representative treatment trains for each catchment
Treatment Element
Catchment B
Catchment C Catchment E1 Catchment M
Grass swales
Bio-retention
Constructed wetlands
-
Notes:
1. includes catchment D and commercial and industrial land uses from Catchment M
Catchments A, F and M do not require any treatment elements as no development occurs within these areas.
Catchments B, C and E require a number of treatment elements due to the large increase in impervious area and change in land use. The initial treatment for all land uses is a grass swale. The swales drain via bioretention then into constructed wetlands. Discharge into the Caboolture River from the wetland is expected to meet the adopted stormwater targets.
The conceptual design is presented in Figure 6-4. The node names can be cross referenced with Table 6-4.

Northeast Business Park Stormwater Management Plan
PB 2138171B-RPT002-B:ag Page 25
Figure 6-4: Conceptual design of treatment trains – Developed conditions
Northeast Business Park Stormwater Management Plan
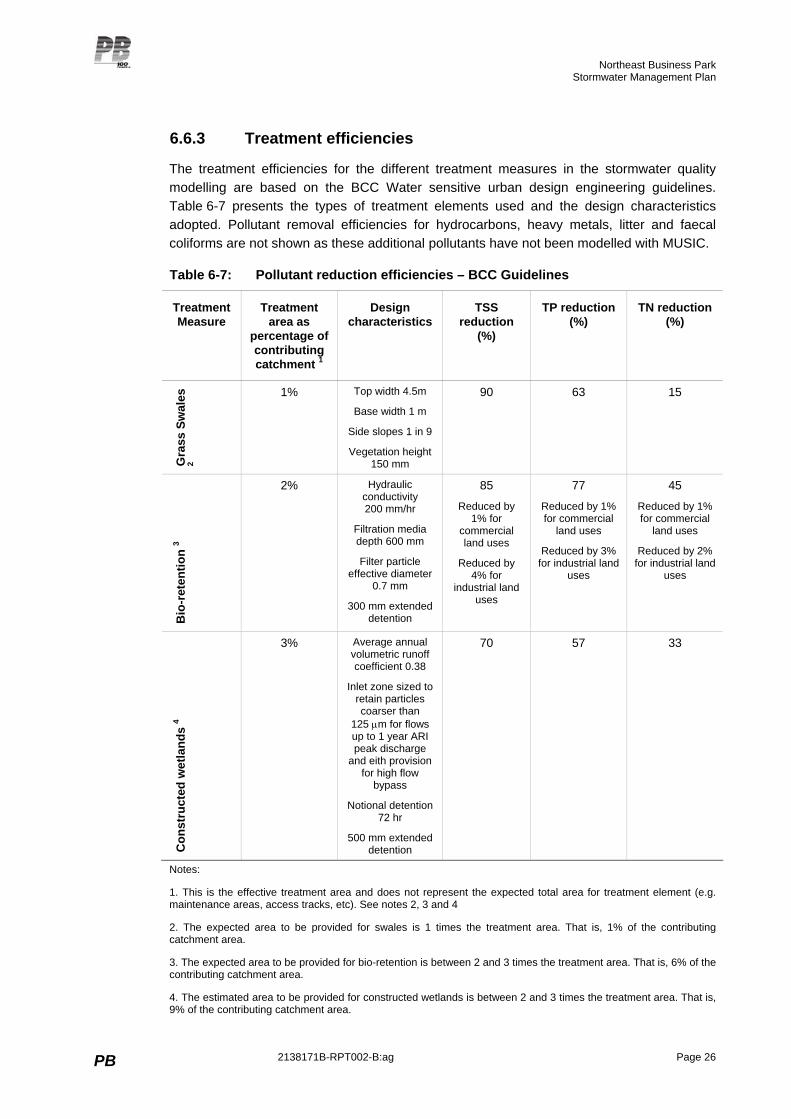
6.6.3 Treatment efficiencies
The treatment efficiencies for the different treatment measures in the stormwater quality modelling are based on the BCC Water sensitive urban design engineering guidelines. Table 6-7 presents the types of treatment elements used and the design characteristics adopted. Pollutant removal efficiencies for hydrocarbons, heavy metals, litter and faecal coliforms are not shown as these additional pollutants have not been modelled with MUSIC.
Table 6-7: Pollutant reduction efficiencies – BCC Guidelines
Treatment Measure
Treatment area as
percentage of contributing catchment 1
Design characteristics
TSS reduction
(%)
TP reduction (%)
TN reduction (%)
Gra
ss S
wal
es
2
1% Top width 4.5m
Base width 1 m
Side slopes 1 in 9
Vegetation height 150 mm
90 63 15
Bio
-ret
entio
n 3
2% Hydraulic conductivity 200 mm/hr
Filtration media depth 600 mm
Filter particle effective diameter
0.7 mm
300 mm extended detention
85
Reduced by 1% for
commercial land uses
Reduced by 4% for
industrial land uses
77
Reduced by 1% for commercial
land uses
Reduced by 3% for industrial land
uses
45
Reduced by 1% for commercial
land uses
Reduced by 2% for industrial land
uses
Con
stru
cted
wet
land
s 4
3% Average annual volumetric runoff coefficient 0.38
Inlet zone sized to retain particles coarser than
125 μm for flows up to 1 year ARI peak discharge
and eith provision for high flow
bypass
Notional detention 72 hr
500 mm extended detention
70 57 33
Notes:
1. This is the effective treatment area and does not represent the expected total area for treatment element (e.g. maintenance areas, access tracks, etc). See notes 2, 3 and 4
2. The expected area to be provided for swales is 1 times the treatment area. That is, 1% of the contributing catchment area.
3. The expected area to be provided for bio-retention is between 2 and 3 times the treatment area. That is, 6% of the contributing catchment area.
4. The estimated area to be provided for constructed wetlands is between 2 and 3 times the treatment area. That is, 9% of the contributing catchment area.
PB 2138171B-RPT002-B:ag Page 26

Northeast Business Park Stormwater Management Plan
6.6.4 Pollutant modelling results
The MUSIC model was developed using the above pollutant removal efficiencies for the adopted treatment trains as per Figure 6-3. The mean annual pollutant loads from the conceptual treatment trains are shown in Table 6-8.
Table 6-8: Mean annual pollutant loads – Post-development (mitigation) case
Mean Annual Loads
A B C E 1 F M Total
Un-
miti
gate
d ca
se re
sults
Flow (ML/yr) 135 386 1510 329 68.6 26.9 2460 2460
Total Suspended
Solids (kg/yr) 25800 7520 20000 13100 13100 5130 84600 485000
Total Phosphorous
(kg/yr) 72.3e 35.5 97.4 40.4 36.5 13.8 296 1250
Total Nitrogen (kg/yr)
492 557 1900 463 250 101 3770 7700
Gross Pollutant (kg/yr)
2320 0.691 14.1 1070 1180 0 4590 54900 Notes:
1. includes catchment D and commercial and industrial land uses from Catchment M
There is a decrease in all mean annual pollutant loads when compared to the post development (unmitigated) case. Table 6-9 presents the reduction percentages for TSS, TN and TP.
Table 6-9: Reduction of mean annual pollutant loads – Post-development (mitigation) case
Reduction percentages
Reduction Target
B C E 1 Total
Total Suspended Solids
80 % 90% 93% 80% 83%
Total Phosphorous
60 % 83% 87% 74% 76%
Total Nitrogen 45 % 57% 59% 50% 51% Notes:
1. includes catchment D and commercial and industrial land uses from Catchment M
Reduction in mean annual loads for Catchment B, C and E are due to the stormwater treatment elements of swales, bio-retention and constructed wetlands from the developed areas.
PB 2138171B-RPT002-B:ag Page 27

Northeast Business Park Stormwater Management Plan
Catchment M (marina basin) has no reduction percentages and therefore not reported as there are no developed land sections draining into the marina basin. The surrounding development is diverted through Catchment D and then E. Therefore these results are acceptable. This is also the case for Catchments A and F where no development occurs.
The reduction targets are met for the mitigated modelled case by applying best practice management philosophies through the adoption of WSUD principles. Specific information such as road drainage paths and land contours can be used to determine actual size and shape of treatment elements for the optimal pollutant reduction when detailed design is being undertaken. However, the treatment elements in this conceptual design have a nominal area given as a percentage of contributing catchment area. Table 6-10 summarises the requirements based on these percentages. The overall land requirement of 91.4 ha is approximately 11% of the total development area.
Table 6-10: Land requirements of treatment elements
Treatment Node Contributing catchment (ha)
Treatment area (ha) Expected area required (ha) 1
1% Swale (B) 57.57 0.58 0.58
2% Bio-retention (B) 57.57 1.14 3.42
3% Wetland (B) 104.31 3.13 9.39
1% Swale (C1) 117.2 1.17 1.17
1% Swale (C2) 194.24 1.94 1.94
1% Swale (C3) 17.14 0.17 0.17
2% Bio-retention (B) 328.58 6.57 19.71
3% Wetland (B) 457.66 13.73 41.19
1% Swale (M) 8.42 0.08 0.08
1% Swale (D) 36.66 0.36 0.36
1% Swale (E) 15.84 0.16 0.16
2% Bio-retention (E) 88.33 1.76 5.28
3% Wetland (E) 88.33 2.65 7.95
Totals - 33.44 91.4
Notes:
1. The expected area to be provided for swales is 1 times the treatment area. That is, 1% of the contributing catchment area. The expected area to be provided for bio-retention is between 2 and 3 times the treatment area. That is, 6% of the contributing catchment area. The estimated area to be provided for constructed wetlands is between 2 and 3 times the treatment area. That is, 9% of the contributing catchment area.
PB 2138171B-RPT002-B:ag Page 28

Northeast Business Park Stormwater Management Plan
6.7 Additional pollutants Table 6-10 shows the estimated removal rates for hydrocarbons, faecal coliforms and heavy metals based on BCC guidelines. These removal rates are considered acceptable.
Table 6-11: Applied pollutant reduction efficiencies
Treatment Element Hydrocarbons Pathogens Heavy Metals
Grass swales 20% 40% 40%
Bio-retention 40% 40% 50%
Constructed wetlands 40% 40% 63%
Treatment measure removal effectiveness can be estimated for other pollutants by the following equation.
Total pollutant removal = 1 - (1- BMP 1 eff) x (1 - BMP 2 eff) x … x (1 – BMP n eff)
where:
BMP = Best management practice
n = number of different treatment elements in treatment train
The pollutant reduction efficiencies were applied and the following reductions were achieved based on the treatment trains for each catchment:
faecal coliforms – 78%
hydrocarbons – 71%
heavy metals – 89%.
These reduction efficiencies appear very high and may be optimistic. However, the results shows that the gross pollutants (litter) entering the Caboolture River, fish habitat reserve and marine park are substantially reduced, having a significantly positive impact on the ecosystem.
6.8 Comment on water quality objectives This conceptual stormwater management plan does not report against the water quality objectives as outlined in the EPP Water as the adopted water quality targets are based on pollutant load reductions rather than achieving median pollutant concentrations. The modelling methodology is based on achieving reduction targets as adopted from the WSUD Engineering Guidelines rather than achieving median pollutant concentrations. By adopting best practice WSUD principles and achieving the reduction targets (as shown above), the requirements of Caboolture Shire Council are met.
PB 2138171B-RPT002-B:ag Page 29

Northeast Business Park Stormwater Management Plan
7. Water quantity
7.1 Estimation of peak flows It is expected that the development of the site will increase stormwater runoff volumes and peak flows as the level of imperviousness will increase.
The Queensland Urban Drainage Manual (QUDM) was used to estimate the peak discharge for a range of ARI events for the main flow paths within the development by accounting for the catchment area, peak rainfall intensity and land use characteristics.
The Rational Method is described in Australian Rainfall and Runoff (1987), Australia 1987 (AR&R), and Queensland Urban Drainage Manual (1992). The key parameters are:
Coefficient of runoff
The coefficient of runoff was calculated using QUDM and the relevant development category and fraction impervious.
Time of concentration tc (sec)
The time of concentration was calculated using the Bransby Williams equation sourced from the Queensland Urban Drainage Manual (1992), where L (km) is length of the main stream, A (km2) catchment area, and S (m/m) slope of the catchment. This equation produced a time of concentration for the selected catchment.
It is expected that the developed catchment would have a different time of concentration than the existing catchment. It is assumed that the developed catchment time of concentration would consist of overland flow, some pipe flow and vegetated swale flow.
Time of concentration calculations are shown in Table 7-1.
Average rainfall intensity (mm/s)
The rainfall intensity is based on the time of concentration for the various ARI storm events. An Intensity Frequency Duration (IFD) table was generated for the Caboolture area based on the Australian Rainfall and Runoff Manual (1987).
7.1.1 Peak flows
Table 7-1 shows the comparison between existing and proposed peak flows for a range of ARI events for each reporting sub-catchment. The pre-development flows are noted as Qo (Peak outflow) and the post development flows are notes as Qi (Peak inflow). Storage requirements were calculated as per QUDM and the average of all four methods (see section 6.06.1 of QUDM) that determine the storage requirements is reported. The maximum storage requirement is less 1% of total development site.
PB 2138171B-RPT002-B:ag Page 30

Northeast Business Park Stormwater Management Plan
Table 7-1: Pre- and post-development peak flows
ARI event 1 2 5 10 20 50 100
Catchment B
Qi = Peak Inflow (m3/s)
6.60 9.14 13.35 16.13 19.87 26.17 30.98
Qo = Peak Outflow (m3/s)
3.90 5.41 7.92 9.59 11.83 15.61 18.50
Average required storage volume (m3)
10943 14225 18468 21138 24718 29630 33539
Catchment C
Qi = Peak Inflow (m3/s)
14.47 20.07 29.44 35.68 44.03 58.15 68.96
Qo = Peak Outflow (m3/s)
13.42 18.62 27.31 33.11 40.86 53.96 63.99
Average required storage volume (m3)
9069 11839 15539 17892 21030 25359 28822
Catchment E
Qi = Peak Inflow (m3/s)
4.80 6.65 9.75 11.80 14.56 19.21 22.77
Qo = Peak Outflow (m3/s)
4.25 5.89 8.63 10.46 12.90 17.02 20.18
Average required storage volume (m3)
3552 4630 6052 6953 8157 9815 11139
Overall, Table 7-1 shows that the peak flows generated from the proposed site will result in increased peak flows when compared to the runoff from the existing site.
During detailed design the attenuation of these flows will be addressed and targets agreed to with Caboolture Shire Council. As WSUD practices are being adopted at the street scale, it is expected that the bio-retention and wetlands will provide the attenuation required. It is difficult to calculate detention requirements until a more detailed layout (street scale) is adopted. Further design stages will need to ensure that sufficient flow attenuation will be provided to limit impacts on the Caboolture River. This will be undertaken in accordance with the Council’s Stormwater Code.
PB 2138171B-RPT002-B:ag Page 31

Northeast Business Park Stormwater Management Plan
8. Cost estimate Cost estimates for the stormwater treatment elements as detailed in Table 6-10 are provided below. The costs are based on published data as referred to in the User Guide to MUSIC, prepared by the MUSIC Development Team (eWater CRC, 2005). This information provides guidance on costs associated with constructing the stormwater treatment devices. No maintenance costs are provided.
The costs are based on the following ‘rules-of thumb’:
Swales: construction cost between $100 and $120 per m2 (adopt higher value)
Bio-retention: construction costs between $125 and $150 per m2 (adopt higher value)
Constructed wetlands: construction costs between $65 per m2 and $100 per m2 (adopt higher value).
Based on these costs the construction costs for all treatment devices are:
Swales $5,352,000
Bio-retention $14,205,000
Wetlands $19,510,000
Therefore the total cost estimate for construction of the stormwater management for this development is estimated at $40m.
PB 2138171B-RPT002-B:ag Page 32

Northeast Business Park Stormwater Management Plan
9. Conclusions and recommendations Northeast Business Park Pty Ltd is proposing to develop a 326 ha multiuse precinct on 790 ha of privately owned land located at Nolan Drive, Morayfield. This degraded site is a former pine plantation on the southern banks of the Caboolture River near Burpengary. The development will have a marine industry and business focus and provide new public access to the riverfront.
The main philosophy of this stormwater management plan is that the proposed development will feature the protection and enhancement of riparian and wetland vegetation. The overall stormwater management objective is to preserve natural flows to the waterways and wetlands and to minimise the increase in pollutant loads. Northeast Business Park has a commitment to managing stormwater in terms of best practice for water sensitive urban design and the overall development has an environmental focus.
The stormwater management and reporting strategy adopted for the Northeast Business Park is guided by a framework of management plans. Two levels of management plans have been identified and described in this report.
Master plan (this report) – provides a framework for water quality management and reporting for the entire development site. It identifies the adopted water quality reporting objectives, relevant design constraints and appropriate management strategies for the development site. Water quality modelling is undertaken at the conceptual level, based on appropriate water quality treatment measures for each catchment.
Catchment stormwater management plans – developed as part of the initial area development plan for the first stage of development in each catchment. These plans address water quality and quantity management at the catchment level and provide detailed design and modelling of all adopted management measures.
This report outlines the stormwater management strategy adopted to achieve the CSCs pollution reduction targets and the Queensland WQO for Caboolture River.
9.1 Water quality A MUSIC water quality model was developed for the assessment of TSS, TN and TP for existing and post-development site conditions. The modelling parameters for the various land uses (urban, rural, commercial, industrial and undeveloped) were adopted from the Brisbane City Council’s ‘Guidelines for Pollutant Export Modelling in Brisbane Version 7 – Draft’ as referenced in Caboolture Shire Plan Design and Development Manual – Stormwater Code.
Treatment trains are a series of stormwater treatment measures located in a catchment to provide a staged approach to removal of stormwater pollutants from runoff. The proposed treatment trains were incorporated into the MUSIC model. The key measures include (but not limited to) grass swales, bio-retention swales and constructed wetlands.
Model results showed that runoff from the site meets the CSC reduction targets for TSS, TP and TN. Therefore best management practice can be adopted within the constraints of the site to meet the CSC requirements.
PB 2138171B-RPT002-B:ag Page 33

Northeast Business Park Stormwater Management Plan
9.2 Water quantity The development will cause an increase in peak stormwater flows as the level of imperviousness within the development site will increase. The Rational Method was adopted to estimate the increase in peak flows for the sub-catchments within the development. As WSUD practices are being adopted, it is expected that the bio-retention and wetlands will provide the attenuation required. It is difficult to calculate detention requirements until a more detailed layout (street scale) is adopted. Further design stages will need to ensure that sufficient flow attenuation will be provided to limit impacts on the Caboolture River. This will be undertaken in accordance with the Council’s Stormwater Code. However, conservative estimates of the attenuation required are provided for a range of ARI events.
9.3 Recommendations The following recommendations are made:
adoption of best management treatment measures to meet stormwater quality targets
adoption of WSUD practices at the street scale to meet stormwater quantity targets
completion of catchment stormwater plans for each development area that adopt the detailed layout (street scale) and address the stormwater quality and quantity design criteria.
PB 2138171B-RPT002-B:ag Page 34

Northeast Business Park Stormwater Management Plan
References 4site Natural Solutions, “Caboolture Water: Waterways, Soils and Water Quality Management – Information Request Response”, for Lensworth Group Pty Ltd, 13 August 2004.
Brisbane City Council’s ‘Guidelines for Pollutant Export Modelling in Brisbane Version 7 – Draft’ 2003.
Brisbane City BCC, ‘Queensland Urban Drainage Manual (QUDM) Volume 1’, BCC Dept of Works. Design Branch, Neville Jones & Associates, 1992.
Brisbane City Council, ‘Guidelines on Identifying and Applying Water Quality Objectives in Brisbane City’, 2000.
Caboolture River – Draft environmental values and water quality objectives, Environmental Protection Agency, 2005
Caboolture River Business Park in the Design Criteria report (PMM group, 2004).
Caboolture Shire Plan – Division 19 Stormwater, Caboolture Shire, 2005
Draft Queensland Water Quality Guidelines 2005, Queensland Government, 2005
Environmental Protection Agency, Scoping Study on a Nutrient Trading Program to Improve Water Quality in Moreton Bay, 2005.
Environmental Protection (Water) Policy 1997, Draft Schedule 1 Document, Caboolture River – Draft environmental values and water quality objectives, May 2005).
Environmental Protection (Water) Policy 1998 (EPP Water)
Institution of Engineers Australia, 1997, Australian rainfall and runoff, vol. 1, Canberra, 1998.
HEALTHY WATERWAYS, http://www.healthywaterways.org/
PMM GROUP, ‘Caboolture River Business Park’ For Lensworth Group Limited, September 2004.
Queensland Water Quality Guidelines (QWQG), 2005
Siemon, J.E., “Geological Report on Caboolture Marina Site for Noosa Events Pty Ltd”, September 2005.
South East Queensland Regional Framework for Growth Management (RFGM)
South East Queensland Regional Water Quality Management Strategy – Volume 3 Moreton Bay Catchment Region, Healthy Waterways, 2001
South East Queensland Regional Water Quality Management Strategy
PB 2138171B-RPT002-B:ag Page 35

Northeast Business Park Stormwater Management Plan
Appendix A
Ecosystem constraints plan
PB 2138171B-RPT002-B:ag Page A-1

Northeast Business Park Stormwater Management Plan
Appendix B
Master plan layout
PB 2138171B-RPT002-B:ag Page B-1

Northeast Business Park Stormwater Management Plan
Appendix C
Best Practice Management
PB 2138171B-RPT002-B:ag Page C-1

Northeast Business Park Stormwater Management Plan
Turbidity
Turbidity is a pollutant that impacts primary recreation and aquatic ecosystems environmental values. The turbidity of water is caused by the presence of suspended particulate and colloidal matter consisting of suspended clay, silt, phytoplankton and detritus. Turbidity depends mostly on particle size, composition and particle concentration and the main source is usually from fine particulates, 0.125 mm and below (Fletcher et al, 2003).
Potential sources
Northeast Business Park is primarily an industrial, commercial and residential development and the main source of suspended particulate matter is from diffuse land runoff due to soil erosion in the upstream catchment. Suspended particulate matter could arise from point sources such as sewage outfalls and stormwater drains.
Management practices
Useful structural stormwater treatment measures for turbidity are given below:
grass swales
sand filters
porous pavements
constructed wetlands.
Managing the construction and operational phases of the development at the source is a positive option to assist in reaching guideline turbidity values. Source management options include:
1) minimising stormwater runoff across construction sites and areas of roadwork to prevent sediment washing downstream
2) provision of a buffer zone with a mixture of native plants to filter runoff from disturbed slopes, trapping pollutants and stabilizing gully banks, preventing bank erosion. These plants will also provide a natural riparian ecosystem
3) community education to encourage increased planting and maintenance of native vegetation on properties and including information about the importance of buffer zones and riparian vegetation along creeks.
Algal blooms
The environmental values that are directly affected by algal blooms are aquatic foods cooked and primary recreation. Algal blooms occur naturally with phytoplankton or micro-algae providing food for aquatic organisms. Harmful algal species are usually naturally occurring algae that reach high enough concentrations to be a nuisance.
Potential sources
Blooms are most common if warm, calm and stratified conditions occur after rainfall events in waterbodies and estuaries that are subject to elevated nutrient loads. If nutrient loads within the Northeast Business Park development are high and there are no natural systems in place for dilution, then algal blooms could occur.
PB 2138171B-RPT002-B:ag Page C-2

Northeast Business Park Stormwater Management Plan
Management practices
PB developed a water quality pollutant export model to generate pollutant loads and event mean concentrations for Total Phosphorus and Total Nitrogen. The structural stormwater treatment measures proposed to assist in the mitigation of high nutrient levels were:
regional wetlands
regional wetlands and swales.
Because of the direct relation to nutrient loading, algal blooms are not expected to be a problem for the Caboolture River Business Park development if the above measures are implemented and successful in mitigating high nutrient loads.
Further management options for high nutrient loading include source measures such as reducing stormwater runoff and rehabilitating riparian zones to assimilate nutrients. Some possible alternatives to structural treatment measures are given below:
protect native vegetation along creeks to naturally filter organic material
educate and encourage residents to adopt stormwater wise management practices to reduce nutrient generation at the source
rehabilitate riparian zones to act as a natural trap for sediments and nutrients
encourage residents to control animal wastes and fertilizer use through education via pamphlets and signs in parks and other recreational areas.
Dissolved oxygen
Measures of dissolved oxygen (DO) refer to the amount of oxygen contained in water, and define the living conditions for oxygen-requiring (aerobic) aquatic organisms. DO concentrations reflect equilibrium between oxygen-producing processes (e.g. photosynthesis) and oxygen consuming processes (e.g. aerobic respiration, nitrification). The dissolved oxygen concentration in a waterbody is highly dependant on temperature, salinity, biological activity (microbial, primary production) and rate of transfer from the atmosphere. Low DO concentrations can result in adverse effects on many aquatic organisms (e.g. fish, invertebrates and micro-organisms) which depend upon oxygen for their efficient functioning.
If dissolved oxygen becomes depleted in bottom waters (or sediment), nitrification, and therefore denitrification, may be terminated, and nutrients may be released from the sediment to the water column which can give rise to or support algal blooms.
Management practices
The amount of dissolved oxygen is related primarily to the discharge of nutrients into the Caboolture River waterways. As described in the suggested management practices of algal blooms, low dissolved oxygen should not be an issue for the development if nutrient loads are successfully managed as water quality modelling demonstrated. Structural stormwater treatment measures have been recommended to help mitigate high nutrient loading and indirectly mitigate both algal bloom and dissolved oxygen pollutants.
PB 2138171B-RPT002-B:ag Page C-3
Northeast Business Park Stormwater Management Plan
Chlorophyll ‘a’
Chlorophyll ‘a’ (chl a) is a physico-chemical indicator for aquatic ecosystem health. Chl a in the water indicates that plants, algae or cyanobacteria are actually growing and that appropriate management action should be taken to identify the species. Chl a can be used as a non-specific indicator of the trophic status (level of pollution) of a water body.
High chlorophyll concentrations can lead to excessive water column productivity and contribute to high amounts of easily decomposed organic matter to the sediments.
Chlorophyll ‘a’ concentrations can be an alternative indicator of nutrient pollution. It is natural for chlorophyll ‘a’ levels to fluctuate over time. Nutrient loading into the waterways will directly affect the chlorophyll ‘a’ levels.
Management practices
The management strategies that have been recommended for nutrient loading in the Northeast Business Park development will assist in mitigating chlorophyll ‘a’ levels. Investigation of construction practices in the development is needed to ensure that the aquatic ecosystem and flushing system of the waterway is not adversely affected.
Faecal coliforms
Faecal coliforms are indicators of disturbance to environmental values such as aquatic foods cooked and primary recreation and are used as an indicator of faecal contamination of water. Faecal coliforms are used to indicate the presence of viruses in the aquatic food and ecosystems because the viruses of concern to human health are derived mainly from sewage, E. coli and other faecal coliforms.
Faecal coliform counts from residential areas are typically ten times as large as those from other types of high urban land use (Duncan, 1999). Possible causes include:
sewer overflows — to release to land any sewage flow blockages resulting from pump failure and other disturbances
household pets and native animals — faecal contamination around parklands and lakes, runoff into waterbodies.
Faecal coliform problems are more prolific in residential areas with main causes being sewer overflows and faecal contamination from pets and animals.
PB 2138171B-RPT002-B:ag Page C-4

Northeast Business Park Stormwater Management Plan
Management practices
Useful structural stormwater treatment measures to prevent contamination from faecal coliforms are given below:
filter strips
grass swales
sand filters
infiltration trench/basin
porous pavements
extended detention basin
constructed wetlands.
Salinity
EC is used to measure the total ion concentration in fresh and brackish waters. Measures of salinity can indicate whether the chemical nature of aquatic ecosystems is being altered and provides a warning of the potential loss of native biota.
Most aquatic organisms function optimally within a narrow range of salinity. Salinity changes may affect aquatic organisms in two ways:
direct toxicity through physiological changes (particularly osmoregulation) — both increases and decreases in salinity can have adverse effects
indirectly by modifying the species composition of the ecosystem and affecting species that provide food or refuge.
Salinity levels fluctuate with the penetration of tidal flows and with mixing of fresh water and marine water by wind and currents. Decreased freshwater inflows, due to the diversion of rivers and streams into impoundments such as weirs or wetlands, lead to the dissipation of salinity gradients and extended periods of elevated salinity in natural wetlands adjacent to the river. Conversely large incursions of stormwater runoff can severely depress normal salinity levels in inshore areas (ANZECC, 2000).
Management practices
The most effective option to help alleviate the adverse effects of salinity is to minimise disruption to the natural flow regime of the water system (DNRE et al, 1998). Some specific management options are:
minimise stormwater runoff and increase of water reuse within the development
investigate the impacts that wetlands have on the flow regime
awareness of upstream and downstream engineering works that could affect salinity
conduct site specific evaluations using biological indicators and develop rigorous experimental modelling to create trigger values for normal ecosystem salinity.
PB 2138171B-RPT002-B:ag Page C-5

Northeast Business Park Stormwater Management Plan
pH
pH is a measure of the acidity or alkalinity of water on a log scale from 0 (extremely acidic) through 7 (neutral) to 14 (extremely alkaline). The pH of the water bodies within the area and runoff generated from the catchment is not expected to cause significant problems to the environmental values of the area. A monitoring program that includes measurements of pH will determine if levels stay within guideline values.
Oil and grease (including petrochemicals)
Oil and grease is a composite of possibly thousands of organic chemicals with different properties and toxicities (Duncan, 1999). As components of liquid and gaseous fuels, petroleum hydrocarbons are amongst the most widely processed and distributed chemical products in the world (ANZECC, 2000).
The presence of oil and petrochemicals makes water aesthetically unattractive. They can form deposits on shorelines, and bottom sediments that are detectable by sight and odour. Some organic compounds can be absorbed directly from the water through the skin, making these substances even more undesirable in recreational areas (ANZECC, 2000).
In general, oils of animal or vegetable origin are chemically non-toxic to aquatic life, although they can taint the flesh of food species, coat gills reducing oxygen uptake, increase BOD levels and increase maintenance of water treatment equipment.
Primary sources in surface waters include runoff from roads, car parking areas and discharges from areas using oil. Sources of oil and grease include food processing and preparation, operation and maintenance of vehicles and machinery, and natural compounds leached from vegetation and plant litter.
Management practices
Useful structural stormwater treatment measures for oil and grease are given below:
oil and grit separators
sand filters
infiltration trench/basin
porous pavements
constructed wetlands.
These appropriate treatment measures are able to help mitigate oil and grease in the water system. The optimum treatment methods from those available are sand filters and constructed wetlands.
Litter
Litter includes paper, plastic, glass, metal and other packaging materials.
Impacts
The impacts of litter are primarily aesthetic, but also pose a risk to aquatic ecosystems by preventing plant growth and entrapping animals. The poor visual appearance of the water system can perpetuate a depressing image, reduce the environmental and recreational
PB 2138171B-RPT002-B:ag Page C-6

Northeast Business Park Stormwater Management Plan
facility of the river and set a poor example for people and actually encourage more littering (AGGA, 2003).
Litter is generally associated with human activities that result in waste generation. Litter can be deposited in the catchment in a number of ways such as deliberate pollution or overflows from rubbish bins. Once litter is on the ground it can easily be transported by storm runoff into stormwater systems and washed into local gullies and creeks.
Management practices
Useful structural stormwater treatment measures for litter are given below:
in ground gross pollutant traps (GPTs)
open GPTs
water quality ponds
filter strips
litter and trash racks
litter booms
downwardly inclined screens
constructed wetlands.
These appropriate treatment measures are able to help mitigate litter problems in the water system. The optimum treatment methods from those available are in-ground GPTs, open GPTs water quality ponds and constructed wetlands (BCC, 2000).
Chemical contaminants
Chemical contaminants may be categorised into three broad groups (ANZECC, 2000).
Inorganic chemicals (mostly heavy metals): These are a potential problem for human health, particularly in the case of bivalve molluscs where bioaccumulation increases the concentrations of toxicants. The rate of accumulation is species specific and depends on the mechanism of absorption and tissue distribution.
Organic chemicals (pesticides and herbicides): This broad group includes synthetic compounds which through either bioaccumulation or residue concentrations are potentially toxic to human consumers of contaminated aquatic foods.
Radionuclides (radioactive elements): Any man-made or natural element that emits radiation and that may cause cancer after many years of exposure through drinking water.
Waters containing chemicals that are either toxic or irritating to the skin or mucous membranes are unsuitable for recreation. In general, there are two kinds of human exposure in swimming areas: contact with the waterbody and ingestion of the water. Many pesticides are broken down into harmless products by micro-organisms.
Heavy metals in the development will mainly be sourced from roads, roofs, cars and paints. These will usually enter waterways via runoff. Pesticides and fertilisers enter water from land by aerial drift, runoff or leaching into groundwater.
PB 2138171B-RPT002-B:ag Page C-7

Northeast Business Park Stormwater Management Plan
Management practices
Useful structural stormwater treatment measures for chemical contaminants are given below:
constructed wetlands
grass swales
sand filters
infiltration trench/basin
porous pavements.
These appropriate treatment measures are able to help mitigate chemical contamination problems in the water system. The optimum treatment methods from those available are constructed wetlands, infiltration trenches and basins and porous pavement (BCC, 2000).
Managing chemical contaminant problems at the source will limit the risk of exceeding desired water quality objectives. Source management options include:
reduction of use of fertilisers around the residential areas
integrated pest management practices minimise pesticide usage by careful monitoring of pest species (and their predators) and utilising a range of pest control options.
PB 2138171B-RPT002-B:ag Page C-8

Northeast Business Park Stormwater Management Plan
Appendix D
Base and storm flow concentrations parameters (BCC)
PB 2138171B-RPT002-B:ag Page D-1

Northeast Business Park Stormwater Management Plan
Table D.1: Base and storm flow concentration parameters
Total suspended solids
(Log10 mg/L)
Total phosphorous
(Log10 mg/L)
Total nitrogen
(Log10 mg/L)
Land Use Parameter
Base Flow
Storm Flow
Base Flow
Storm Flow
Base Flow
Storm Flow
Mean 1 2.18 -0.97 -0.47 0.2 0.26 Urban residential Std
Deviation 0.34 0.39 0.31 0.31 0.2 0.23
Mean 0.78 2.16 -0.6 -0.39 0.32 0.37 Commercial
Std Deviation
0.39 0.38 0.5 0.34 0.3 0.34
Mean 0.78 1.92 -1.11 -0.59 0.14 0.25 Industrial
Std Deviation
0.45 0.44 0.48 0.36 0.2 0.32
Mean 0.53 2.26 -1.54 -0.56 -0.52 0.32 Rural Residential Std
Deviation 0.24 0.51 0.38 0.28 0.39 0.3
Mean 1.400 2.3 -0.88 -0.27 0.074 0.56 Agricultural
Std Deviation
0.310 0.310 0.13 0.3 0.13 0.26
Mean 0.51 1.9 -1.79 -1.1 -0.59 -0.075 Forest
Std Deviation
0.28 0.2 0.28 0.22 0.22 0.24
PB 2138171B-RPT002-B:ag Page D-2

Northeast Business Park Stormwater Management Plan
Table D.2: Runoff generation parameters (BCC)
Parameter Urban Residential
Commercial Industrial Rural residential
Agriculture Forested
Field capacity (mm)
200 80 80 80 80 80
Infiltration capacity coefficient a
50 200 200 200 200 200
Infiltration capacity exponent b
1 1 1 1 1 1
Rainfall threshold (mm)
1 1 1 1 1 1
Soil capacity (mm)
400 120 120 120 120 120
Initial storage (%)
10 25 25 25 30 25
Daily recharge rate (%)
25 25 25 25 25 25
Daily drainage rate (%)
5 5 5 5 5 5
Initial depth (mm)
50 50 50 50 10 50
PB 2138171B-RPT002-B:ag Page D-3