northeast forum on regional energy solutions … investigation/eversource...northeast forum on...
TRANSCRIPT

1
Northeast Forum on Regional Energy Solutions Remarks by Gordon van Welie, President & CEO, ISO New England
April 23, 2015
Introduction
My name is Gordon van Welie. I am president and chief executive officer of ISO New England. We are
responsible for operating New England’s power grid and wholesale electricity markets, and planning to
ensure the future reliability of the system.
Thank you for inviting me to participate in the Northeast Forum on Regional Energy Solutions.
ISO New England has a long-standing relationship with the New England Governors and is committed to
working with the states as they formulate solutions to the region’s energy infrastructure needs.
Dramatic Transformation of the Generation Fleet
The region is undergoing a dramatic transformation of the generation fleet, and this is due to a number
of economic and environmental factors. (See Slide 2)
Over the last 15 years, the region has seen a major shift toward natural-gas-fired generation. Last year,
we produced nearly half of our electricity with natural gas, up from 15% in 2000.
The combined use of coal and oil has fallen dramatically over the same period (from 40% to 6%), and
these resources only operate during the summer when electricity demand is highest, and in the winter
when natural gas pipelines are constrained.
The shift in New England’s resource mix is the result of two primary factors. Low-priced natural gas, for
most of the year, is making it uneconomic for coal and oil plants to operate in the energy market. And
policymakers are seeking to reduce carbon and other power-plant emissions through environmental
policies.
These factors are driving major generator retirements in the region. In the past few years, 10% of our
generating capacity announced plans to retire within five years. This includes coal, oil and nuclear power
plants. And that is just the beginning.
Many more coal- and oil-fired power plants (another 6,000 MW) are “at risk” of retirement.
The timeframe for these retirements is uncertain and will depend on investments in transmission and
gas pipelines, as well as environmental policies, but our best guess is that this will occur over the next
decade or so.
This will only increase our dependence on natural gas for power generation.
As the generation fleet turns over, we recognize that the states are looking to influence the future
resource mix toward energy efficiency, distributed resources, and non-carbon renewable resources.
000029
Docket No. IR 15-124 Comments of Eversource Energy
Attachment 3 Page 1 of 13
2
The Future Resource Mix
The ISO’s markets and planning processes fully recognize the states’ investments in energy efficiency.
According to our energy-efficiency forecast, overall electricity demand in New England has essentially
flattened over the next decade, and this is largely because of the billions of dollars being spent by the
states on energy-efficiency measures.
As you consider further resource needs, it appears your clear priority is to develop non-carbon,
renewable energy resources, and this is driving significant investments in solar photovoltaics (PV) and
wind.
Solar PV resources have been coming online rapidly and we expect the current amount (900 MW) to
nearly triple within a decade (2,400 MW by 2024).
Wind power supplies about 1% of our annual electricity needs, but almost half of proposed generation
in New England is wind power. Many of these projects are proposed to be built in areas where the
transmission system is already constrained, and some in areas where there is no transmission at all.
This is like building a manufacturing plant in an area where there is no transportation system to move
the products to market.
If the New England states want to improve the deliverability of existing wind resources, develop new
wind resources, or access more hydropower from eastern Canada, then they will need to invest in
additional electric transmission to deliver that energy, which is largely sourced in the north, to where it
is consumed, which for the most part is in southern New England.
I am aware that the southern New England states are evaluating a solicitation for projects that could
address some of these clean energy goals.
(See Slide 3) There are a number of transmission proposals by private developers vying to move clean
energy supplies from Newfoundland and Labrador, Québec, and northern New England, particularly
Maine, to southern New England. Some of these transmission proposals, as well as other proposals, may
come forward in the states’ solicitation. While these are not considered reliability projects, the ISO’s role
is to study these proposals to ensure they can interconnect reliably.
The projects listed on Slide 3 reflect publicly available information as of November 2013 and are not
intended to be a comprehensive list of the elective transmission proposals in our interconnection queue.
They are intended to be representative of the types of transmission projects emerging inside and
outside the region in response to the states’ clean energy goals.
While the region is transitioning to more renewable energy, we are experiencing environmental and
cost impacts associated with constraints on the natural gas pipeline system. These impacts have been
most severe during the last few winters.
000030
Docket No. IR 15-124 Comments of Eversource Energy
Attachment 3 Page 2 of 13

3
Natural Gas Pipeline Infrastructure
Because natural gas represents such a large portion of the region’s generating fleet, availability of
natural gas for power generation has a profound impact on grid reliability and production costs.
New England has limited natural gas pipeline infrastructure serving the region and these pipes are
reaching maximum capacity, especially during the winter months when demand for natural gas to heat
homes and businesses is at its highest.
New England’s natural gas infrastructure has not kept pace with the tremendous growth in natural gas-
fired generation and the increasing demand for natural gas as a heating fuel. (See Slide 4)
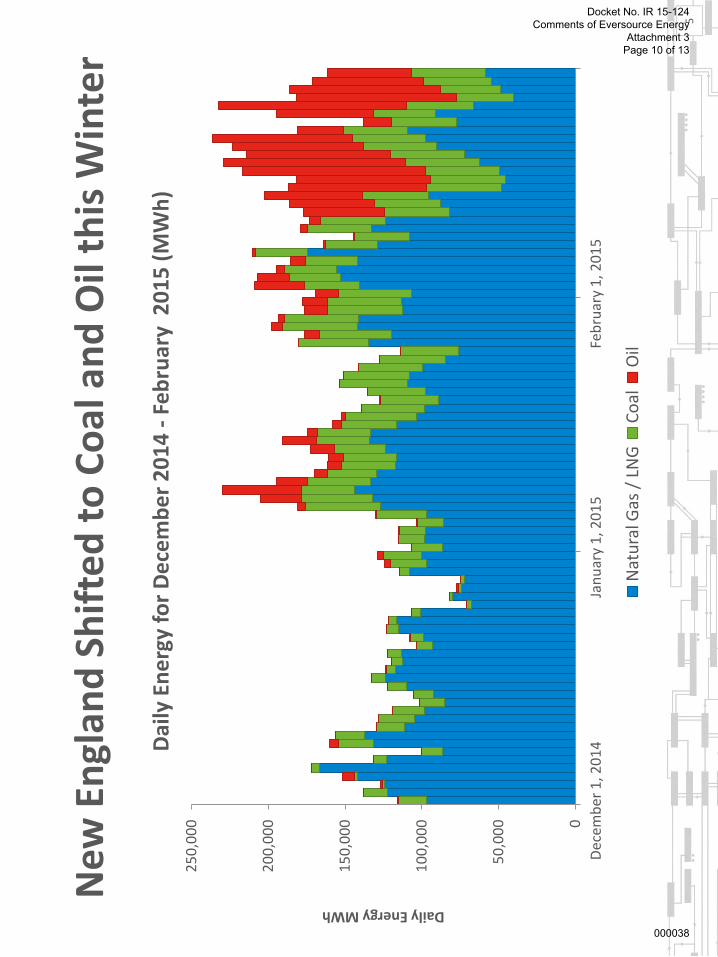
When natural gas supply to generators is constrained, the ISO must commit other generating resources
to maintain system reliability, and these resources are often coal- and oil-fired power plants. Coal and
oil have made vital contributions to the fuel mix during high gas demand days over the past few winters.
(See Slide 5)
These resources are still important to keeping the lights on, but they are retiring. And we understand
that New England policymakers do not like the increase in emissions that occurs when they run, or the
impact on electricity prices resulting from high fuel costs.
Impact on Natural Gas and Wholesale Electricity Prices
Over the last three winters, New England experienced significant price spikes in both natural gas and
wholesale electricity. (See Slide 6)
Constraints on the natural gas pipeline system drove gas prices to record levels. This volatility in the
New England gas markets was the direct cause of volatility in the wholesale electricity markets.
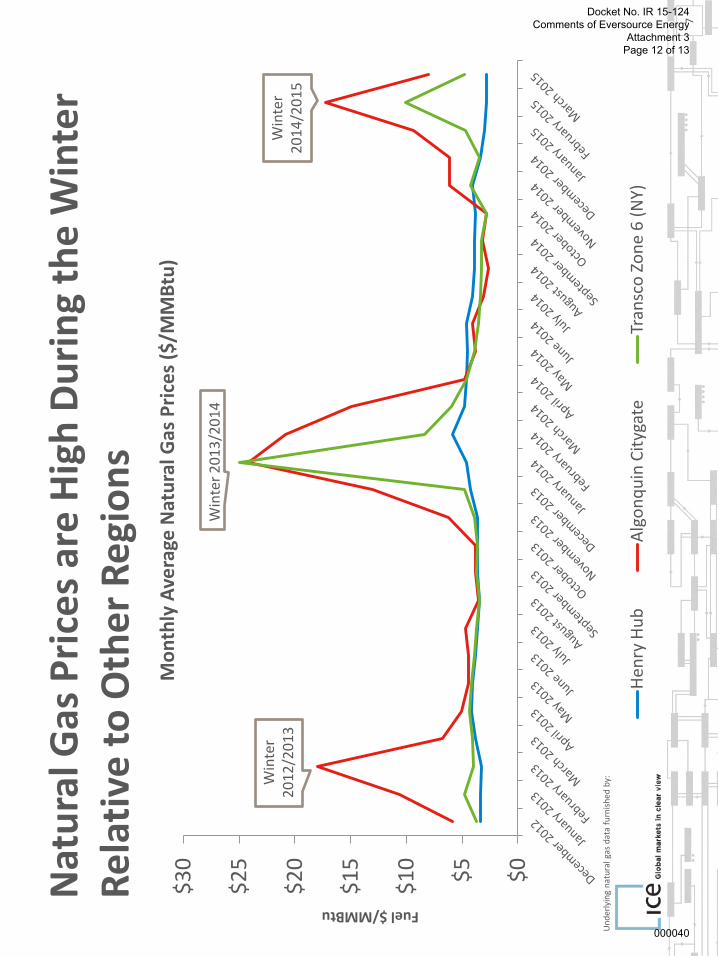
Natural gas prices were less volatile this winter, but we still saw many days in February with spot gas
prices in the $20 – $30 per MMBtu range, which is very high by historical standards. And significantly
higher than areas of the country where the gas system is unconstrained. (See Slide 7)
This week, the U.S. Department of Energy released the first installment of the Quadrennial Energy
Review (QER), which shines a spotlight on natural gas infrastructure constraints in the northeast.
The QER points out that despite large volumes of gas available from the Marcellus Shale in nearby
Pennsylvania, pipeline constraints restrict sufficient supplies of this gas from reaching New England,
putting upward pressure on gas prices in the wintertime. The New York metropolitan area, by contrast,
has alleviated some of the winter congestion it faced by adding new pipeline capacity.
This winter, the region’s power grid operated well through cold weather and, due to a confluence of
regional and global factors, natural gas and wholesale electricity prices were lower on average than last
winter.
000031
Docket No. IR 15-124 Comments of Eversource Energy
Attachment 3 Page 3 of 13

4
That said, February 2015 still ranked as the third-highest monthly average for wholesale electricity
prices in New England since 2003. The highest and second-highest prices were logged the previous
winter, during January and February 2014.
Why were prices less volatile this winter? (See Slide 8)
A number of factors helped ensure power system reliability and keep price volatility in check this winter.
First, we ran a winter reliability program that provided incentives for power plants to have oil inventory
stored on site, or to have a contract for LNG deliveries to supplement pipeline gas supplies before the
start of the winter. This meant that resources had the fuel they needed to run when dispatched by the
ISO.
Second, December was mild, and the coldest winter weather didn’t arrive until February, when days
were longer and electricity consumption was down.
High natural gas prices last winter and high forward prices for delivery this winter attracted liquefied
natural gas (LNG) supplies to New England.
Global oil prices dropped dramatically, making it more economical at times to burn oil than natural gas.
This dampened gas and electricity price volatility.
And, finally, energy-efficiency measures promoted by the states helped reduce total power consumption
and peak demand. [Our latest forecast shows energy efficiency flattening peak demand growth in the
wintertime.]
The region benefited from the availability of LNG resources this winter, but there is no guarantee that
those same shipments will arrive next winter, or that oil prices will remain low. The region’s pipeline
infrastructure, however, will continue to be constrained as heating demand grows and gas‐fired
generation replaces retiring power plants.
Beyond the winter programs, what actions has the ISO taken to address infrastructure challenges?
In addition to two winter reliability programs, the ISO has taken major steps to increase market
efficiency and improve gas-electric coordination in response to the challenges posed by the region’s
natural gas dependence and infrastructure constraints.
Our longer-term market enhancements, called “Pay for Performance,” will provide strong incentives for
resources to invest in operational improvements and secure fuel arrangements to ensure resource
performance. This will go a long way towards mitigating the reliability risks facing the region.
The response to “Pay for Performance,” however, likely will not ensure investment in natural gas
pipeline capacity. The design gives market participants the flexibility to select the most cost-effective
way to ensure performance.
000032
Docket No. IR 15-124 Comments of Eversource Energy
Attachment 3 Page 4 of 13
5
Gas generators have told us that the most cost-effective solution for them is to continue to utilize the
pipelines when they are unconstrained and to switch to burning oil when gas transportation becomes
unavailable.
While the ISO may be satisfied with this solution from a reliability perspective, the states may not be
satisfied from an environmental perspective. And given that dual fuel will not directly relieve the gas
pipeline constraints, it is unlikely to resolve the issue of gas price volatility during the winter months.
I worry too about the long-term reliability of a system that is so fuel constrained, particularly during the
winter. We are currently maintaining reliability by relying heavily on older oil and coal resources, and we
know that these resources are the most likely to retire in the coming years.
In fact the largest coal and oil generator in New England will retire in June 2017. And the constraints on
the fuel system supplying New England make us that much more vulnerable to the outage of a large
non-gas generator or transmission line during extremely cold weather.
We also observe that it is becoming increasingly difficult for gas generators to obtain permission to
install dual-fuel capability and that the oil supply chain can be fragile under adverse weather conditions.
There are alternatives to burning fossil fuels, such as renewable energy. While these resources can
offset the need for gas, they are unlikely to be developed in sufficient quantity in the timeframe needed.
There is also the operational reality that renewable resources cannot be fully relied upon to produce the
energy we require when our demand is highest in the winter months. The one possible exception is
imported hydro energy, but only if the delivery of that energy has been guaranteed, since our neighbors
to the north also experience high demand for that energy during cold periods.
Concluding Remarks
In summary, all these indicators seem to point in the direction of increasing the capacity of the gas
infrastructure serving New England in order to mitigate the risks facing the region and facilitate the
integration of additional renewable energy.
This raises two questions: who will contract for this infrastructure and how will the costs be recovered?
As I mentioned previously, gas generators are unlikely to contract for the additional gas infrastructure. It
is also unlikely that gas producers will do so, because they typically will only invest in gas infrastructure
when there is a year-round demand for their product. This leaves either the gas distribution companies,
who have traditionally been the contracting party, or the electric distribution companies.
My understanding is that the states are considering a variety of solutions to alleviate the infrastructure
constraints and mitigate the risks facing the region. I believe state policymakers have a very important
role in shaping future infrastructure solutions and we look forward to working with you as you consider
these potential solutions.
Thank you.
000033
Docket No. IR 15-124 Comments of Eversource Energy
Attachment 3 Page 5 of 13
AP
RI
L 2
3,
20
15
|
HA
RT
FO
RD
, C
T
Go
rdo
n v
an W
elie
P
RE
SI
DE
NT
& C
EO
No
rth
east
Fo
rum
on
Reg
ion
al E
ner
gy
Solu
tio
ns
Ch
alle
nge
s Fa
cin
g th
e N
ew
Engl
and
Po
wer
Sys
tem
000034
Docket No. IR 15-124 Comments of Eversource Energy
Attachment 3 Page 6 of 13

New
En
glan
d h
as S
een
Dra
mat
ic C
han
ges
in t
he
En
ergy
Mix
fro
m O
il an
d C
oal
to
Nat
ura
l Gas
31
%
22
%
18
%
15
%
13
%
1.7
%
34
%
1%
5
%
44
%
15
%
1%
Nu
clea
r O
il C
oal
N
atu
ral G
as
Hyd
ro
and
Oth
er
Ren
ewab
les
Pu
mp
ed
Sto
rage
20
00
2
01
4 Pe
rcen
t o
f To
tal E
lect
ric
Ene
rgy
Pro
du
ctio
n b
y Fu
el T
ype
(2
00
0 v
s. 2
01
4)
2
Sou
rce:
ISO
New
En
glan
d N
et E
ner
gy a
nd
Pea
k Lo
ad b
y So
urc
e
Oth
er r
enew
able
s in
clu
de
lan
dfi
ll ga
s, b
iom
ass,
oth
er b
iom
ass
gas,
win
d, s
ola
r, m
un
icip
al s
olid
was
te, a
nd
mis
cella
neo
us
fuel
s
000035
Docket No. IR 15-124 Comments of Eversource Energy
Attachment 3 Page 7 of 13

3
On
- an
d O
ff-s
ho
re T
ran
smis
sio
n P
rop
osa
ls a
re V
yin
g to
M
ove
Re
ne
wab
le E
ne
rgy
to N
ew E
ngl
and
Lo
ad C
en
ters
No
te: T
hes
e p
roje
cts
are
NO
T re
liab
ility
pro
ject
s, b
ut
ISO
Ne
w E
ngl
and
’ s r
ole
is t
o e
nsu
re t
he
relia
ble
inte
rco
nn
ecti
on
of
thes
e ty
pes
of
pro
ject
s.
000036
Docket No. IR 15-124 Comments of Eversource Energy
Attachment 3 Page 8 of 13

Nat
ura
l Gas
Infr
astr
uct
ure
has
No
t K
ep
t P
ace
wit
h
Tre
me
nd
ou
s G
row
th in
Gas
-fir
ed
Ge
ne
rati
on
0
2,0
00
4,0
00
6,0
00
8,0
00
10
,00
0
12
,00
0
14
,00
0 19
97
19
99
20
01
20
03
20
05
20
07
20
09
20
11
20
13
Nat
ura
l Gas
Oil
Bio
mas
s
Fuel
Cel
l
Hyd
ro
Sola
r
Win
d
Nu
clea
r u
pra
te
Cu
mu
lati
ve N
ew G
en
era
tin
g C
apac
ity
in N
ew E
ngl
and
(M
W)
4
Capacity MW
000037
Docket No. IR 15-124 Comments of Eversource Energy
Attachment 3 Page 9 of 13
New
En
glan
d S
hif
ted
to
Co
al a
nd
Oil
this
Win
ter
5
0
50
,00
0
10
0,0
00
15
0,0
00
20
0,0
00
25
0,0
00
Dec
emb
er 1
, 20
14
Ja
nu
ary
1, 2
01
5
Feb
ruar
y 1
, 20
15
Dai
ly E
ne
rgy
for
De
cem
be
r 2
01
4 -
Fe
bru
ary
20
15
(M
Wh
)
Nat
ura
l Gas
/ L
NG
C
oal
O
il
Daily Energy MWh
000038
Docket No. IR 15-124 Comments of Eversource Energy
Attachment 3 Page 10 of 13

$0
$5
$1
0
$1
5
$2
0
$2
5
$3
0
$0
$2
0
$4
0
$6
0
$8
0
$1
00
$1
20
$1
40
$1
60
$1
80
Wh
ole
sale
Ele
ctri
city
at
New
En
glan
d H
ub
(R
eal-
Tim
e LM
P)
Nat
ura
l Gas
The
Re
gio
n h
as E
xpe
rie
nce
d H
igh
Nat
ura
l Gas
an
d
Wh
ole
sale
Ele
ctri
city
Pri
ces
the
Pas
t Fe
w W
inte
rs
6
Hu
rric
anes
h
it t
he
Gu
lf
Bef
ore
th
e
Rec
essi
on
an
d
Mar
cellu
s Sh
ale
gas
bo
om
W
inte
r 2
01
2/2
01
3
Win
ter
20
13
/20
14
Electric Energy $/MWh Fuel $/MMBtu
Mo
nth
ly A
vera
ge N
atu
ral G
as a
nd
Wh
ole
sale
Ele
ctri
city
Pri
ces
in N
ew E
ngl
and
Rec
ord
low
nat
ura
l ga
s an
d w
ho
lesa
le
elec
tric
ity
pri
ces
Win
ter
20
14
/20
15
000039
Docket No. IR 15-124 Comments of Eversource Energy
Attachment 3 Page 11 of 13
Nat
ura
l Gas
Pri
ces
are
Hig
h D
uri
ng
the
Win
ter
Re
lati
ve t
o O
the
r R
egi
on
s
$0
$5
$1
0
$1
5
$2
0
$2
5
$3
0
Mo
nth
ly A
vera
ge N
atu
ral G
as P
rice
s ($
/MM
Btu
)
Hen
ry H
ub
A
lgo
nq
uin
Cit
ygat
e Tr
ansc
o Z
on
e 6
(N
Y)
7
Win
ter
20
12
/20
13
W
inte
r 2
01
4/2
01
5
Win
ter
20
13
/20
14
Un
der
lyin
g n
atu
ral g
as d
ata
furn
ish
ed b
y:
Fuel $/MMBtu
000040
Docket No. IR 15-124 Comments of Eversource Energy
Attachment 3 Page 12 of 13

A C
om
par
iso
n o
f th
e L
ast
Two
Win
ters
Wh
y w
ere
pri
ces
less
vo
lati
le
this
win
ter?
•2
01
4/2
01
5 W
inte
r R
elia
bili
ty
Pro
gram
pro
vid
ed in
cen
tive
s to
fill
ta
nks
bef
ore
th
e st
art
of
the
win
ter
•H
igh
fo
rwar
d p
rice
s, d
ue
to h
igh
p
rice
s th
e p
revi
ou
s w
inte
r, a
ttra
cted
la
rge
sup
plie
s o
f LN
G t
o t
he
regi
on
•O
il p
rice
s w
ere
hal
f w
hat
th
ey w
ere
a ye
ar a
go
•C
old
est
win
ter
wea
ther
hap
pen
ed
in F
ebru
ary,
wh
en d
ays
wer
e lo
nge
r an
d d
eman
d w
as d
ow
n
8
W
inte
r
20
13
/20
14
Win
ter
20
14
/20
15
%
chan
ge
Ave
rage
mo
nth
ly
tem
per
atu
re (°
F)
26
.5
25
.5
- 3
.8%
Tota
l en
ergy
con
sum
pti
on
(GW
h)
33
,99
1
33
,65
4
- 1
.0%
Peak
dem
and
(MW
) 2
1,4
53
2
0,5
56
-
4.2
%
D
ate
of
pea
k 1
2/1
7/2
01
3
1/8
/20
15
-
Ave
rage
wh
ole
sale
ener
gy p
rice
at
Hu
b
($/M
Wh
)
$1
37
.60
$
76
.64
-
44
.3%
Ave
rage
gas
pri
ce a
t
Alg
on
qu
in ($
/MM
Btu
) $
19
.33
$
10
.70
-
44
.6%
Tota
l val
ue
of
ener
gy
mar
kets
(in
bill
ion
s)
$5
.05
B
$2
.77
B
- 4
5.1
%
000041
Docket No. IR 15-124 Comments of Eversource Energy
Attachment 3 Page 13 of 13