northern powerhouse factsheet - centre for cities powerhouse factsheet ... manifesto, for the...
TRANSCRIPT

Northern Powerhouse factsheetKey figures on the city regions in the Northern PowerhouseJune 2015
Introduction
The idea of a ‘Northern Powerhouse’ was first introduced in June 2014 by the Chancellor of the Exchequer, George Osborne, in a speech in Manchester. He made the case that the lack of economic and physical connections between the cities and city regions of the North of England was holding back their growth, with significant implications for the national economy. In the Chancellor’s own words: “the whole is less than the sum of its parts…so the powerhouse of London dominates more and more.”
For Osborne, the solution to this challenge is the creation of a Northern Powerhouse – “not one city, but a collection of northern cities - sufficiently close to each other that combined they can take on the world.”
Since the Chancellor’s initial speech, a raft of interventions have been announced to help turn the rhetoric of a Northern Powerhouse into reality – including the Greater Manchester Devolution Deal, Transport for the North, and the Northern Transport Strategy.
With the creation of a Northern Powerhouse set to be a key priority for the new Government, this briefing sets out the current economic profile of the key city regions across the North and compares their performance with that of London and of the UK as a whole. Reflecting the policy pledges contained within the Conservative manifesto, for the purposes of this analysis the Northern Powerhouse is made up of the city regions of Liverpool, Manchester, Leeds, Sheffield, Hull and the North East.1
Figure 1: Northern Powerhouse key facts
UK population (%) 16.7
Share of GB jobs, 2013 (%) 16.0
Share of total UK GVA, 2013 (%) 13.3
Share of jobs that are knowledge-intensive, 2013 (%) 12.7
Number of universities 23
1 Liverpool City Region Combined Authority; Greater Manchester Combined Authority; West Yorkshire Combined Authority; Sheffield Combined Authority; Humber Local Enterprise Partnership; North East Combined Authority
1

Northern Powerhouse Factsheet • June 2015 Centre for Cities
2
Population
The Northern Powerhouse is home to 10.7 million people, a quarter of which live in the Manchester City Region, and 21 per cent in West Yorkshire Combined Authority.
Figure 2: Population share in city-regions in the Northern Powerhouse, 2013
Source: NOMIS, 2015. ONS mid-year population estimates, 2013 data.
Over the last 10 years the Northern Powerhouse has had far slower population growth than the rest of the UK. Between 2004 and 2013, London grew more than twice as fast as the Northern Powerhouse.
Figure 3: Population growth, 2004-2013
Source: NOMIS, 2015. ONS mid-year population estimates, 2004 and 2013 data.
0
2
4
6
8
10
12
14
16
18
LondonNorthern Powerhouse
Liverpool City Region
West Yorkshire Combined Authority
Sheffield Combined Authority
Hull City Region
North East Combined Authority
Shar
e of
UK
popu
lati
on, 2
013
(%)
Manchester City Region
2
4
6
8
10
12
14
0
Lond
on
Nor
ther
n Po
wer
hous
e
Live
rpoo
l City
Reg
ion
Wes
t Yor
kshi
re C
ombi
ned
Aut
horit
y
Shef
field
Com
bine
d A
utho
rity
Hul
l City
Reg
ion
Nor
th E
ast C
ombi
ned
Aut
horit
y
Man
ches
ter C
ity R
egio
n
UKPo
pula
tion
gro
wth
, 200
4-2
013
(%)

Northern Powerhouse Factsheet • June 2015 Centre for Cities
3
Commuting
The Northern Powerhouse has a high level of containment: 92 per cent of people who work in the Northern Powerhouse also live within the Northern Powerhouse, and 96 per cent of those working in the North East Combined Authority also live there. 15 per cent of people working in Manchester City Region, however, travel in from elsewhere in the Northern Powerhouse or from beyond.
Figure 4: Commuting across the Northern Powerhouse
Economy
The Northern Powerhouse accounts for 13.3 per cent of all UK’s Gross Value Added, compared to the 24.5 per cent that is contributed by London.
Figure 5: Share of total UK GVA, 2013
Source: ONS, 2014. Regional, Sub-regional and Local Gross Value Added 2013 data. Note: For total GVA figures, London refers to Greater London rather than the Primary Urban Area owing to data limitations
!
!
!
!
!!
North East CombinedAuthority
West Yorkshire Combined Authority
Manchester City Region
Liverpool City Region
Sheffield Combined Authority
Hull City Region
! City centre
0.4%
0.1%
1%2%
3%
3%1%1%
4% 2%
Commuting pattern
City Region boundary
62.2%
24.5%
13.3%
Rest of UK
London
Liverpool City Region
Manchester City Region
West Yorks Combined Authority
Sheffield Combined Authority
Hull City Region
North East Combined Authority
Northern Powerhouse
2.6%1.1%
1.5%
2.2%3.7%
1.8%
Source: NOMIS (2015), Census 2011 data

Northern Powerhouse Factsheet • June 2015 Centre for Cities
4
Over the last 10 years, the Northern Powerhouse has performed below the UK’s average for GVA growth, while London has outstripped the region, growing nearly twice as fast as the Northern Powerhouse.
Figure 6: Total GVA Growth, 2004-2013
Source: ONS 2014.Regional, Sub-regional and Local Gross Value Added 2004, 2013 data. Note: For total GVA figures, London refers to Greater London rather than the Primary Urban Area owing to data limitations
Looking at GVA output per worker, although there is little difference in productivity between the city regions of the Northern Powerhouse, the average GVA output per worker is £44,850; 13 per cent behind the GB average, and 29 per cent behind that of London.
Figure 7: GVA per worker, 2013
Source: ONS, 2014. Regional, Sub-regional and Local Gross Value Added. BRES, Employment, 2013 data.
0
10
20
30
40
50
60
Tota
l GVA
Gro
wth
, 200
4-2
013
(%)
Lond
on
Nor
ther
n Po
wer
hous
e
Live
rpoo
l City
Reg
ion
Wes
t Yor
kshi
re C
ombi
ned
Aut
horit
y
Shef
field
Com
bine
d A
utho
rity
Hul
l City
Reg
ion
Nor
th E
ast C
ombi
ned
Aut
horit
y
Man
ches
ter C
ity R
egio
n
UK
0
10,000
20,000
30,000
40,000
50,000
60,000
70,000
GVA
per
wor
ker,
2013
(£)
Lond
on
Nor
ther
n Po
wer
hous
e
Live
rpoo
l City
Reg
ion
Wes
t Yor
kshi
re C
ombi
ned
Aut
horit
y
Shef
field
Com
bine
d A
utho
rity
Hul
l City
Reg
ion
Nor
th E
ast C
ombi
ned
Aut
horit
y
Man
ches
ter C
ity R
egio
n
Gre
at B
ritai
n
Northern Powerhouse Factsheet • June 2015 Centre for Cities
5
Jobs
The Northern Powerhouse contains 4.5 million jobs, accounting for 16 per cent of all Britain’s jobs. These jobs are not evenly spread across the region; 27 per cent of all jobs within the Northern Powerhouse are in Manchester City Region, and 22 per cent in West Yorkshire Combined Authority.
Figure 8: Share of all GB jobs, 2013
Source: NOMIS, 2015. BRES Public/private employment. 2013 data.
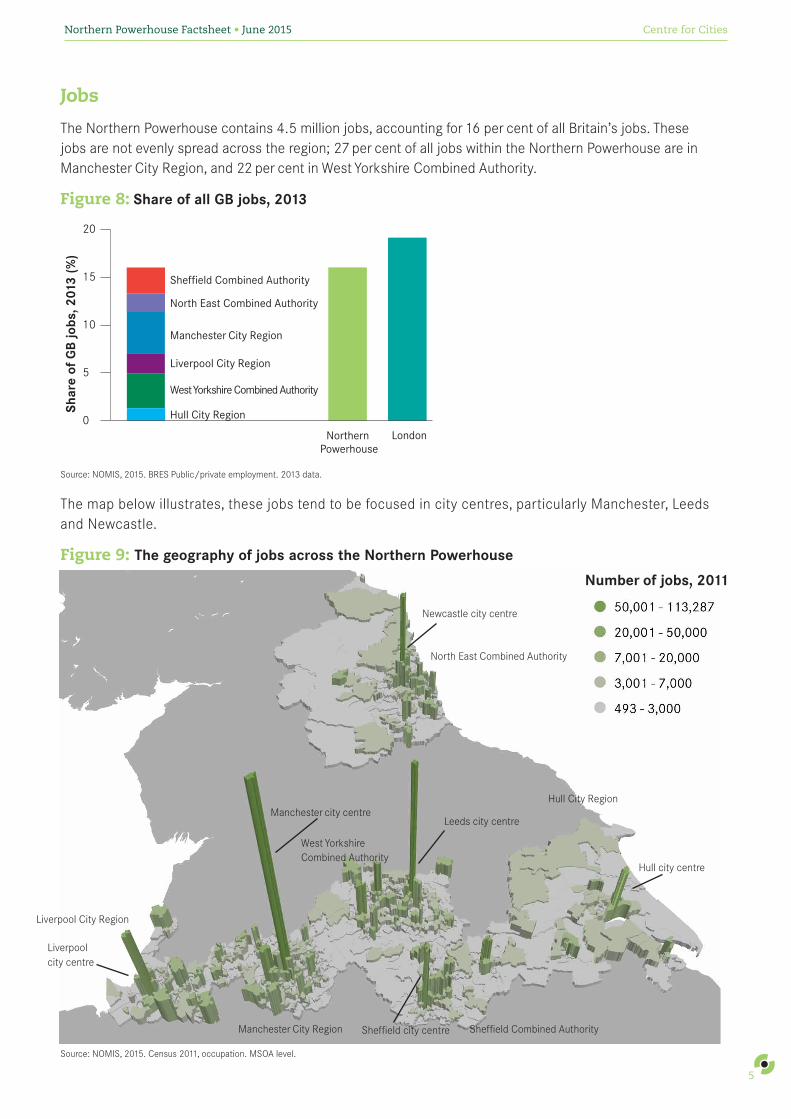
The map below illustrates, these jobs tend to be focused in city centres, particularly Manchester, Leeds and Newcastle.
Figure 9: The geography of jobs across the Northern Powerhouse
Source: NOMIS, 2015. Census 2011, occupation. MSOA level.
0
5
10
15
20
LondonNorthern Powerhouse
Liverpool City Region
West Yorkshire Combined Authority
Sheffield Combined Authority
North East Combined Authority
Manchester City Region
Hull City RegionShar
e of
GB
jobs
, 201
3 (%
)
North East Combined Authority
Leeds city centre
Hull City Region
West Yorkshire Combined Authority
Manchester City Region
Manchester city centre
Liverpool City Region
Hull city centre
Newcastle city centre
Liverpool city centre
Sheffield Combined AuthoritySheffield city centre
Number of jobs, 2011

Northern Powerhouse Factsheet • June 2015 Centre for Cities
6
Knowledge Intensity
20 per cent of all businesses in the Northern Powerhouse can be classed as knowledge intensive business services (KIBS), in comparison to London, where knowledge intensive businesses represent over 30 per cent of the total business base.
Figure 10: KIBS as share of all businesses, 2013
Source: NOMIS, 2015. ONS UK Business Counts – Enterprises, 2014 data. KIBS are defined based on 2007 SIC codes.
The same is true of jobs in KIBS. 12.7 per cent of all jobs in the Northern Powerhouse are in KIBS – in London, the figure is 24.3 per cent. However, significant differences can be observed between the city regions of the Northern Powerhouse – the share of jobs in KIBS in Manchester City Region is more than twice that of Hull City Region.
Figure 11: KIBS jobs as share of all jobs, 2013
Source: NOMIS, 2015. BRES Employment, 2013 data. KIBS are defined based on 2007 SIC codes.
0
5
10
15
20
25
30
35
KIB
S as
sha
re o
f all
busi
ness
, 201
3 (%
)
Lond
on
Nor
ther
n Po
wer
hous
e
Live
rpoo
l City
Reg
ion
Wes
t Yor
kshi
re C
ombi
ned
Aut
horit
y
Shef
field
Com
bine
d A
utho
rity
Hul
l City
Reg
ion
Nor
th E
ast C
ombi
ned
Aut
horit
y
Man
ches
ter C
ity R
egio
n
0
5
10
15
20
25
30
KIB
S as
sha
re o
f all
jobs
, 201
3 (%
)
Lond
on
Nor
ther
n Po
wer
hous
e
Live
rpoo
l City
Reg
ion
Wes
t Yor
kshi
re C
ombi
ned
Aut
horit
y
Shef
field
Com
bine
d A
utho
rity
Hul
l City
Reg
ion
Nor
th E
ast C
ombi
ned
Aut
horit
y
Man
ches
ter C
ity R
egio
n

Northern Powerhouse Factsheet • June 2015 Centre for Cities
7
Skills
The difference in the proportion of KIBS jobs in the Northern Powerhouse compared to London can be partly explained by the skill levels of their respective labour markets. 29 per cent of working age residents in the Northern Powerhouse are high-skilled, the same as Britain’s average; in London, that figure rises to 48 per cent.
Figure 12: Share of working age population with NVQ4+ qualifications, December 2014
Source: NOMIS, 2015, Annual Population Survey, December 2014 data.
Universities
The Northern Powerhouse is well catered for by higher education institutions. The region contains 23 universities, six of which rank in the top 20 for research excellence nationally.
Figure 13: Universities located in the Northern Powerhouse
0
10
20
30
40
50
60
Shar
e of
wor
king
age
pop
ulat
ion
wit
h N
VQ4+
qu
alifi
cati
ons,
Dec
201
4 (%
)
Lond
on
Nor
ther
n Po
wer
hous
e
Live
rpoo
l City
Reg
ion
Wes
t Yor
kshi
re C
ombi
ned
Aut
horit
y
Shef
field
Com
bine
d A
utho
rity
Hul
l City
Reg
ion
Nor
th E
ast C
ombi
ned
Aut
horit
y
Man
ches
ter C
ity R
egio
n
Gre
at B
ritai
n
!
!
!
!
!
! !
!!
!
!
!
!!
!
!
!!
!
!
!
!
!
!!
!Liverpool John Moores University
University of LiverpoolLiverpool School of Tropical Medicine
University of Northumbria at NewcastleUniversity of Newcastle upon Tyne
University of Durham
University of Sunderland
Liverpool Hope University
University of Bolton
Manchester MetropolitanUniversity
University of Salford
University of Manchester
University of Bradford
University of Huddersfield
Leeds Trinity University University of Leeds
Sheffield Hallam University
University of Sheffield
University of Hull
!
Liverpool Institute for Performing Arts
Royal Northern College of Music
!Leeds Beckett University
!
Leeds College of Music
!
!
!
!
!
3,976 - 5,454 (top 10 nationally)
2,578 - 3,975 (11-20)
1,856 - 2,577 (21-30)
1 - 908 (51-154)
909 - 1,855 (31-50)
Research score
! No score
! City centre
City region boundary
Note: The research score refers to the number of submissions made to the 2014 Research Excellence Framework that are of 4* (world leading) and 3* (internationally excellent) standard

Northern Powerhouse Factsheet • June 2015 Centre for Cities
© Centre for Cities 2014
Centre for CitiesEnterprise House
59 - 65 Upper GroundLondon SE1 9PQ
www.centreforcities.org
Centre for Cities is a registered charity (No 1119841) and a company limited by guarantee registered in England (No 6215397)
Figure 14: Research score of universities in the Northern Powerhouse
Research universities within the Northern Powerhouse National research score rank (/154)
University of Manchester 5
University of Leeds 9
University of Sheffield 13
Newcastle University 16
University of Durham 19
University of Liverpool 20
University of Hull 50
Manchester Metropolitan University 52
University of Northumbria at Newcastle 53
Liverpool John Moores University 62
Sheffield Hallam University 66
University of Huddersfield 67
University of Salford 68
University of Bradford 79
Leeds Beckett University 89
University of Sunderland 103
Liverpool Hope University 109
Liverpool School of Tropical Medicine 113
University of Bolton 128
Royal Northern College of Music 136
Leeds Trinity University 147
Source: REF, 2015. Research Excellence Framework Results. 2014 data.
Contact
For more information on the facts and figures within the Chancellor’s Northern Powerhouse, contact:
Elli Thomas Researcher [email protected] / 020 7803 4307
Or for press enquiries, contact:
Rita Beden External Affairs Manager [email protected] / 020 7803 4303