northern territory (in: understanding bushfire: trends in ... · kakadu national park in the north...
TRANSCRIPT
Northern Territory


3
Contents
Introduction 4
Geography 4
Climate 5
Native vegetation 6
Land use 7
Population 8
Bushfire regimes 8
Bushfire history 11
Fire services 11
Northern Territory Fire and Rescue Service analysis 12
Background about the NTFRS dataset and its analysis 12
Overview 14
Cause 14
Location 17
Timing 22
Area burned 29
Type of incident 32
Factors impacting on NTFRS fire frequencies 33
Summary 34
Sources of background information 35
Northern Territory
Understanding bushfire: trends in deliberate vegetation fires in Australia
4
The first part of this chapter provides contextual information on the Northern Territory, including basic information about its climate, geography, land use and population. It also provides an outline of the bushfire regimes, historically important bushfire events, and overview of fire services in the Northern Territory. The second part represents an analysis of data provided by the Northern Territory Fire and Rescue Service. Although that agency attends many types of fire incidents, this analysis refers only to vegetation fires.
For an explanation of the key terms, limitations and methodology refer to the introduction, glossary and methodology chapters.
Introduction
The Northern Territory is a sparsely populated area of mainland Australia, located in central Northern Australia. It is bounded by Western Australia to the west, Queensland to the east, and South Australia to the south.
Geography
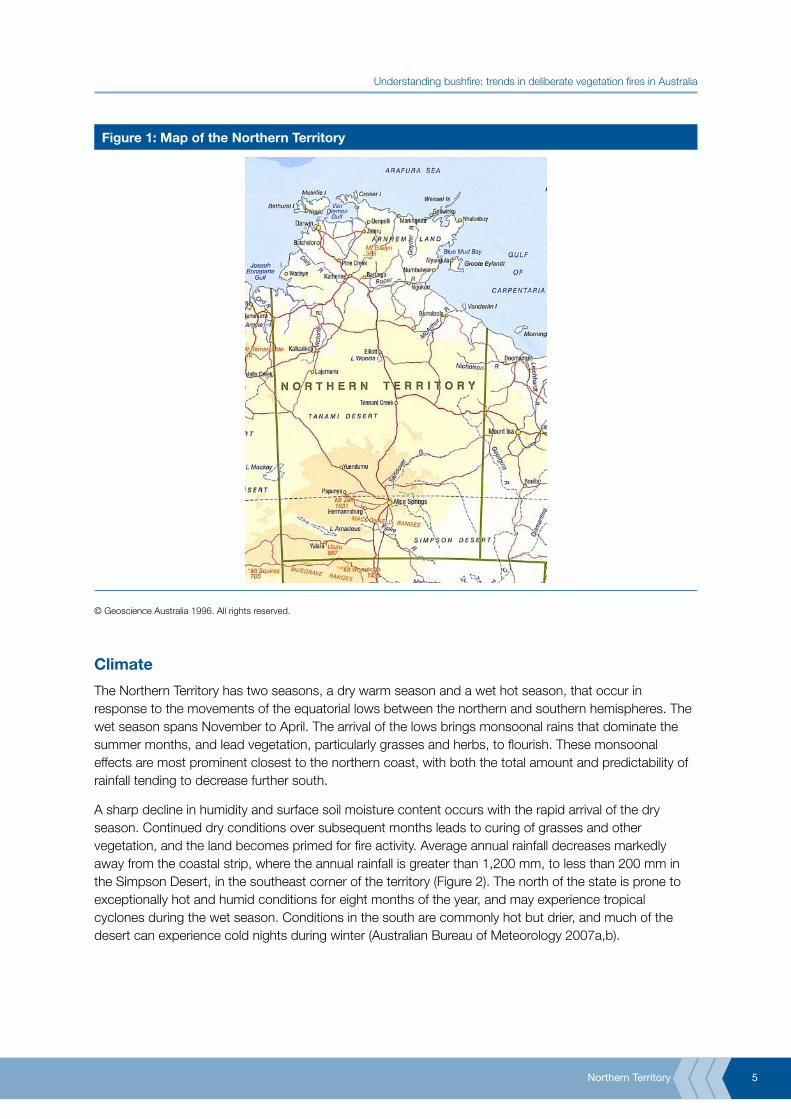
The territory’s northern coastline is flat, consisting of low headlands mostly fringed by mangrove swamps. Darwin, the capital of the Northern Territory, lies on this coastline in the northwest corner (Figure 1). Inland is the Arnhem Land Plateau, part of a low plateau that gradually rises southward towards the town of Tennant Creek. Further south lies the rocky landscape of the Macdonnell Ranges, the highest range in the Northern Territory. This range reaches a peak of 1,511 metres at Mount Zeil, representing the highest location in the Northern Territory. Alice Springs, a major regional centre, lies on an alluvial flood plain within these ranges. Further south lays the Simpson Desert.
Major river systems south of the central plateau include the Finke and Todd rivers. North of the plateau, the Victoria and Daly rivers drain to the Timor Sea, the Adelaide, Mary and South and East Alligator rivers drain to the Van Diemen Gulf, and the Roper and McArthur rivers flow east into the Gulf of Carpentaria.
Northern Territory
Understanding bushfire: trends in deliberate vegetation fires in Australia
5
Figure 1: Map of the Northern Territory
© Geoscience Australia 1996. All rights reserved.
Climate
The Northern Territory has two seasons, a dry warm season and a wet hot season, that occur in response to the movements of the equatorial lows between the northern and southern hemispheres. The wet season spans November to April. The arrival of the lows brings monsoonal rains that dominate the summer months, and lead vegetation, particularly grasses and herbs, to flourish. These monsoonal effects are most prominent closest to the northern coast, with both the total amount and predictability of rainfall tending to decrease further south.
A sharp decline in humidity and surface soil moisture content occurs with the rapid arrival of the dry season. Continued dry conditions over subsequent months leads to curing of grasses and other vegetation, and the land becomes primed for fire activity. Average annual rainfall decreases markedly away from the coastal strip, where the annual rainfall is greater than 1,200 mm, to less than 200 mm in the Simpson Desert, in the southeast corner of the territory (Figure 2). The north of the state is prone to exceptionally hot and humid conditions for eight months of the year, and may experience tropical cyclones during the wet season. Conditions in the south are commonly hot but drier, and much of the desert can experience cold nights during winter (Australian Bureau of Meteorology 2007a,b).

Northern Territory
Understanding bushfire: trends in deliberate vegetation fires in Australia
6
Figure 2: Average annual rainfall
Source: Australian Bureau of Meteorology 2007b © Australian Bureau of Meteorology
Native vegetation
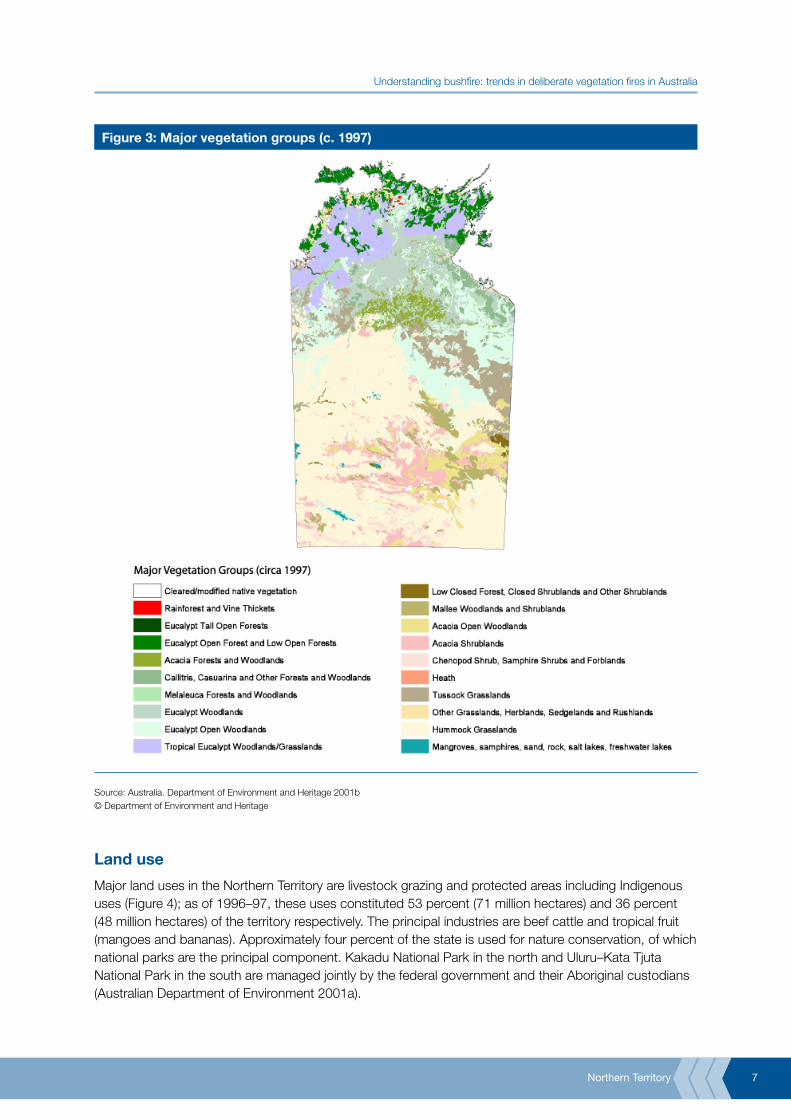
Changes in climate (from wet tropical in the north to arid in the south), landscape, and soils contribute to marked diversity in native vegetation across the territory. In the north the vegetation is typically tropical savanna (eucalypt woodland and eucalypt open woodland with a grassy understorey; Figure 3). Intense growth occurs during the wet season (summer). This landscape becomes quickly desiccated during the dry season, being subject to widespread fire activity. Unique tropical wetlands occur in the north (for example Kakadu National Park), being an important breeding area, habitat and refuge for a wide variety of species.
To the south, eucalypt woodlands transition into areas of melaleuca and acacia forests and woodlands, and further south into spinifex (hummock grasslands), mitchell grass (tussock grasslands) and acacia woodlands and shrublands. Around Alice Springs areas of mulga, mallee, chenopods, hummock grasslands, small pockets of eucalypt woodlands and salt lakes mark increased biodiversity (Australia. Department of Environment and Heritage 2001b).
Northern Territory
Understanding bushfire: trends in deliberate vegetation fires in Australia
7
Figure 3: Major vegetation groups (c. 1997)
Source: Australia. Department of Environment and Heritage 2001b © Department of Environment and Heritage
Land use
Major land uses in the Northern Territory are livestock grazing and protected areas including Indigenous uses (Figure 4); as of 1996–97, these uses constituted 53 percent (71 million hectares) and 36 percent (48 million hectares) of the territory respectively. The principal industries are beef cattle and tropical fruit (mangoes and bananas). Approximately four percent of the state is used for nature conservation, of which national parks are the principal component. Kakadu National Park in the north and Uluru–Kata Tjuta National Park in the south are managed jointly by the federal government and their Aboriginal custodians (Australian Department of Environment 2001a).

Northern Territory
Understanding bushfire: trends in deliberate vegetation fires in Australia
8
Figure 4: Land use (c. 1996–97)
Source: Australia. Department of Environment and Heritage 2001a © Department of Environment and Heritage
Population
As of June 2006, the resident population of the Northern Territory was 206,700, comprising 1.0 percent of Australia’s population (ABS 2006). The majority of people live in the three major urban areas of Darwin, Alice Springs and Palmerston. A further 7.8 percent of the territory’s population lives in Katherine, Nhulunbuy and Tennant Creek. As of 30 June 2001, approximately 13 percent of Australia’s Indigenous people lived in the Northern Territory, with more than one in four (29%) in the territory being of Indigenous origin.
As of 30 June 2005, the median age for the Northern Territory was 30.9 years; somewhat lower than the national average of 36.6 years. Children younger than 15 years comprised one-quarter (24.9%) of the Northern Territory population at 30 June 2005, the highest of any jurisdiction in Australia (ABS 2005a).
Bushfire regimes
This discussion of the bushfire regimes in the Northern Territory is restricted to the burning practices that dominate the tropical savannas, including not only the Top End (Northern Territory), but also the Kimberley (Western Australia) and Cape York (Queensland). Information has been sourced from Dyer et al. (2001), North Australia Fire Information (2007) and the Northern Territory Department of Natural Resources, Environment and the Arts (NRETA 2006a).

Northern Territory
Understanding bushfire: trends in deliberate vegetation fires in Australia
9
Few people are aware of the role, the process or the scale of burning (controlled and uncontrolled) that occurs in the tropical savannas of northern Australia. Bushfires are a ubiquitous feature of the Northern Territory dry season, with the territory having the most frequent, largest and more poorly documented vegetation fires of any part of the continent. When considering Northern Territory bushfires it is necessary to discard all preconceptions of size, frequency and even harm, based on southern vegetation fire regimes, as they are simply not translatable to the savannas that dominate Australia’s north.
Bushfire regimes (that is, intensity, size, patchiness, timing etc.) in the Northern Territory are intimately related to the territory’s unique (with respect to southern Australia) climate. Climate determines the timing and distribution of rainfall, but also commensurately the type and distribution of the vegetation, and the human occupants, whose fire management practices vary with their intended land use goals (for example, fuel reduction versus weed management).
Bushfire danger season: Bushfires occur during the dry season from March to December. The timing is dependent on the weather, fuel availability and the cause and probability of ignition; other factors govern how far and fast fires travel through the landscape. Ultimately, people play a pivotal role in fire activities in the tropical savannas. They are responsible for lighting the majority of vegetation fires, either accidentally or intentionally, may actively suppress fires in certain regions and, through land use, determine fuel loads and hence likelihood of occurrence and extent of bushfires.
Land management: Bushfires in the northern savannas reflect both natural and human influences. With regard to the latter, fire forms an essential component of both traditional and other land management practices. Vast tracts of land are burned across the territory every year by many different groups of people including:
Pastoralists• : The Northern Territory, Western Australia and northern Queensland contain large cattle stations that range in size from 300 to 12,000 square km. Burning is used to prevent wildfires, improve pasture, manage grazing, control weeds and enhance biodiversity. Fires are commonly suppressed in fire-prone areas to protect valuable grass resources for livestock.
Aboriginals• : Indigenous people have used burning practices for thousands of years to aid in hunting, communication, horticulture, ease of travel, and protection of sacred sites, serving social, cultural, spiritual as well as ecological needs.
Conservationists• : Northern Australia contains biodiverse habitats of world environmental significance. Fire management plays a significant role in managing the biodiversity of these lands.
Tourism operators• : Attraction to the unique nature of the territory, Kimberley and Cape York environments provides a flourishing tourism industry. Burning plays a significant role in managing major national parks and other attractions, including maintaining the biodiversity in these regions. A lack of understanding about the nature of fire activity in maintaining the savannas potentially leads to conflict over environmental management practices.
Defence personnel• : The federal Department of Defence has substantial holdings in the territory. Fire management of these lands is essential, particularly as the land is unstocked and therefore prone to high fuel loads building up. Fire risk is increased by use of incendiary devices.
Mining operators• : Although mining holdings are small, fire management is a significant component of both exploration and rehabilitation.
The timing and nature of controlled burning may vary between each of these groups depending not only on the goal (such as, fuel-reduction, weed control, access, hunting, maintaining biodiversity), but also on the climatic and environmental regime in which they are located. For example, in Kakadu, traditional Aboriginal burning typically began late in the wet season (March) and continued for nine to 10 months, with activity peaking in June–July, and relatively little burning occurred in August–September. Although often opportunistic (for example, a person ‘happened’ to be in the area), traditional burning practices are
Northern Territory
Understanding bushfire: trends in deliberate vegetation fires in Australia
10
complex and are conducted on a patchwork basis at specific times, to minimise escape and damage, and to prevent wildfires. Many fire agencies across the territory are now endeavouring to employ traditional burning practices, as this type of burning is less intense, and maintains more diverse habitats than do large hot fires.
Collectively, the majority of controlled burns occur early in the dry season, yielding a patchwork of burned and unburned country to minimise the risk of widespread intensive fires later in the dry season, or to yield a ‘green pick’ for livestock. Limited late dry season burning is used in some environment management practices. A failure to undertake fire management may result in infestations of non-native weeds and pastures, and a dangerous build-up of fuel reserves that are subsequently susceptible to burning by natural, accidental and deliberate fires. Large-scale natural fires typically occur late in the dry season, and are considered undesirable as they are commonly intense (hot), extensive, and likely to be more detrimental to flora and fauna.
Area burned: The frequency and area burned in any one year varies considerably. Nevertheless, by southern standards the total and the proportion of land burned in any given year is extraordinarily large. In the higher rainfall savanna woodlands of the northern Kimberley, the Top End and Cape York up to half of the total area may be burned either every year or every second year (Anderson 1996, Dyer et al. 2001, Press 1998, Russell-Smith et al. 1997). Many of these fires are intense and therefore pose the most danger in terms of their capacity to devastate populations of fire-sensitive native plants and animals, to be costly and disruptive to pastoral operations, and to pose a threat to communities and property. The frequency of fires tends to decrease further south for a number of reasons. They include reduced rainfall and therefore vegetation density, reduced grass reserves due to intensive use of these savannas for grazing, and greater efforts to suppress fires to prevent destruction of valuable fodder resources.
Although this discussion has focused on the savannas, many of the territory’s desert regions are also subject to significant burning (NRETA 2006a). Figure 5 illustrates the total area burned in desert regions between May 1999 and April 2004 for a tract of land to the west and southwest of Tennant Creek. The majority of this land has been burned at least once in this five-year period, with progressively smaller areas having been burned two or three times.
Intense fires commonly started by lightning strikes during particularly dry seasons have occurred throughout the Northern Territory’s modern history. The amounts of land burned in these events are extraordinary. The Council of Australian Governments report (Ellis, Kanowski & Whelan 2004) lists four major bushfire seasons in the territory since the late 1960s that collectively burned 168,000,000 ha. In 2002, approximately 38,000,000 ha burned in planned and unplanned fires. This represents 29 percent of the Northern Territory. In comparison, the January 2003 fires burned ‘only’ 226,000 ha in the Australian Capital Territory and 1,000,000 ha in Victoria.
Changes in fire regimes: Fire regimes have changed substantially since European occupation, with changes in land use and the nature and extent of fire management strategies. Active suppression of fires in semi-arid areas to prevent loss of highly valuable grass for livestock affects species that require fire to propagate or regenerate. It also appears that the frequency of intense, late dry season fires has increased in the wetter northern regions. These fires pose the greatest danger to the survival of fire sensitive flora and to fauna, and therefore to biodiversity in general. Furthermore, current fire regimes employed on traditional lands may differ from past traditional practices as people are no longer dispersed through the country and traditional knowledge has either been lost or has not been passed on to the current generation.
Changes in previously established patterns, whether through land management or, most pertinent to this discussion, the activity of arsonists can induce major environmental changes and loss of biodiversity. Intense fires are particularly damaging, resulting in a significant decrease in abundance and diversity across most faunal species.

Northern Territory
Understanding bushfire: trends in deliberate vegetation fires in Australia
11
Figure 5: Desert fires in central Australia, May 1999 to April 2004
Source: NRETA 2006b © NRETA 2006b
Bushfire history
Given the exceptionally large areas burned every year, and the comparatively recent timeframe over which these have been documented in detail, accurately documenting historical variations in the total area burned is somewhat problematic. Ellis and colleagues (2004) document four years (1968–69, 1969–70, 1974–75 and 2002) in which particularly large areas (approximately 40,000,000 ha) were burned (Table 1).
Table 1: Fire history of the Northern Territory
Date Area of fire (ha) Location(s)
1968–1969 40,000,000 Killarney–Top Springs
1969–1970 45,000,000 Dry River–Victoria River fire
1974–1975 45,000,000 Barkly Tableland, Victoria River district, near Newcastle Waters
2002 38,000,000
Source: Ellis, Kanowski & Whelan 2004
Fire services
Fire services in the Northern Territory include the Bushfires Council of the Northern Territory and the Northern Territory Fire and Rescue Service.
Fire management, in relation to land use planning and control functions outside major urban centres, is governed by the Bushfires Council of the Northern Territory, a statutory body established by the Bushfires Act, that is organisationally part of the territory’s Department of Natural Resources, Environment

Northern Territory
Understanding bushfire: trends in deliberate vegetation fires in Australia
12
and the Arts. Under the Act landowners in non-urban areas are able to burn their land except on fire ban days, in fire protection zones, and in fire danger areas. With the possible exception of some traditional burning practices, which may receive legal protection under various aspects of commonwealth, territory and common law (see for example, Hughes 1994), fires by non-landholders, or fires lit by landholders on fire ban days, in protected zones or fire danger areas are illegal. More information about the Bushfires Council of the Northern Territory can be found at: http://www.nt.gov.au/nreta/naturalresources/bushfires.
Fires in urban areas are the responsibility of the Northern Territory Fire and Rescue Service (NTFRS), which was established under the Fire Service Act 1983 (NT), and forms part of the Northern Territory Police, Fire and Emergency Services. The NTFRS incorporates ten stations based at Alice Springs, Casuarina, Darwin, Humpty Doo, Jabiru, Katherine, Nhulunbuy, Palmerston, Tennant Creek and Yulara. In addition, volunteer units are based throughout the state. The NTFRS incorporates 165 permanent, 54 paid auxiliary and 250 volunteer firefighters. Five volunteer brigades are located in the Darwin area, with further units stationed throughout the territory. These agencies are responsible for issuing permits to burn. Generally, permits are available from December to May depending on the prevailing weather conditions although permits are required all year round north of Katherine and no permits are allowed within the municipal boundaries of Darwin or Palmerston (NTFRS 2006).
The analysis undertaken in this report is based on data obtained from the NTFRS and includes all vegetation fires this service has documented for the period July 1999 to November 2004. It is necessarily dominated by vegetation fires that occurred in urban or semi-urban areas that fall within the jurisdiction of NTFRS stations; it does not include vegetation fires that volunteers attended in more remote areas of the territory. With the exception of the occasional fires the NTFRS attended, this report does not provide analysis of the frequency, total area burned or extent of illegal fire practices in more regional and remote areas of the territory; and the extent of incendiary and suspicious fires within the savannas and desert country remains largely unknown. Nevertheless, illegal and unnecessary fires have historically contributed to large areas burned in the tropical savannas. The Northern Territory Minister for Lands and Planning indicated that although lightning strikes and land management activities played a part in the 38.4 million ha burned in the territory in 2002, many fires were either deliberately lit or were due to careless actions of people travelling through the territory (Ellis, Kanowski & Whelan 2004).
Northern Territory Fire and Rescue Service analysis
Background about the NTFRS dataset and its analysis
Important information about the NTFRS dataset and the methodology employed to analyse it is summarised as:
The data were sourced from Northern Territory Fire and Rescue Service (NTFRS).•
The dataset provided only included vegetation (AIRS wildfires) fires. Hence, all references to fires in this •analysis refer to vegetation fires only. References to all fires and total fire frequencies refer to all vegetation fires irrespective of cause.
The fires documented occurred from 1999–2000 to November 2004.•
Fires within the database used AIRS variables, categories and codes.•
The cause of fires, defined for this analysis, is based on the ignition factor variable.•
Deliberate fires include all fires classified as incendiary (AIRS ignition factor code = 110 or 120) or •suspicious (AIRS ignition factor code = 210 or 220) within the ignition factor variable.

Northern Territory
Understanding bushfire: trends in deliberate vegetation fires in Australia
13
Natural fires include all fires where the ignition factor codes were 800 to 890, that is fires resulting from •any natural condition or event. The breakdown of specific causes within this variable included high wind, 33 percent; lightning, 41 percent; and any other natural condition (not classified or having insufficient information to classify further), 26 percent.
The dataset included information about the form of heat of ignition.•
Smoking-related fires were classified on the basis of:•
Form of heat of ignition = ‘Heat from smokers’ materials’ (AIRS codes 300 to 390).•
The causal classification of smoking-related fires was 56 percent accidental, 1.7 percent incendiary, •29 percent suspicious and 12 percent unknown.
All fires attributed to children, and discussed in the text, were non-deliberate and were classified as •accidental in origin. Deliberate fires started by children were classified as incendiary or possibly suspicious and hence cannot be delineated from other fires within these categories. Some information about the age of children was supplied but was incomplete.
Regions used in analysing territory fires were based on Australian Bureau of Statistics (2005b) tourism •regions. Fires were assigned to region using the suburb name provided. There was not an exact concordance between the suburb and tourism regions. The latter were defined based on statistical areas and may crosscut suburbs (although this was unlikely in the Northern Territory). In this study, assignation was based on the highest levels of concordance. Note that, although the term region is used, the data refer to vegetation fires that occur in major urban centres located within those regions.
Unlike other jurisdictions, the NTFRS analysis uses calendar not financial years, so as not to split what •is a contiguous bushfire season over two successive years.
The dataset provided included data about the area burned.•
No information was available about fire restrictions or fire danger index.•
For more detail about these methodologies see the methodology chapter.
Two significant factors that impinge upon the data may not be experienced, at least to the same degree, by other urban-based agencies in Australia. The factors are:
The large fires that occur throughout the tropical savannas, whether originating from natural •causes, land management activities, or traditional practices, may encroach on urban communities and hence be attended by the NTFRS. The inclusion of these large-scale fires has a marked impact on the total area burned in any year, but does not necessarily bare any relationship to the total area burned in any one year across the territory or the severity of the bushfire season in general.
Differences in cultural practices. Fire is central to Indigenous Australian’s way of life, having been •used to clear a camp, hunt, cook, and keep warm for thousands of years. Such practices that may be commonplace in regional and remote communities are commonly maintained when Indigenous Australian migrate into urban areas that fall under NTFRS jurisdiction. This necessarily impacts on the incidence and spatial and temporal distribution of fires documented in these areas. Cultural differences in the way these fires are perceived may influence the causal attributions made. For example, it is possible that some fires within the database may have been classified as deliberate (incendiary or suspicious), that would not be perceived as such by Indigenous people.

Northern Territory
Understanding bushfire: trends in deliberate vegetation fires in Australia
14
Overview
Fires the NTFRS attended in the review period are summarised as follows:
10,650 vegetation fires from July 1999 to November 2004. The greatest number occurred in 2001 and •2002, when 2,538 and 2,681 fires were attended respectively (Figure 6).
The fires primarily consisted of grass fires (47%), small vegetation fires (36%) and mixed scrub/bush/•grass fires (15%). The relative proportions of vegetation types varied between urban centres.
27 percent of fires were deliberate, but the cause of 67 percent of fires was unknown. Hence, •deliberate causes accounted for 81 percent of all cases where a cause was delineated. The proportion of unknown causes varied markedly between centres, hampering attempts to delineate regional differences in the extent of deliberate fire setting or to establish a definitive estimate of the rate in urban centres territory-wide.
Approximately 1,068,870 ha were burned in the vegetation fires the NTFRS documented. This does •not accurately reflect the total amount of area burned in the territory during the same interval. The temporal variations in the area burned do not necessarily reflect the severity of the bushfire season during that time.
The timing of fires varied markedly between urban centres, most likely reflecting both environmental •and social factors.
Cause
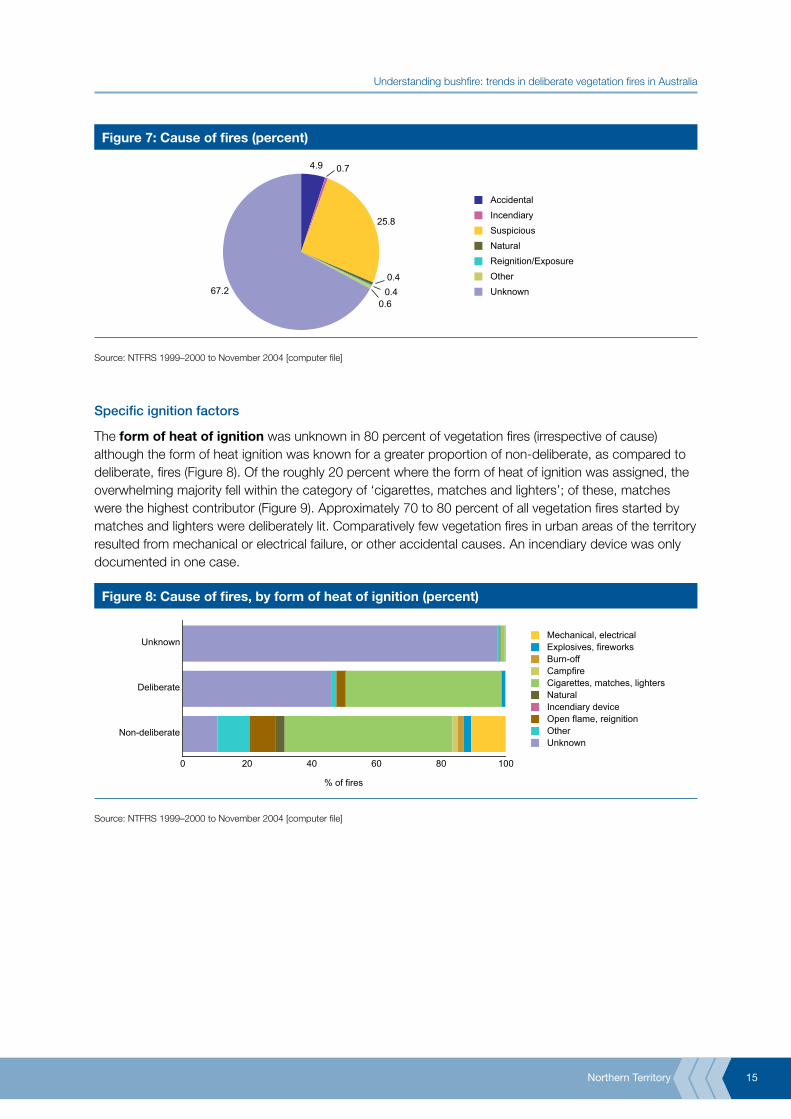
The cause of about two-thirds of NTFRS vegetation fires attended was unknown (Figure 7). Accidental causes were assigned definitively in 3.5 percent of cases, other causes to 2.8 percent of fires, and incendiary fires to 0.7 percent of fires. However, incendiarism was suspected in further 25.8 percent of cases, making it the single largest ‘known’ causal category. Combined deliberate causes (suspected and incendiary fires combined) accounted for 26.5 percent of all NTFRS attended vegetation fires, and accounted for 81 percent of all vegetation fires where a cause was allocated. The percentage of deliberate vegetation fires remained comparatively uniform throughout the review period, ranging from 24 to 31 percent in any given year.
Figure 6: Cause of fires each year (number)
0
500
1,000
1,500
2,000
2,500
3,000
1999 2000 2001 2002 2003 2004a
UnknownOtherReignition/ExposureNaturalSuspiciousIncendiaryAccidental
No.
of f
ires
% deliberate
0
10
20
30
% deliberate
a: data for 1999 and 2004, in this and all subsequent figures, was based on six and 11 months of data respectively
Source: NTFRS 1999–2000 to November 2004 [computer file]
Northern Territory
Understanding bushfire: trends in deliberate vegetation fires in Australia
15
Figure 7: Cause of fires (percent)
4.9 0.7
25.8
0.40.4
0.667.2
AccidentalIncendiarySuspiciousNaturalReignition/ExposureOtherUnknown
Source: NTFRS 1999–2000 to November 2004 [computer file]
Specific ignition factors
The form of heat of ignition was unknown in 80 percent of vegetation fires (irrespective of cause) although the form of heat ignition was known for a greater proportion of non-deliberate, as compared to deliberate, fires (Figure 8). Of the roughly 20 percent where the form of heat of ignition was assigned, the overwhelming majority fell within the category of ‘cigarettes, matches and lighters’; of these, matches were the highest contributor (Figure 9). Approximately 70 to 80 percent of all vegetation fires started by matches and lighters were deliberately lit. Comparatively few vegetation fires in urban areas of the territory resulted from mechanical or electrical failure, or other accidental causes. An incendiary device was only documented in one case.
Figure 8: Cause of fires, by form of heat of ignition (percent)
0 20 40 60 80 100
Non-deliberate
Deliberate
UnknownMechanical, electricalExplosives, fireworksBurn-offCampfireCigarettes, matches, lightersNaturalIncendiary deviceOpen flame, reignitionOtherUnknown
% of fires
Source: NTFRS 1999–2000 to November 2004 [computer file]

Northern Territory
Understanding bushfire: trends in deliberate vegetation fires in Australia
16
Figure 9: Specific forms of heat of ignition, for fires within the ‘smoking-related materials, lighters and matches’ category, by cause
0
500
1,000
1,500
Cigaret
te
Heat fr
om
smok
ers'
materia
ls Lighte
r
(flame t
ype)
Match
UnknownDeliberateNon-deliberate
No.
of f
ires
0
20
40
60
80
100
% deliberate
% deliberate
Source: NTFRS 1999–2000 to November 2004 [computer file]
Children less than 16 years old were implicated in accidentally (resulting from play) starting 63 vegetation fires (0.6% of all vegetation fires) in the territory between July 1999 and November 2004. This is unlikely to be an accurate reflection of the number of fires children started. Notably, if the intent was deemed malicious, fires started by children were classified as incendiary or suspicious within the ignition factor; that is, they were not delineated as a separate variable. The comparatively low number of child vegetation fires also reflects the fact that this classification requires physical evidence that a child was involved; for example, the child was seen at the location of fire at the time it started. Moreover, the cause of the vast majority of fires was unknown. Accidental child fires comprised 1.8 percent of causes were a cause was assigned in the ignition factor variable.
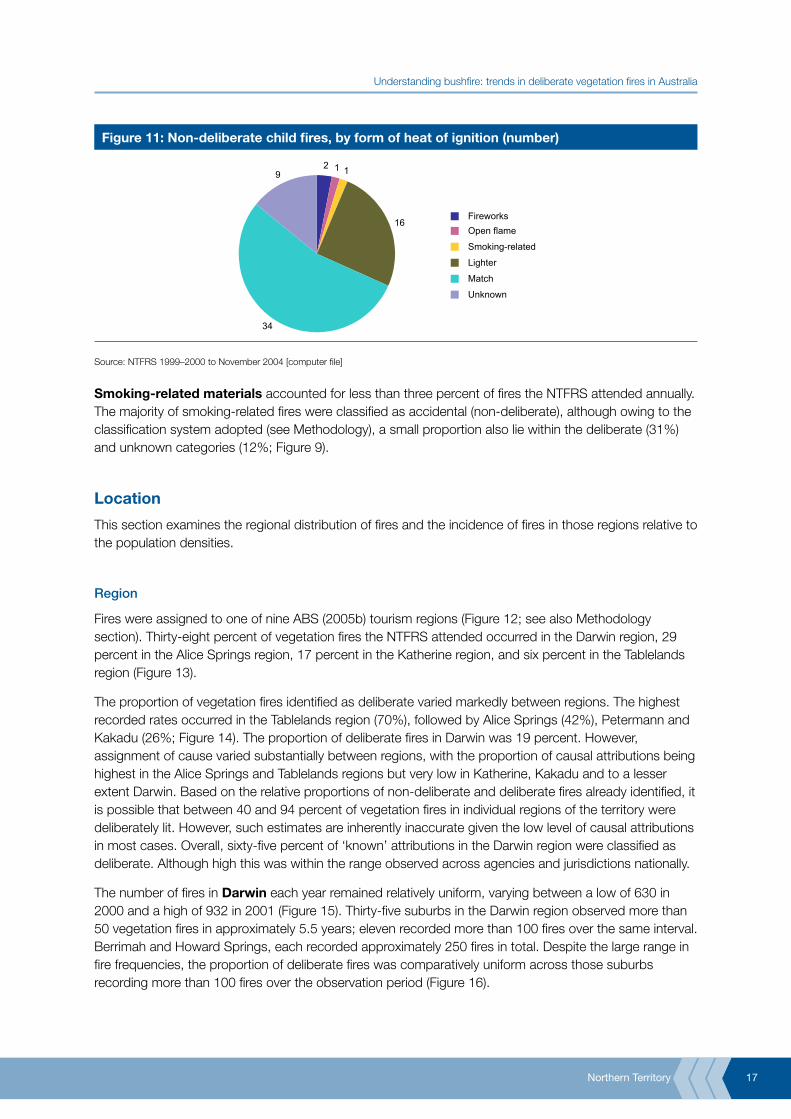
Typically, less than ten non-deliberate child fires occurred in any one year (Figure 10). The exception was 2003 when 27 vegetation fires were identified. The form of heat of ignition in the majority of cases was matches or lighters, with only one vegetation fire having been smoking-related (Figure 11).
Figure 10: Non-deliberate child fires, by year (number)
0
5
10
15
20
25
1999 2000 2001 2002 2003 2004
No.
of f
ires
Source: NTFRS 1999–2000 to November 2004 [computer file]
Northern Territory
Understanding bushfire: trends in deliberate vegetation fires in Australia
17
Figure 11: Non-deliberate child fires, by form of heat of ignition (number)
2 1 1
16
34
9
FireworksOpen flame
Smoking-related
Lighter
Match
Unknown
Source: NTFRS 1999–2000 to November 2004 [computer file]
Smoking-related materials accounted for less than three percent of fires the NTFRS attended annually. The majority of smoking-related fires were classified as accidental (non-deliberate), although owing to the classification system adopted (see Methodology), a small proportion also lie within the deliberate (31%) and unknown categories (12%; Figure 9).
Location
This section examines the regional distribution of fires and the incidence of fires in those regions relative to the population densities.
Region
Fires were assigned to one of nine ABS (2005b) tourism regions (Figure 12; see also Methodology section). Thirty-eight percent of vegetation fires the NTFRS attended occurred in the Darwin region, 29 percent in the Alice Springs region, 17 percent in the Katherine region, and six percent in the Tablelands region (Figure 13).
The proportion of vegetation fires identified as deliberate varied markedly between regions. The highest recorded rates occurred in the Tablelands region (70%), followed by Alice Springs (42%), Petermann and Kakadu (26%; Figure 14). The proportion of deliberate fires in Darwin was 19 percent. However, assignment of cause varied substantially between regions, with the proportion of causal attributions being highest in the Alice Springs and Tablelands regions but very low in Katherine, Kakadu and to a lesser extent Darwin. Based on the relative proportions of non-deliberate and deliberate fires already identified, it is possible that between 40 and 94 percent of vegetation fires in individual regions of the territory were deliberately lit. However, such estimates are inherently inaccurate given the low level of causal attributions in most cases. Overall, sixty-five percent of ‘known’ attributions in the Darwin region were classified as deliberate. Although high this was within the range observed across agencies and jurisdictions nationally.
The number of fires in Darwin each year remained relatively uniform, varying between a low of 630 in 2000 and a high of 932 in 2001 (Figure 15). Thirty-five suburbs in the Darwin region observed more than 50 vegetation fires in approximately 5.5 years; eleven recorded more than 100 fires over the same interval. Berrimah and Howard Springs, each recorded approximately 250 fires in total. Despite the large range in fire frequencies, the proportion of deliberate fires was comparatively uniform across those suburbs recording more than 100 fires over the observation period (Figure 16).

Northern Territory
Understanding bushfire: trends in deliberate vegetation fires in Australia
18
The number of fires in Alice Springs region was highly variable ranging between 266 in 2000 and 1,221 in 2002 (Figure 15). Although the number of fires in Alice Springs may be impacted the low and more erratic rainfall (Figure 2), social factors were likely to be the largest contributor to large variations in fire incidents. A similar trend was evident for the Petermann region (Figure 17), albeit at markedly lower frequencies. Vegetation fires in the Tablelands and Katherine regions occurred in or near the major urban centres of Tennant Creek and Katherine respectively. The total number of fires in the Tablelands region varied between 84 and 231 per year. The number of fires in Katherine was slightly more stable ranging between a low of 210 in 2004 (11 months only) and a high of 409 in 2002. Vegetation fires in Arnhem and Kakadu principally occurred near the mining towns of Nhulunbuy and Jabiru, respectively.
Approximately, three-quarters of accidental fires lit by children occurred in the Darwin region (Figure 18). The highest number of such incidents – four to six fires in 5.5 years – occurred at Knuckey Lagoon, Alice Springs, Moulden, and Tennant Creek.
Figure 12: Tourism regions of the Northern Territory
Port Keats
Jabiru
Alice Springs
Tennant Creek
Borroloola
Kings Canyon
Ti Tree
Galiwinku
Nhulunbuy
Alyangula
Katherine
Yulara
Daly Waters
Yuendumu
Tanami
Haasts Bluff
Wave Hill
Nguiu
Kilometres
0 300
Source: ABS 2005b © Australian Bureau of Statistics

Northern Territory
Understanding bushfire: trends in deliberate vegetation fires in Australia
19
Figure 13: Region (percent)
38.2
29.0
16.5
6.4
2.41.8 4.4
DarwinAlice SpringsKatherineTablelandsArnhemKakaduPetermann (0.8%)Daly (0.2%)Macdonnell (0.2%)Unknown
Source: NTFRS 1999–2000 to November 2004 [computer file]
Figure 14: Cause of fires, by region
0
1,000
2,000
3,000
4,000
Darwin
Alice S
pring
s
Katheri
ne
Table
lands
Unkno
wn
Arnhem
Kakad
u
Peterm
ann
Daly
Macdo
nnell
UnknownDeliberateNon-deliberate
No.
of f
ires
% deliberate
% deliberate
0
10
20
30
40
50
60
70
80
Source: NTFRS 1999–2000 to November 2004 [computer file]
Figure 15: Yearly variation in the number of fires in each region (number)
0
200
400
600
800
1,000
1,200
2000 2001 2002 2003 2004
DarwinMacdonnellPetermannKatherineDalyTablelandsArnhemKakaduAlice SpringsUnknown
No.
of f
ires
Source: NTFRS 1999–2000 to November 2004 [computer file]

Northern Territory
Understanding bushfire: trends in deliberate vegetation fires in Australia
20
Figure 16: Cause of fires by suburba, for Darwin region
0
50
100
150
200
250
300
Berrim
ah
Howard
Spring
sLu
dmilla
Humpty
Doo
East P
oint
Darwin
City
Darwin
Airport
Moulde
n
Brinkin
Cocon
ut
Grove Gun
n0
5
10
15
20
25
30
UnknownDeliberateNon-deliberate
No.
of f
ires
% deliberate
% deliberate
a: only includes suburbs that recorded in excess of 100 fires in the observation period
Source: NTFRS 1999–2000 to November 2004 [computer file]
Figure 17: Yearly variation in the number of fires for selected regions (number)
0
10
20
30
40
50
60
70
2000 2001 2002 2003 2004
MacdonnellPetermannDalyArnhemKakaduUnknown
No.
of f
ires
Source: NTFRS 1999–2000 to November 2004 [computer file]
Figure 18: Non-deliberate child-fires by region (percent)
76.2
4.8
1.6
6.4
1.6 7.9
1.6
DarwinPetermannKatherineTablelandsArnhemAlice SpringsUnknown
Source: NTFRS 1999–2000 to November 2004 [computer file]

Northern Territory
Understanding bushfire: trends in deliberate vegetation fires in Australia
21
Population analysis
All vegetation fires: The highest numbers of fires were associated with the largest urban centres, namely Darwin and Alice Springs. Nevertheless, there was poor correspondence between the total fire frequencies and population at a postcode level (r = .56). This may reflect the inherent difficulties of analysing urban fire statistics on a per person basis in the Northern Territory. The fire data only pertains to urban areas, but individual postcodes are geographically large, with fewer than 30 postcodes covering the entire Northern Territory, and many of those lie within the Darwin region. While postcodes in the Darwin region may be largely urban, postcodes in regional areas incorporate urban, rural and remote localities, each with very different population densities and inherent bushfire regimes. This may lead to limited correlation between the areas covered by each postcode and the jurisdiction of the NTFRS and there can be poor correlation between postcodes and regions (based on the ABS tourism region; see Methodology). Nevertheless, urban centres do account for the dominant proportion of the population within each postcode, and it is these centres to which the NTFRS data pertains.
The calculated number of fires per person per year for individual postcodes within the territory was among the most variable observed in any state or territory in Australia; varying between one and 380 fires per 10,000 people per year (Figure 19). Four postcodes were characterised by very low frequencies of fires relative to their population size; they were 0862, 0852, 0837 and 0846. High numbers of fires per person – relative to other postcodes with a similar population – occurred in four suburbs; 0860 (Tablelands), 0850 (Katherine), 0870 (Alice Springs), and 0828 (Darwin). Generally, the rates per person were equivalent to or marginally higher than the highest values observed for other jurisdictions.
Deliberate vegetation fires: The data indicate that between three and 260 deliberate fires per 10,000 people per year in individual postcodes were lit (Figure 20). The highest rates, 260 and 100 deliberate fires per 10,000 people, were recorded in the 0860 (Tablelands) and 0870 (Alice Springs) postcodes respectively. However, it is also necessary to take into account that the rates of ‘known’ attributions were generally higher (72% and 45% respectively) in these areas than in most Darwin postcodes where the cause of 20 to 40 percent was assigned for individual postcodes. The rate of deliberate fires per person per year observed in 0860 and 0870 were comparable to the highest rates observed in other jurisdictions, for postcodes with an equivalent population.
Comment: The territory was unique in that the highest frequencies of fires and deliberate fires per person occurred for regional rather than metropolitan postcodes. There were two possible contributing factors. One potentially relates to population distributions; the higher fire frequencies per person may partially manifest as a result of the lower levels of urbanisation in the territory. Notably, the proportion of the population in the territory living in an urban area is 73 percent. This compares to 80 to 90 percent in most other states, except Tasmania, where the levels of urbanisation are similar. In other states, except Western Australia, there was tendency for total vegetation fire frequencies per person to extend to higher levels in areas of lower urbanisation. The second and possibly more important factor, which is not of significance to many other parts of the country, probably relates to different cultural practices that take place in the territory. The continuance of traditional fire practices by Indigenous people moving from remote areas to urban centres necessarily impacts on the total fire frequencies observed in those centres. On a relative basis, this was of greater importance for smaller regional centres than it was for Darwin, and necessarily impacts on the total fire frequencies recorded for Alice Springs, Katherine and other regional centres. In instances where there may have been differences in the cultural perceptions of fire, there will inevitably be a flow-on effect for the number of recorded deliberate fires. Active efforts have been introduced to take these cultural differences into account (see below), and this will affect subsequent fire statistics.

Northern Territory
Understanding bushfire: trends in deliberate vegetation fires in Australia
22
Figure 19: Relationship between total fire frequency and population in individual postcodes (number)
1
10
100
100 1,000 10,000 100,000
Darwin
Katherine
Tablelands
Daly-Kakadu
Arnhem
Alice Springs
Population
Fire
s pe
r 10,
000
pers
ons
per y
ear
Source: NTFRS 1999–2000 to November 2004 [computer file]; ABS 2004. Population by post office area, 2001 [computer file]
Figure 20: Relationship between deliberate fire frequency and population in individual postcodes (number)
1
10
100
1,000 10,000 100,000
Population
Del
iber
ate
fires
per
10
,000
per
sons
per
yea
r
Darwin
Katherine
Tablelands
Daly-Kakadu
Arnhem
Alice Springs
Source: NTFRS 1999–2000 to November 2004 [computer file]; ABS 2004. Population by post office area, 2001 [computer file]
Timing
The timing of fires is examined by week of the year, day of the week and time of the day.
Week of the year
Overall, fire frequency increased sharply in early to mid March and remained high until mid October, before again decreasing rapidly, as the wet season arrived. This trend was present irrespective of the cause of the fire (Figure 21).
The week of the year that NTFRS-attended fires most commonly occurred varied from year to year, both in terms of the peak intensity, the length of time for which peak intensities were maintained, and the timing at which fire frequencies increased and decreased. Higher frequencies consistently occurred between May and mid October, but considerable variations were evident in fire frequencies in March and April (Figure 22). The bushfire season in 2000 in the territory started comparatively later (approximately week 20), whereas in 2001 and 2003 substantial increases in fire frequency occurred in week 15. In the

Northern Territory
Understanding bushfire: trends in deliberate vegetation fires in Australia
23
devastating year of 2002, fire numbers increased sharply in February and had peaked by week 12 to 13. The timing of the cessation of the bushfire season was more consistent across seasons. That is, the beginning of the wet arrived more consistently than the beginning of the dry season, at least in some parts of the territory.
The trends illustrated in Figure 22 are an aggregation of fires from across the state for the same year. The reality is that the arrival of the dry and wet seasons and the predictability of rainfall varied across the territory.
The timing of the bushfire season in the Darwin region was relatively similar across all seasons. Fire numbers increased rapidly at approximately week 17 (late April), commonly peaked mid season, with fire frequencies steadily dropping to negligible levels, particularly from mid October onwards (Figure 23). In contrast, the timing of fires by week of the year in Alice Springs was erratic (Figure 24). The number of fires commonly increased from May to October in 2001 – the cooler months – but in 2002, the number of fires peaked in April and decreased over subsequent months. In all cases, the total fire frequencies were erratic from week to week. In 2002, Alice Springs experienced additional spikes in fire frequencies outside the conventional bushfire danger season, including in January–February. Greater variability in the distribution of fires in the Alice Springs region, as compared with Darwin, may be facilitated by the dryer climate and more erratic rainfall, but may also reflect social differences. For example, there may be fundamentally different reasons that the majority of people in Alice Springs light fires, as compared with Darwin.
The distribution of vegetation fires in the Katherine region differed from that encountered in both Darwin and Alice Springs. In three out of five seasons in Katherine, there was a very rapid increase in the number of fires at the beginning of the bushfire danger season, and on average, the frequency of fires decreased as the season progressed (Figure 25). There was clearly a markedly earlier beginning to the bushfire season in 2002, but the number of fires occurring in any one week did not differ significantly from other seasons. The total number of fires was lower in 2000 and 2004 than in other bushfire danger seasons in the recording period, and the there was no rapid increase in fire frequencies, rather erratic spikes in fire frequency occurred throughout the year (Figure 26).
Accidental fires attributed to children under the age of 16 dominantly occurred during the bushfire season (Figure 27). The greatest number (n=9) occurred during week 27, typically coincident with school holidays.
Figure 21: Week of the yeara, by cause (number)
0
50
100
150
200
250
300
4 8 12 16 20 24 28 32 36 40 44 48 52
Non-deliberateDeliberateUnknown
Week of the year
No.
of f
ires
a: week 1 corresponds to the first week of the calendar year
Source: NTFRS 1999–2000 to November 2004 [computer file]

Northern Territory
Understanding bushfire: trends in deliberate vegetation fires in Australia
24
Figure 22: Week of the year (all fires), by year (number)
0
20
40
60
80
100
120
140
4 8 12 16 20 24 28 32 36 40 44 48 52
20002001200220032004
Week of the year
No.
of f
ires
Source: NTFRS 1999–2000 to November 2004 [computer file]
Figure 23: Week of the year (all fires), by year for the Darwin region (number)
0
10
20
30
40
50
60
70
80
4 8 12 16 20 24 28 32 36 40 44 48 52
20002001200220032004
Week of the year
No.
of f
ires
Source: NTFRS 1999–2000 to November 2004 [computer file]
Figure 24: Week of the year (all fires), by year for the Alice Springs region (number)
0
10
20
30
40
50
60
70
4 8 12 16 20 24 28 32 36 40 44 48 52
20002001200220032004
Week of the year
No.
of f
ires
Source: NTFRS 1999–2000 to November 2004 [computer file]

Northern Territory
Understanding bushfire: trends in deliberate vegetation fires in Australia
25
Figure 25: Fires in the Katherine region, by week of the year (all fires) 2001 to 2003 (number)
0
5
10
15
20
25
4 8 12 16 20 24 28 32 36 40 44 48 52
200120022003
Week of the year
No.
of f
ires
Source: NTFRS 1999–2000 to November 2004 [computer file]
Figure 26: Fires in the Katherine region, by week of the year (all fires) for 2000 and 2004 (number)
0
5
10
15
20
25
4 8 12 16 20 24 28 32 36 40 44 48 52
2000
2004
Week of the year
No.
of f
ires
Source: NTFRS 1999–2000 to November 2004 [computer file]
Figure 27: Non-deliberate child fires, by week of the year (number)
0
2
4
6
8
10
2 6 10 14 18 22 26 30 34 38 42 46 50
Week of the year
No.
of f
ires
Source: NTFRS 1999–2000 to November 2004 [computer file]

Northern Territory
Understanding bushfire: trends in deliberate vegetation fires in Australia
26
Day of the week
Overall, there was a slight tendency for higher numbers of fires to occur on Saturday and Sunday than on weekdays; the numbers of fires on Sundays were comparable to those observed during the week, whereas fire frequencies on Saturdays were about 14 percent higher than the weekday average.
However, marked differences were observed in the distribution of fires throughout the week across major urban centres in the territory. Darwin was characterised by the most pronounced ‘weekend effect’, with 13 to 16 percent more fires occurring on both Saturday and Sunday relative to the weekday average. This was reflected for both fires of unknown causes and deliberate causes, but not for non-deliberate fires (Figure 28). In contrast, fire frequencies in Alice Springs increased across the week for both unknown and deliberate causes, but the number of non-deliberate fires remained stable throughout the week (Figure 29). The different patterns observed between Darwin and Alice Springs likely reflected the different social ‘timetables’ of people within these regions, with fires in Alice Springs being less governed by routines of school or work.
Accidental fires attributed to children younger than 16 years of age were only slightly more frequent on weekends than on weekdays.
Figure 28: Day of the week, by cause, Darwin region (number)
0
100
200
300
400
500
Sun Mon Tue Wed Thur Fri Sat
Non-deliberateDeliberateUnknownN
o. o
f fire
s
Source: NTFRS 1999–2000 to November 2004 [computer file]
Figure 29: Day of the week, by cause, Alice Springs region (number)
0
50
100
150
200
250
300
Sun Mon Tue Wed Thur Fri Sat
Non-deliberateDeliberateUnknownN
o. o
f fire
s
Source: NTFRS 1999–2000 to November 2004 [computer file]
Northern Territory
Understanding bushfire: trends in deliberate vegetation fires in Australia
27
Time of the day
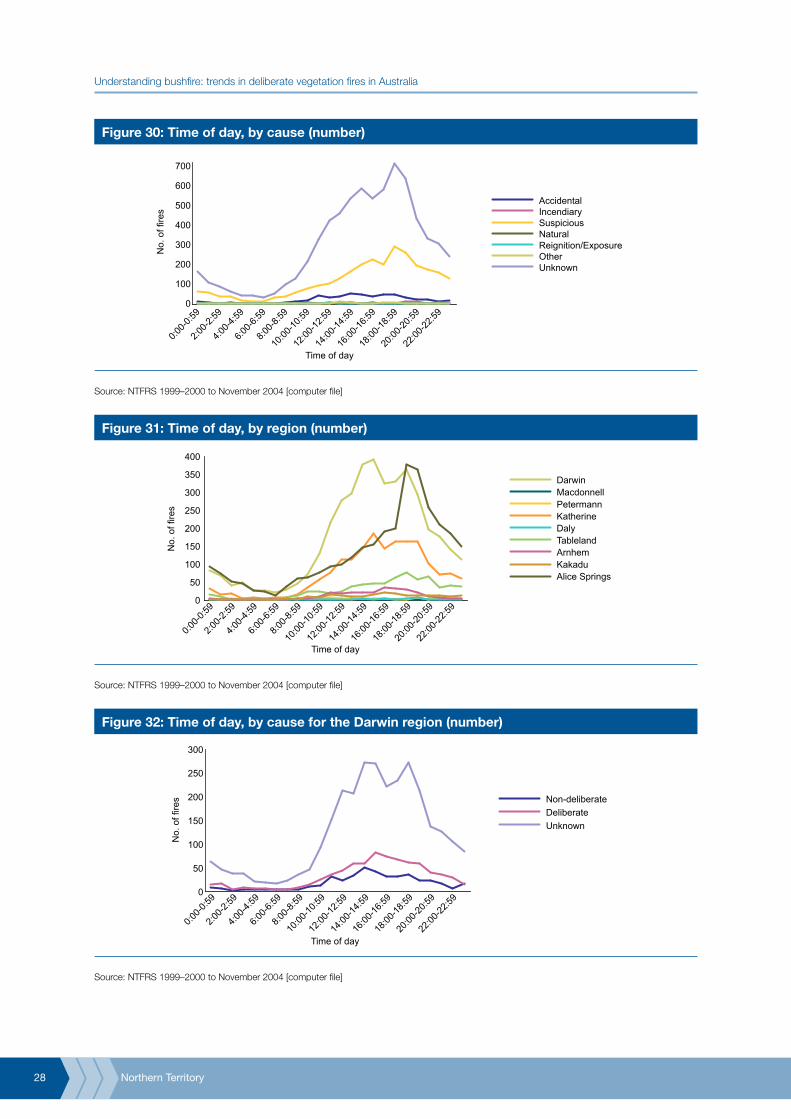
Most vegetation fires occurred between 11 am and 6 pm, but subtle differences were evident depending on the cause of ignition (Figure 30). The number of accidental fires rose sharply between 9 and 11 am, plateau until roughly 7 pm, before sharply declining over the next couple of hours (Figure 30). In contrast, suspicious fires peaked at 6 to 7 pm. The highest incidence of incendiary fires occurred between 7 and 9 pm. It was not uncommon to see a discrepancy between the times at which the highest number of deliberate and non-deliberate fires occurred. However, in both instances the peak number of fires occurred at a slightly later time than in most other jurisdictions.
Approximately 45 percent of all vegetation fires in the territory occurred between the hours of 6 pm and 6 am. This was more notable for incendiary and suspicious causes, where 59 and 52 percent of such fires, respectively, occurred within that timeframe. Approximately, 22 percent of incendiary and 17 percent of suspicious fires occurred between the hours of 10 pm and 4 am.
However, these trends represent an agglomeration of fires from across the territory. In reality the temporal distribution of fires varied markedly between the major urban centres (Figure 31).
In Darwin, fire numbers peaked between midday and 8 pm (Figure 31). This trend occurred for non-deliberate, deliberate and unknown fires alike, although the peak in deliberate fires may have been marginally later than for non-deliberate fires (Figure 32). Despite 38 percent of all fires in Darwin occurred between 6 pm and 6 am, only 12 percent occurred between 10 pm and 4 am and there was little evidence for a distinct night-time peak. There was comparatively little difference in the timing of fires in Darwin on different days of the week and there was insufficient data to accurately assess how the timing of deliberate fires differed from that of other causes based on day of the week (Figure 33). Possible trends include:
increased deliberate fires early in the afternoon on Sunday (1 to 4 pm)•
higher frequencies of deliberate fires on Tuesday and Sunday nights between 7 and 9 pm•
lower incidences of deliberate fires after 6 pm on Monday nights•
a distinct late-night peak, at around 11 pm, on Saturday night.•
Alice Springs: That there were different ‘timetables’ for people who lit fires in Alice Springs and Darwin was clearly reflected in the different timings of vegetation fires in these regions (Figure 31). In Alice Springs the total vegetation fire frequencies increased slowly throughout daylight hours, rose sharply between 6 and 7 pm, sharply decreased between 8 and 9 pm, and declined throughout the night, reaching a minimum at around 6 am. This general pattern occurred for both deliberate and unknown fires, but was not evident for non-deliberate fires, implying that many of the fires classified as deliberate or unknown have a common origin. This general pattern occurred on most days of week (with subtle variations) with the exception of Sunday, when generally lower fire frequencies were reported from 5 pm onwards (Figure 34). The large spike in fire frequencies between 6 and 9 pm is consistent with a high frequency of fires pertaining to domestic activities, including fires that are used for both cooking and warmth during the winter months.
If this was the case, it not then surprising that approximately 60 percent of all fires in the Alice Springs region occurred between the hours of 6 pm and 6 am. Twenty percent of all fires occurred between 10 pm and 4 am. The lack of any substantive increases in deliberate fires on Friday night–Saturday morning and Saturday night–Sunday morning is consistent with the lack of increased numbers of fires in Alice Springs on weekends generally.
Other areas: Peak frequencies of fires in Katherine and the Tablelands occurred at 4 to 7 pm and 6 to 10 pm respectively. The timing of fires in the Tablelands regions appears to be most similar to that occurring in the Alice Springs region.
Northern Territory
Understanding bushfire: trends in deliberate vegetation fires in Australia
28
Figure 30: Time of day, by cause (number)
0
100
200
300
400
500
600
700
0:00-0
:59
2:00-2
:59
4:00-4
:59
6:00-6
:59
8:00-8
:59
10:00
-10:59
12:00
-12:59
14:00
-14:59
16:00
-16:59
18:00
-18:59
20:00
-20:59
22:00
-22:59
AccidentalIncendiarySuspiciousNaturalReignition/ExposureOtherUnknown
No.
of f
ires
Time of day
Source: NTFRS 1999–2000 to November 2004 [computer file]
Figure 31: Time of day, by region (number)
0
50
100
150
200
250
300
350
400
DarwinMacdonnellPetermannKatherineDalyTablelandArnhemKakaduAlice Springs
0:00-0
:59
2:00-2
:59
4:00-4
:59
6:00-6
:59
8:00-8
:59
10:00
-10:59
12:00
-12:59
14:00
-14:59
16:00
-16:59
18:00
-18:59
20:00
-20:59
22:00
-22:59
No.
of f
ires
Time of day
Source: NTFRS 1999–2000 to November 2004 [computer file]
Figure 32: Time of day, by cause for the Darwin region (number)
0
50
100
150
200
250
300
Non-deliberateDeliberateUnknown
0:00-0
:59
2:00-2
:59
4:00-4
:59
6:00-6
:59
8:00-8
:59
10:00
-10:59
12:00
-12:59
14:00
-14:59
16:00
-16:59
18:00
-18:59
20:00
-20:59
22:00
-22:59
No.
of f
ires
Time of day
Source: NTFRS 1999–2000 to November 2004 [computer file]

Northern Territory
Understanding bushfire: trends in deliberate vegetation fires in Australia
29
Figure 33: Time of day, by day of the week, for fires (all causes) in the Darwin region (number)
0
10
20
30
40
50
60
70
80
SundayMondayTuesdayWednesdayThursdayFridaySaturday
0:00-0
:59
2:00-2
:59
4:00-4
:59
6:00-6
:59
8:00-8
:59
10:00
-10:59
12:00
-12:59
14:00
-14:59
16:00
-16:59
18:00
-18:59
20:00
-20:59
22:00
-22:59
No.
of f
ires
Time of day
Source: NTFRS 1999–2000 to November 2004 [computer file]
Figure 34: Time of day, by day of the week, for deliberate fires in the Alice Springs region (number)
0
5
10
15
20
25
30
SundayMondayTuesdayWednesdayThursdayFridaySaturday
0:00-0
:59
2:00-2
:59
4:00-4
:59
6:00-6
:59
8:00-8
:59
10:00
-10:59
12:00
-12:59
14:00
-14:59
16:00
-16:59
18:00
-18:59
20:00
-20:59
22:00
-22:59
No.
of f
ires
Time of day
Source: NTFRS 1999–2000 to November 2004 [computer file]
Area burned
Data pertaining to the area burned was available for 49 percent of fires. Overall, the number of fires of a given size decreased with increasing area burned (Figure 35); 90.5 percent of all fires were less than one hectare, and 96.6 percent of fires were less than 10 ha.
There appears to be a relationship between the frequency of a particular fire cause and the ‘likelihood’ that it exceeded a certain size; that is, the greater the frequency of that cause overall, the greater the number of larger fires (Figure 35). With the exception of one accidental fire resulting from the inadequate control of an open flame that burned 25,000 ha and one fire resulting from the re-kindling of a previous fire which burned 2,000 ha, all fires of ‘known’ cause burning in excess of 500 ha were suspicious in origin. The distribution of fires in the Northern Territory differs subtly from that observed in most other jurisdictions, as the proportion of deliberate fires within an area burned category actually increased (as opposed to decreased) within increasing area burned (Figure 36). This may reflect the fact that this database does not include many of the large natural fires and prescribed burns that occurred throughout the territory.

Northern Territory
Understanding bushfire: trends in deliberate vegetation fires in Australia
30
Approximately 1,068,870 ha burned in NTFRS-attended fires between July 1999 and November 2004. The overwhelming majority of this area was burned in 2000 (Figure 37). During this year two fires, one deliberate (classified suspicious) and one of unknown cause, burned 400,000 and 500,000 ha respectively. These two fires dominate the statistics pertaining to the area burned by specific causes. Notably, deliberate fires accounted for 49 percent of the total area burned (Figure 38). The total area burned by deliberate fires continued to decrease since 2000. The proportion of total area burned by deliberate fires also decreased, from 50 and 90 percent in 2000 and 2001 respectively, to less than 10 percent from 2002 to 2004 (incomplete).
Some caution is required in extrapolating the trends defined by the NTFRS data due to the situation in the Northern Territory at large. In fact, the NTFRS area burned data is unlikely to bear much resemblance to territory-wide trends during the same interval. For example, more than 80 percent of the total area burned in NTFRS-controlled areas occurred in the two greater than 100,000 ha fires in the Tablelands region during 2000, giving the appearance that 2000 was the most significant fire year. However, 38,000,000 ha burned in the territory in 2002 (Ellis, Kanowski & Whelan 2004). While not as extensive, the NTFRS subset of fires are important from the perspective that these fires occurred in close proximity to residential or other urban spaces.
Although the size distribution of fires within individual regions typically followed the trends observed in Figure 36, it is noted that fires occurring in the Darwin, Alice Springs and Katherine regions were comparatively small, with the largest fires in each of these regions being 2,000, 1,000 and 300 ha respectively (Figure 39). Fires in the Alice Springs and Katherine regions accounted for a decreasing proportion of NTFRS fires within each category as fire size increased. The majority of large fires (1,000 ha or more) occurred in the Tablelands region, including the only fires to exceed 100,000 ha.
Figure 35: Area burned category, by cause (number)
<11-1
.992-2
.993-3
.994-4
.995-9
.99
10-49
.950
-99
100-4
99
500-9
99
1,000
-1,49
9
2,000
-4,99
9
5,000
-9,99
9
10,00
0-49,9
99
50,00
0-99,9
99
>100
,000
AccidentalIncendiarySuspiciousNaturalReignition/ExposureOtherUnknown
Area burned category (ha)
No.
of f
ires
1
10
100
1,000
10,000
Source: NTFRS 1999–2000 to November 2004 [computer file]

Northern Territory
Understanding bushfire: trends in deliberate vegetation fires in Australia
31
Figure 36: Area burned category, by cause (percent)
0
20
40
60
80
100
UnknownOtherReignition/ExposureNaturalSuspiciousDeliberateAccidental
<11-1
.992-2
.993-3
.994-4
.995-9
.99
10-49
.950
-99
100-4
99
500-9
99
1000
-1499
2000
-4999
5000
-9999
10,00
0-49,9
99
50,00
0-99,9
99
>100
,000
Area burned category (ha)
% o
f fire
s
Source: NTFRS 1999–2000 to November 2004 [computer file]
Figure 37: Area burned each year, by cause
0
200,000
400,000
600,000
800,000
1,000,000
2000 2001 2002 2003 20040
20
40
60
80
100
UnknownDeliberateNon-delib.
Tota
l are
a bu
rned
(ha)
% deliberate
% area burned by deliberate fires
Source: NTFRS 1999–2000 to November 2004 [computer file]
Figure 38: Area burned, by cause (percent)
2.8
49.2
48.1
Non-deliberate
Deliberate
Unknown
Source: NTFRS 1999–2000 to November 2004 [computer file]

Northern Territory
Understanding bushfire: trends in deliberate vegetation fires in Australia
32
Figure 39: Area category, by cause (percent)
0
20
40
60
80
100
DarwinMacdonnellPetermannKatherineDalyTablelandArnhemKakaduAlice SpringsUnknown
<11-1
.992-2
.993-3
.994-4
.995-9
.99
10-49
.950
-99
100-4
99
500-9
99
1,000
-1,49
9
2,000
-4,99
9
5,000
-9,99
9
10,00
0-49,9
99
50,00
0-99,9
99
>100
,000
Area burned category (ha)
% o
f fire
s
Source: NTFRS 1999–2000 to November 2004 [computer file]
Type of incident
Almost 47 percent of the vegetation fires the NTFRS attended were grass fires with a further 36 percent being small vegetation fires less than one hectare (Figure 40). Another 15 percent occurred in mixed bush, scrub and grass settings. Only 0.4 percent of fires occurred in forests or woodland. Small vegetation fires comprised between one-third and one-half of all vegetation fires in the Darwin, Daly, Kakadu, and Alice Springs regions (Figure 41). Grassfires where the dominant type of incident in both the Katherine and Macdonnell regions, whereas mixed scrub/bush/grass fires featured more strongly in the Petermann, Tableland, Arnhem and Kakadu regions. Other types of fire incidents comprised small or negligible percentages of vegetation fires in all regions. Given the above, it is not surprising that the overwhelming majority of fires occurred in vegetation types classified as either savannah or grassland, where the vegetation type was identified in the database (62.3% of cases; Figure 42).
Figure 40: Incident type (percent)
46.6
36.2
14.7
1.7
Forest or wood (>1 ha; 0.4%)
Grain, crop (0.1%)
Grass fire
Orchard, vineyard, nursery (0.4%)
Scrub, bush, grass mix
Small vegetation fire
Vegetation-other outside fire
Source: NTFRS 1999–2000 to November 2004 [computer file]

Northern Territory
Understanding bushfire: trends in deliberate vegetation fires in Australia
33
Figure 41: Region, by incident type (percent)
0
20
40
60
80
100
Darwin
Macdo
nnell
Peterm
ann
Katheri
ne Daly
Table
land
Arnhem
Kakad
u
Alice S
pring
s
Unkno
wn
Grain, cropOrchard, vineyard, nurseryForest, woodsGrass fireScrub, bush, mixed grassSmall vegetation fireOther vegetation
% o
f fire
s
Source: NTFRS 1999–2000 to November 2004 [computer file]
Figure 42: Fires in each vegetation type (percent)
27.2
25.7
4.62.3
37.7 Savannah
Grasslands
Other
Native sclerophylious
Native forest, rainforest (0.8%)
Orchards and vineyard (0.7%)
Plantation: hardwood (0.4%)
Native forest, conifers (0.3%)
Heathlands, scrub (0.1%)
Crops (0.1%)
Mallee (0.1%)
Unknown
Source: NTFRS 1999–2000 to November 2004 [computer file]
Factors impacting on NTFRS fire frequencies
The NTFRS has subsequently undertaken a number of initiatives to reduce the overall incidence of vegetation fires in areas within their jurisdiction. Hazard abatement has included hazard reduction burns on Crown lands, enforcement of firebreak legislation, encouragement of rural landowners to reduce the fuel loading on the properties through face-to-face meetings, community forums at the commencement of the fire season and a combined approach to fire reduction by both the NTFRS and Bushfires NT. The benefits of this approach are seen as effectively changing the community’s cultural attitude towards fire in the territory. This is considered the prime reason for the reduction from 3,400 vegetation fire per annum four or five years ago to just 1,300 in 2005–06 (NTFRS, personal communication).
Another key initiative has been development of partnerships between fire agencies, the local town council, Indigenous groups and other government agencies to specifically address issues about problematic fires in Indigenous communities. Note that this does not include ‘comfort fires’. In acknowledging the unique cultural importance of fire in Indigenous communities the Northern Territory Fire and Emergency Act permits use of small fires for cooking and for keeping warm on cold nights (outside of periods of fire bans or fire warning); no permit to burn is required by anyone to light a comfort fire.

Northern Territory
Understanding bushfire: trends in deliberate vegetation fires in Australia
34
Summary
The most important points regarding urban vegetation fires in the Northern Territory are summarised below:
The NTFRS attended 10,650 vegetation fires from July 1999 to November 2004; the highest •frequency of vegetation fires occurred in 2002, followed by 2001.
Twenty-seven percent of vegetation fires were deliberate (0.7% incendiary; 25.8% suspicious), with the •cause of 67.2 percent of fires being unknown. Hence, deliberate fires comprised 81 percent of known causes. The percentage of deliberate fires annually remained uniform.
Thirty-eight percent of all vegetation fires NTFRS attended occurred in Darwin; 39 percent were in •Alice Springs with a further 17 percent in Katherine. Variations in the percentage of deliberate vegetation fires largely occurred between regions (2 to 70%) principally reflected differing levels of causal attributions.
There was no direct correlation between the total number of vegetation fires or number of deliberate •vegetation fires and population. The incidence of fires ranged between one and 380 fires per 10,000 fires per year, with four postcodes in the Tablelands, Katherine, Alice Springs and Darwin regions recording the highest rates.
Vegetation fires principally occurred from March to October. However, the timing of increases in fire •frequencies at the beginning of the dry season was less systematic than the decrease in vegetation fire numbers at the beginning of the wet season. The timing (week of the year) of vegetation fires was highly predictable in Darwin (close to the coast) but very unpredictable in Alice Spring (far from the coast). The distribution of fires throughout the season varied subtly between bushfire season in the Darwin, and to a lesser extent Katherine region, but varied markedly for Alice Springs.
Substantive differences, based on the day of week and detection time that vegetation fires occurred, •were apparent between urban centres. In the Darwin region vegetation fires were 13 to 16 percent more prevalent on both Saturday and Sunday, with the majority of fires occurring between midday and 8 pm. In Alice Springs, vegetation fires were not more likely to occur on a weekend, and the fire numbers peaked between 7 and 8 pm. Notably, 60 percent of vegetation fires in Alice Springs occurred between 6 pm and 6 am with 20 percent of all vegetation fires occurring between 10 pm and 4 am. Subtle variations also occurred between the timing of vegetation fires in other centres.
Marked differences in the distribution of vegetation fires in Darwin and Alice Springs likely reflect •fundamentally different social patterns and possibly the dominant purposes of fire in these regions.
The types of incidents attended included grassfires (47%), small vegetation fires (36%) and mixed •scrub/bush/grass fires (15%).
During the observation period 1,068,870 ha were burned in NTFRS vegetation fires, principally •reflecting contributions from two large fires in the Tablelands region.
Ninety percent of vegetation fires were less than one hectare; fires of suspicious origin were the •principal known cause of fires in excess of 500 ha. Deliberate fires accounted for half of the total area burned. Fires of unknown cause burned the majority of the remainder.
Specific ignition factors are summarised as:•
Subtle differences were evident in the most predominant form of heat of ignition between deliberate –and non-deliberate vegetation fires. Most smoking-related fires were non-deliberate, whereas 70 to 80 percent of vegetation fires attributed to matches and lighters were either incendiary or suspicious in origin.
Less than three percent of vegetation fires were identified as smoking related. –
Non-deliberate fires started by children 16 years and younger accounted for 0.6 percent of all –vegetation fires. Almost three-quarters of these occurred in the Darwin region.

Northern Territory
Understanding bushfire: trends in deliberate vegetation fires in Australia
35
Sources of background information
ABS 2006. Australian demographic statistics. ABS cat. no. 3101.0. http://www.abs.gov.au/ausstats/[email protected]/cat/3101.0
ABS 2005a. Population by age and sex, Northern Territory Australia. ABS cat. no. 3235.7.55.001. http://www.abs.gov.au/ausstats/[email protected]/cat/3235.7.55.001
ABS 2005b. Tourism region maps and concordance files, Australia, 2005. ABS cat. no. 9503.0.55.001. http://www.abs.gov.au/ausstats/[email protected]/cat/9503.0.55.001
Australia. Department of Environment and Heritage 2001a. Land use: Northern Territory. Accessed through: http://audit.deh.gov.au/ANRA/atlas_home.cfm
Australia. Department of Environment and Heritage 2001b. Native vegetation types and extent: Northern Territory. Accessed through: http://audit.deh.gov.au/ANRA/atlas_home.cfm
Australian Bureau of Meteorology 2007a. Average minimum and maximum temperature maps: Northern Territory. Accessed through: http://www.bom.gov.au/climate/map/temperature/IDCJCM0005_temperature.shtml
Australian Bureau of Meteorology 2007b. Average rainfall, annual: Northern Territory. Accessed through: http://www.bom.gov.au/cgi-bin/climate/cgi_bin_scripts/annual-monthly-rainfall.cgi
Dyer R et al. 2001. Savanna burning: understanding and using fire in northern Australia. Darwin: Tropical Savannas CRC
Ellis S, Kanowski P & Whelan R 2004. National Inquiry into Bushfire Mitigation and Management. Canberra: Commonwealth of Australia. http://www.coagbushfireenquiry.gov.au/findings.htm
Hughes C. 1994. Fire management in the Northern Territory post-Mabo: the legal basis for Aboriginal burning. In D Rose (ed), Country in flames: proceedings of the 1994 symposium on biodiversity and fire in North Australia. Biodiversity series, paper no. 3. Biodiversity Unit, Department of the Environment, Sport and Territories and the North Australia Research Unit, ANU. http://www.environment.gov.au/biodiversity/publications/series/paper3/fire8.html
NAFI 2007. North Australia fire information 2007. http://www.firenorth.org.au/nafi/app/init.jsp
NRETA 2006a. Bushfires NT: bushfire operations. http://www.nt.gov.au/nreta/naturalresources/bushfires/
NRETA 2006b. Bushfires NT: bushfire research. http://www.nt.gov.au/nreta/naturalresources/bushfires/research/desertfire.html
NTFRS 2006. Our people. http://www.pfes.nt.gov.au/index.cfm?fuseaction=page&p=272&m=37
