northland power investor presentation
TRANSCRIPT
Investor Presentation
September 2012
1
Forward Looking Information Disclaimer
This written and accompanying oral presentation contains certain forward‐looking statements which are provided for the purpose of presenting information about management’s current expectations and plans. Readers are cautioned that such statements may not be appropriate for other purposes. Forward‐looking statements include statements that are predictive in nature, depend upon or refer to future events or conditions, or include words such as “expects,” “anticipates,” “plans,” “believes,” “estimates,” “intends,” “targets,” “projects,” “forecasts” or negative versions thereof and other similar expressions, or future or conditional verbs such as “may,” “will,” “should,” “would” and “could.” These statements may include, without limitation, statements regarding future EBITDA, cash flows and dividend payments, the construction, completion, attainment ofcommercial operations, cost and output of development projects, plans for raising capital, and the operations, business, financial condition, priorities, ongoing objectives, strategies and outlook of Northland and its subsidiaries. This information is based upon certain material factors or assumptions that were applied in developing the forward looking statements includingbased upon certain material factors or assumptions that were applied in developing the forward‐looking statements, including the design specifications of development projects, the provisions of contracts to which Northland or a subsidiary is a party, management’s current plans, its perception of historical trends, current conditions and expected future developments, as well asother factors that are believed to be appropriate in the circumstances.
Although these forward‐looking statements are based upon management’s current reasonable expectations and assumptions, they are subject to numerous risks and uncertainties. Some of the factors that could cause results or events to differ from current expectations include, but are not limited to, construction risks, counterparty risks, operational risks, the variability of revenues from generating facilities powered by intermittent renewable resources and the other factors described in the “Risks and Uncertainties” section of Northland’s 2011 Annual Report and 2011 Annual Information Form, which are both filed electronically at www.sedar.com and Northland’s website www.northlandpower.ca. Northland’s actual results could differ materially from th d i i li d b th f d l ki t t t d di l b i th t f ththose expressed in, or implied by, these forward‐looking statements and, accordingly, no assurances can be given that any of theevents anticipated by the forward‐looking statements will transpire or occur. The forward‐looking statements contained in this presentation are based on assumptions that were considered reasonable at time of delivery. Other than as specifically required by law, Northland undertakes no obligation to update any forward‐looking statements to reflect events or circumstances after such date or to reflect the occurrence of unanticipated events, whether as a result of new information, future events or results, or otherwise
2
or otherwise.
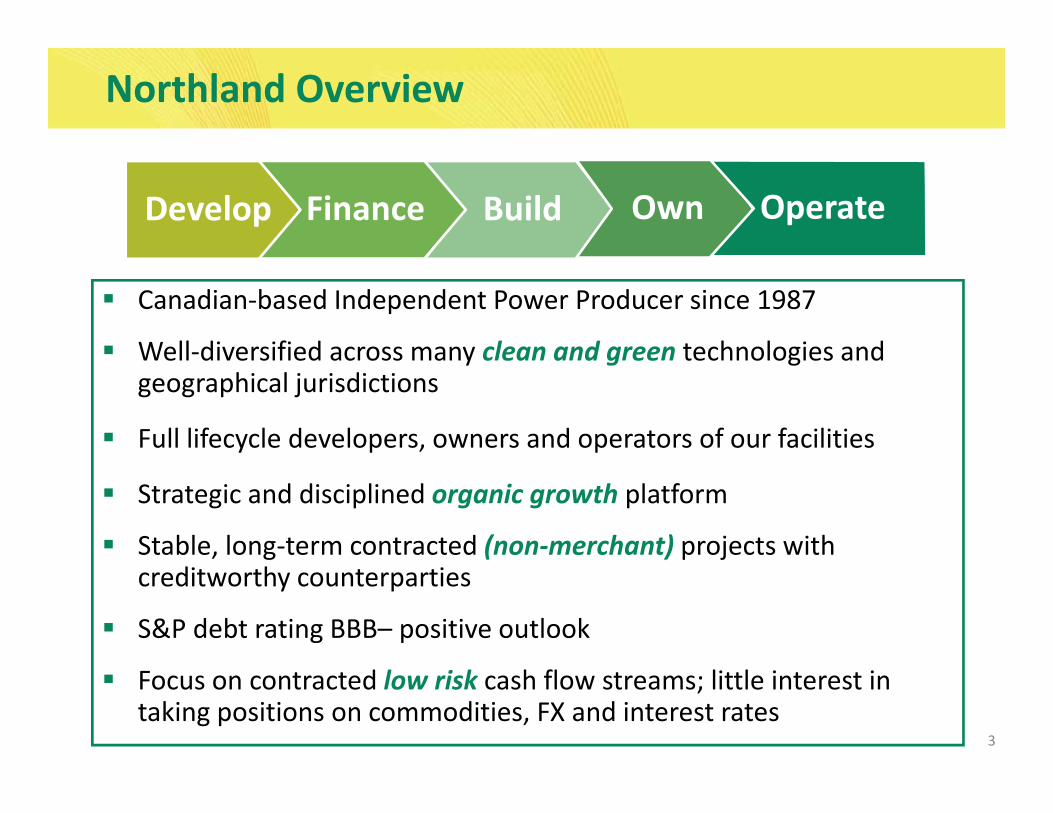
Northland Overview
Develop Build Own OperateFinance
Canadian‐based Independent Power Producer since 1987
Well‐diversified across many clean and green technologies andWell diversified across many clean and green technologies and geographical jurisdictions
Full lifecycle developers, owners and operators of our facilities
Strategic and disciplined organic growth platform
Stable, long‐term contracted (non‐merchant) projects with creditworthy counterparties
S&P debt rating BBB– positive outlook
3
Focus on contracted low risk cash flow streams; little interest in taking positions on commodities, FX and interest rates
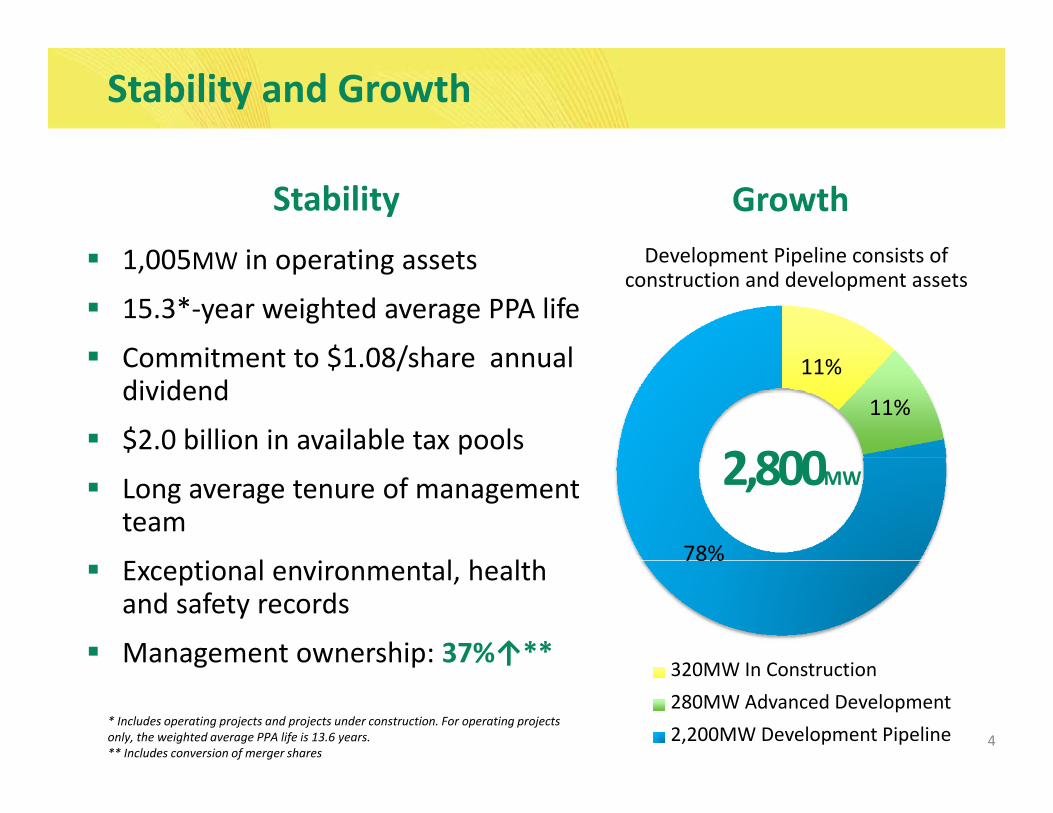
Stability and Growth
Stability
1 005MW i ti t
GrowthDevelopment Pipeline consists of1,005MW in operating assets
15.3*‐year weighted average PPA life
Commitment to $1 08/share annual
Development Pipeline consists of construction and development assets
Commitment to $1.08/share annual dividend
$2.0 billion in available tax pools
11%
11%
2800Long average tenure of management team
i l i l h l h78%
2,800MW
Exceptional environmental, health and safety records
Management ownership: 37%↑**
78%
320MW I C i
4
g p ↑
* Includes operating projects and projects under construction. For operating projects only, the weighted average PPA life is 13.6 years.** Includes conversion of merger shares
320MW In Construction280MW Advanced Development2,200MW Development Pipeline
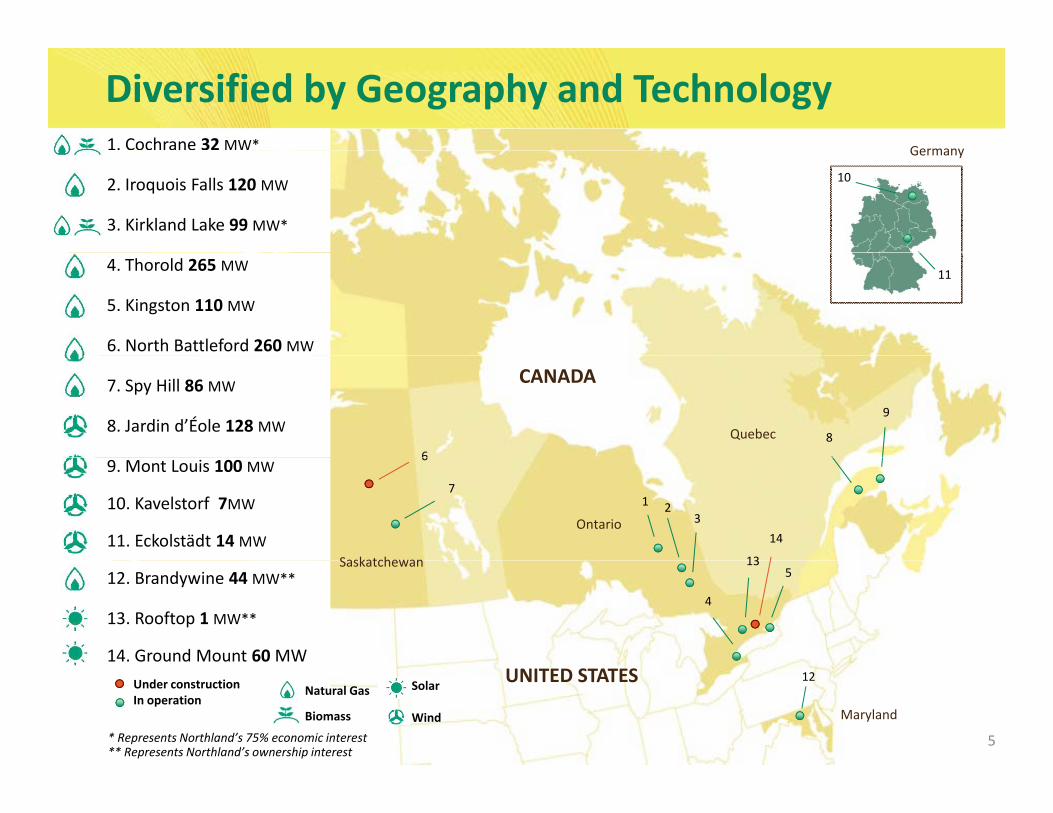
Diversified by Geography and Technology1. Cochrane 32 MW* Germany
2. Iroquois Falls 120 MW
3. Kirkland Lake 99 MW*
Germany
10
4. Thorold 265 MW
5. Kingston 110 MW
6. North Battleford 260 MW
11
7. Spy Hill 86 MW
8. Jardin d’Éole 128 MW Quebec 8
9
6
CANADA
9. Mont Louis 100 MW
10. Kavelstorf 7MW
11. Eckolstädt 14 MWSaskatchewan
Ontario
1 23
13
6
7
14
12. Brandywine 44 MW**
13. Rooftop 1 MW**
14. Ground Mount 60MW
Saskatchewan
4
513
5
Maryland
Under constructionIn operation
12
* Represents Northland’s 75% economic interest** Represents Northland’s ownership interest
Natural Gas
Biomass
Solar
Wind
UNITED STATES
5
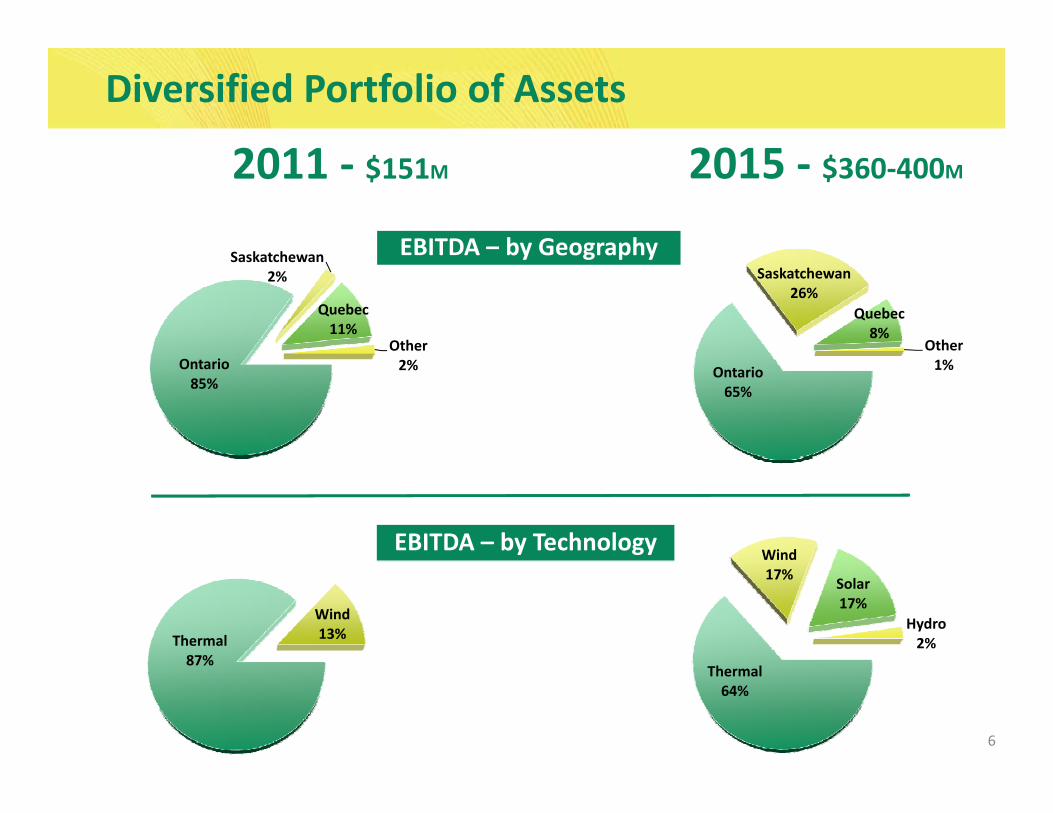
Diversified Portfolio of Assets
2011 2015
S k t h EBITDA – by Geography
2011 ‐ $151M 2015 ‐ $360‐400M
Saskatchewan2%
Quebec11%
Other
Saskatchewan26%
Quebec8%
Other
EBITDA by Geography
Ontario85%
2% Ontario65%
1%
Wind EBITDA – by Technology
Thermal87%
Wind 13%
17% Solar17%
Hydro2%
6
87%Thermal64%
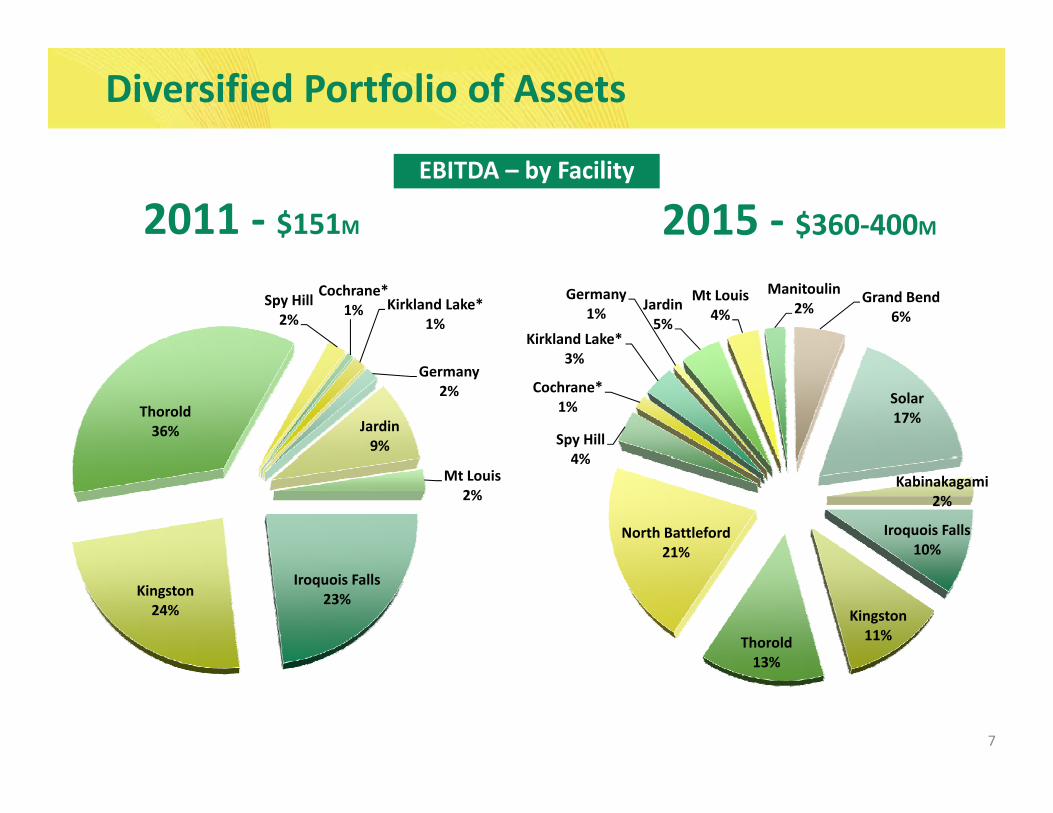
Diversified Portfolio of Assets
EBITDA – by Facility
2011 ‐ $151M 2015 ‐ $360‐400MSpy Hill2%
Cochrane*1% Kirkland Lake*
1%Kirkland Lake*
3%
Germany1% Jardin
5%
Mt Louis4%
Manitoulin2%
Grand Bend6%
Thorold36%
Germany2%
Jardin9% Spy Hill
4%
Cochrane*1%
3%
Solar17%
Mt Louis2%
Iroquois Falls10%
North Battleford21%
4%Kabinakagami
2%
Iroquois Falls23%Kingston
24% Kingston11%Thorold
13%
7
13%
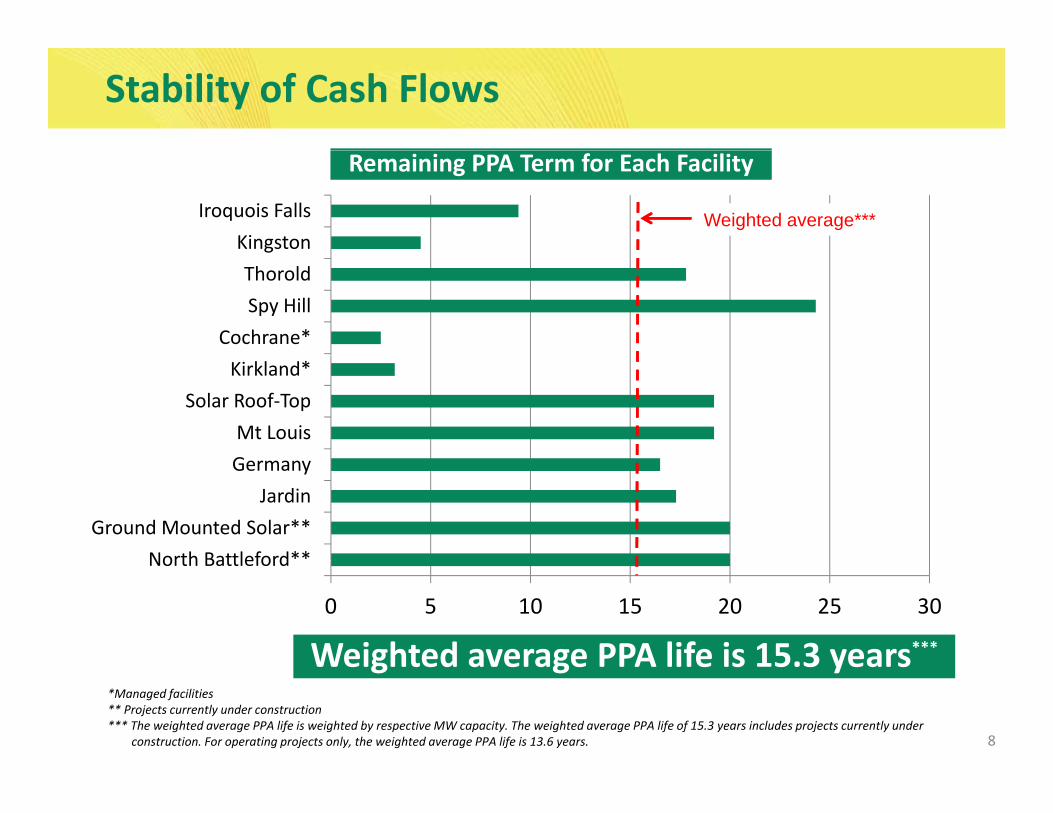
Stability of Cash Flows
KingstonIroquois Falls
Remaining PPA Term for Each Facility
Weighted average***
Cochrane*Spy HillThorold
GMt Louis
Solar Roof‐TopKirkland*
North Battleford**Ground Mounted Solar**
JardinGermany
Weighted average PPA life is 15.3 years***0 5 10 15 20 25 30
North Battleford
8
Weighted average PPA life is 15.3 years*Managed facilities** Projects currently under construction*** The weighted average PPA life is weighted by respective MW capacity. The weighted average PPA life of 15.3 years includes projects currently under
construction. For operating projects only, the weighted average PPA life is 13.6 years.
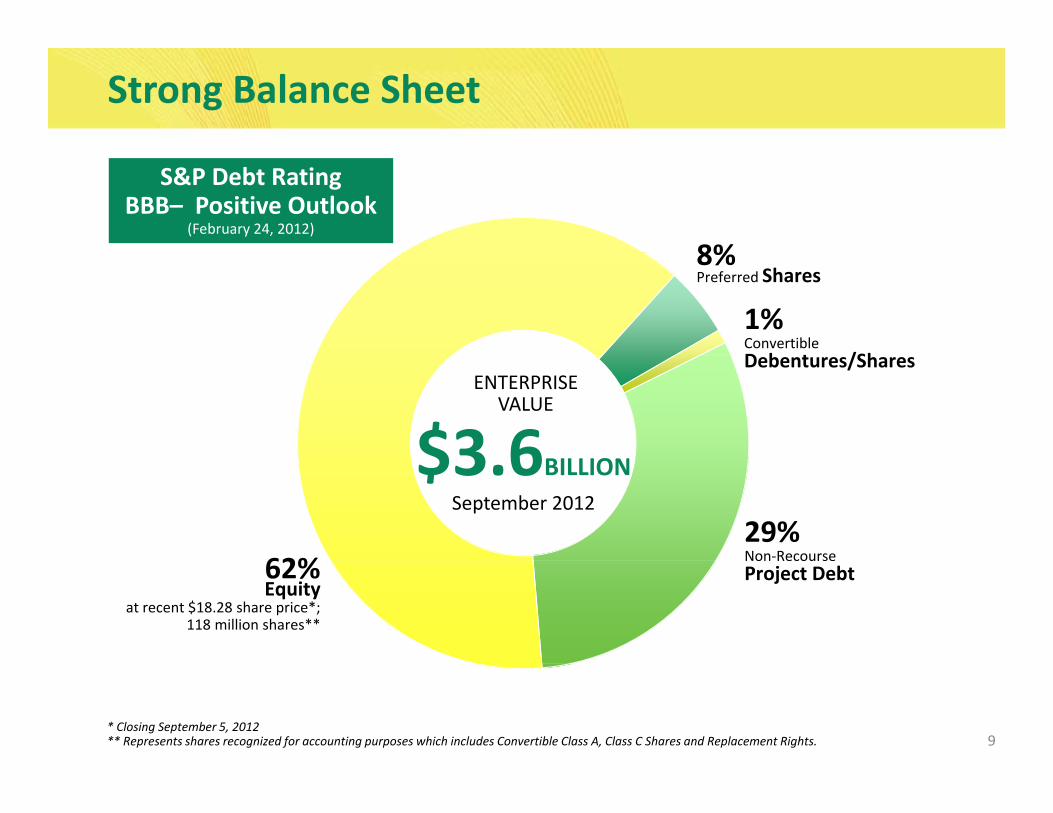
Strong Balance Sheet
8%
S&P Debt RatingBBB– Positive Outlook
(February 24, 2012)
8%Preferred Shares
1%Convertible D b t /Sh
$3 6 O
ENTERPRISEVALUE
Debentures/Shares
$3.6BILLIONSeptember 2012
29%Non‐Recourse62% Non RecourseProject Debt62%
Equityat recent $18.28 share price*;
118 million shares**
9* Closing September 5, 2012** Represents shares recognized for accounting purposes which includes Convertible Class A, Class C Shares and Replacement Rights.
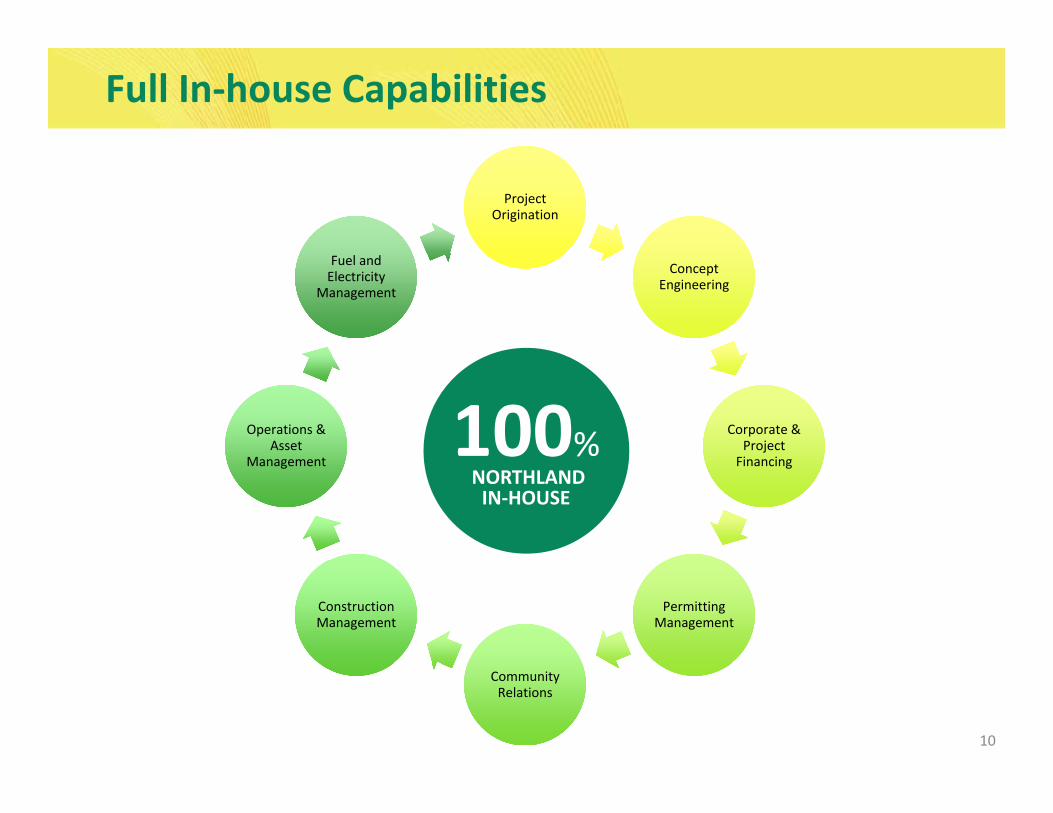
Full In‐house Capabilities
Project OriginationProject
Origination
Concept EngineeringConcept
Engineering
Fuel and Electricity
Management
Fuel and Electricity
Management
Corporate & Project Fi i
Corporate & Project Fi i
Operations & Asset
M t
Operations & Asset
M t100%
FinancingFinancingManagementManagementNORTHLANDIN‐HOUSE
Permitting ManagementPermitting
ManagementConstruction ManagementConstruction Management
10
Community RelationsCommunity Relations
Growth Pipeline
Construction
ConstructionAdvanced DevelopmentAdvanced DevelopmentDevelopment
ConstructionDevelopment ConstructionAdvanced DevelopmentDevelopment
11
Development11
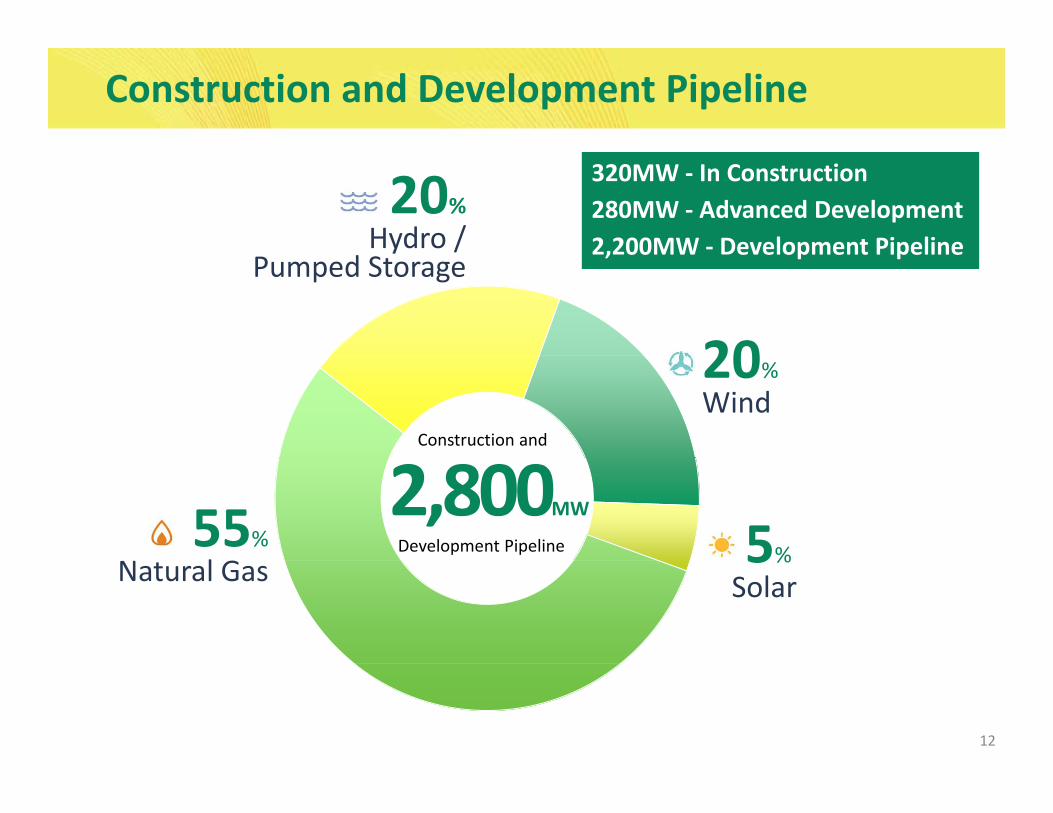
Construction and Development Pipeline
20%Hydro /
320MW ‐ In Construction280MW ‐ Advanced Development2,200MW ‐ Development Pipeliney
Pumped Storage
20
2,200MW Development Pipeline
20%Wind
Construction and
55%l G
2,800MW
5%Development Pipeline
Natural Gas 5%Solar
12
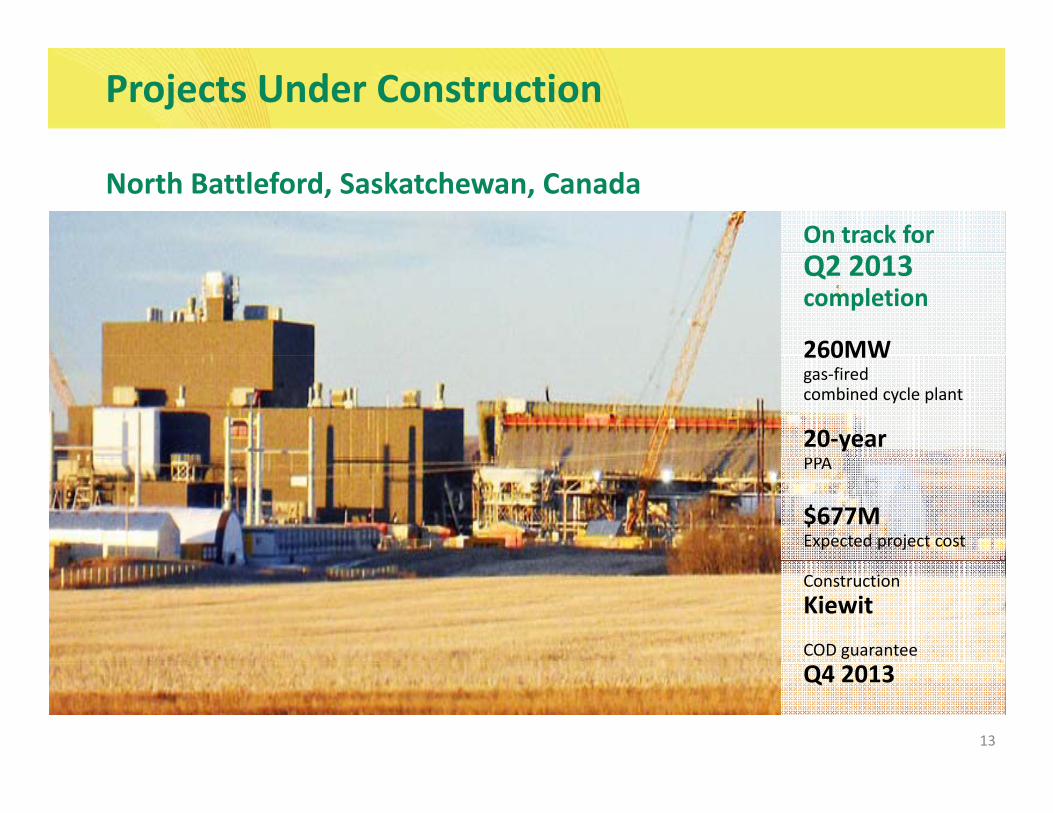
Projects Under Construction
On track for
North Battleford, Saskatchewan, Canada
Q2 2013 completion
260MW260MWgas‐fired combined cycle plant
20‐yearPPAPPA
$677MExpected project cost
ConstructionKiewit
COD guarantee
13
Q4 2013
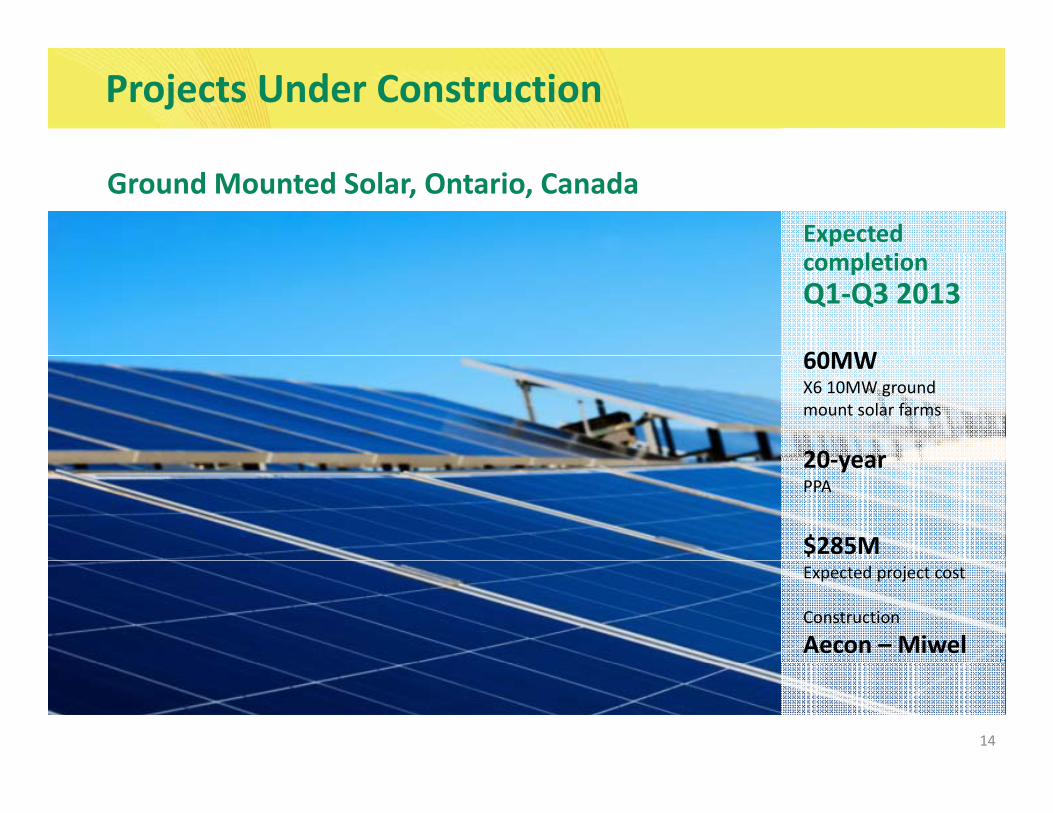
Projects Under Construction
Expected l i
Ground Mounted Solar, Ontario, Canada
completion Q1‐Q3 2013
60MW60MWX6 10MW ground mount solar farms
20 year20‐yearPPA
$285MExpected project cost
Construction
Aecon – Miwel
14

Construction: On‐time, On‐budget
Northland’s track record is on‐time, on‐budget project delivery
Facility COD Location MW Budget (M)
Actual (M)
%Under
OnTime
Iroquois Falls cogeneration plant 1997 ON 110 $158 $151 4.18%
I i F ll t bi l t 2003 ON 80 $24 $23 2 13%Iroquois Falls gas turbine replacement 2003 ON 80 $24 $23 2.13%
Kirkland Lake peaker facility 2004 ON 30 $30 $30 1.33%
Mont Miller wind farm 2005 QC 54 $98 $93 5.11%
Jardin d’Éole wind farm 2009 QC 128 $268 $268 0.22%
Thorold cogeneration facility 2010 ON 265 $520 $509 2.12%
Mont Louis wind farm 2011 QC 100 $181 $173 4.42%
Spy Hill peaker facility 2011 SK 86 $141 $137 2.83%
North Battleford and six ground mount solar projects currently under construction are within budget and on schedule
15
under construction are within budget and on schedule
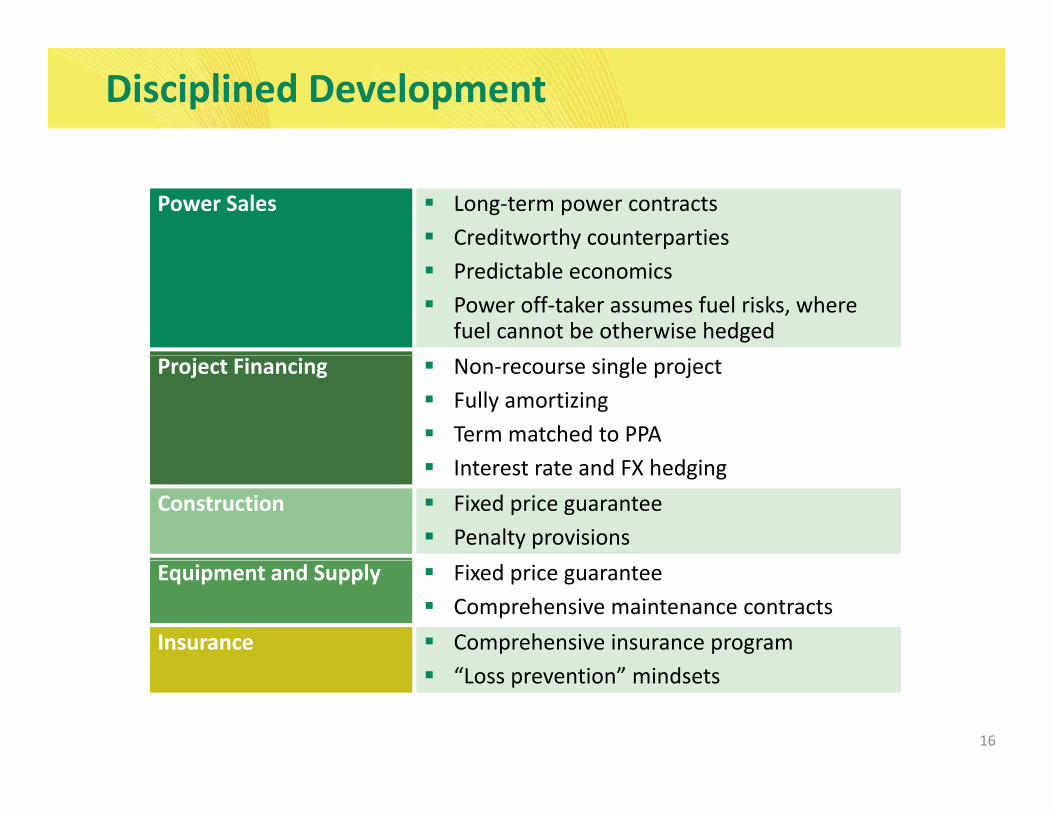
Disciplined Development
Power Sales Long‐term power contractsCreditworthy counterpartiesPredictable economicsPower off‐taker assumes fuel risks, where fuel cannot be otherwise hedged
Project Financing Non‐recourse single projectFully amortizingTerm matched to PPAInterest rate and FX hedging
Construction Fixed price guaranteePenalty provisions
Equipment and Supply Fixed price guaranteeComprehensive maintenance contracts
Insurance Comprehensive insurance program
16
“Loss prevention” mindsets
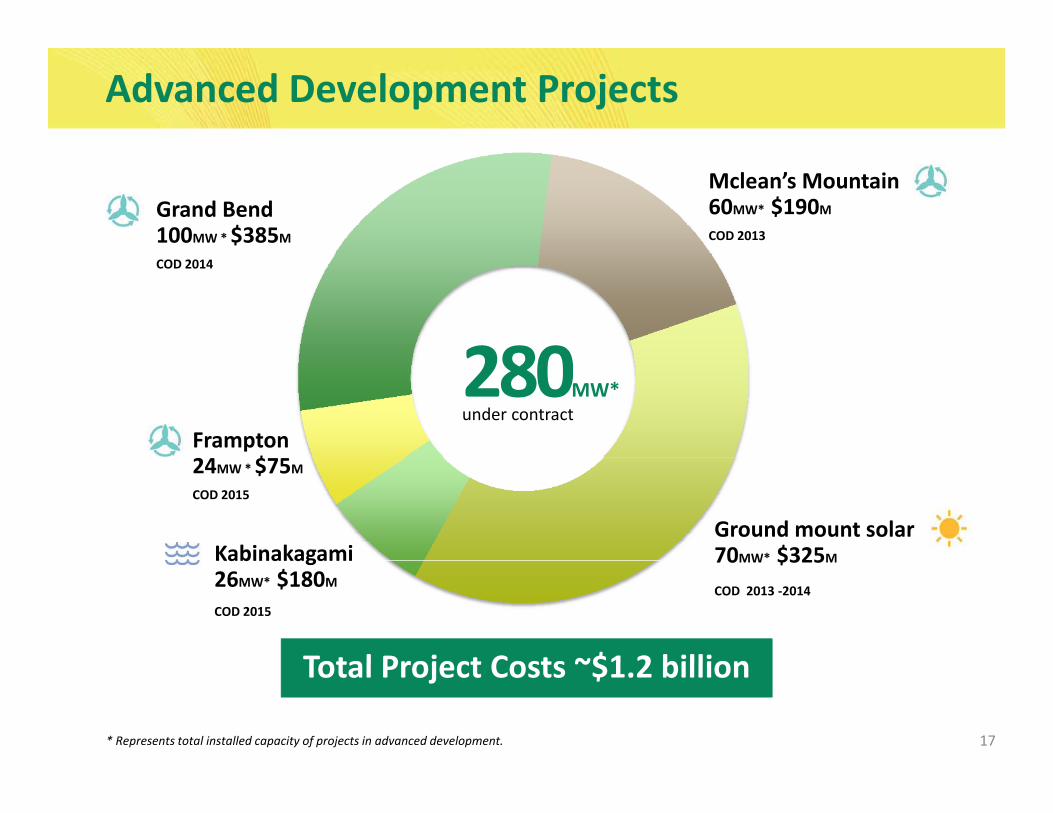
Advanced Development Projects
Mclean’s Mountain60MW* $190M
COD 2013
Grand Bend100MW * $385M
280
COD 2014
280MW*under contract
Frampton2 $
KabinakagamiGround mount solar70MW* $325M
24MW * $75M
COD 2015
Kabinakagami26MW* $180M
COD 2015
70MW $325M
COD 2013 ‐2014
Total Project Costs ~$1 2 billion
17
Total Project Costs ~$1.2 billion
* Represents total installed capacity of projects in advanced development.
Ontario Canada
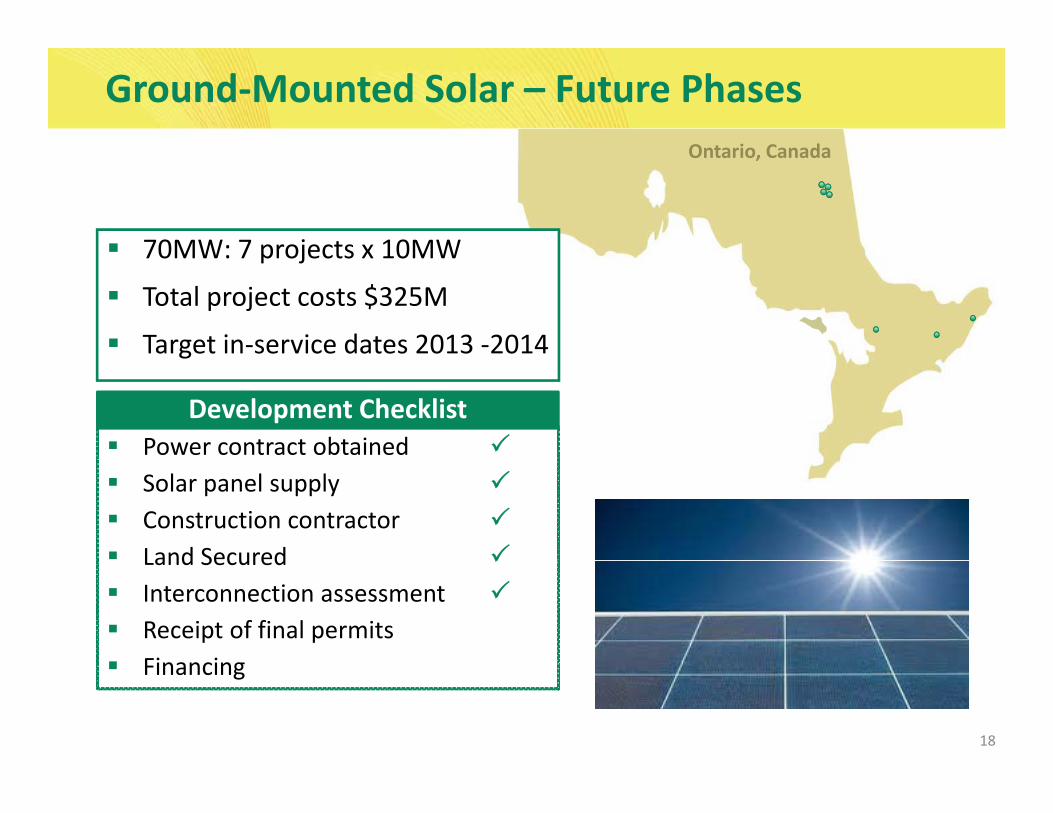
Ground‐Mounted Solar – Future Phases Ontario, Canada
70MW: 7 projects x 10MW70MW: 7 projects x 10MW
Total project costs $325M
Target in‐service dates 2013 ‐2014g
Power contract obtained Development Checklist
Solar panel supplyConstruction contractor Land SecuredLand Secured Interconnection assessmentReceipt of final permitsFinancing
18
Financing
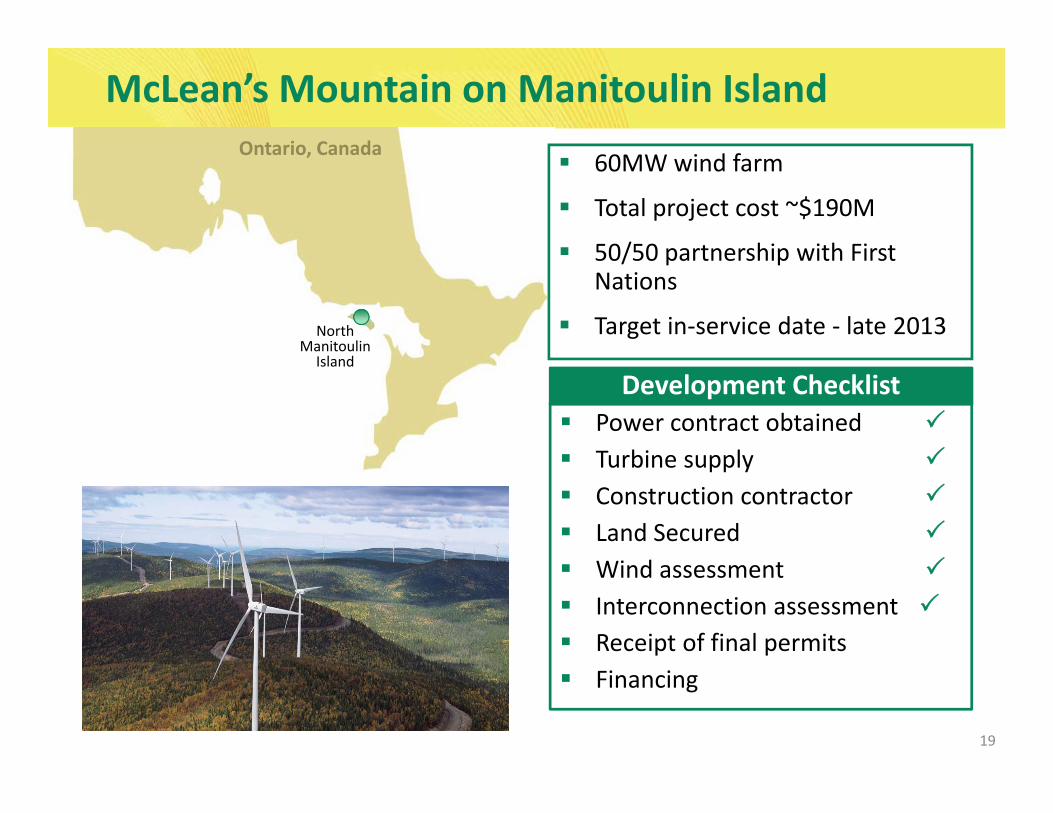
McLean’s Mountain on Manitoulin IslandOntario Canada 60MW wind farm
Total project cost ~$190M
50/50 partnership with First
Ontario, Canada
50/50 partnership with First Nations
Target in‐service date ‐ late 2013North Manitoulin
Island
Power contract obtained Turbine supply
Development Checklist
Turbine supplyConstruction contractor Land Secured i dWind assessment
Interconnection assessment Receipt of final permits
19
Financing
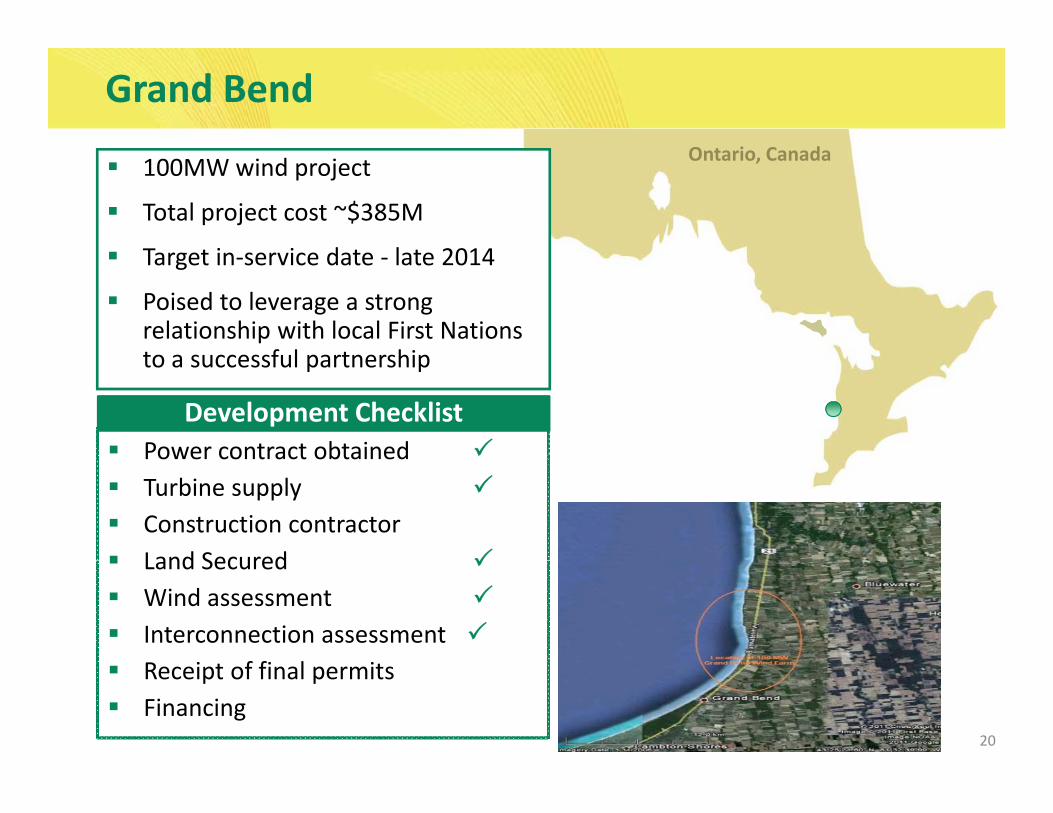
Grand BendOntario CanadaOntario, Canada100MW wind project
Total project cost ~$385M
Target in service date late 2014Target in‐service date ‐ late 2014
Poised to leverage a strong relationship with local First Nations to a successful partnershipto a successful partnership
Power contract obtainedDevelopment Checklist
Power contract obtained Turbine supplyConstruction contractor Land SecuredLand Secured Wind assessmentInterconnection assessment R i f fi l i
20
Receipt of final permitsFinancing
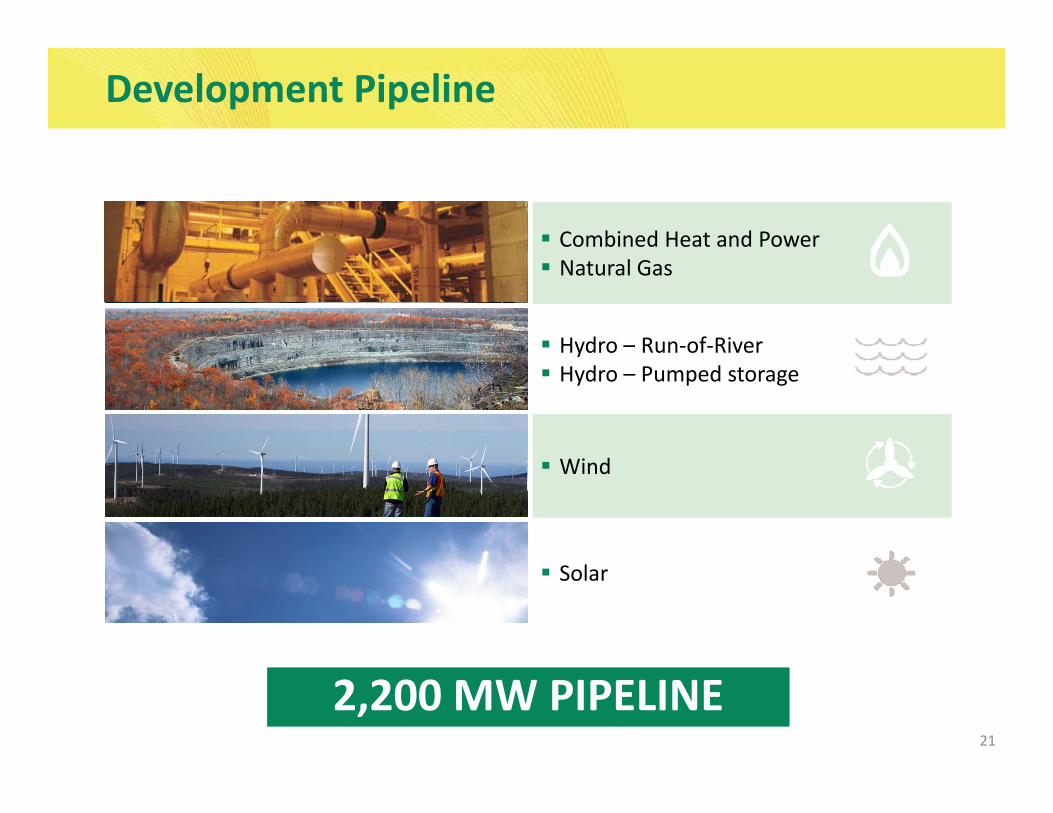
Development Pipeline
Combined Heat and PowerNatural Gas
Hydro – Run‐of‐RiveryHydro – Pumped storage
dWind
Solar
21
2,200 MW PIPELINE
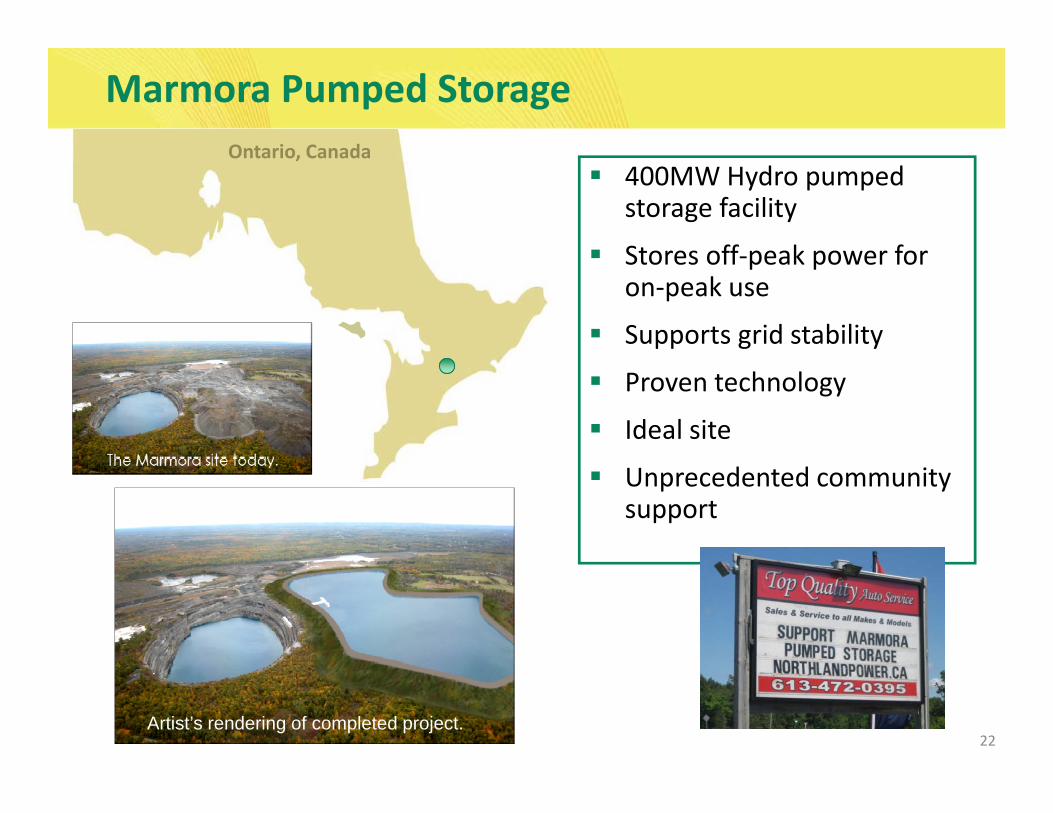
Marmora Pumped Storage Ontario Canada
400MW Hydro pumped storage facility
Stores off peak power for
Ontario, Canada
Stores off‐peak power for on‐peak use
Supports grid stability
Proven technology
Ideal site
Unprecedented community support
22Artist’s rendering of completed project.
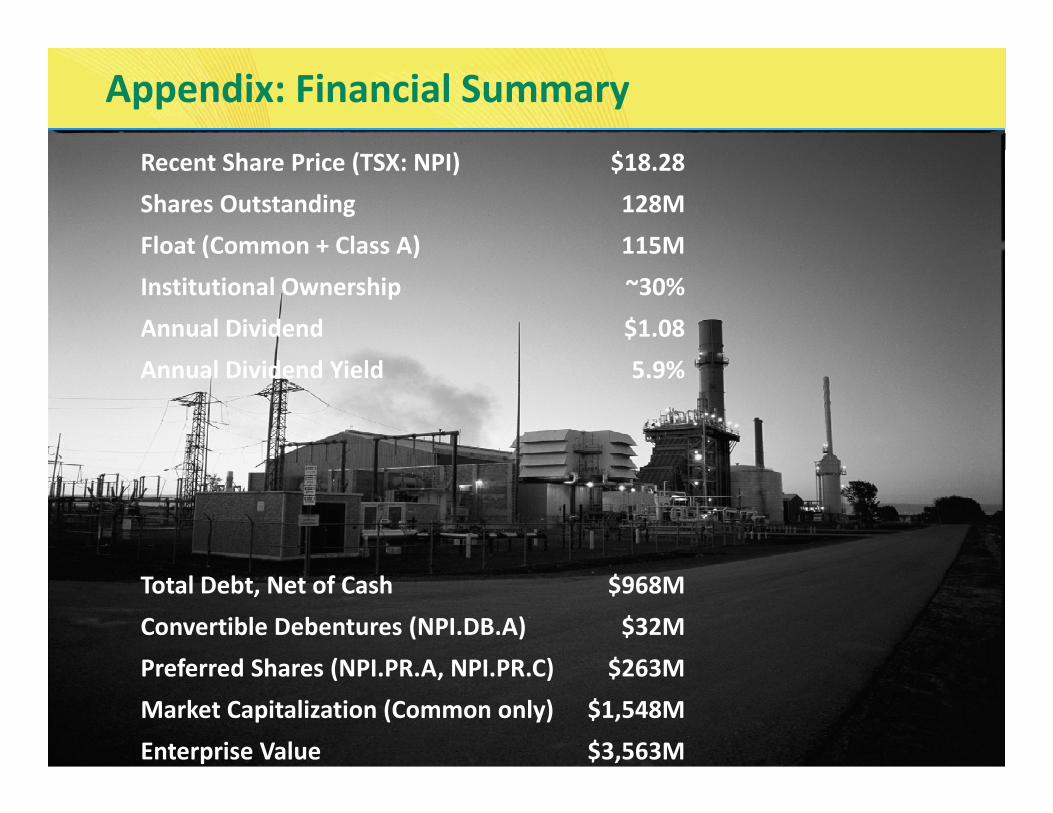
Appendix: Financial Summary
Recent Share Price (TSX: NPI) $18.28Shares Outstanding 128MFloat (Common + Class A) 115MFloat (Common Class A) 115MInstitutional Ownership ~30%Annual Dividend $1.08Annual Dividend Yield 5.9%
Total Debt, Net of Cash $968MConvertible Debentures (NPI.DB.A) $32MP f d Sh (NPI PR A NPI PR C) $263M
23
Preferred Shares (NPI.PR.A, NPI.PR.C) $263MMarket Capitalization (Common only) $1,548MEnterprise Value $3,563M
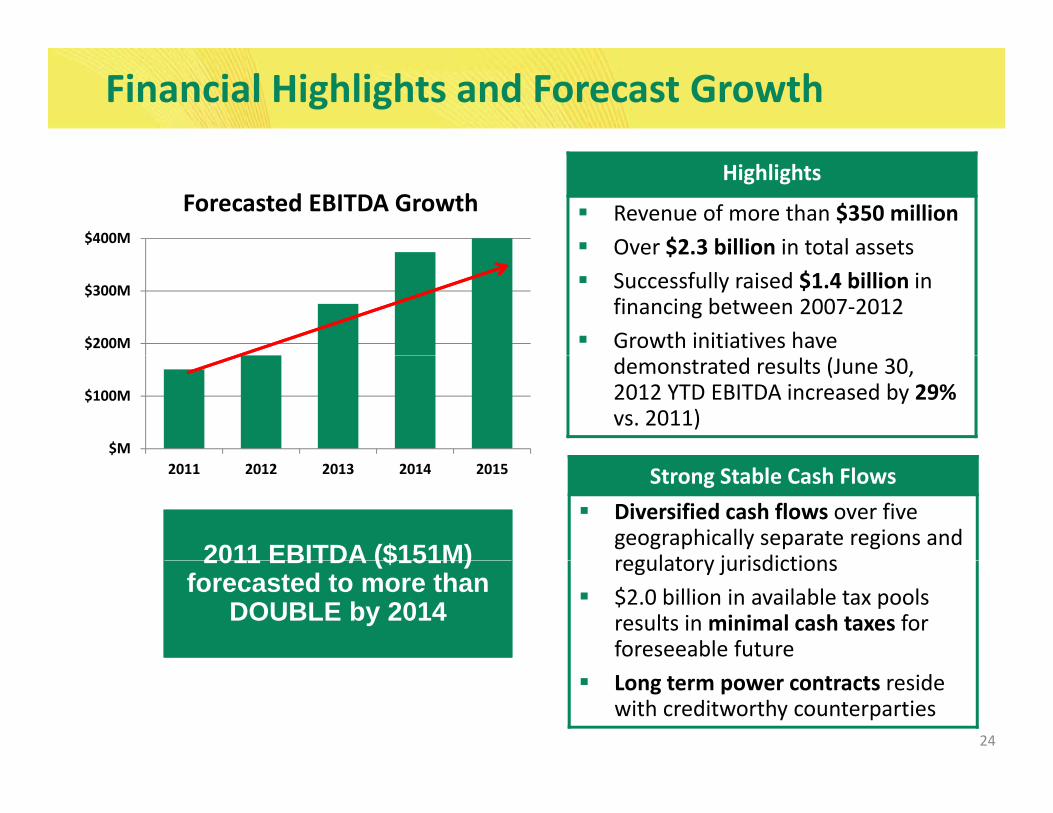
Financial Highlights and Forecast Growth
$400M
Forecasted EBITDA GrowthHighlights
Revenue of more than $350 million Over $2.3 billion in total assets
$200M
$300M
Over $2.3 billion in total assetsSuccessfully raised $1.4 billion in financing between 2007‐2012Growth initiatives have
$M
$100M
demonstrated results (June 30, 2012 YTD EBITDA increased by 29%vs. 2011)
2011 2012 2013 2014 2015 Strong Stable Cash FlowsDiversified cash flows over five geographically separate regions and regulatory jurisdictions2011 EBITDA ($151M) regulatory jurisdictions$2.0 billion in available tax pools results in minimal cash taxes for foreseeable future
2011 EBITDA ($151M) forecasted to more than
DOUBLE by 2014
24
Long term power contracts reside with creditworthy counterparties

Illustration of Payout Ratio*
Northland is committed to
Free Cash Flow required to service equity raised for projects in construction
160%
continuing $1.08 per share dividend as top priority for h h ld
NPI Merger Acquisition
120%
140%
shareholders
Growth, primarily projects under Full year
Reducing due to projects
coming online
Costs
80%
100%
p jconstruction, have caused Payout Ratio to rise above 100%
Full yearAll projectson‐line
40%
60%
Expected to be a temporary condition until projects
20%
40%
25
until projects completed
This chart has been complied by Northland management for illustrative purposes only* Payout is net of DRIP impact
0%2008 2009 2010 2011 2012F 2013F 2014F 2015F
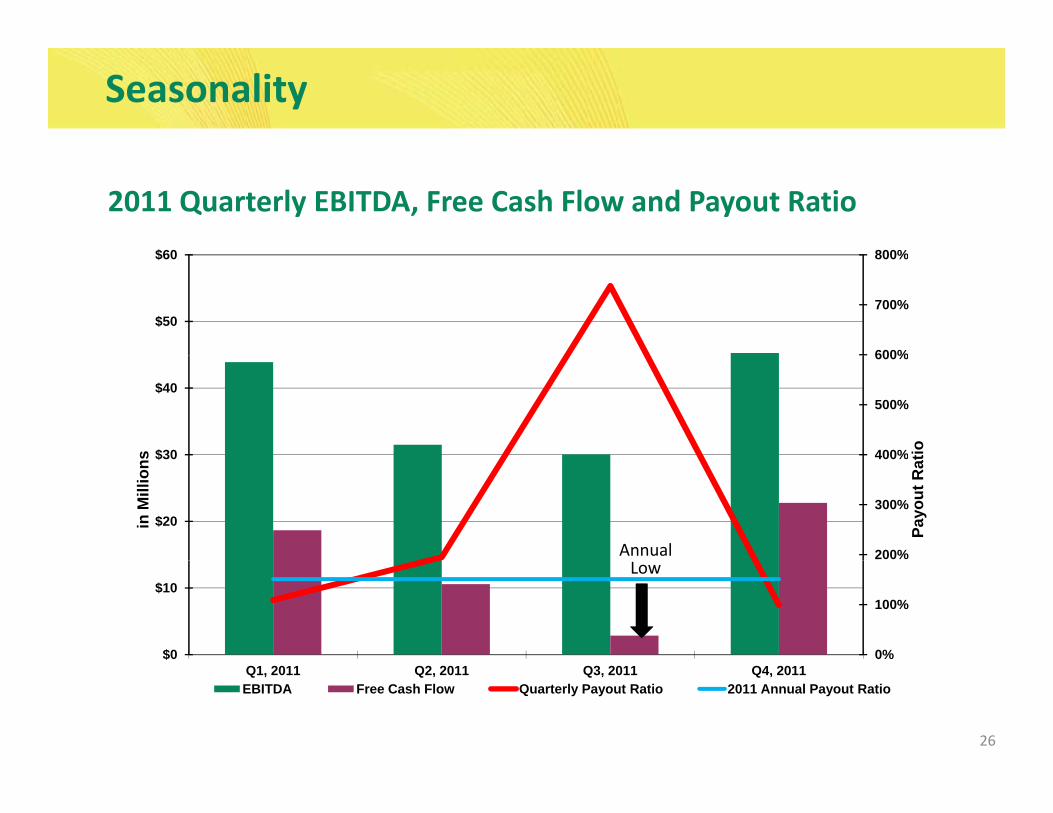
Seasonality
800%$60
2011 Quarterly EBITDA, Free Cash Flow and Payout Ratio
600%
700%
800%
$50
$60
400%
500%
600%
$30
$40
tios
200%
300%
400%
$20
$30
Payo
ut R
at
in M
illio
ns
Annual
0%
100%
$0
$10Low
26
Q1, 2011 Q2, 2011 Q3, 2011 Q4, 2011EBITDA Free Cash Flow Quarterly Payout Ratio 2011 Annual Payout Ratio
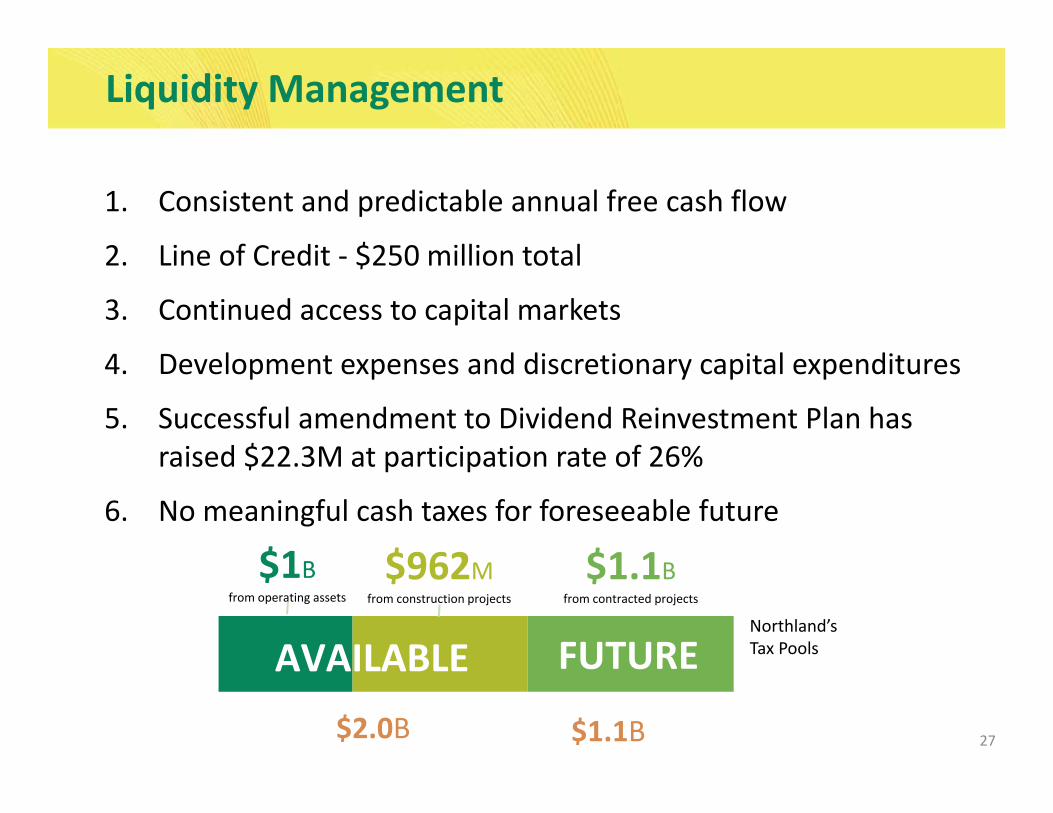
Liquidity Management
1. Consistent and predictable annual free cash flow
2 Line of Credit $250 million total2. Line of Credit ‐ $250 million total
3. Continued access to capital markets
4 D l t d di ti it l dit4. Development expenses and discretionary capital expenditures
5. Successful amendment to Dividend Reinvestment Plan has raised $22 3M at participation rate of 26%raised $22.3M at participation rate of 26%
6. No meaningful cash taxes for foreseeable future
$962 $1 1$1
AVAILABLE FUTURE
$962Mfrom construction projects
$1.1Bfrom contracted projects
Northland’s Tax Pools
$1Bfrom operating assets
27
AVAILABLE FUTURE
$2.0B $1.1B
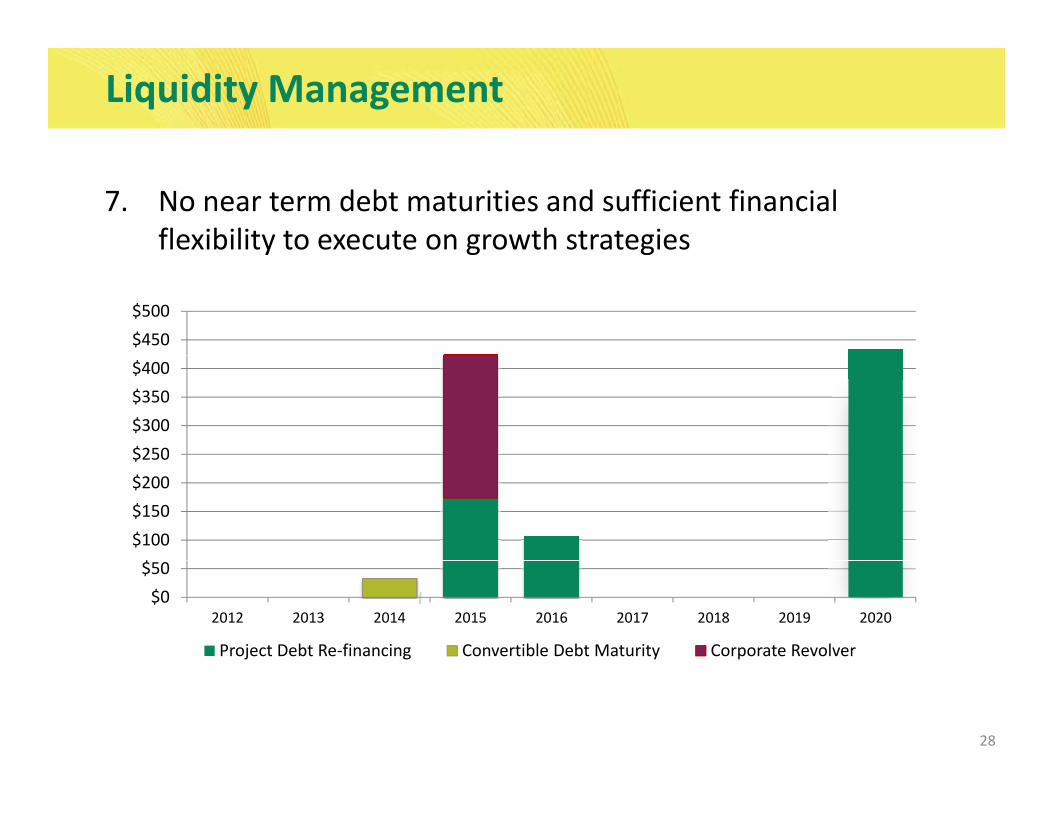
Liquidity Management
7. No near term debt maturities and sufficient financial flexibility to execute on growth strategiesy g g
$450$500
$250$300$350$400
$$100$150$200$250
$0$50
2012 2013 2014 2015 2016 2017 2018 2019 2020
Project Debt Re‐financing Convertible Debt Maturity Corporate Revolver
28
Why Invest in Northland?
Stability: The track record, commitment and ability to deliver shareholder value. Commitment to $1.08 $annual dividend.
Strong and Visible Growth Opportunities: AnStrong and Visible Growth Opportunities: An exciting portfolio of attractive, strategic development projects.
Experienced Team: Strong, seasoned people at every level.
Management’s ownership of more than 37% ensures alignment with shareholder interests
29
Appendix
30
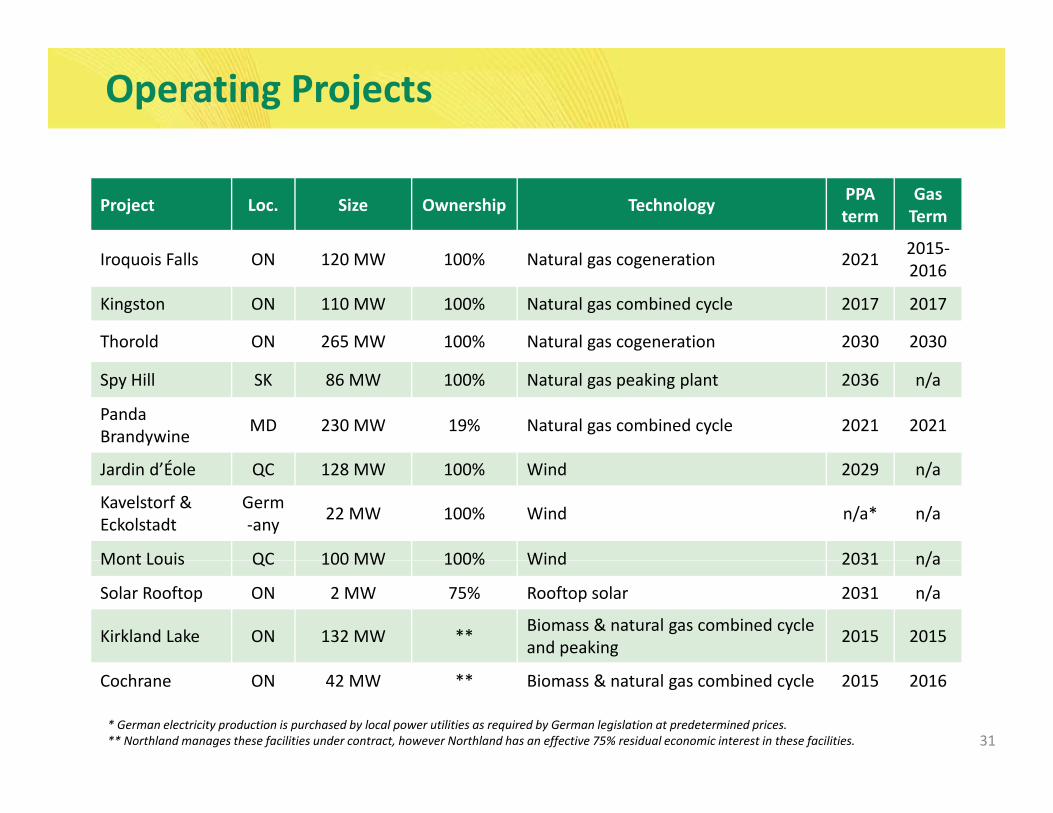
Operating Projects
Project Loc. Size Ownership Technology PPAterm
Gas Term
ll l 2015‐Iroquois Falls ON 120 MW 100% Natural gas cogeneration 2021 20152016
Kingston ON 110 MW 100% Natural gas combined cycle 2017 2017
Thorold ON 265 MW 100% Natural gas cogeneration 2030 2030
Spy Hill SK 86 MW 100% Natural gas peaking plant 2036 n/a
PandaBrandywine MD 230 MW 19% Natural gas combined cycle 2021 2021
Jardin d’Éole QC 128 MW 100% Wind 2029 n/a
Kavelstorf &Eckolstadt
Germ‐any 22 MW 100% Wind n/a* n/a
Mont Louis QC 100 MW 100% Wind 2031 n/aMont Louis QC 100 MW 100% Wind 2031 n/a
Solar Rooftop ON 2 MW 75% Rooftop solar 2031 n/a
Kirkland Lake ON 132 MW ** Biomass & natural gas combined cycleand peaking 2015 2015
31
Cochrane ON 42 MW ** Biomass & natural gas combined cycle 2015 2016
* German electricity production is purchased by local power utilities as required by German legislation at predetermined prices.** Northland manages these facilities under contract, however Northland has an effective 75% residual economic interest in these facilities.
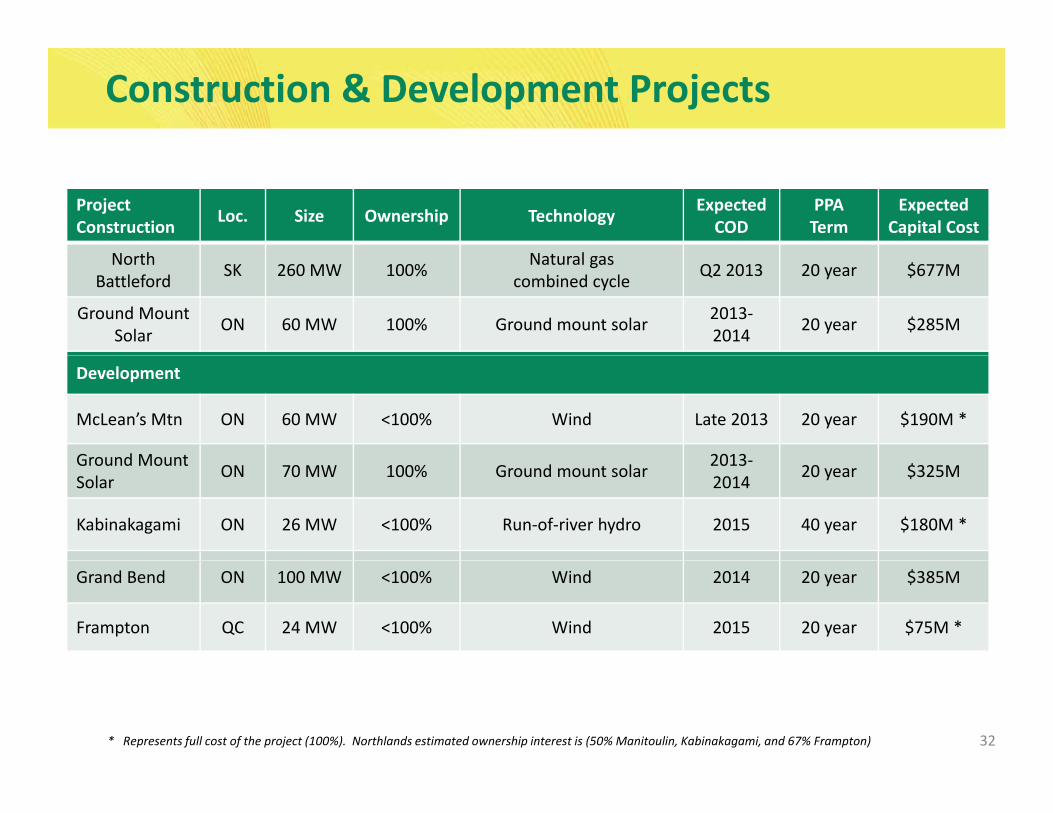
Construction & Development Projects
ProjectConstruction Loc. Size Ownership Technology Expected
CODPPATerm
Expected Capital Cost
h lNorth Battleford SK 260 MW 100% Natural gas
combined cycle Q2 2013 20 year $677M
Ground Mount Solar ON 60 MW 100% Ground mount solar 2013‐
2014 20 year $285M
Development
McLean’s Mtn ON 60 MW <100% Wind Late 2013 20 year $190M *
Ground Mount 2013Ground MountSolar ON 70 MW 100% Ground mount solar 2013‐
2014 20 year $325M
Kabinakagami ON 26 MW <100% Run‐of‐river hydro 2015 40 year $180M *
Grand Bend ON 100 MW <100% Wind 2014 20 year $385M
Frampton QC 24 MW <100% Wind 2015 20 year $75M *
32* Represents full cost of the project (100%). Northlands estimated ownership interest is (50% Manitoulin, Kabinakagami, and 67% Frampton)
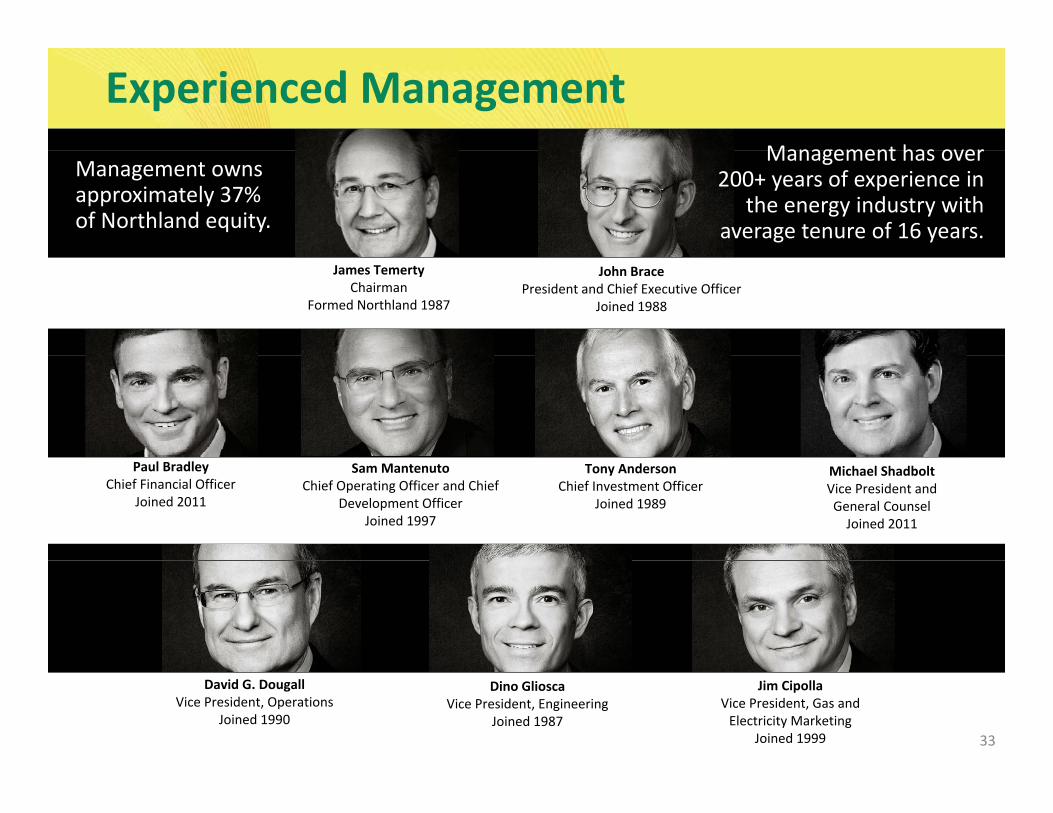
Experienced ManagementManagement has over
Management owns approximately 37% of Northland equity.
Management has over 200+ years of experience in
the energy industry with average tenure of 16 years.
John BracePresident and Chief Executive Officer
Joined 1988
. James Temerty
ChairmanFormed Northland 1987
Michael ShadboltVice President and General CounselJoined 2011
Sam MantenutoChief Operating Officer and Chief
Development OfficerJoined 1997
Tony AndersonChief Investment Officer
Joined 1989
Paul BradleyChief Financial Officer
Joined 2011
33
Jim CipollaVice President, Gas and Electricity Marketing
Joined 1999
Dino GlioscaVice President, Engineering
Joined 1987
David G. DougallVice President, Operations
Joined 1990

Investor Relations Contacts
Adam BeaumontDirector of Finance
647.288.1929
i t l ti @ thl [email protected]
www.northlandpower.ca
Barb BoklaManager, Investor RelationsManager, Investor Relations
647.288.1438
34