northland/auckland - new zealand road … auck brochure.pdf · tracking the safety performance of...
TRANSCRIPT

HOW SAFE ARE OUR ROADS?Tracking the safety performance of New Zealand’s state highway network
KiwiRAP is a road safety partnership between the NZ Automobile Association, the NZ Transport Agency, the Ministry of Transport, ACC and NZ Police.
WHAt iS KiWiRAP?
NORtHLAND/AUCKLAND
Regional results 2012
Performance tracking is the comparison of crash rates over time to establish whether fewer – or more – people are being killed or seriously injured on various road sections; and to determine how effective any countermeasures have been.
Performance tracking in this report compares 2007-2011 data to 2002-2006 data and is New Zealand’s first opportunity to track the safety performance of the state highway network using KiwiRAP methods.
For the purpose of comparing the level of risk of crashes between different parts of the network, KiwiRAP has broken the 10,849km of the assessed state highway network into 168 road sections (known as ‘links’).
The same links that were developed and used for the first Risk Maps (released in 2008) have been used, where possible, in these results.
For the purposes of displaying the safety risk of the state highway network, KiwiRAP looks at two different measures of risk: Collective Risk and Personal Risk. The focus of both is on crashes where people have been killed or seriously injured. The crash statistics used for the calculations are for the five-year period between 2007-2011.
The roads highlighted as being of higher risk than others are likely to have specific reasons why. The road, the vehicle, the speed and the driver/rider each contribute to risk.
Collective Risk (or Crash Density)Collective Risk is a measure of the total number of fatal and serious injury crashes per kilometre over a section of road.
KiwiRAP analyses the road safety ratings of New Zealand’s (80+km/h) rural state highway network.
KiwiRAP is part of an international family of Road Assessment Programmes (RAP) under the umbrella of the International Road Assessment Programme (iRAP). iRAP now works in partnership with government and non-government organisations in 70 countries. From its findings, iRAP recommends design improvements that need to be implemented in order to save lives and reduce the number of serious injuries on the world’s roads.
The objectives of KiwiRAP are:• ToreducedeathsandinjuriesonNewZealand’sroads by systematically assessing risk and identifying safety shortcomings that can be addressed with practical road improvement measures• Tohaveriskassessmentasakeyfactorinstrategic decisions on road improvements, crash protection and standards of road management• Toprovidemeaningfulinformationonwherethe greatest levels of risk are faced, and in turn, to influence driver and rider behaviour
KiwiRAP consists of three ‘protocols’:• RiskMapping - uses historical traffic and crash data to produce colour-coded maps illustrating the relative level of risk on sections of the road network• PerformanceTracking – involves a comparison of crash rates over time to establish whether fewer – or more – people are being killed or seriously injured; and to determine if countermeasures have been effective• StarRating – road inspections look at the engineering features of a road (such as lane and shoulder width or
presence of safety barriers). Between 1- and 5-Stars are awarded to road links, depending on the level of safety ‘built-in’ to the road (the higher the star, the better the road).
The first KiwiRAP Risk Maps were produced in 2008, followed by Star Ratings in 2010. This brochure shows results for Risk Mapping and Performance Tracking, comparing crash data for 2007-2011 to that from 2002-2006.
HowdoeSaRoadaSSeSSMenTPRogRaMMewoRk?
PeRfoRManceTRacking
2012RiSkMaPS

Because Collective Risk is measured in terms of the number of crashes per kilometre of state highway, you would generally expect that those with higher traffic volumes would have a higher Collective Risk.
Personal RiskPersonal Risk is a measure of the risk to each individual using the state highway being assessed. Unlike Collective Risk, Personal Risk takes into account the traffic volumes on each section of state highway.
The risk thresholds for the bands have remained the same in order for comparisons to be made between the 2008 Risk Maps (covering crashes in the 2002-2006 period) and the Risk Maps in this report for the 2007-2011 period.
2002 - 2006
2007 - 2011
HOW SAFE ARE OUR ROADS?Tracking the safety performance of New Zealand’s state highway network
KiwiRAP is a road safety partnership between the NZ Automobile Association, the NZ Transport Agency, the Ministry of Transport, ACC and NZ Police.
Collective RiskThere has been a substantial drop in the percentage of kilometres of state highway in the high collective risk category in the Northland/Auckland region between the two time periods (from 29% to 10%). The percentage of the network in medium-high, medium and low-medium collective risk bands have all increased while the percentage of network in the low risk band has decreased from 20% to 15%.
Changes in Collective Risk in Northland/Auckland Region (comparing 2002-2006 data with 2007-2011)
PeRfoRManceTRackingfoRnoRTHLand/aUckLandRegion
RiSkRaTing coLLecTiVeRiSk PeRSonaLRiSk coLoUR Average annual fatal Average annual fatal and serious injury and serious injury crashes per km crashes per 100 million vehicle-km Low ≤0.039 <4 Low-medium 0.04≤0.069 4≤4.9 Medium 0.07≤0.10 5≤6.9 Medium-high 0.11≤0.189 7≤8.9 High 0.19+ 9+

Period High Medium-High Medium Low-Medium Low
2002-2006
2007-2011
29% 12% 22% 18% 20% 100%339 136 254 217 233 1,179
PercentageLength(km)
10% 22% 28% 25% 15% 100%118 270 332 306 178 1,204
total
PercentageLength(km)
Note: percentages may not add to 100% due to rounding
2002 - 2006
2007 - 2011
Personal RiskThe percentage of state highway network in the high personal risk category in the Northland/Auckland region has increased from 24% to 28%. The percentage of network in the combined low-medium and low collective risk categories has increased by 15%.
Changes in Personal Risk in Northland/Auckland Region (comparing 2002-2006 data with 2007-2011)
HOW SAFE ARE OUR ROADS?Tracking the safety performance of New Zealand’s state highway network
KiwiRAP is a road safety partnership between the NZ Automobile Association, the NZ Transport Agency, the Ministry of Transport, ACC and NZ Police.
Period High Medium-High Medium Low-Medium Low
2002-2006
2007-2011
24% 21% 29% 5% 21% 100%281 248 337 64 249 1,179
PercentageLength(km)
28% 19% 12% 10% 31% 100%335 230 144 125 370 1,204
total
PercentageLength(km)
Note: percentages may not add to 100% due to rounding
HOW SAFE ARE OUR ROADS?Tracking the safety performance of New Zealand’s state highway network
KiwiRAP is a road safety partnership between the NZ Automobile Association, the NZ Transport Agency, the Ministry of Transport, ACC and NZ Police.
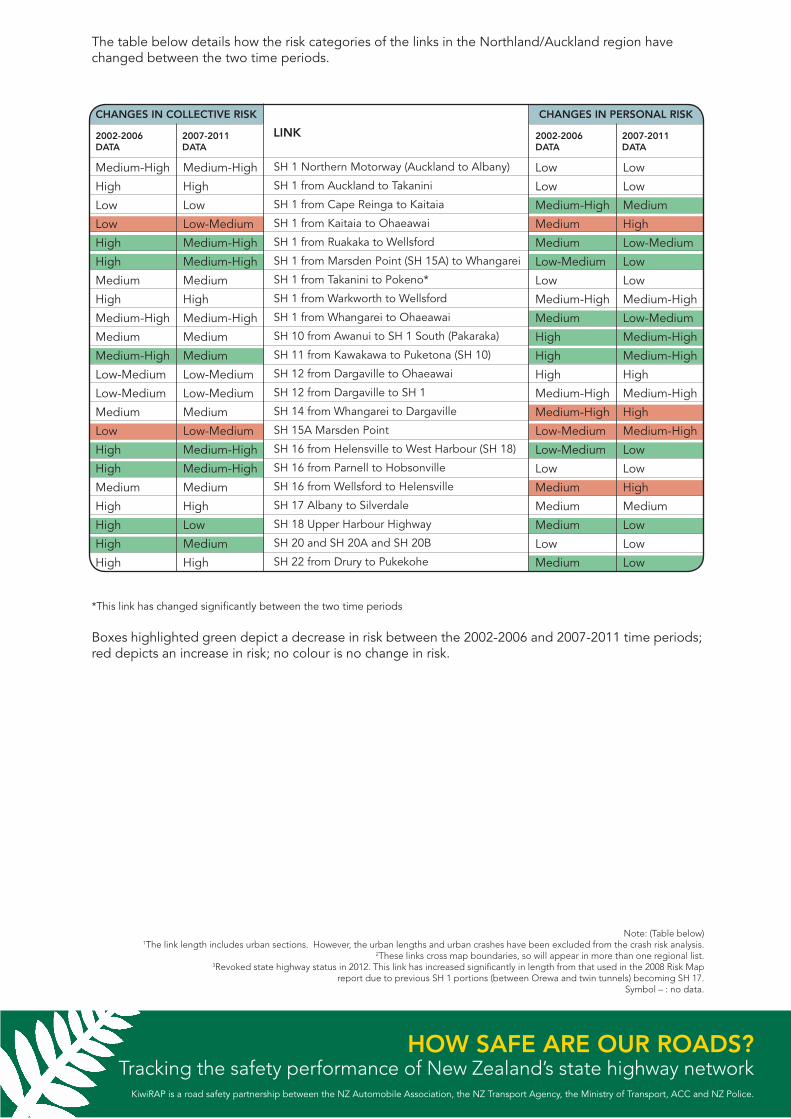
The table below details how the risk categories of the links in the Northland/Auckland region have changed between the two time periods.
LiNK
cHangeSincoLLecTiVeRiSk
2002-2006DAtA
2007-2011DAtA
Medium-High
High
Low
Low
High
High
Medium
High
Medium-High
Medium
Medium-High
Low-Medium
Low-Medium
Medium
Low
High
High
Medium
High
High
High
High
Medium-High
High
Low
Low-Medium
Medium-High
Medium-High
Medium
High
Medium-High
Medium
Medium
Low-Medium
Low-Medium
Medium
Low-Medium
Medium-High
Medium-High
Medium
High
Low
Medium
High
cHangeSinPeRSonaLRiSk
2002-2006DAtA
2007-2011DAtA
Low
Low
Medium-High
Medium
Medium
Low-Medium
Low
Medium-High
Medium
High
High
High
Medium-High
Medium-High
Low-Medium
Low-Medium
Low
Medium
Medium
Medium
Low
Medium
Low
Low
Medium
High
Low-Medium
Low
Low
Medium-High
Low-Medium
Medium-High
Medium-High
High
Medium-High
High
Medium-High
Low
Low
High
Medium
Low
Low
Low
SH 1 Northern Motorway (Auckland to Albany)
SH 1 from Auckland to Takanini
SH 1 from Cape Reinga to Kaitaia
SH 1 from Kaitaia to Ohaeawai
SH 1 from Ruakaka to Wellsford
SH 1 from Marsden Point (SH 15A) to Whangarei
SH 1 from Takanini to Pokeno*
SH 1 from Warkworth to Wellsford
SH 1 from Whangarei to Ohaeawai
SH 10 from Awanui to SH 1 South (Pakaraka)
SH 11 from Kawakawa to Puketona (SH 10)
SH 12 from Dargaville to Ohaeawai
SH 12 from Dargaville to SH 1
SH 14 from Whangarei to Dargaville
SH 15A Marsden Point
SH 16 from Helensville to West Harbour (SH 18)
SH 16 from Parnell to Hobsonville
SH 16 from Wellsford to Helensville
SH 17 Albany to Silverdale
SH 18 Upper Harbour Highway
SH 20 and SH 20A and SH 20B
SH 22 from Drury to Pukekohe
*This link has changed significantly between the two time periods
Boxes highlighted green depict a decrease in risk between the 2002-2006 and 2007-2011 time periods; red depicts an increase in risk; no colour is no change in risk.
Note: (Table below)1The link length includes urban sections. However, the urban lengths and urban crashes have been excluded from the crash risk analysis.
2These links cross map boundaries, so will appear in more than one regional list.3Revoked state highway status in 2012. This link has increased significantly in length from that used in the 2008 Risk Map
report due to previous SH 1 portions (between Orewa and twin tunnels) becoming SH 17.Symbol – : no data.

Ann
ual a
vera
ge
fata
land
ser
ious
in
jury
cra
shes
p
erk
m
Ann
ual
aver
age
fata
lan
d s
erio
us
inju
ry c
rash
es
per
100
m
illio
nve
hicl
e-km
Le
ngth
(1)
Seri
ous
Fa
tal
Co
llect
ive
Co
llect
ive
Per
sona
l P
erso
nal
(k
m)
inju
ry
cra
shes
R
isk
Ris
kB
and
R
isk
Ris
kB
and
Cra
shes
20
07 t
o
20
07 t
o
2011
201
1
SH 1
Nor
ther
n M
otor
way
(Auc
klan
d t
o A
lban
y)SH
1N
from
Alb
any
to T
win
Tun
nels
SH 1
N fr
om A
uckl
and
to
Taka
nini
SH 1
N fr
om C
ape
Rein
ga
to K
aita
iaSH
1N
from
Kai
taia
to
Oha
eaw
aiSH
1N
from
Rua
kaka
to
Wel
lsfo
rdSH
1N
from
SH
15A
to
Wha
ngar
eiSH
1N
from
Tak
anin
i to
Poke
no(2
)
SH 1
N fr
om W
arkw
orth
to
Wel
lsfo
rdSH
1N
from
Wha
ngar
ei t
o O
haea
wai
SH 1
N W
arkw
orth
to
Twin
Tun
nels
SH 1
0 fr
om A
wan
ui t
o SH
1N
sou
thSH
11
from
Kaw
akaw
a to
SH
10
SH 1
2 fr
om D
arg
avill
e to
Oha
eaw
aiSH
12
from
Dar
gav
ille
to S
H 1
NSH
14
from
Wha
ngar
ei t
o D
arg
avill
eSH
15A
SH 1
6 fr
om H
elen
svill
e to
SH
18
SH 1
6 fr
om P
arne
ll to
Hob
sonv
ille
SH 1
6 fr
om W
ells
ford
to
Hel
ensv
ille
SH 1
7(3)
SH 1
8SH
20
and
SH
20A
and
SH
20B
SH 2
2 fr
om D
rury
to
Puke
kohe
35.5
47.3
50.7
109.
280
.253
.924
.648
.318
.770
.717
.410
3.7
29.6
148.
069
.749
.6 8.6
30.5
37.8
57.5
35.2
21.2
49.3
13.0
30 4 46 9 21 29 12 14 17 24 11 36 11 21 15 12 1 17 25 17 24-
15 7
1 1 8 2 2 10 5 3 9 14 4 10 1 8 3 8 1 3 5 2 6 1 3 5
0.18
0.02
0.21
0.03
0.06
0.16
0.14
0.07
0.31
0.11
0.19
0.10
0.10
0.04
0.06
0.09
0.05
0.16
0.17
0.07
0.21
0.02
0.09
0.23
Med
ium
-Hig
hLo
wH
igh
Low
Low
-Med
ium
Med
ium
-Hig
hM
ediu
m-H
igh
Med
ium
Hig
hM
ediu
m-H
igh
Med
ium
-Hig
hM
ediu
mM
ediu
mLo
w-M
ediu
mLo
w-M
ediu
mM
ediu
mLo
w-M
ediu
mM
ediu
m-H
igh
Med
ium
-Hig
hM
ediu
mH
igh
Low
Med
ium
Hig
h
0.9
0.4
1.0
6.2
10.3 4.8
3.0
0.8
7.4
4.6
2.9
7.8
8.1
10.2 8.1
9.6
8.0
3.8
1.2
11.0 5.8
0.3
0.8
3.8
Low
Low
Low
Med
ium
Hig
hLo
w-M
ediu
mLo
wLo
wM
ediu
m-H
igh
Low
-Med
ium
Low
Med
ium
-Hig
hM
ediu
m-H
igh
Hig
hM
ediu
m-H
igh
Hig
hM
ediu
m-H
igh
Low
Low
Hig
hM
ediu
mLo
wLo
wLo
w
Link
2012
RiS
kM
aP
Sfo
Rn
oR
THLa
nd
/aU
ck
Lan
dR
eg
ion
HOW SAFE ARE OUR ROADS?Tracking the safety performance of New Zealand’s state highway network
KiwiRAP is a road safety partnership between the NZ Automobile Association, the NZ Transport Agency, the Ministry of Transport, ACC and NZ Police.

1
1
1
1
1
1
1
1
10
10
11
12
12
12
12
14
16
16
17
18
20
22
Mahurangi Harbour
Manukau Har
Whangarei Harbour
Ninety
Mile
Beach
LakeOmapere
LakeWhangape
Wairoa
River
Spirits Bay
Ahipara BayTakou Bay
Bream Bay
Omaha Bay
Waikato River
KaiparaHarbour
Whangape Harbour
HokiangaHarbour
Herekino Harbour
Parengarenga Harbour
Whangaruru Harbour
DoubtlessBay
SOUTHPACIFICOCEAN
TASMANSEA
Great ExhibitionBay
Bay ofIslands
HaurakiGulf
Cape Maria Van Diemen
North Cape
Tauroa Point
Bream Head
Tutukaka Head
Cape Rodney
Takatu Point
South Head
RangitotoIsland
Little BarrierIsland
KarikariPeninsula
WaihekeIsland
Kaitaia
Kaikohe
WHANGAREI
Dargaville
Wellsford
Warkworth
Paihia
Helensville
Orewa
AUCKLAND
Manukau
Pukekohe
Cape Reinga(Te Rerengawairua)
Cape Brett
NorthHead
0 20 40km
Scale 1:1,380,000
N
COLLECTIVE RISK High Medium-High Medium Low-Medium Low Collective Risk:Annual average fatal and serious injury crashes per km
NORTHLAND and AUCKLAND REGION
coLLecTiVeRiSkMaP
HOW SAFE ARE OUR ROADS?Tracking the safety performance of New Zealand’s state highway network
KiwiRAP is a road safety partnership between the NZ Automobile Association, the NZ Transport Agency, the Ministry of Transport, ACC and NZ Police.
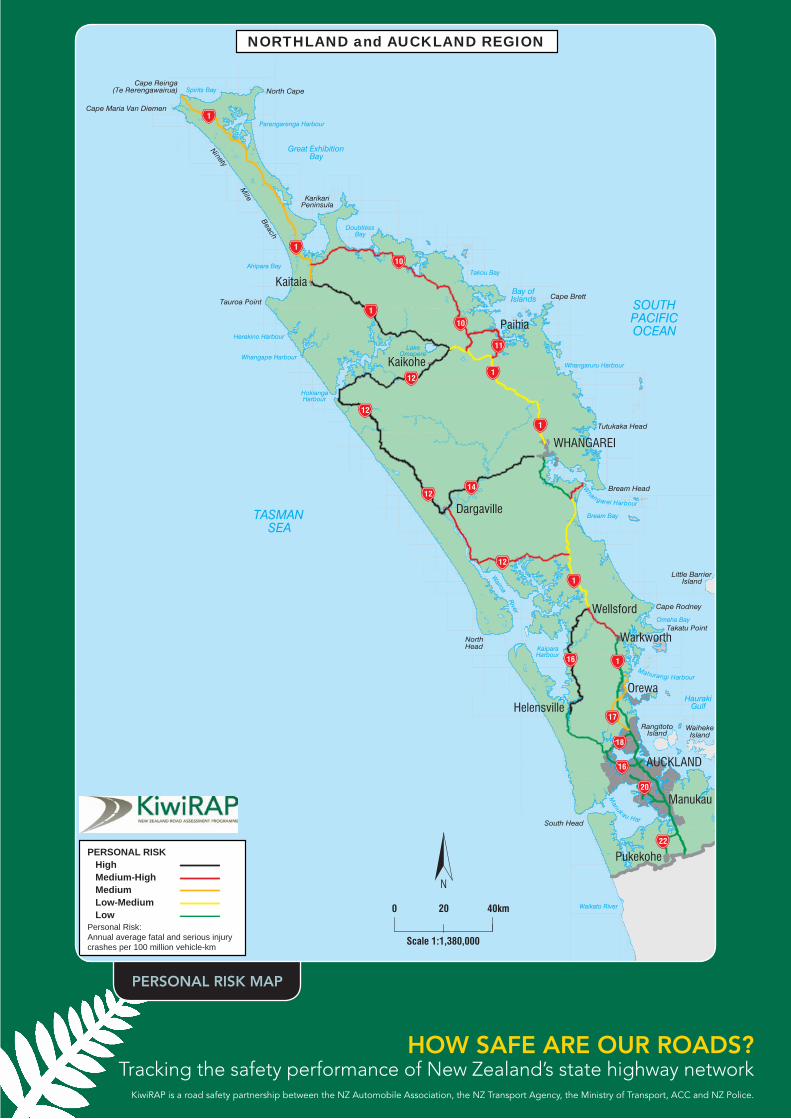
PeRSonaLRiSkMaP
1
1
1
1
1
1
1
1
10
10
11
12
12
12
12
14
16
16
17
18
20
22
Mahurangi Harbour
Manukau Har
Whangarei Harbour
Ninety
Mile
Beach
LakeOmapere
LakeWhangape
Wairoa
River
Spirits Bay
Ahipara BayTakou Bay
Bream Bay
Omaha Bay
Waikato River
KaiparaHarbour
Whangape Harbour
HokiangaHarbour
Herekino Harbour
Parengarenga Harbour
Whangaruru Harbour
DoubtlessBay
SOUTHPACIFICOCEAN
TASMANSEA
Great ExhibitionBay
Bay ofIslands
HaurakiGulf
Cape Maria Van Diemen
North Cape
Tauroa Point
Bream Head
Tutukaka Head
Cape Rodney
Takatu Point
South Head
RangitotoIsland
Little BarrierIsland
KarikariPeninsula
WaihekeIsland
Kaitaia
Kaikohe
WHANGAREI
Dargaville
Wellsford
Warkworth
Paihia
Helensville
Orewa
AUCKLAND
Manukau
Pukekohe
Cape Reinga(Te Rerengawairua)
Cape Brett
NorthHead
0 20 40km
Scale 1:1,380,000
N
PERSONAL RISK High Medium-High Medium Low-Medium Low Personal Risk:Annual average fatal and serious injury crashes per 100 million vehicle-km
NORTHLAND and AUCKLAND REGION
HOW SAFE ARE OUR ROADS?Tracking the safety performance of New Zealand’s state highway network
KiwiRAP is a road safety partnership between the NZ Automobile Association, the NZ Transport Agency, the Ministry of Transport, ACC and NZ Police.