northwest national marine renewable energy center site characterization of tidal resources:...
Post on 20-Dec-2015
215 views
TRANSCRIPT

Northwest National Marine Renewable Energy Center
Site Characterization of Tidal Resources: Admiralty Inlet
Jeff Epler

Northwest National Marine Renewable Energy Center
Scope of Thesis Work
• Predictability of tidal currents using stationary ADCP data– Develop a set of requirements for accurate long-term predictions
• Development of a quantitative application for use of shipboard ADCP data– Resolve uncertainty in current amplitude and phase between survey tracks
– New survey patterns
Northwest National Marine Renewable Energy Center
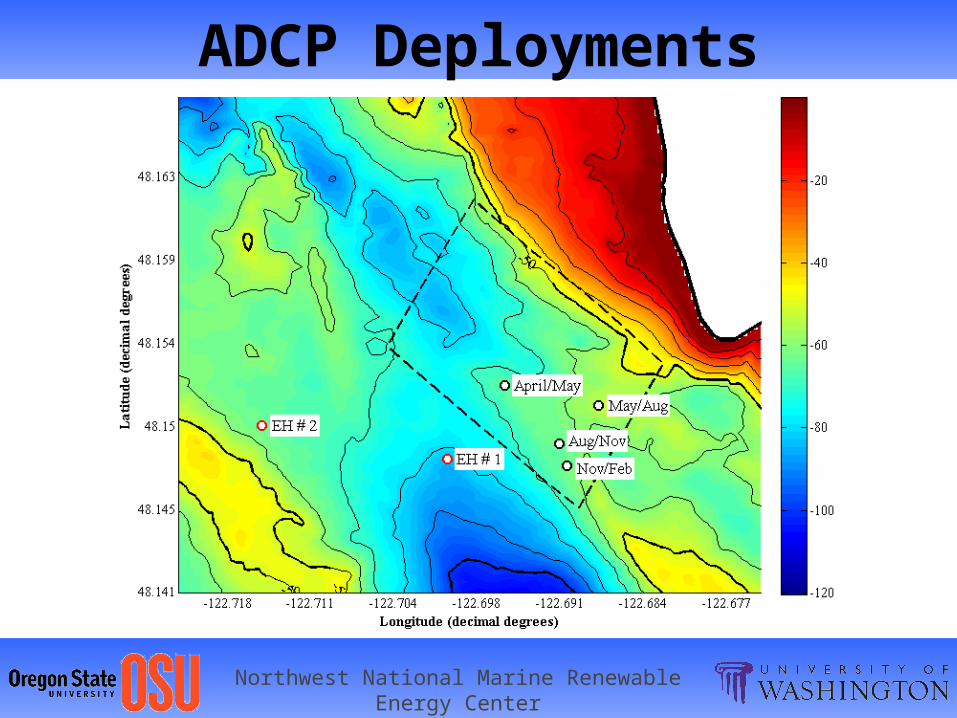
ADCP Deployments

Northwest National Marine Renewable Energy Center
Prediction of Tidal Currents: Why?
• Estimation of tidal resource– Location and orientation of device– Long-term tidal resource prediction (feasibility)
– Noise generation due to device operation
• NOAA predictions are given for a single point– Surface currents only– Bathymetry, Turbulence, etc. cause 3-D velocity variations

Northwest National Marine Renewable Energy Center
Prediction of Tidal Currents: Why?
• Recovery of sea-spider (11/10/09) during slack water
• Strong currents increase noise which could mask the acoustic release signal

Northwest National Marine Renewable Energy Center
T Tide- Tidal Analysis• Performs harmonic analysis of tidal signal resolving the data as a superposition of sin waves due to tidal constituents
• Rayleigh criterion and signal to noise ratio (SNR) determine which constituents can be resolved
• Finds the least-squares fit to the current velocity data
• Statistical error analysis • Can handle scalar or vector quantities
Principal Axis Velocity
)cos()( iii tAtu

Northwest National Marine Renewable Energy Center
Rayleigh Criterion• A methodology developed by Foreman (1977) to determine which tidal constituents can be resolved with T Tide
RT 12
Ex. Resolving the K1 vs. P1 Tidal Constituents
K1, Luni-solar diurnal constituent, = 0.04178075 cycles / hr
P1, Solar diurnal constituent, = 0.04155259 cycles / hr 182111 TTPK days
For T < 182 days, K1 contains P1 information

Northwest National Marine Renewable Energy Center
Rayleigh Criterion
Data
TideT
Variance
VarianceExplainedVar _.
Days (T) # Constituent
s
Variance Explained
7 8 (5) 93.6 %15 17 (15) 95.1 %30 29 (26) 97.9 %70 35 (32) 98.3 %

Northwest National Marine Renewable Energy Center
2-D vs. 1-D Velocity Analysis
Tidal Ellipse Principal Velocity Components

Northwest National Marine Renewable Energy Center
ADCP Time Lapse

Northwest National Marine Renewable Energy Center
T Tide vs. ADCP
06/18 06/19 06/20 06/21 06/22 06/23 06/24
-3
-2
-1
0
1
2
Time
m/s
May 20-August 3, Depth Averaged ADCP Data
T Tide
ADCP DataResidual

Northwest National Marine Renewable Energy Center
How well does T Tide work?Ideal Case Actual Case
-1.5 -1.0 -0.5 0.0 0.5 1.0 1.5-3.0
-2.0
-1.0
0.0
1.0
2.0
3.0
Vel
ocity
Bin
s, b
in s
ize
= 0
.1 m
/s
May 20-August 3, "Surface" Velocity
Prediciton Error: 0.1 m/s bins -1.5 -1.0 -0.5 0.0 0.5 1.0 1.5-3.0
-2.0
-1.0
0.0
1.0
2.0
3.0
Prediciton Error: 0.1 m/s bins
Vel
ocity
Bin
s, b
in s
ize
= 0
.1 m
/s
May 20-August 3, "Surface" Velocity

Northwest National Marine Renewable Energy Center
NOAA Predictions vs. ADCP
-50 0 50 100 150 2000
5
10
15
20
25May 20-August 3, Slack Water Timing: "Surface" Velocity
Num
ber
of
Observ
ations
Minutes between NOAA & ADCP Slack Water (NOAA-ADCP)
Flood to Slack: Mean = 92.9 min, Standard Deviation = 37.2 min
Ebb to Slack: Mean = 75.7 min, Standard Deviation = 21.6 min

Northwest National Marine Renewable Energy Center
NOAA Predictions vs. ADCP
0 50 100 1500
5
10
15
20
25May 20-August 3, Slack Water Timing: "Seabed" Velocity
Num
ber
of
Observ
ations
Minutes between NOAA & ADCP Slack Water (NOAA-ADCP)
Flood to Slack: Mean = 31.6 min, Standard Deviation = 26.8 min
Ebb to Slack: Mean = 93.1 min, Standard Deviation = 20.5 min

Northwest National Marine Renewable Energy Center
T Tide- November Prediction
11/09 11/10 11/11 11/12-3
-2
-1
0
1
2
3
November
Velo
city M
agnitude (
m/s
)
November Current Prediction: "Surface" Velocity
May/August- 70 days
Peaks & SlackNOAA pred
NOAA pred data
11/09 11/10 11/11 11/12-3
-2
-1
0
1
2
3
November
Vel
ocity
Mag
nitu
de (
m/s
)
November Current Prediction: "Surface" Velocity
May/August- 70 days
Peaks & SlackNOAA pred
NOAA pred data

Northwest National Marine Renewable Energy Center
M2- Amplitude Map

Northwest National Marine Renewable Energy Center
M2- Phase Map

Northwest National Marine Renewable Energy Center
S2- Phase Map

Northwest National Marine Renewable Energy Center
Mobile ADCP Data

Northwest National Marine Renewable Energy Center
Ongoing Work
• Tidal analysis with R T Tide package
• Estimating sea surface height from backscatter intensity

Northwest National Marine Renewable Energy Center
Acknowledgements
• Dr. Brian Polagye• Dr. Jim Thomson• Dr. Phil Malte• Dr. Roy Martin• Chris Bassett
Northwest National Marine Renewable Energy Center
Questions?