not for distribution - moody's analytics...2020/03/24 · 3/23/2020 5 the covid-19 pandemic:...
TRANSCRIPT

3/23/2020
1
March, 2020Yukyung Choi, Glenn Levine and Samuel Malone, Ph.D
The coronavirus (COVID-19) pandemic: Assessing the impact on corporate credit risk
The COVID-19 pandemic: Assessing the impact on credit risk, March 2020 2
Yukyung Choi Samuel Malone, Ph.D
Glenn Levine Ryan Donahue
@2020 Moody's Analytics, Inc., its licensors and affiliates. All rights reserved.
Not for
Dist
ributi
on

3/23/2020
2
The COVID-19 pandemic: Assessing the impact on credit risk, March 2020 3
About Moody’s Analytics
The COVID-19 pandemic: Assessing the impact on credit risk, March 2020 4
1. Executive summary
2. Industry and country impacts
3. Company effects: winners and losers
4. Equity and bond market effects
5. The forward evolution of EDFs under a pandemic macro scenario
Agenda
@2020 Moody's Analytics, Inc., its licensors and affiliates. All rights reserved.
Not for
Dist
ributi
on

3/23/2020
3
1 Executive Summary
The COVID-19 pandemic: Assessing the impact on credit risk, March 2020 6
• Countries whose corporate sectors are at materially increased risk since mid-January:
• Canada and Norway (oil & gas exposure)
• U.S. and Southern Europe (large COVID-19 related shocks to multiple industries)
• Selected emerging markets (risk-off effects and pre-existing vulnerability)
• Major industry-level impacts:
• Primary impact: Oil & gas, Entertainment & leisure, Air transportation
• Knock-on effects: Consumer Durables
• Secular downtrend meets black swan event: Broadcast media, printing
• Corporate bond and equity market impact
• “Flight-to-credit-quality”
• Low EDF bonds outperform high EDF bonds in both IG and HY; Low EDF equities outperform in U.S. and Europe
• Stressed EDFs under a pandemic macro scenario
• Oil & gas industry to see highly elevated default risk in Europe and the U.S. if perfect storm of falling expected demand and supply war persist
Executive summary
@2020 Moody's Analytics, Inc., its licensors and affiliates. All rights reserved.
Not for
Dist
ributi
on

3/23/2020
4
The COVID-19 pandemic: Assessing the impact on credit risk, March 2020 7
Global median default risk (1-year EDF, %)A modest uptick by this measure, but still well below historical average
The COVID-19 pandemic: Assessing the impact on credit risk, March 2020 8
Initial detection lag, testing and unrestrained growth, slowing growth
The S-curve of total infections
Source: Our World in Data (ourworldindata.org), European Centre for Disease Prevention and Control, Authors’ Calculations
0
1
2
3
4
5
6
7
8
9
10
11
12
13
14
15
16
17
18
1 3 5 7 9 11 13 15 17 19 21 23 25 27 29 31 33 35 37 39 41 43 45 47 49 51 53 55 57 59 61 63 65 67 69 71 73 75 77 79
Log_2(Total C
ases)
Days since first reported infection
Log_2(Total cases) versus days since first reported infection
China United States
South Korea Japan
France Spain
Germany United Kingdom
Italy
@2020 Moody's Analytics, Inc., its licensors and affiliates. All rights reserved.
Not for
Dist
ributi
on

3/23/2020
5
The COVID-19 pandemic: Assessing the impact on credit risk, March 2020 9
China is the exception
The J-Curve of default risk
0
0.5
1
1.5
2
2.5
3
1 2 3 4 5 6 7 8 9 10 11 12 13 14 15 16 17 18 19 20 21 22 23 24 25 26 27 28 29 30 31 32 33 34 35 36 37 38 39 40 41 42 43 44 45 46 47 48 49 50 51 52 53 54 55 56 57
Trading Days Since First Recorded Infection
75th Percentile EDF relative to 75th percentile EDF at first infection date
China United States South Korea Japan Italy France Spain Germany United Kingdom
2 Industry and country impacts
@2020 Moody's Analytics, Inc., its licensors and affiliates. All rights reserved.
Not for
Dist
ributi
on

3/23/2020
6
The COVID-19 pandemic: Assessing the impact on credit risk, March 2020 11
• Demand shock (Expected) Earnings shock
Firm asset shock
Shock to Firm Equity Values
Shock to Firm Market Leverage Increased vulnerability
• Global industry shocks affect countries that specialize in those industries
• We look at average asset and equity shocks at the industry/country level during the Jan. 20-March 18 period.
Assessing equity returns and leverage impacts
COVID-19: Market impacts so far
The COVID-19 pandemic: Assessing the impact on credit risk, March 2020 12
Global public firms, January 20-March 18, 2020
Average equity vs. asset returns by industry
MINING
AGRICULTURE
OIL GAS & COAL EXPL.
OIL REFINING
APPAREL & SHOES
UTILITIES GASHOTELS & RESTAURANTS
CONSUMER PRODUCTS RETL/WHSL
CONSUMER DURABLES RETL/WHSL
AIR TRANSPORTATION
LESSORS
y = 0.6896x ‐ 0.1744R² = 0.2921
‐60.00%
‐50.00%
‐40.00%
‐30.00%
‐20.00%
‐10.00%
0.00%
‐32% ‐27% ‐22% ‐17% ‐12% ‐7% ‐2%
Equity Return: Jan
20 to M
arch 18
Asset Return: Jan 20 to March 18
Market vs. Asset Return by Global Industry: January 20‐March 18, 2020
@2020 Moody's Analytics, Inc., its licensors and affiliates. All rights reserved.
Not for
Dist
ributi
on

3/23/2020
7
The COVID-19 pandemic: Assessing the impact on credit risk, March 2020 13
Industries with highly levered large cap firms feel outsized impact
Average equity vs. asset returns by industry
MINING
AGRICULTURE
OIL GAS & COAL EXPL.
OIL REFINING
APPAREL & SHOES
UTILITIES GASHOTELS & RESTAURANTS
CONSUMER PRODUCTS RETL/WHSL
CONSUMER DURABLES RETL/WHSL
AIR TRANSPORTATION
LESSORS
y = 0.6896x ‐ 0.1744R² = 0.2921
‐60.00%
‐50.00%
‐40.00%
‐30.00%
‐20.00%
‐10.00%
0.00%
‐32% ‐27% ‐22% ‐17% ‐12% ‐7% ‐2%
Equity Return: Jan
20 to M
arch 18
Asset Return: Jan 20 to March 18
Market vs. Asset Return by Global Industry: January 20‐March 18, 2020
Oil & Gas, Hotels & Restaurants, Airlines the worst hit overall
MS1
The COVID-19 pandemic: Assessing the impact on credit risk, March 2020 14
Global public firms, January 20-March 18, 2020
Average equity vs. asset returns by country
JAPAN
CHINA
SPAIN
GREECE
ITALYFRANCE
UNITED STATES
UNITED KINGDOMCHILE
ARGENTINA
RUSSIAN FEDERATION
SAUDI ARABIA
NEW ZEALAND
y = 1.2684x ‐ 0.1194R² = 0.7134
‐80.0%
‐70.0%
‐60.0%
‐50.0%
‐40.0%
‐30.0%
‐20.0%
‐10.0%
0.0%
‐36.0% ‐31.0% ‐26.0% ‐21.0% ‐16.0% ‐11.0% ‐6.0% ‐1.0% 4.0%
Equity Return: Jan
20 to M
arch 18
Asset Return: Jan 20 to March 18
Equity Return vs Asset Return
@2020 Moody's Analytics, Inc., its licensors and affiliates. All rights reserved.
Not for
Dist
ributi
on

Slide 13
MS1 Malone, Samuel, 3/20/2020
@2020 Moody's Analytics, Inc., its licensors and affiliates. All rights reserved.
Not for
Dist
ributi
on

3/23/2020
8
The COVID-19 pandemic: Assessing the impact on credit risk, March 2020 15
Commodity country equities have been hit especially hard
Average equity vs. asset returns by country
JAPAN
CHINA
SPAIN
GREECE
ITALYFRANCE
UNITED STATES
UNITED KINGDOMCHILE
ARGENTINA
RUSSIAN FEDERATION
SAUDI ARABIA
NEW ZEALAND
y = 1.2684x ‐ 0.1194R² = 0.7134
‐80.0%
‐70.0%
‐60.0%
‐50.0%
‐40.0%
‐30.0%
‐20.0%
‐10.0%
0.0%
‐36.0% ‐31.0% ‐26.0% ‐21.0% ‐16.0% ‐11.0% ‐6.0% ‐1.0% 4.0%
Equity Return: Jan
20 to M
arch 18
Asset Return: Jan 20 to March 18
Equity Return vs Asset Return
Commodity exporters and selected EMs suffer disproportionately.
The COVID-19 pandemic: Assessing the impact on credit risk, March 2020 16
High leverage adversely impacts Southern European corporates
Average equity vs. asset returns by country
JAPAN
CHINA
SPAIN
GREECE
ITALYFRANCE
UNITED STATES
UNITED KINGDOMCHILE
ARGENTINA
RUSSIAN FEDERATION
SAUDI ARABIA
NEW ZEALAND
y = 1.2684x ‐ 0.1194R² = 0.7134
‐80.0%
‐70.0%
‐60.0%
‐50.0%
‐40.0%
‐30.0%
‐20.0%
‐10.0%
0.0%
‐36.0% ‐31.0% ‐26.0% ‐21.0% ‐16.0% ‐11.0% ‐6.0% ‐1.0% 4.0%
Equity Return: Jan
20 to M
arch 18
Asset Return: Jan 20 to March 18
Equity Return vs Asset Return
Italy, Spain, Greece see large negative equity returns compared to underlying shocks to corporate assets.
@2020 Moody's Analytics, Inc., its licensors and affiliates. All rights reserved.
Not for
Dist
ributi
on

3/23/2020
9
The COVID-19 pandemic: Assessing the impact on credit risk, March 2020 17
Global public firms, March 18, 2020
Corporate book and market leverage by country
JAPAN
CHINA
SPAIN
GREECE
ITALY
FRANCE
UNITED STATES
KOREA UNITED KINGDOM
y = 0.5562x + 1.74R² = 0.2101
0.00
2.00
4.00
6.00
8.00
10.00
12.00
14.00
0.00 2.00 4.00 6.00 8.00 10.00 12.00
Market Leverage: M
arch 18
Book Leverage: March 18
Market Leverage vs. Book Leverage at the Country Level: March 18
The COVID-19 pandemic: Assessing the impact on credit risk, March 2020 18
High leverage plus a shock begets higher leverage
Corporate book and market leverage by country
JAPAN
CHINA
SPAIN
GREECE
ITALY
FRANCE
UNITED STATES
KOREA UNITED KINGDOM
y = 0.5562x + 1.74R² = 0.2101
0.00
2.00
4.00
6.00
8.00
10.00
12.00
14.00
0.00 2.00 4.00 6.00 8.00 10.00 12.00
Market Leverage: M
arch 18
Book Leverage: March 18
Market Leverage vs. Book Leverage at the Country Level: March 18
Outsized shocks to equity values leave market leverage in Southern Europe especially high.
@2020 Moody's Analytics, Inc., its licensors and affiliates. All rights reserved.
Not for
Dist
ributi
on

3/23/2020
10
The COVID-19 pandemic: Assessing the impact on credit risk, March 2020 19
• The mean and 75th percentile of the PD distribution for an industry or country reveals a lot about likely defaults ahead
• So let’s see where the tail of default risk has been most sensitive to the effects of the COVID-19 pandemic
We now focus on shocks to the right tail of the PD distribution
Assessing likely default impacts
The COVID-19 pandemic: Assessing the impact on credit risk, March 2020 20
Results for tail default risk measures and end dates
Top 5 countries
Risk Discovery:
United States,
Developed Oil Producers,
Emerging Markets
have felt the biggest impact
3/12
3/18
Delta (q75‐q50) Delta q75 Delta mean
BERMUDA CANADA ARGENTINA
UNITED STATES UNITED STATES CANADA
CANADA BERMUDA NORWAY
POLAND POLAND SOUTH AFRICA
SINGAPORE GREECE UNITED STATES
Delta (q75‐q50) Delta q75 Delta mean
UNITED STATES UNITED STATES ARGENTINA
BERMUDA CANADA BERMUDA
CANADA ARGENTINA CANADA
ARGENTINA BERMUDA NORWAY
SINGAPORE GREECE UNITED STATES
Top 5 Countries by Increased Default Risk (Jan. 20 to March 12)
Top 5 Countries by Increased Default Risk (Jan. 20 to March 18)
@2020 Moody's Analytics, Inc., its licensors and affiliates. All rights reserved.
Not for
Dist
ributi
on

3/23/2020
11
The COVID-19 pandemic: Assessing the impact on credit risk, March 2020 21
Results for tail default risk measures and end dates
Top 5 global industries
3/12
3/18
Supply Glut + Cyclical Demand Shock:
Oil & Gas and Entertainment & Leisure, escalating to Oil & Gas andConsumer Cyclicals
Delta (q75‐q50) Delta q75 Delta mean
BROADCAST MEDIA OIL GAS & COAL EXPL/PROD OIL GAS & COAL EXPL/PROD
OIL GAS & COAL EXPL/PROD BROADCAST MEDIA PRINTING
CABLE TV ENTERTAINMENT & LEISURE ENTERTAINMENT & LEISURE
ENTERTAINMENT & LEISURE CABLE TV BROADCAST MEDIA
UTILITIES GAS AIR TRANSPORTATION OIL REFINING
Delta (q75‐q50) Delta q75 Delta mean
OIL GAS & COAL EXPL/PROD OIL GAS & COAL EXPL/PROD OIL GAS & COAL EXPL/PROD
BROADCAST MEDIA BROADCAST MEDIA CONSUMER DURABLES RETL/WHSL
TELEPHONE ENTERTAINMENT & LEISURE BROADCAST MEDIA
CONSUMER DURABLES RETL/WHSL TELEPHONE TRANSPORTATION EQUIPMENT
ENTERTAINMENT & LEISURE CONSUMER DURABLES RETL/WHSL AEROSPACE & DEFENSE
Top 5 Industries by Increased Default Risk (Jan. 20 to March 12)
Top 5 Industries by Increased Default Risk (Jan. 20 to March 18)
The COVID-19 pandemic: Assessing the impact on credit risk, March 2020 22
Results for tail default risk measures and end dates
Top 5 global industries
Structural Decline + Black Swan:
Oil & Gas and Printing, Cable TV, Broadcast Media
Delta (q75‐q50) Delta q75 Delta mean
BROADCAST MEDIA OIL GAS & COAL EXPL/PROD OIL GAS & COAL EXPL/PROD
OIL GAS & COAL EXPL/PROD BROADCAST MEDIA PRINTING
CABLE TV ENTERTAINMENT & LEISURE ENTERTAINMENT & LEISURE
ENTERTAINMENT & LEISURE CABLE TV BROADCAST MEDIA
UTILITIES GAS AIR TRANSPORTATION OIL REFINING
Delta (q75‐q50) Delta q75 Delta mean
OIL GAS & COAL EXPL/PROD OIL GAS & COAL EXPL/PROD OIL GAS & COAL EXPL/PROD
BROADCAST MEDIA BROADCAST MEDIA CONSUMER DURABLES RETL/WHSL
TELEPHONE ENTERTAINMENT & LEISURE BROADCAST MEDIA
CONSUMER DURABLES RETL/WHSL TELEPHONE TRANSPORTATION EQUIPMENT
ENTERTAINMENT & LEISURE CONSUMER DURABLES RETL/WHSL AEROSPACE & DEFENSE
Top 5 Industries by Increased Default Risk (Jan. 20 to March 18)
Top 5 Industries by Increased Default Risk (Jan. 20 to March 12)
@2020 Moody's Analytics, Inc., its licensors and affiliates. All rights reserved.
Not for
Dist
ributi
on

3/23/2020
12
The COVID-19 pandemic: Assessing the impact on credit risk, March 2020 23
Results for tail default risk measures and end dates
Top 5 industries for U.S.
Risk Discovery:
Greatest Default Risk Impact Shifting from Oil & Gas to Consumer Cyclicals
3/12
3/18
Delta (q75‐q50) Delta q75 Delta mean
PRINTING PRINTING PRINTING
TEXTILES OIL GAS & COAL EXPL/PROD OIL GAS & COAL EXPL/PROD
OIL REFINING OIL REFINING OIL REFINING
CHEMICALS TEXTILES ENTERTAINMENT & LEISURE
OIL GAS & COAL EXPL/PROD CONSUMER PRODUCTS RETL/WHSL BROADCAST MEDIA
Delta (q75‐q50) Delta q75 Delta mean
CONSUMER DURABLES RETL/WHSL AUTOMOTIVE PRINTING
CONSUMER PRODUCTS ENTERTAINMENT & LEISURE CONSUMER DURABLES RETL/WHSL
PLASTIC & RUBBER CONSUMER DURABLES RETL/WHSL CONSUMER PRODUCTS
ENTERTAINMENT & LEISURE CONSUMER PRODUCTS PLASTIC & RUBBER
APPAREL & SHOES PLASTIC & RUBBER OIL REFINING
Top 5 Industries by Increased Default Risk (Jan. 20 to March 18): U.S.
Top 5 Industries by Increased Default Risk (Jan. 20 to March 12): U.S.
The COVID-19 pandemic: Assessing the impact on credit risk, March 2020 24
Results for tail default risk measures and end dates
Top 5 industries for Western Europe
Risk Discovery:
Greatest Default Risk Impact Shifting from Oil & Gas and Automotive to Oil & Gas, Air Transportation and Consumer Cyclicals
3/12
3/18
Delta (q75‐q50) Delta q75 Delta mean
OIL GAS & COAL EXPL/PROD OIL GAS & COAL EXPL/PROD OIL GAS & COAL EXPL/PROD
AUTOMOTIVE APPAREL & SHOES PLASTIC & RUBBER
APPAREL & SHOES AUTOMOTIVE COMPUTER HARDWARE
AGRICULTURE AGRICULTURE CONSUMER PRODUCTS RETL/WHSL
SEMICONDUCTORS SEMICONDUCTORS AUTOMOTIVE
Delta (q75‐q50) Delta q75 Delta mean
CABLE TV CABLE TV OIL GAS & COAL EXPL/PROD
AIR TRANSPORTATION AIR TRANSPORTATION UTILITIES NEC
OIL GAS & COAL EXPL/PROD OIL GAS & COAL EXPL/PROD CONSUMER PRODUCTS RETL/WHSL
APPAREL & SHOES APPAREL & SHOES AIR TRANSPORTATION
ENTERTAINMENT & LEISURE CONSUMER PRODUCTS RETL/WHSL ELECTRONIC EQUIPMENT
Top 5 Industries by Increased Default Risk (Jan. 20 to March 18): W. Europe
Top 5 Industries by Increased Default Risk (Jan. 20 to March 12): W. Europe
@2020 Moody's Analytics, Inc., its licensors and affiliates. All rights reserved.
Not for
Dist
ributi
on
3/23/2020
13
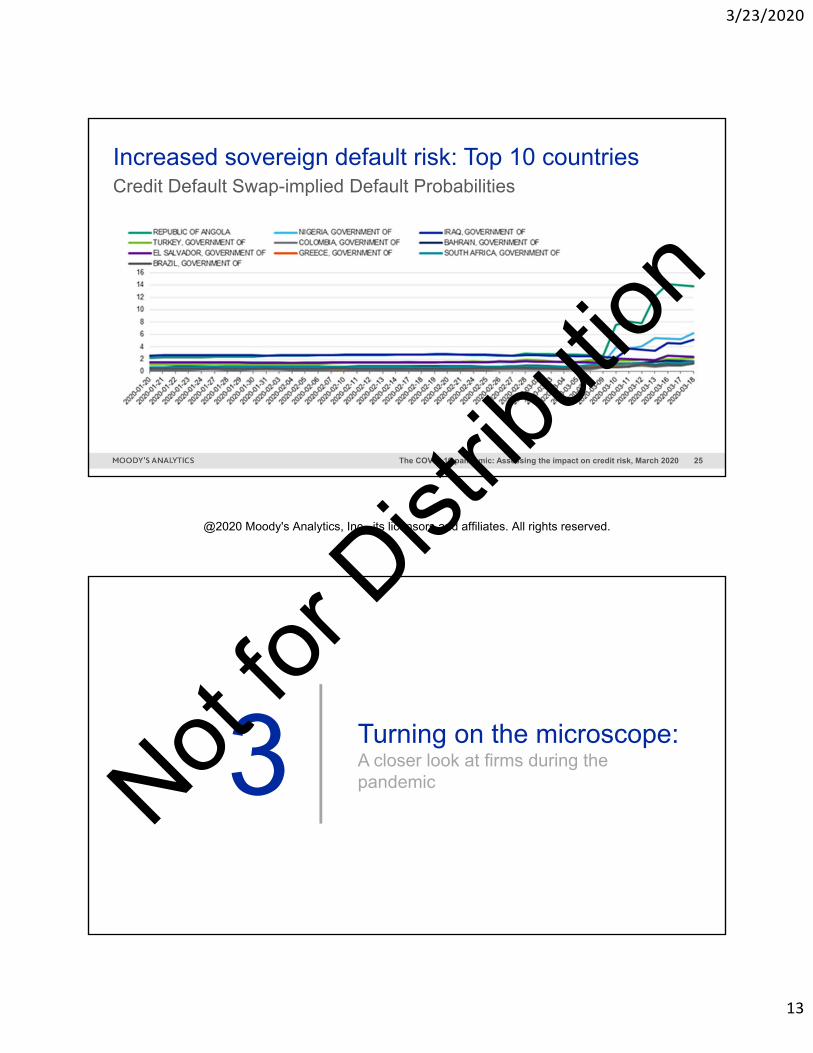
The COVID-19 pandemic: Assessing the impact on credit risk, March 2020 25
Credit Default Swap-implied Default Probabilities
Increased sovereign default risk: Top 10 countries
3 Turning on the microscope: A closer look at firms during the pandemic
@2020 Moody's Analytics, Inc., its licensors and affiliates. All rights reserved.
Not for
Dist
ributi
on

3/23/2020
14
The COVID-19 pandemic: Assessing the impact on credit risk, March 2020 27
Selected companies: relative EDF change (1/20 to 3/18)Cruise
Industry is at risk
Airline/Travel Industries are at risk
Zoom, Campbell Soup and Cloroxare performing
well
Oil & Gas Industries are at risk
-100% 0% 100% 200% 300% 400% 500% 600% 700%
CAMPBELL SOUP COZOOM VIDEO COMMUNICATIONS, INC.
CLOROX COJOHNSON & JOHNSONHORMEL FOODS CORP
NETFLIX INC3M
CHEVRON CORPBP PLC
SWISS RE AGEXXON MOBIL CORP
ANHEUSER BUSCH INBEV NVHUNTSMAN CORP
FREEPORT-MCMORAN INCDEUTSCHE LUFTHANSA AG
DELTA AIR LINES INCEXPEDIA GROUP INC
EASYJET PLCAKER BP ASA
UNITED AIRLINES HOLDINGS, INC.CARNIVAL CORP/PLC (USA)
ROYAL CARIBBEAN CRUISES LTD
3,719%1,543%
7,017%6,397%
4 Flight-to-credit-quality: equities and fixed income
@2020 Moody's Analytics, Inc., its licensors and affiliates. All rights reserved.
Not for
Dist
ributi
on
3/23/2020
15
The COVID-19 pandemic: Assessing the impact on credit risk, March 2020 29
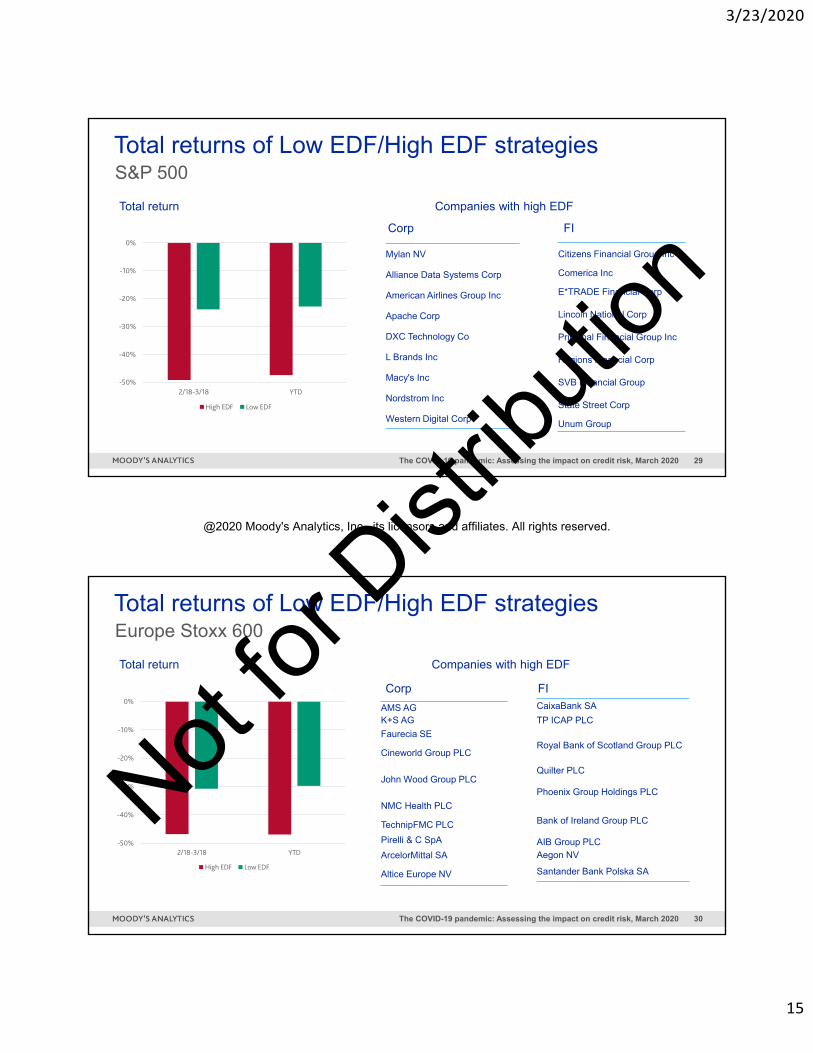
Total returns of Low EDF/High EDF strategies
Total return Companies with high EDF
S&P 500
Corp FI
Mylan NV
Alliance Data Systems Corp
American Airlines Group Inc
Apache Corp
DXC Technology Co
L Brands Inc
Macy's Inc
Nordstrom Inc
Western Digital Corp
Citizens Financial Group Inc
Comerica Inc
E*TRADE Financial Corp
Lincoln National Corp
Principal Financial Group Inc
Regions Financial Corp
SVB Financial Group
State Street Corp
Unum Group
-50%
-40%
-30%
-20%
-10%
0%
2/18-3/18 YTD
High EDF Low EDF
The COVID-19 pandemic: Assessing the impact on credit risk, March 2020 30
Total returns of Low EDF/High EDF strategies
Total return Companies with high EDF
Europe Stoxx 600
Corp FI
AMS AGK+S AG
Faurecia SE
Cineworld Group PLC
John Wood Group PLC
NMC Health PLC
TechnipFMC PLC
Pirelli & C SpA
ArcelorMittal SA
Altice Europe NV
CaixaBank SA
TP ICAP PLC
Royal Bank of Scotland Group PLC
Quilter PLC
Phoenix Group Holdings PLC
Bank of Ireland Group PLC
AIB Group PLCAegon NV
Santander Bank Polska SA
-50%
-40%
-30%
-20%
-10%
0%
2/18-3/18 YTD
High EDF Low EDF
@2020 Moody's Analytics, Inc., its licensors and affiliates. All rights reserved.
Not for
Dist
ributi
on

3/23/2020
16
The COVID-19 pandemic: Assessing the impact on credit risk, March 2020 31
Use bond PDs to make a finer distinction amongst bonds
Fixed income strategy: Go long high credit quality
• Divide the eligible securities into five duration buckets and two sectors buckets (FIN and IND/UTL, for Investment Grade only) per duration cell, so 10 in total (5 in High Yield).
• Within each duration/sector bucket, rank the bonds by their EDFs.
• Select the bonds in the high 20% and the low 20% of each duration bucket’s rank order by bond count.
• On a daily basis, calculate the market value-weighted total returns of the high and low 20% bucket in each duration/sector bucket.
• Combine the duration bucket results on a market value-weighted basis
The COVID-19 pandemic: Assessing the impact on credit risk, March 2020 32
Cumulative total returns of Low EDF/High EDF strategies
1
1.07
1.14
1.21
1.28
1.35
1/22 1/28 2/03 2/09 2/15 2/21 2/27 3/04
Low EDF High EDF
0.8
0.9
1
1.1
1.2
1/22 1/28 2/03 2/09 2/15 2/21 2/27 3/04
Low EDF High EDF
US Investment Grade US High Yield
The flight-to-credit quality, present in IG, is overwhelming in HY
@2020 Moody's Analytics, Inc., its licensors and affiliates. All rights reserved.
Not for
Dist
ributi
on

3/23/2020
17
5 Forecasting credit risk under economic scenarios
The COVID-19 pandemic: Assessing the impact on credit risk, March 2020 34
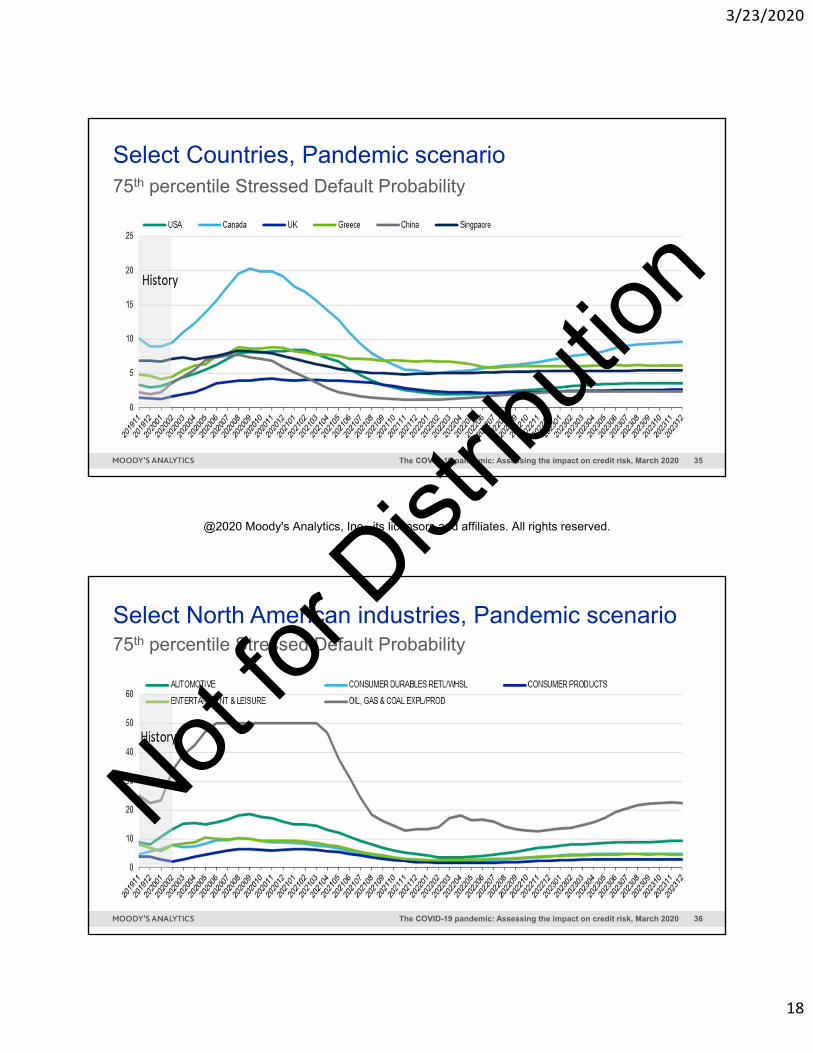
• The Stressed EDF model is used to forecast EDFs, conditioned on an economic scenario
• In early-March, our Economics team produced 3 COVID-19 scenarios: Baseline, Downside, Pandemic
• The Pandemic scenario is now the most likely:
• US GDP falls 2%
• US unemployment rate rises from 3.5% to 5.4%
• S&P 500 falls 26%
Projecting credit risk using Stressed EDFs
@2020 Moody's Analytics, Inc., its licensors and affiliates. All rights reserved.
Not for
Dist
ributi
on
3/23/2020
18
The COVID-19 pandemic: Assessing the impact on credit risk, March 2020 35
75th percentile Stressed Default Probability
Select Countries, Pandemic scenario
The COVID-19 pandemic: Assessing the impact on credit risk, March 2020 36
75th percentile Stressed Default Probability
Select North American industries, Pandemic scenario
@2020 Moody's Analytics, Inc., its licensors and affiliates. All rights reserved.
Not for
Dist
ributi
on

3/23/2020
19
The COVID-19 pandemic: Assessing the impact on credit risk, March 2020 37
75th percentile Stressed Default Probability
Select W. European industries, Pandemic scenario
The COVID-19 pandemic: Assessing the impact on credit risk, March 2020 38
• Default risk impacts of the COVID-19 pandemic have been notable so far for several industries
• Our projection of default risk for the Oil & Gas industry in particular is dire if current supply and demand conditions persist
• U.S. and Southern European corporate sectors are at elevated risk
• Moving along the S-curve of confirmed cases, through effective suppression of COVID-19 and effective policy measures, is key to stabilizing markets and capping default risk
Where we might go from here
Conclusions
@2020 Moody's Analytics, Inc., its licensors and affiliates. All rights reserved.
Not for
Dist
ributi
on

3/23/2020
20
The COVID-19 pandemic: Assessing the impact on credit risk, March 2020 39
Continue the conversation on Thursday
Register at www.moodysanalytics.com/events
Samuel W. Malone, [email protected]
moodysanalytics.com
Yukyung [email protected]
Glenn [email protected]
@2020 Moody's Analytics, Inc., its licensors and affiliates. All rights reserved.
Not for
Dist
ributi
on
3/23/2020
21
The COVID-19 pandemic: Assessing the impact on credit risk, March 2020 41
© 2020 Moody’s Corporation, Moody’s Investors Service, Inc., Moody’s Analytics, Inc. and/or their licensors and affiliates (collectively, “MOODY’S”). All rights reserved.
CREDIT RATINGS ISSUED BY MOODY'S INVESTORS SERVICE, INC. AND/OR ITS CREDIT RATINGS AFFILIATES ARE MOODY’S CURRENT OPINIONS OF THE RELATIVE FUTURE CREDIT RISK OF ENTITIES, CREDIT COMMITMENTS, OR DEBT OR DEBT-LIKE SECURITIES, AND MATERIALS, PRODUCTS, SERVICES AND INFORMATION PUBLISHED BY MOODY’S (COLLECTIVELY, “PUBLICATIONS”) MAY INCLUDE SUCH CURRENT OPINIONS. MOODY’S INVESTORS SERVICE DEFINES CREDIT RISK AS THE RISK THAT AN ENTITY MAY NOT MEET ITS CONTRACTUAL FINANCIAL OBLIGATIONS AS THEY COME DUE AND ANY ESTIMATED FINANCIAL LOSS IN THE EVENT OF DEFAULT OR IMPAIRMENT. SEE MOODY’S RATING SYMBOLS AND DEFINITIONS PUBLICATION FOR INFORMATION ON THE TYPES OF CONTRACTUAL FINANCIAL OBLIGATIONS ADDRESSED BY MOODY’S INVESTORS SERVICE CREDIT RATINGS. CREDIT RATINGS DO NOT ADDRESS ANY OTHER RISK, INCLUDING BUT NOT LIMITED TO: LIQUIDITY RISK, MARKET VALUE RISK, OR PRICE VOLATILITY. CREDIT RATINGS, NON-CREDIT ASSESSMENTS (“ASSESSMENTS”), AND OTHER OPINIONS INCLUDED IN MOODY’S PUBLICATIONS ARE NOT STATEMENTS OF CURRENT OR HISTORICAL FACT. MOODY’S PUBLICATIONS MAY ALSO INCLUDE QUANTITATIVE MODEL-BASED ESTIMATES OF CREDIT RISK AND RELATED OPINIONS OR COMMENTARY PUBLISHED BY MOODY’S ANALYTICS, INC. AND/OR ITS AFFILIATES. MOODY’S CREDIT RATINGS, ASSESSMENTS, OTHER OPINIONS AND PUBLICATIONS DO NOT CONSTITUTE OR PROVIDE INVESTMENT OR FINANCIAL ADVICE, AND MOODY’S CREDIT RATINGS, ASSESSMENTS, OTHER OPINIONS AND PUBLICATIONS ARE NOT AND DO NOT PROVIDE RECOMMENDATIONS TO PURCHASE, SELL, OR HOLD PARTICULAR SECURITIES. MOODY’S CREDIT RATINGS, ASSESSMENTS, OTHER OPINIONS AND PUBLICATIONS DO NOT COMMENT ON THE SUITABILITY OF AN INVESTMENT FOR ANY PARTICULAR INVESTOR. MOODY’S ISSUES ITS CREDIT RATINGS, ASSESSMENTS AND OTHER OPINIONS AND PUBLISHES ITS PUBLICATIONS WITH THE EXPECTATION AND UNDERSTANDING THAT EACH INVESTOR WILL, WITH DUE CARE, MAKE ITS OWN STUDY AND EVALUATION OF EACH SECURITY THAT IS UNDER CONSIDERATION FOR PURCHASE, HOLDING, OR SALE.
MOODY’S CREDIT RATINGS, ASSESSMENTS, OTHER OPINIONS, AND PUBLICATIONS ARE NOT INTENDED FOR USE BY RETAIL INVESTORS AND IT WOULD BE RECKLESS AND INAPPROPRIATE FOR RETAIL INVESTORS TO USE MOODY’S CREDIT RATINGS, ASSESSMENTS, OTHER OPINIONS OR PUBLICATIONS WHEN MAKING AN INVESTMENT DECISION. IF IN DOUBT YOU SHOULD CONTACT YOUR FINANCIAL OR OTHER PROFESSIONAL ADVISER.
ALL INFORMATION CONTAINED HEREIN IS PROTECTED BY LAW, INCLUDING BUT NOT LIMITED TO, COPYRIGHT LAW, AND NONE OF SUCH INFORMATION MAY BE COPIED OR OTHERWISE REPRODUCED, REPACKAGED, FURTHER TRANSMITTED, TRANSFERRED, DISSEMINATED, REDISTRIBUTED OR RESOLD, OR STORED FOR SUBSEQUENT USE FOR ANY SUCH PURPOSE, IN WHOLE OR IN PART, IN ANY FORM OR MANNER OR BY ANY MEANS WHATSOEVER, BY ANY PERSON WITHOUT MOODY’S PRIOR WRITTEN CONSENT.
MOODY’S CREDIT RATINGS, ASSESSMENTS, OTHER OPINIONS AND PUBLICATIONS ARE NOT INTENDED FOR USE BY ANY PERSON AS A BENCHMARK AS THAT TERM IS DEFINED FOR REGULATORY PURPOSES AND MUST NOT BE USED IN ANY WAY THAT COULD RESULT IN THEM BEING CONSIDERED A BENCHMARK.
All information contained herein is obtained by MOODY’S from sources believed by it to be accurate and reliable. Because of the possibility of human or mechanical error as well as other factors, however, all information contained herein is provided “AS IS” without warranty of any kind. MOODY'S adopts all necessary measures so that the information it uses in assigning a credit rating is of sufficient quality and from sources MOODY'S considers to be reliable including, when appropriate, independent third-party sources. However, MOODY’S is not an auditor and cannot in every instance independently verify or validate information received in the rating process or in preparing its Publications.
To the extent permitted by law, MOODY’S and its directors, officers, employees, agents, representatives, licensors and suppliers disclaim liability to any person or entity for any indirect, special, consequential, or incidental losses or damages whatsoever arising from or in connection with the information contained herein or the use of or inability to use any such information, even if MOODY’S or any of its directors, officers, employees, agents, representatives, licensors or suppliers is advised in advance of the possibility of such losses or damages, including but not limited to: (a) any loss of present or prospective profits or (b) any loss or damage arising where the relevant financial instrument is not the subject of a particular credit rating assigned by MOODY’S.
To the extent permitted by law, MOODY’S and its directors, officers, employees, agents, representatives, licensors and suppliers disclaim liability for any direct or compensatory losses or damages caused to any person or entity, including but not limited to by any negligence (but excluding fraud, willful misconduct or any other type of liability that, for the avoidance of doubt, by law cannot be excluded) on the part of, or any contingency within or beyond the control of, MOODY’S or any of its directors, officers, employees, agents, representatives, licensors or suppliers, arising from or in connection with the information contained herein or the use of or inability to use any such information.
NO WARRANTY, EXPRESS OR IMPLIED, AS TO THE ACCURACY, TIMELINESS, COMPLETENESS, MERCHANTABILITY OR FITNESS FOR ANY PARTICULAR PURPOSE OF ANY CREDIT RATING, ASSESSMENT, OTHER OPINION OR INFORMATION IS GIVEN OR MADE BY MOODY’S IN ANY FORM OR MANNER WHATSOEVER.
Moody’s Investors Service, Inc., a wholly-owned credit rating agency subsidiary of Moody’s Corporation (“MCO”), hereby discloses that most issuers of debt securities (including corporate and municipal bonds, debentures, notes and commercial paper) and preferred stock rated by Moody’s Investors Service, Inc. have, prior to assignment of any credit rating, agreed to pay to Moody’s Investors Service, Inc. for credit ratings opinions and services rendered by it fees ranging from $1,000 to approximately $2,700,000. MCO and Moody’s investors Service also maintain policies and procedures to address the independence of Moody’s Investors Service credit ratings and credit rating processes. Information regarding certain affiliations that may exist between directors of MCO and rated entities, and between entities who hold credit ratings from Moody’s Investors Service and have also publicly reported to the SEC an ownership interest in MCO of more than 5%, is posted annually at www.moodys.com under the heading “Investor Relations — Corporate Governance — Director and Shareholder Affiliation Policy.”
Additional terms for Australia only: Any publication into Australia of this document is pursuant to the Australian Financial Services License of MOODY’S affiliate, Moody’s Investors Service Pty Limited ABN 61 003 399 657AFSL 336969 and/or Moody’s Analytics Australia Pty Ltd ABN 94 105 136 972 AFSL 383569 (as applicable). This document is intended to be provided only to “wholesale clients” within the meaning of section 761G of the Corporations Act 2001. By continuing to access this document from within Australia, you represent to MOODY’S that you are, or are accessing the document as a representative of, a “wholesale client” and that neither you nor the entity you represent will directly or indirectly disseminate this document or its contents to “retail clients” within the meaning of section 761G of the Corporations Act 2001. MOODY’S credit rating is an opinion as to the creditworthiness of a debt obligation of the issuer, not on the equity securities of the issuer or any form of security that is available to retail investors.
Additional terms for Japan only: Moody's Japan K.K. (“MJKK”) is a wholly-owned credit rating agency subsidiary of Moody's Group Japan G.K., which is wholly-owned by Moody’s Overseas Holdings Inc., a wholly-owned subsidiary of MCO. Moody’s SF Japan K.K. (“MSFJ”) is a wholly-owned credit rating agency subsidiary of MJKK. MSFJ is not a Nationally Recognized Statistical Rating Organization (“NRSRO”). Therefore, credit ratings assigned by MSFJ are Non-NRSRO Credit Ratings. Non-NRSRO Credit Ratings are assigned by an entity that is not a NRSRO and, consequently, the rated obligation will not qualify for certain types of treatment under U.S. laws. MJKK and MSFJ are credit rating agencies registered with the Japan Financial Services Agency and their registration numbers are FSA Commissioner (Ratings) No. 2 and 3 respectively.
MJKK or MSFJ (as applicable) hereby disclose that most issuers of debt securities (including corporate and municipal bonds, debentures, notes and commercial paper) and preferred stock rated by MJKK or MSFJ (as applicable) have, prior to assignment of any credit rating, agreed to pay to MJKK or MSFJ (as applicable) for credit ratings opinions and services rendered by it fees ranging from JPY125,000 to approximately JPY250,000,000.
MJKK and MSFJ also maintain policies and procedures to address Japanese regulatory requirements.
@2020 Moody's Analytics, Inc., its licensors and affiliates. All rights reserved.
Not for
Dist
ributi
on