not-for-profit ratios for financial resilience and internal accountability: a study of australian...
TRANSCRIPT

Not-For-Profit Ratios for Financial Resilience and InternalAccountability: A Study of Australian International Aid
Organisations
Christine Ryan & Helen Irvine
The establishment of the new Australian not-for-profit (NFP) regulator,1 the Australian Charitiesand Not-for-Profits Commission (ACNC), is an
acknowledgment of society’s increasing reliance on thecontribution of NFP organisations and the need toensure their effective operation. It also provides anopportunity to develop appropriate regulatory systemsand practices that reflect the importance of the ongoingfinancial resilience of organisations in the sector. Thisrequires both boards and management of NFPs to makean assessment of the financial health and sustainability oftheir organisations (Hough 2009). This paper addressesthis vital issue in the context of the developmentof internal accountability mechanisms, specifically keyfinancial ratios.
The body of literature on NFP financial ratios hasproduced some insightful, yet ambiguous and conflictingfindings (Bhattacharya and Tinkelman 2009; Ashleyand Faulk 2010; Cnaan et al. 2011). This literaturehas two strands. The first, and more common one,is based around the monitoring of an organisation’sfinances by external agencies, while the second strandis based around the use of financial informationto assist management decision making. The morecommon strand focuses on the use of accountingratios as a monitoring and supervisory tool primarilyby external parties, be they regulators, monitoringagencies or other external stakeholders (Tuckman andChang 1991; Bowman 2006). Using primarily UnitedStates data,2 the focus has been mainly on predictingorganisational vulnerability (Ohlson 1980; Trussel 2002)and the production of efficiency ratios by NFP ratingsagencies for use by external stakeholders (Steinberg 1983;Bowman 2006; Tinkelman 2006; Strom 2010; BBB 2010;Charity Navigator 2010; AIP 2010).3
While these ratios could be seen as producing somekey insights, their inclusion in ratings tables has beencriticised as being potentially ‘highly misleading todonors’ (Sargeant et al. 2009: 339),4 and as possiblystimulating NFP organisations to manipulate ratios
Not-for-profit (NFP) financial ratio research has focusedprimarily on organisational efficiency measurements forexternal stakeholders. Ratios that also captureinformation about stability, capacity (liquidity), gearingand sustainability enable an assessment of financialresilience. They are thus valuable tools that can provide aframework of internal accountability between boards andmanagement. The establishment of an Australian NFPregulator highlights the importance of NFP sustainability,and affirms the timeliness of this paper. We propose asuite of key financial ratios for use by NFP boards andmanagement, and demonstrate its practical usefulness byapplying the ratios to financial data from the 2009 reportsof ACFID (Australian Council for InternationalDevelopment) affiliated international aid organisations.
CorrespondenceHelen Irvine, School of Accountancy, Queensland Universityof Technology, GPO Box 2434, Brisbane QLD, 4001; Tel:+61 7 3138 2856; fax: +61 7 3138 1218; email: [email protected].
doi: 10.1111/j.1835-2561.2012.00163.x
Australian Accounting Review No. 61 Vol. 22 Issue 2 2012 177

Not-For-Profit Ratios, Resilience and Accountability C. Ryan & H. Irvine
(Trussel 2003).5 Further, the focus on ratings tables cancause researchers and NFP organisations to focus on onegroup of ratios, for example, fundraising expense ratios,and to pay insufficient attention to other NFP financialhealth issues (Tinkelman 2006, 2009; Tinkelman andDonabedian 2007, 2009; Greenlee and Tuckman 2007;Bowman 2011; Besel et al. 2011).
The second strand in the literature focuses onthe potential contribution that ratios can make tosupport management practices, through the provisionof information to internal decision makers (Harrowet al. 1999; Hyndman and McKillop 1999). SomeUK research has identified issues surrounding theuse of financial metrics for these purposes (Kahlerand Sargeant 2002), and has also considered broaderissues of NFP governance and accountability (Har-row et al. 1999; Hyndman and McDonnell 2009;Valentinov 2011). The calculation of key ratios forinternal evaluation can provide valuable informa-tion about an organisation’s financial health andsustainability.
This research is aligned with this latter approach,focusing on the use of financial ratios as a demonstrationof Sinclair’s (1995) managerial accountability. Wedevelop a suite of financial ratios to assist boards andmanagers to understand the financial dynamics of theirorganisations, and we also provide empirical data abouttheir application. In proposing these financial metrics,we recognise that they portray just one aspect of NFPperformance and accountability and that, ultimately,mission achievement must be the primary objective ofNFP organisations.
This paper therefore has a dual purpose. First, wepropose a suite of key financial ratios for internaluse in assessing NFP financial health. Second, weapply those ratios to a group of NFP Australianinternational development organisations affiliated withthe Australian Council for International Development(ACFID). This enables us to provide insights for boardsand management about the range, comparability andrelevance of resulting financial metrics for assessingNFP financial health and resilience and enhancingaccountability.
The focus of the next section of the paper is onthe development of an accountability framework inwhich to situate financial ratios. A set of NFP ratiosis then proposed that is consistent with this frameworkand with the goal of assessing organisational financialhealth. Following this, the study is described, and theselection of a group of ACFID-affiliated organisations isexplained. Presentation and interpretation of the ratioscalculated follows, with concluding comments outliningthe limitations of the study and possibilities for futureresearch.
Internal Accountability
While there is general agreement that NFP organisationsmust demonstrate their accountability (Valentinov2011), and there are calls for greater accountability(Kearns 1994; Harrow et al. 1999; Margolis 2001;Cordery and Baskerville 2011), there is much lessagreement on what accountability is, and how it can bedemonstrated in a NFP context (Ebrahim 2003a, 2005).Accountability can be understood as a social relationship(Roberts 1991), ‘a pervasive feature of organizationaland social life’ (Roberts 2001: 1555) that involves theright to call on another for an account (Hyndman1990) and includes ‘the giving and demanding ofreasons for conduct’ (Roberts and Scapens 1985: 447).Ultimately, any accountability relationship involves anumber of dimensions: who is accountable, for what,to whom and in what form. These dimensions all haveunexplored and contested aspects in the case of NFPorganisations (Kearns 1994; Hyndman and McDonnell2009).
Although instances of NFP fraud or inefficiency(Gibelman and Gelman 2000) have threatened society’strust in NFP organisations, leading to a concernabout their accountability, NFP accountability has notbeen comprehensively theorised (Kreander et al. 2009).Increasingly, however, the complex and multiplicitousnature of NFP accountability is being acknowledgedand identified as a response to a variety of stakeholders(Kearns 1996; Ebrahim 2005). NFP accountabilityrelationships have been described as upward ordownward, hierarchical or holistic, functional or social(Ebrahim 2003a, 2005; O’Dwyer and Unerman 2007,2008; Agyemang et al. 2009). In addition, accountabilityhas been identified as ‘. . . the means through whichindividuals and organizations are held externally toaccount for their actions and as the means by which theytake internal responsibility for continuously shapingand scrutinizing organizational missions, goals, andperformance’ (Ebrahim 2003a: 194).
Accountability thus includes both an external andinternal dimension that encompasses rigorous reflectionon organisational performance (Roberts 1991, 2001; Fry1995; Ebrahim 2003a; O’Dwyer and Unerman 2008).While we accept the multiple dimensions of account-ability, the focus in this paper is on internal financialaccountability, which we identify as one important, yetunresolved piece of the accountability puzzle. In focusingon NFP internal financial accountability, we highlightthe opportunities, and in fact, the necessity, for a NFPorganisation to assess its financial health and its ability tosustain its mission achievement (Ebrahim 2003b). Thisenables the highlighting and addressing of longer-termissues that may be ignored or distorted by the demands
178 Australian Accounting Review C© 2012 CPA Australia

C. Ryan & H. Irvine Not-For-Profit Ratios, Resilience and Accountability
imposed by rigid, hierarchical external accountabilitymechanisms (Roberts 1991; O’Dwyer and Unerman2007, 2008).
Sinclair (1995), in considering to whom CEOs areaccountable in a public sector context, identified threeforms of accountability: political, managerial and public.Her definition of accountability within a managerialmodel identified the need for ‘those with delegatedauthority to be answerable for producing outputs orthe use of resources to achieve certain ends’ (Sinclair,1995: 222). This is applicable to the management andboards of NFP organisations, with their focus on missionachievement, since it internalises accountability, andpresents the possibility of finding new ways of giving anaccount in order to produce ‘a more robust and privatelyanchored experience of accountability’ (Sinclair, 1995:234).
This is therefore a most appropriate way to considerthe accountability relationship between NFP boards andmanagement, where management provides an accountto the board, and the board actually holds managementaccountable ultimately for mission achievement. Thishighlights the need for boards to exercise greatersupervisory skills (Harrow et al. 1999), and their need todemonstrate, like for-profit boards, an understanding offinancial analysis (Jegers 2011).
Financial ratios are a widely accepted means ofaddressing NFP accountability issues, by comparingfinancial metrics between NFP organisations (Frumkinand Kim 2001; Tinkelman and Mankaney 2007). Thesemetrics have also been included as part of a broaderassessment of financial vulnerability or financial health(Tuckman and Chang 1991; Greenlee and Trussel 2000;Hager 2001; Trussel 2002; Greenlee and Tuckman 2007).For the most part, however, they are designed to addressthe concerns of external stakeholders, typically donors(Ashley and Faulk 2010; Strom 2010). In contrast, thispaper focuses on the potential of financial ratios toassist internal stakeholders to achieve organisationalfinancial health, essential for the maintenance of mission.This is a manifestation of an internal managerialaccountability, and represents the outworking of a ‘felt’responsibility (Fry 1995) that transcends ‘traditionalnorms’ of accountability (Sinclair, 1995, p. 219). It canbe seen as distinct from the hierarchical accountabilitydemands imposed by external donors that typicallyfocus on the upward provision of narrow, short-termfinancial measures to satisfy specific regulatory demandsand expectations (O’Dwyer and Unerman 2007, 2008;Ayemang et al. 2009). These could degenerate intoa box-ticking exercise that is counter-productive to aNFP organisation’s long-term financial and missionperformance (Ebrahim 2005; O’Dwyer and Unerman2007; Strom 2010).
The strategic instigation of appropriate internalfinancial accountability regimes can contribute to a NFP
organisation’s overall financial health and sustainability.An organisation that develops such a system of robustinternal accountability will therefore eschew the ‘weakaccountability’ (Connolly and Hyndman 2004: 130)evident in the mere satisfaction of narrow financialexpectations to satisfy specific external accountabilitydemands. Such an approach will result in a situationwhere an organisation is not merely fulfilling legal orinstitutional expectations in a reactive manner, butproactively exercising discretionary power to manage theaccountability dialogue (Kearns 1994). Consistent withexploring new ways of providing an account (Sinclair,1995), this paper proposes a framework through whichboards and management can initiate a dialogue aboutfinancial sustainability.
The next section of the paper presents an accessiblesuite of financial ratios designed to assist boards andmanagement to initiate an assessment of NFP financialhealth.
A Suite of NFP Financial Ratios
In line with the internal focus of this paper wedevelop a suite of indicators that will assist boardsand management to make decisions on the financialhealth – the organisational capacity and longer-term sustainability – of their organisations. Sincethese internal stakeholders have a responsibility to beaccountable for the strategic direction and performanceof their organisations (Forbes and Milliken 1999), anappropriate suite of financial ratios can provide astimulus to initiate important conversations on theseissues, and to enable boards to hold management toaccount. Appendix 1 provides details of the ratiosoutlined below in the five categories of efficiency,stability, capacity (liquidity), gearing and sustainability.These categories and the extant literature are nowexplored.
Efficiency ratios
The four most commonly accepted NFP efficiencyratios are the Administration, Program and FundraisingExpense Ratios and the Cost of Fundraising% ratio.The Cost of Fundraising% ratio indicates the cost ofraising each $1 contributed (Greenlee and Bukovinsky1998; Callen et al. 2003; Greenlee and Tuckman 2007;Tinkleman and Donabedian 2007), while the other threeratios together provide a segmented snapshot of totalexpenditure.6 These are outlined in Appendix 1.
These efficiency ratios reflect the rate at whichfunds are converted into direct benefits for beneficiaries(Hyndman and McKillop 1999). They are of intenseinterest to stakeholders,7 who support organisationsthat have higher spending on programs as opposed
C© 2012 CPA Australia Australian Accounting Review 179
Not-For-Profit Ratios, Resilience and Accountability C. Ryan & H. Irvine
to administration and fundraising (see, for example,Posnett and Sandler 1989; Gordon and Khumawala1999; Callen et al. 2003; Tinkelman 2006; Bowman2006; Tinkelman and Donabedian 2009 in the UScontext; and Hyndman and McKillop 1999 in the UKcontext). A study conducted in the US revealed thatdonors are more favourably disposed to contribute toorganisations with program spending of 60% or more(Harvey and McCrohan 1988). Charity Watch suggeststhat 60% or more is ‘reasonable’ for most charities (AIP2010), with the US Better Business Bureau (BBB 2010)recommending that at least 65% of total expenses of aNFP organisation should be spent on program.
Sargeant and Kahler (1999) observed in their studyof UK charities that 9% of the organisations surveyedreported administration costs of no more than 15%of total expenditures, while Wing et al. (2004) notedthat 13% of organisations in their study reportedzero management and general expenses. This is notnecessarily desirable, since it could lead to ‘pooradministration and ineffective fundraising campaigns’(Hyndman and McKillop 1999: 138). However, ex-penditure patterns that reveal low administrationand fundraising, and consequently higher programexpenditure, reflect societal expectations about theimportance of allocations to program expenditure. Suchis the expectation that program expenditure should berelatively high, that a US study revealed that 7% oforganisations charged all accounting fees to program,while another 20% split them across more than onecategory (Wing et al. 2004). This finding highlightsthe impact of categorisation of expenditure on theseratios, and the difficulty of comparing ratios betweenorganisations that use different categorisations. Thiswould perhaps be less significant where regulatorsprovide detailed guidance on classification, for exampleas in the UK’s Charities Statement of RecommendedPractice (SORP).
The Cost of Fundraising% attracts a great deal ofattention, with pressure for NFP organisations to keepit low (Posnett and Sandler 1989; Tinkelman 1998).The US Better Business Bureau’s Wise Giving Alliance(BBB 2010) and Charity Watch (AIP 2010), and theCanada Revenue Agency (CRA 2009) all recommenda maximum of 35% for the Cost of Fundraising%.In Australia, despite criticisms of the magnitude ofthe fundraising costs of Australian NFP organisations(Senate Standing Committee on Economics 2008;Choice 2008; Productivity Commission 2010), there isno stated, mandatory level that is deemed an upper limitfor the Cost of Fundraising%. NSW, the only state thatprovides any guidance on this matter, recommends thatthe cost of fundraising for donations should not exceed50% of donations received, and that other fundraisingcosts should be ‘fair and reasonable’ (NSW Government2008: Section 8(1)). It is difficult to assess what ‘fair and
reasonable’ is regarding fundraising costs, since it woulddepend on the unique dynamics and cost structures ofparticular types of fundraising programs or events.
These efficiency ratios are not without criticism,particularly for the dilemmas they pose in terms ofcost allocation (Hager 2003). However, if interpretedwith care, they can provide some valuable insights forboard members about the way expenditure patternscontribute to the financial and mission performanceof the organisation (Greenlee and Tuckman 2007),especially when the context of the organisation andpatterns and trends over time are considered.
Stability (revenue concentration) ratios
All NFPs need to know that they have a continuingflow of revenue into the organisation, and need to beaware of their reliance on particular revenue sources,as any changes in these sources could threaten theirfinancial stability and their ability to continue to offerservices (Tuckman and Chang 1991). Tuckman andChang (1991) were the first researchers to measureNFP revenue concentration, developing a variant of theHirschman-Herfindahl index, which is used to measuremarket concentration. The Tuckman and Chang (1991)revenue concentration metric indicates the extent towhich an organisation is financially vulnerable, on thebasis of its dependence on a relatively narrow range ofsources of revenue. The value of the index is that it takesinto account both the number of different sources ofrevenue and the relative dependence on each of thosesources.8
Following this notion, many researchers argue foran assessment of whether an organisation is vulnerablebecause of dependencies or changes in its funding source.This can be measured by calculating the particularrevenue source as a percentage of total revenue (see,for example, Tuckman and Chang 1991; Greenlee andBukovinsky 1998; Greenlee and Trussel 2000; Hager2001; Trussel 2002; Greenlee and Tuckman 2007).9
Investigating the funding of NFP organisations duringan economic downturn, Besel et al. (2011: 62) identifiedthe risks of heavy reliance on government funding andthe need for more ‘community-based philanthropy’,that is, private funding, as distinct from governmentfunding. They cautioned against an over-reliance ongovernment revenue, and favoured a greater reliance onprivate philanthropy in order to enhance not-for-profitfinancial sustainability over the longer term (Besel et al.2011). Hence a consideration of revenue concentrationfrom various sources can provide a board with valuableinformation about organisational sustainability.
For most NFP organisations in Australia, revenueis derived from a variety of sources. These includecontributions (donations for general or special purposes,
180 Australian Accounting Review C© 2012 CPA Australia

C. Ryan & H. Irvine Not-For-Profit Ratios, Resilience and Accountability
membership fees, other fundraising income, legacies andbequests), grants (from government and other grantingbodies), commercial income, investment income, andother revenue sources (for example, fees for services).Thus, we argue that the board would need to beprovided with the ratio for each of the major sourcesof revenue, as portrayed in Appendix 1. For individualorganisations, these ratios could be investigated furtherto discern specific revenue streams, for example, types ofgrants, revenue streams from various investments, and abreakdown of contributions into fundraising, bequestsand other sources.
Capacity (liquidity) ratios
Measures of liquidity, that is, how quickly an organi-sation can meet its financial commitments in the nextfinancial period, are widely used to indicate short-termfinancial capacity. They are also recommended as ameasure of financial vulnerability for NFP organisations,since the inability to manage cash flows in the shortterm would seriously jeopardise a NFP organisation’sability to continue to operate (Buckmaster et al. 1994;Greenlee and Tuckman 2007). The common ratios thatare accepted in the literature, for organisations in boththe for-profit and NFP sectors, are the Current Ratioand the Quick Ratio (Buckmaster et al. 1994; Greenleeand Tuckman 2007). On the basis that inventory is notusually a significant component of current assets forNFP organisations, we include only the Current Ratio,as shown in Appendix 1.
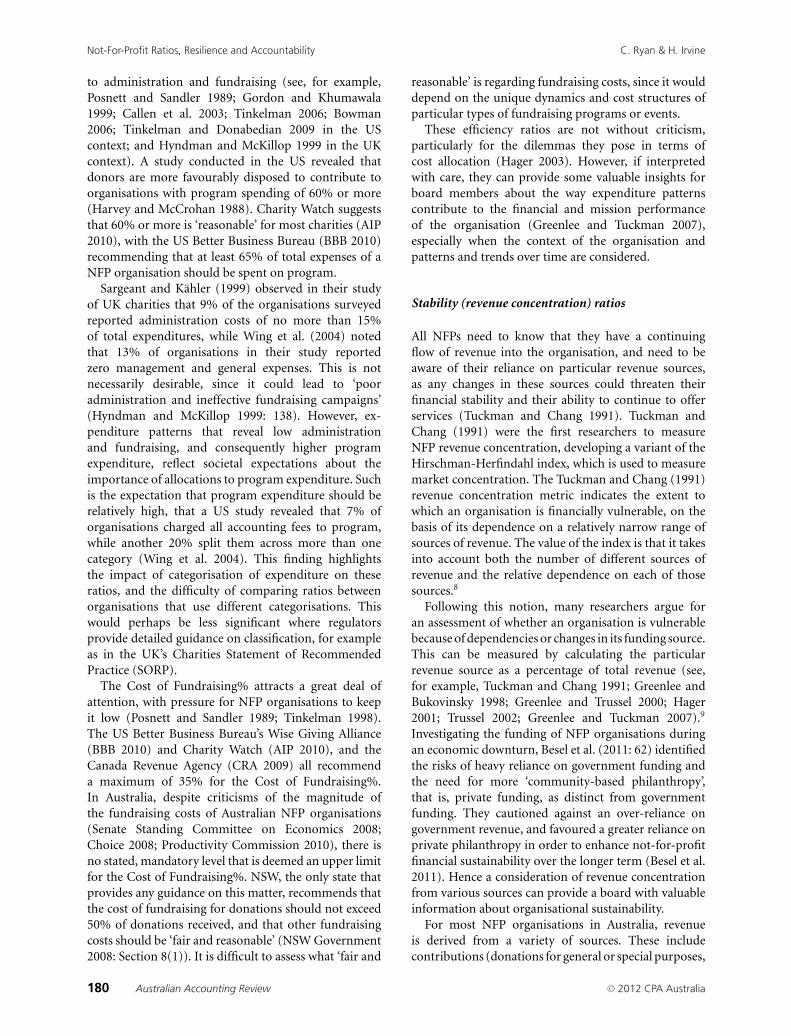
Recognising that ‘realistic reserves’ of working capitalmust be available for NFP organisations (Margolis 2001:21), we also include ‘months of spending’ in our suite.It indicates the months of cash currently available tomeet normal expenditure requirements, and representsthe financial buffer an organisation has in order to meetevery-day commitments. It is based on Bowman’s (2011)months of spending ratio, which he identifies as a short-term capacity ratio to assess organisational resilience. Ithas been adapted for the Australian NFP environment,to reflect the financial categories presented in financialreports.10
Gearing ratio
Jegers (2011: 126) observed that the debt of bothfor-profit and NFP organisations is ‘conceptually . . .
comparable’, and indicated that NFP organisations carryboth ‘spontaneous’ debt (for example, trade creditorsand other accruals) and ‘all kinds of financial debt’, suchas bonds or loans. Since spontaneous debt has cashflow/liquidity implications, and interest-bearing debthas implications for the earning of a surplus and short-and long-term liquidity, we propose that it is important
to assess the extent to which a NFP organisation relies ondebt. The Debt to Total Assets Ratio indicates the extentto which assets are funded by debt. That is, it gives anindicator of the level of debt, and in the extreme, ifthe organisation were to liquidate, indicates the extentto which assets would cover liabilities. This ratio hasgeneral support in a NFP context (Buckmaster et al. 1994;Greenlee and Bukovinsky 1998; Trussel 2002; Greenleeand Tuckman 2007), and is included in Appendix 1.
Greenlee and Tuckman (2007) used the ratio of debtto total assets in an adjusted form, in order to showaverage total debt as a percentage of average totalassets. We simply use the year-end figures for bothtotal liabilities and total assets, rather than accountingfor any movement in liabilities or assets during theperiod. This ratio provides management and boards withinformation about the position of the NFP as it launchesinto the next financial year, enabling an assessment oflikely interest commitments with their consequent cashflow implications.
An alternative proposed by Bowman (2011) iseffectively to reverse this ratio by identifying thepercentage of assets funded by equity as an indicator oflonger-term financial capacity. While we acknowledgethe importance of a strong equity base, and capture therate at which that is growing in the first of our twosustainability ratios below, we argue that highlightingthe presence of debt and its implications for operationalliquidity is an essential element in assessing financialhealth.
Sustainability ratios
The seminal paper by Tuckman and Chang (1991: 445)defines financial vulnerability as the likelihood thatan organisation would ‘cut back its service offeringsimmediately when it experiences a financial shock’, andidentifies low or negative operating margins as oneindicator of financial vulnerability. In assessing thiskey concept, various NFP researchers propose usingthe operating margin, or Surplus Margin, that is, theexcess of revenue over expenses, expressed in relation tosome base as an indicator of stability11 (Tuckman andChang 1991; Greenlee and Bukovinsky 1998; Greenleeand Trussel 2000; Hager 2001; Trussel 2002).
It is widely acknowledged that if a NFP organisationis to maintain its operations, it does need to achievesome level of surplus in order to build sufficient reservesfor the maintenance or expansion of mission (Hager2001; Ashley and Faulk 2010). A large margin enablesa NFP organisation to accumulate equity funds forexpansion, whereas a negative margin draws down onexisting equity, ultimately causing program activitiesto shrink. The rationale is that ‘nonprofits with highsurplus are considered healthy because they can reduce
C© 2012 CPA Australia Australian Accounting Review 181

Not-For-Profit Ratios, Resilience and Accountability C. Ryan & H. Irvine
surplus before they need to reduce services duringfinancial stress’ (Ashley and Faulk 2010: 47). This ratioalso indicates the rate at which the organisation isbuilding reserves from its revenue. We agree that suchan indicator of resilience is important, and include theSurplus Margin in our suite of ratios, as demonstratedin Appendix 1.
The ability of an organisation to sustain its servicesin the longer term is crucial to a NFP organisation.Consequently, Bowman (2011) criticises the approach byTuckman and Chang (1991) as focusing on vulnerabilityin the short term rather than sustainability in the longerterm. He identifies return on assets as an indicator oflonger-term financial sustainability, arguing that thisshould be in excess of the inflation rate.12 We acceptthis logic, and include return on assets as the second ofour sustainability ratios.
It is worthwhile noting here that the appropriate levelof a surplus is context dependent. By that we mean thatmany factors, such as the revenue concentration, thetiming and source of grants, and the level of debt, forexample, will all impinge on an appropriate surpluslevel. Also, there is a decision that management willneed to make about the appropriate level of ‘buffer’needed compared to spending on programs. This goesto highlight our central argument that ratio analysis isvaluable as a board and management tool for internaluse where the context of the organisation can be takeninto account, as opposed to the production of ratingstables by agencies for external use, where the context ofindividual organisations is lost.
The Study
The dearth of available data on the inputs of AustralianNFP organisations has already been highlighted (Flack2004). To overcome this difficulty, and to obtaincomparable information, this study uses financial dataobtained under a Memorandum of Understandingbetween the Queensland University of Technology andACFID.13 Over 100 organisations that raise funds fortheir international aid programs through donations,fundraising, legacies and bequests and grants are affili-ated with ACFID (ACFID 2010a, 2010b). If they are alsoaccredited with AusAID, they are eligible to receiveAusAID NGO Cooperation Program grants. One of theaccreditation requirements for organisations wishing toaccess this funding is that they adopt, sign and complywith ACFID’s Code of Conduct (ACFID 2010c). TheCode of Conduct specifies the way in which NGOsare to conduct their operations, and includes detailedrequirements about the presentation of annual andfinancial reports (ACFID 2010c).
Fewer than half of the organisations subscribing toACFID’s Code of Conduct are also accredited with
AusAID and thus eligible to receive AusAID NGOCooperation Program funding. All of the organisationswhose financial data is used in this study receivedAusAID funding of some sort in the 2008-09 financialyear, with all but one of them being officially AusAID-accredited. Thus the organisations whose data is used inthis study were both ACFID-affiliated and in receipt ofAusAID funding.
The selection of those organisations that adhere to theACFID Code of Conduct, are accredited with AusAIDand receive AusAID funding has four advantages. First,the Memorandum of Understanding enables access tothe financial statements of the entire population ofACFID-affiliated and AusAID-accredited organisations.For the year 2008-09, there were 44 organisations thatrecorded the receipt of AusAID funding in their financialreports. Second, while these organisations vary markedlyin size and character, they all operate in the same sub-sector of the broader Australian NFP sector. Third, allthese organisations operate at a relatively sophisticatedand comparable level of operations, since their AusAIDaccreditation includes a financial systems’ assessment.Fourth, because ACFID’s Code of Conduct requiresorganisations to present their financial reports in aspecified format, there is a degree of comparability alsoin the identification of the elements of those reports.
The first aim of this paper was to propose a suite ofkey financial ratios for internal stakeholders to use inassessing NFP financial health. This was achieved in theprior section with the presentation of ratios across fivecategories (efficiency, stability/revenue concentration,capacity/liquidity, gearing and sustainability) thattogether enable an assessment of a NFP organisation’sfinancial health. We now address our second aim,applying those ratios to a specific population of NFPAustralian international development organisations inorder to gain insights into the range, comparabilityand relevance of the resulting financial metrics forassessing overall NFP financial health and aidingaccountability.
Ratio Analysis of ACFID Organisations’Data
For data analysis and comparison purposes, the 44organisations included in the study have been classifiedaccording to the size of their total income in the 2008-09 financial year, as indicated in Table 1. The choice ofincome rather than assets as a basis for categorisationwas made first because some of the organisations arenot highly asset-dependent, and because there are likelydisparities in the value at which assets are recorded.14
The financial ratios identified in Appendix 1 are nowapplied to the 2008-09 financial reports of 44 AusAID-accredited and ACFID-affiliated organisations.
182 Australian Accounting Review C© 2012 CPA Australia

C. Ryan & H. Irvine Not-For-Profit Ratios, Resilience and Accountability
Figure 1 Allocation of expenditure
Figure 2 Cost of fundraising%
Table 1 Organisations grouped by 2008-09 income
Income Group No. of organisations
$0–$1 million 6$1 million–$5 million 13$5 million–$10 million 9$10 million–$50 million 11>$50 million 5Total: 44
Efficiency ratios calculations
As evidenced in the detailed calculations in Appendix 2,and portrayed in Figures 1 and 2, the means of expen-diture allocation across administration, program andfundraising were 12.2%, 79.5% and 7.6% respectively,
with the average cost of fundraising 20.2%. Withthe spotlight on high program expenditure and lowexpenditure on administration and fundraising, it isinteresting to note that organisations in the $0–$1mincome group performed the best, with a ProgramExpenditure Ratio mean of 87.4% (see Figure 1), and thelowest average cost of fundraising, 7.4% (see Figure 2).Further investigation of organisations in this incomegroup may reveal the extent to which these organisationsrelied on volunteer labour, since it is possible that smallerorganisations will rely more heavily on volunteers, whichare at present not included in financial statements. Aboard, when considering this ratio, should be aware oftheir organisation’s reliance on volunteers and the extentto which it reduces expenditure on administration andfundraising.
C© 2012 CPA Australia Australian Accounting Review 183

Not-For-Profit Ratios, Resilience and Accountability C. Ryan & H. Irvine
There were some variations in the mean for theProgram Expense Ratio across organisations in all fiveincome bands, from 74.5% to 87.4%. All means indicatedthe achievement of the recommended levels of at least60% (AIP 2010) or 65% (BBB 2010), clearly indicatingthat these organisations, on average, are tracking well.A closer examination of the program ratios acrossall organisations, however, revealed averages rangingfrom 28.5% to 98%, with five of the organisationsreporting expenditure of less than 60% on program.The organisation with a Program Expense Ratio of98% reported total income of <$1 m, made up ofgrants (57%) and fundraising (43%), while the onethat allocated 28.5% to program reported income inthe $1–$5 m range, with the majority of its income fromgrants (72%). This raises the issue of the characteristicsof individual organisations and what policies and costallocations lie behind these ratios.
Given the high level of program expenditure, the lowlevels of expenditure on administration and fundraisingwere unsurprising. With a relatively low AdministrationExpense Ratio mean of 12.2%, the range of means inthe various income groups was quite large, from 0.6%to a very high 71.5%. The highest ratio of 71.5% wascalculated for an organisation in the $1–$5 m incomebracket, and far exceeded the highest AdministrationExpense Ratio in all other income bands.
Fundraising Expenditure Ratios ranged from 0% to19.7%, all well below the recommendations of theBetter Business Bureau (Bhattacharya and Tinkelman2009).15 However, five organisations in total acrossthree of the size categories registered a 0% FundraisingExpense Ratio, in spite of the fact that all of theseorganisations recorded fundraising revenue rangingfrom < $500 to > $400,000. This is an unsurprisingfinding, given that a US study identified 37% of NFPorganisations with contributions of over $50,000 and25% of those with contributions of between $1 mand $5 m as reporting zero fundraising costs (Winget al. 2004). Although Sargeant and Kahler (1999)reported that a high proportion of UK charities recordedspending of less than 5% of their total expenses onfundraising, the reporting of a fundraising cost ratioof 0% does raise questions about the manner in whichthose organisations, and others in the population,have categorised and recorded fundraising expenses,especially given the context of community pressure forNFP organisations to keep fundraising costs withinreasonable limits (see, for example, Bennett and Savani2003; Sargeant and Jay 2004; Wing et al. 2004;Choice 2008; Bhattacharya and Tinkelman 2009). Asmentioned above, the detailed guidance provided byregulations such as the Charities SORP, or any form ofstandardised categorisations, can be helpful for boardsin assessing their performance against that of otherorganisations.
In addition, as portrayed in Figure 1, organisationsin the lowest income group spent the lowest amountson combined fundraising and administration, thusdiverting the greatest proportion of their expenditureto program. This is particularly interesting, giventhat research suggests larger NFP organisations withwell-established funding sources will be likely toenjoy economies of scale in their fundraising and/oradministrative activities (Wise 1997; Hyndman andMcKillop 1999), while smaller NFP organisations thatmay be starting up or building their reputations, mayexperience heavy initial costs (Kahler and Sargeant2002).
A variety of reasons could be suggested for the lowerfundraising and administration costs reported by smallerNFP organisations, which contradict the earlier USstudies cited. The smaller organisations may place aheavier reliance on volunteers, which would keep theirreported costs low. Further, their accounting systemswould likely be much less sophisticated than those of thelarge NFP organisations, which could result in a failure toallocate costs accurately, or even suggest manipulation ofcosts, faced with the difficulties small NFP organisationsface in raising funds. These issues reinforce the assertionby Kahler and Sargeant (2002: 238) that an ‘across-the-board benchmark would be inappropriate’ for theseexpenditures. Similarly, Hyndman and McKillop (1999:139) noted that comparing charities’ administrationand fundraising costs may not be ‘appropriate’, dueto non-identical accounting definitions and policies,and also to the different dynamics of, for example,grant-making and service-providing NFP organisations,the former of which could be expected to have loweroverheads.
The variability of the factors underlying these figuresstrengthens our case for the use of these ratios forinternal assessment purposes (Hyndman and McKillop1999), since it would be impossible for those outside theorganisation to know how the figures were calculated.It has been suggested that NFP organisations sometimeswilfully misapply or manipulate costs (Trussel 2003),but there is also scope for legitimate differences incost allocation (Hager 2003). Consequently, boardsand management of organisations whose expenditurepatterns are at the extremities of these expense ratioranges should pay attention to their expenditurepatterns, analysing more carefully how costs are allocatedand tracking ratios over time.
More information about fundraising costs is revealedby the Cost of Fundraising%, which organisationsrecognise should be as low as possible (Bennett andSavani 2003; Sargeant and Jay 2004; Wing et al. 2004).According to Appendix 2, these ranged from 0%, foran organisation in the $1–$5 m income range, to asurprising 111%, for an organisation in the $5–$10 mincome category. At 20.2%, the overall mean for Cost of
184 Australian Accounting Review C© 2012 CPA Australia

C. Ryan & H. Irvine Not-For-Profit Ratios, Resilience and Accountability
Fundraising% across all categories comes in below therecommended 35% maximum (CRA 2009; BBB 2010;AIP 2010), and even the 50% recommended by the NSWGovernment (2008) for fundraising costs associated withattracting donations.
It is interesting to note, as portrayed in Figure 2,that the smaller organisations demonstrate a far lowercost of fundraising than the larger organisations. Theseresults are consistent with Hyndman and McKillop(1999). They noted, in their study of the 500 largestfundraising charities in England and Wales, that thelarger charities, while demonstrating a lower percentageof administration and fundraising costs to totalexpenditure, conversely had a much higher ratio offundraising expenditure to total contributions. Theyinterpreted this as indicating that costs were beingdiverted to fundraising activities. It would be helpfulfor boards, when presented with information about thecost of fundraising, to have information about the ageof the fundraising campaign, that is, whether it is anew campaign involving heavy initial expenditure, orwhether it is well-established and running economically.An understanding of these metrics, combined withan exploration of the unique characteristics of anorganisation and an awareness of the statistics for theentire population, would enable boards to make anassessment of their level of accountability for the useof the funds entrusted to them, in relation to the prioritygiven to these categories of expenditure.16
Stability (revenue concentration) ratios calculations
As stated in a prior section, the aim of the stability ratiosis to measure revenue concentration as an indicator of anorganisation’s ability to continue to provide services, bymaintaining a healthy balance of funding sources. Thecalculated stability ratios are presented in Appendix 2,with a snapshot of revenue concentration across the fiveincome groups portrayed in Table 2.
Of the revenue sources identified in the financialreports of all the ACFID organisations used in this study,by far the greatest reliance was on contributions (51.5%),followed by grants (39.3%), with very small revenuestreams from commercial activities (2.5%), investments(2.3%) and other sources (4.4%). Commercial revenuewas reported by only eight of the 44 organisationsin the study, as evidenced in the 2.5% relianceon this source of income across all organisations.Unsurprisingly, in the aftermath of the Global FinancialCrisis, investment income accounted for only 2.3% oftotal income. As is evident in Table 2, organisations in the$5–$10 m income band displayed the most evenlybalanced income streams, with the greatest averagepercentage of revenue from commercial activities (7.4%)of the entire population of organisations, and a
substantial degree of reliance on both contributions(40.8%) and grants (44.1%).
Tuckman and Chang (1991) identified limitedsources of revenue as a particular vulnerability of aNFP organisation, indicating the challenge such anorganisation would face in the event of a financial shock.An organisation’s revenue concentration could thereforebe identified as a firm risk (Trussel, 2002), with financialinformation providing valuable information for boardsin assessing their NFP’s funding risk profile, identifyingareas of vulnerability, and assisting them to developstrategies for ensuring future funding streams (Greenleeand Tuckman, 2007). The extent of diversification ofrevenue streams is associated with greater flexibility(Hager, 2001), stability (Greenlee and Bukovinsky,1998), and the ability to continue to provide serviceswhen one revenue source becomes depleted (Greenleeand Trussel, 2000).
In the Australian context, most grants received byNFP organisations are government grants. Since ACFIDorganisations generally report revenue from AusAIDgrants, a specific stability ratio tailored to reflect thisfunding stream could identify the percentage of fundsthey receive from AusAID government grants, or othergrants. AusAID grants represented 25.1% of total incomereported by organisations in this study, with the largerorganisations less dependent on this form of funding.Organisations that have a heavy dependence on AusAIDgrants would be vulnerable if the Australian Governmentchanged its overseas aid funding policies or accreditationprocesses.
In assessing the individual vulnerabilities indicatedby these stability (revenue concentration) ratios, a NFPboard could consider identifying financing strategiesrelevant for the stage at which its organisation isoperating: birthing, stabilisation, growth, diversificationand closedown (Greenlee and Tuckman 2007). Theserange at the ‘birthing’ stage from the identification ofrevenue sources and controls over expenditure, to thedevelopment of more detailed asset plans, the expansionand diversification of revenue streams, access to and useof debt, the development of more complex fundraisingsystems, and finally to disposing of assets at the close-down stage (Greenlee and Tuckman 2007). Once again,these stages highlight the individuality of organisationsand their financial ratios and the need to assess theminternally, with the knowledge about organisationaldynamics available to management and boards.
Capacity (liquidity) ratios calculations
It would be expected that the current ratio would be atleast 1:1, with ratios below that indicating an inability tomeet short-term financial commitments and indicatingconsequent financial vulnerabilities. The overall mean
C© 2012 CPA Australia Australian Accounting Review 185

Not-For-Profit Ratios, Resilience and Accountability C. Ryan & H. Irvine
Table 2 Average revenue concentration% across income groups
Income Group Contributions Grants Commercial Income Investment Income Other Income Total
$0–$1 m 56.6 27.4 0.0 1.0 15.0 100$1m–$5 m 47.0 44.8 1.5 1.9 4.8 100$5m–$10 m 40.8 44.1 7.4 5.2 2.5 100$10m–$50 m 63.1 33.6 0.0 1.3 2.0 100>$50 m 53.6 38.8 4.4 1.1 2.1 100Average 51.5 39.3 2.5 2.3 4.4
for current ratios shown in Appendix 2 was a very high51.3:1, well in excess of what is required to ensure short-term financial capacity. Conversely, excessively highratios could indicate a lack of sophistication or expertisein cash management, and therefore wasted opportunitiesfor the use of cash funds. This is borne out by the datapresented in Appendix 2. Organisations in the higherincome groups had the lowest current ratios, particularlythe >$50 m group, at a mean of 1.2:1. Conversely,the highest reported current ratios were evident in thelowest income category, with a mean of 327.7:1. Therange across all organisations was extraordinary, from–:117 to a huge 1378:1. One organisation in the $5–$10 m income group had zero current liabilities andwhat we describe as an undefined current ratio. It wasset up as the fund of a larger organisation, endowedwith assets, but with no liabilities. The organisationthat reported the largest ratios for the current ratiohad total liabilities (all current) of under $500, withcurrent assets amounting to 99.4% of total assets. Theseorganisational characteristics once again highlight therelevance of these ratios for internal use rather than forcomparisons across organisations. They also raise issuesrelating to organisations’ accountability for the wise useof their financial resources.
As a further indicator of short-term financial capacity,months of spending calculations reveal a mean of 4.8months, and a range of 0.0 to 23.3 months. Figure 3reinforces the general impression that the larger theorganisation, the lower its current ratio, and the lessreliance it places on having a financial buffer in termsof months of spending currently covered. This possiblyindicates a greater sophistication and understanding ofcash management issues.
These capacity ratios must be assessed in the contextof the suite of financial ratios proposed in this paper, inorder to assess overall financial health. To illustrate this,in the context of assessing organisational sustainability,Bowman (2011: 48) argues that organisations couldbe sustainable in the long term, but not in the shortterm, in which case they would be ‘chronically short ofcash’. In the opposite case, an organisation financiallysustainable in the short term may suffer from erosion inthe value of its assets over time and not be sustainablein the long term. Hence it could be argued that theassessment of liquidity in the context of short-term
capacity and long-term sustainability is a vital part ofa board’s role, but only part of the overall picture of anorganisation’s financial health.
Gearing ratio calculations
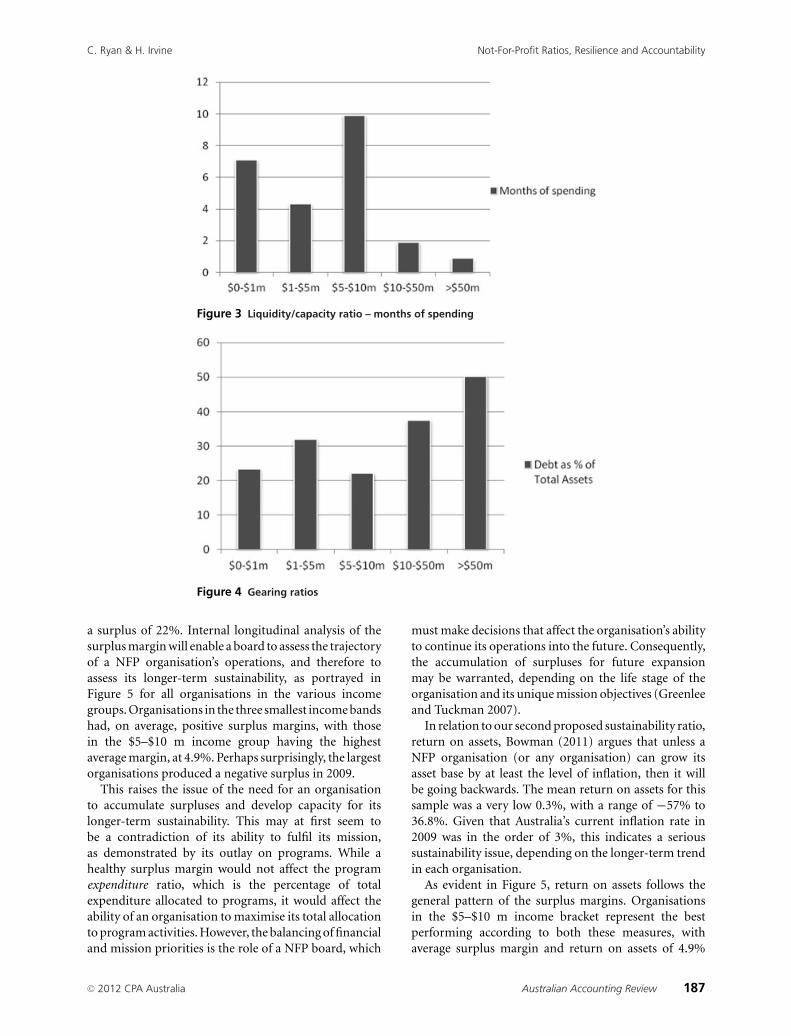
Appendix 2 and Figure 4 indicate the extent to whichassets were funded by debt in the form of currentand non-current liabilities. Borrowings, provisions,unexpended project funds and ‘other’ liabilities wereevident in both current and noncurrent categories,while current liabilities also included trade payables andcurrent tax liabilities. Total liabilities for all organisationsin the sample amounted to $352.2 m, of which 70% werecurrent liabilities. Borrowings and unexpended projectfunds accounted for 21.3% and 15.3% of total liabilitiesrespectively. In the case of borrowings, this indicates aneed for boards to consider the implications of theirlevel of borrowing in terms of liquidity and the ability togenerate a surplus and increased capacity. In the case ofunexpended project funds, boards would need to ensurethe protection of funds for future commitments alreadyundertaken.
There was a mean of 31.9% across the wholepopulation, and a large range, from 0.0% to 93.8%. Theorganisation that reported liabilities at 93.8% of totalassets was in the $10–$15 m income range. It recordedborrowings of 16% of total assets, and substantialcurrent liabilities in the form of payables. Not onlydid that organisation have vastly more debt than theaverage across the whole population of internationalaid organisations, but also considerably more than theaverage of 37.4% for organisations of a similar size.This points to a need for further investigation of theorganisation’s debt and liquidity situation by board andmanagement in the context of operational strategiesand other financial ratios since, as Bowman (2011:48) warned, organisations without adequate short-termcapacity may be forced to liquidate in the event of‘external economic shocks’.
Sustainability ratios data
Appendix 2 identifies an overall average surplus marginof 1.2%, and a wide range, from a deficit of 19.5% to
186 Australian Accounting Review C© 2012 CPA Australia
C. Ryan & H. Irvine Not-For-Profit Ratios, Resilience and Accountability
Figure 3 Liquidity/capacity ratio – months of spending
Figure 4 Gearing ratios
a surplus of 22%. Internal longitudinal analysis of thesurplus margin will enable a board to assess the trajectoryof a NFP organisation’s operations, and therefore toassess its longer-term sustainability, as portrayed inFigure 5 for all organisations in the various incomegroups. Organisations in the three smallest income bandshad, on average, positive surplus margins, with thosein the $5–$10 m income group having the highestaverage margin, at 4.9%. Perhaps surprisingly, the largestorganisations produced a negative surplus in 2009.
This raises the issue of the need for an organisationto accumulate surpluses and develop capacity for itslonger-term sustainability. This may at first seem tobe a contradiction of its ability to fulfil its mission,as demonstrated by its outlay on programs. While ahealthy surplus margin would not affect the programexpenditure ratio, which is the percentage of totalexpenditure allocated to programs, it would affect theability of an organisation to maximise its total allocationto program activities. However, the balancing of financialand mission priorities is the role of a NFP board, which
must make decisions that affect the organisation’s abilityto continue its operations into the future. Consequently,the accumulation of surpluses for future expansionmay be warranted, depending on the life stage of theorganisation and its unique mission objectives (Greenleeand Tuckman 2007).
In relation to our second proposed sustainability ratio,return on assets, Bowman (2011) argues that unless aNFP organisation (or any organisation) can grow itsasset base by at least the level of inflation, then it willbe going backwards. The mean return on assets for thissample was a very low 0.3%, with a range of −57% to36.8%. Given that Australia’s current inflation rate in2009 was in the order of 3%, this indicates a serioussustainability issue, depending on the longer-term trendin each organisation.
As evident in Figure 5, return on assets follows thegeneral pattern of the surplus margins. Organisationsin the $5–$10 m income bracket represent the bestperforming according to both these measures, withaverage surplus margin and return on assets of 4.9%
C© 2012 CPA Australia Australian Accounting Review 187

Not-For-Profit Ratios, Resilience and Accountability C. Ryan & H. Irvine
Figure 5 Sustainability ratios
and 7.2% respectively. In the case of organisations withpoor, negative or decreasing sustainability ratios, an as-sessment of these results against organisational strategyand reserves would be necessary to ascertain the long-term sustainability implications of this performance.
This paper has presented a suite of financial ratios. Theuse of financial metrics for external evaluative purposeshas been widely asserted to be vital in attracting donorfunds. However, the limitations of these metrics havebeen highlighted, and it has also been acknowledgedthat donors do not give just on an assessment offinancial matters, and in fact may not give basedon financial matters at all (Cnaan et al. 2011). Thusfinancial metrics must be contextualised and usedadvisedly (Bhattacharya and Tinkelman 2009; Cnaanet al. 2011), since every NFP organisation has its ownunique characteristics. Consequently, we advocate theinternal use of financial ratios to assess organisationalfinancial health and sustainability by boards andmanagement who are aware of their organisations’unique characteristics and context. While our focushas been on internal financial accountability, we alsoacknowledge that financial analysis must be combinedwith an assessment of mission performance in order toform an opinion about a NFP organisation’s effectivenessand the fulfilment of higher accountabilities.
Conclusions
In this paper we set out first to propose a suite of keyfinancial ratios to enable NFP boards and managers toassess their organisations’ financial health. These ratioswere developed with an Australian context in mind, toassist in assessing the efficiency, stability, capacity (liq-uidity), gearing and sustainability of NFP organisations.In order to gain insights into the usefulness of this suite,
we then applied those ratios to data from the entirepopulation of ACFID-affiliated Australian internationalaid organisations that received AusAID funding in 2009.The resulting analysis highlights potential issues fordiscussion between boards and managers.
In Australia, the absence of inter-organisationalcomparative financial metrics means there are no bench-marks by which management can assess the performanceof a single organisation. We therefore situate these ratioswithin an internal financial accountability frameworkthat operates between NFP boards and management,and attempts to move board considerations from merecompliance with legal requirements, to more strategicaspects of accountability. While we acknowledge thatfinancial ratios are an incomplete means for assessing aNFP organisation’s performance and accountability, wemaintain that, if used for internal evaluative purposes,they have a valuable role to play, along with othermetrics provided to the board. Hence we recommendthe longitudinal use of financial ratios by boards andmanagement for assessing and achieving financial healthand resilience, and thereby addressing issues of internalaccountability.
This paper therefore makes three contributions tothe literature on NFP financial ratios. First, we situatefinancial ratios in the broader context of financial healthand sustainability. In proposing a suite of financialratios that enables an assessment of financial efficiency,stability, capacity (liquidity), gearing and sustainability,we emphasise the inter-connectedness of various aspectsof financial performance, and avoid the danger offocusing just on aspects of financial efficiency. Second,we propose that these ratios should be used by boardsand management in order to enhance their internalaccountability. We promote the necessity for boardsproactively to engage in meaningful dialogue withmanagement in order to understand and evaluate their
188 Australian Accounting Review C© 2012 CPA Australia

C. Ryan & H. Irvine Not-For-Profit Ratios, Resilience and Accountability
organisations’ financial health and sustainability, withinthe context of their own unique characteristics. Third,we use Australian data, which is difficult to access in ajurisdiction that to date has had no central NFP regulatorand hence no central NFP data repository. In this senseour study is timely, with the new NFP regulator, theACNC, currently involved in formulating the parametersof its operations.
The population of 44 organisations on whichthis study is based is small relative to overseasstudies. However, this relatively homogeneous sampleof organisations has provided us with an opportunity todemonstrate the usefulness of a suite of ratios craftedfor an Australian context. We propose the extension ofthis study to cover these organisations longitudinally,and also suggest further case study work to developthis new area. In this context, researchers and NFPboards could work together to assess and improve anorganisation’s financial health, within the context of itsmission achievement. This strategy could be a usefulone, particularly for smaller and less sophisticated NFPorganisations, since it is important that the individualNFP organisations that make up the sector continue toachieve their social and economic potential.
Christine Ryan and Helen Irvine are at the QueenslandUniversity of Technology. They acknowledge feedback fromcolleagues, from Catherine Blunt and Dr Sue-Anne Wallaceof ACFID, from participants at the 2010 Annual ARNOVAconference, and from the anonymous reviewers of thisjournal.
Notes
1 Unlike some other jurisdictions, such as the UK, USA and NewZealand, Australia has not had a NFP regulator until now.
2 The major reason that most of the data-driven work on NFPfinancial ratios has been conducted in the northern hemispherewould appear to be because of a regulatory requirement thata single summary information return be lodged. These includethe Internal Revenue Service’s Form 990 in the US, the CanadaRevenue Agency’s T 1044, and the returns required by theCharity Commission of England & Wales and the Office ofthe Scottish Charity Regulator (OSCR). These make possiblestatistical calculations and predictions based on large volumesof comparable data.
3 Cnaan et al. (2011), in their US study, note that 77.7% of donorsdid not actually use watchdog ratings agencies when making adecision about donating.
4 Interestingly, Sargeant and Jay (2004) highlight the difficultyof comparing data across organisations in the US and theUK, even though these jurisdictions mandate Form 990 andthe Charities SORP (Statement of Recommended Practice)requirements respectively.
5 Bhattacharya and Tinkelman (2009) found little evidence ofmanipulation of ratios in their evaluation of organisations’data reported in the US Form 990 against performance ratiosrecommended by the Better Business Bureau Wise GivingAlliance. However, they did note widespread reporting of lowor zero fundraising and administration costs, which could havebeen the result of manipulation or misallocation.
6 Percentages of expenditure on administration, fundraising andprogram generally add up to 100%, hence as one or moreare decreased, the others increase. Some items of expenditure,however, may not fall neatly into these categories.
7 In a survey of UK charity contributors, respondents rankedinformation about the percentage of expenditure outlaid foradministration as third in importance, after information about anorganisation’s goals and identification of the problem area, bothof which relate to mission (Hyndman 1990).
8 An index of 1 reveals that an organisation has just one revenuesource, while an organisation with equal revenues from manysources will have a figure closer to 0 (Tuckman and Chang 1991).
9 More recent research (Ashley and Faulk 2010; see also Tinkelman1998) has sought to refine these measures by distinguishingbetween different categories of donors to obtain an understandingof their behaviour.
10 Bowman (2011) uses the categories of unrestricted financial assetsless unsecured debt, divided by spending on operations. Theseare obtainable from Form 990 data in the US, but would bedifficult to ascertain from the financial reports of Australian NFPorganisations.
11 Tuckman and Chang (1991) use revenue less expenses overtotal revenue; Greenlee and Bukovinsky (1998) use revenuesminus expenses over total expenses; Greenlee and Trussel (2000),Hager (2001) and Trussel (2002) use the surplus margin ratio ofTuckman and Chang (1991) to identify financial vulnerability ina nonprofit organisation.
12 In the context of a youth organisation highly dependent ongovernment funding, Bowman (2011: 46) advocates the use ofreturn on assets as an indicator of sustainability, arguing that itshould be in excess of the inflation rate: ‘An actual return on assetsabove this rate will increase long-term capacity; an actual returnon assets below this rate will decrease it. In the long run, assetsmust be sufficiently productive to support their own replacementas they wear out.’
13 The Memorandum of Understanding, signed in 2010, establishesa partnership that has resulted in a flow of data and researchbetween ACFID, its member and signatory organisations andour institution. ACFID has agreed to supply data to researchersprovided certain conditions, including confidentiality, are met.
14 This is particularly relevant to non-current assets, due to theoption of adopting a revaluation model, according to Australianaccounting standards.
15 Bhattacharya and Tinkelman (2009) noted that only 86% of theorganisations in their study met the Better Business Bureau’sstandards regarding fundraising costs.
16 This raises the issue of organisations that do not directlyadminister aid or development programs, but rather act asumbrella organisations, in some cases distributing funds toother organisations that undertake that work. Once again, thisunderscores the need to use these financial ratios cautiouslyand intelligently, for internal evaluatory purposes, rather thanfor comparisons between organisations. It also highlights thefruitlessness of donors’ generic expectations of what constitutesacceptable efficiency performance, and the need for the public andmedia to have a greater understanding about the costs associatedwith NFP organisations (Kahler and Sargeant 2002). In our studythere was one such umbrella organisation.
17 We have designated the current ratio for the organisation thatreported zero current liabilities as ‘—‘, which is undefined.
18 These ratios do not add up exactly to 100% because of thepresence of some expenditure on earning commercial revenue,which was a relatively small proportion of total income and ortotal expenditure (see stability – revenue concentration – ratios).The financial reports did not provide sufficient information toenable us to allocate commercial expenditure across program,administration and fundraising categories.
C© 2012 CPA Australia Australian Accounting Review 189

Not-For-Profit Ratios, Resilience and Accountability C. Ryan & H. Irvine
Appendix 1. Suite of ratios for assessing financial health
RATIO CALCULATION INDICATION LITERATURE
EFFICIENCY RATIOSAdministration
Expense Ratio= Total Administration
Expense (includesInterest)/Total Expenses
Percentage of total expensesoutlaid on administrationand management
Hyndman 1990; Wise 1997; Greenlee andBukovinsky 1998; Sargeant and Kahler 1999;Tuckman and Chang 1999; Hager 2001;Margolis 2001; Kahler and Sargeant 2002;Bennett and Savani 2003; Callan et al. 2003;Sargeant and Jay 2004; Greenlee and Tuckman2007; Bhattacharya and Tinkelman 2009.
Program ExpenseRatio
= Program Expense/TotalExpenses
Percentage of total expensesoutlaid on program
Greenlee and Bukovinsky 1998; Callan et al. 2003;Wing et al. 2004; Bhattacharya and Tinkelman2009; Charity Navigator 2010; AIP 2010.
FundraisingExpense Ratio
= Fundraising Expense/TotalExpenses
Percentage of total expensesoutlaid on fundraising
Hyndman 1990; Greenlee and Bukovinsky 1998;Margolis 2001; Bennett and Savani 2003; Callenet al. 2003; Sargeant and Jay 2004; Greenleeand Tuckman 2007; Bhattacharya andTinkelman 2009.
Cost ofFundraising%
= Fundraising Expense/TotalFundraising Revenue
Percentage cost of raising each$ of fundraising revenue
Greenlee and Bukovinsky 1998; Sargeant andKahler 1999; Flack 2004; Wing et al. 2004; CRA2009; Sargeant et al. 2009; AIP 2010.
STABILITY (REVENUE CONCENTRATION) RATIOSRevenue
Concentration= Revenue Source/Total
RevenueDependence on 5 revenue
sources: contributions,grants, commerical revenue,investment revenue, otherrevenue
Greenlee and Bukovinsky 1998; Tuckman andChang 1991; Greenlee and Trussel 2000; Hager2001; Trussel 2002; Greenlee and Tuckman2007.
CAPACITY (LIQUIDITY) RATIOSCurrent Ratio = Current Assets/Current
Liabilities (includesunexpended funds)
Ability to meet financialcommitments in the nextfinancial period
Buckmaster et al. 1994; Greenlee and Tuckman2007.
Months ofspending
(Working capital/Totalexpenses –Depreciation)12
Indicates months of cashrequirements currentlyavailable
Adapted from Bowman’s (2011) months ofspending ratio.
GEARING RATIODebt to Total
Assets= Total Liabilities/Total
AssetsExtent to which assets are
funded by debtOhlson 1980; Buckmaster et al. 1994; Greenlee
and Bukovinsky 1998; Trussel 2002; Greenleeand Tuckman 2007.
SUSTAINABILITY RATIOSSurplus Margin = (Total Revenue – Total
Expenses)/Total RevenuesRate at which the organisation
currently builds reserves fromrevenue
Greenlee and Bukovinsky 1998; Tuckman andChang 1991; Greenlee and Trussel 2000; Hager2001; Trussel 2002; Bowman (2011) uses NetAssets to Total Assets to measure longer-termcapacity.
Return on Assets = Total Revenue – TotalExpenses/Total Assets
Return on assets indicates therate of growth of the assetbase
Bowman (2011).
190 Australian Accounting Review C© 2012 CPA Australia

C. Ryan & H. Irvine Not-For-Profit Ratios, Resilience and Accountability
Appendix 2. Ratios calculations
EFFICIENCY RATIOS
ProgramAdministration Expense Fundraising Cost of
Income Group Measure Expense Ratio Ratio Expense Ratio Total%18 Fundraising%
$0–$1 m Mean 8.9 87.4 3.7 100 7.4Range 0.6–20.6 74.8–98 0.0–12.3 0.0–24.5
$1m–$5 m Mean 17.9 74.5 6.8 99.2 19.2Range 4–71.5 28.5–91 0.0–15.3 0.0–86.6
$5 m–$10 m Mean 12.4 80.6 5.6 98.6 24.4Range 1.3–28.5 54.2–93.4 0.0–17.4 0.0–111
$10 m–$50 m Mean 8 80.4 11.4 99.8 21.6Range 1.9–17.9 66.8–95 0.5–19.7 2.5–74.8
>$50 m Mean 9.7 81 7 97.7 27.8Range 3.1–22.8 58.4–92.1 1.6–13 10.4–41.2
Overall Mean 12.2 79.5 7.6 99.3 20.2Range 0.6–71.5 28.5–98 0.0–19.7 0.0–111
STABILITY (REVENUE CONCENTRATION) RATIOS
Commercial Investment OtherIncome group Measure Contributions% Grants% Revenue% Revenue% Revenue% Total%
$0–$1 m Mean 56.6 27.4 0.00 1 15.00 100.00Range 39.4–83.4 7.9–56.2 0.0–0.0 0.0–2.2 0.0–40.9
$1–$5 m Mean 47 44.8 1.5 1.9 4.8 100.00Range 0.0–77.2 12.5–98.5 0.0–11.5 0.3–6.7 0.0–18.1
$5–$10 m Mean 40.8 44.1 7.4 5.2 2.5 100.00Range 0.1–78.8 11.8–83.2 0.0–48.3 0.6–20.8 0.0–5.9
$10–$50 m Mean 63.1 33.6 0.00 1.3 2 100.00Range 1.5–92.6 0.4–92.4 0.0–0.0 0.0–2.8 −0.1–11.6
>$50 m Mean 53.6 38.8 4.4 1.1 2.1 100.00Range 21.2–92.7 6.4–75.1 0.0–15.9 0.5–1.5 0.1–5.3
Overall Mean 51.5 39.3 2.5 2.3 4.4 100.00Range 0.0–92.7 0.4–98.5 0.0–48.3 0.0–20.8 −0.1–40.9
LIQUIDITY (CAPACITY) RATIOS
Ratio Measure $0–$1 m $1–$5 m $5–$10 m $10–$50 m >$50 m Overall
Current Ratio Mean 327.7:1 6.1:1 17.4:1 4.2:1 1.2:1 51.3:1Range 1.5–1378:1 0.1–19.6:1 – 37.9:1∗ 1–14.7:1 1–1.4:1 0.00–1378:1
Months of Spending Mean 7.1 4.3 9.9 1.9 0.9 4.8Range 0.2–13.9 1.0–12.7 2.1–23.3 0.0–5 0.0–2.8 0.0–23.3
GEARING RATIO
Ratio Measure $0–$1 m $1–$5 m $5–$10 m $10–$50 m >$50 m Overall
Debt to Total Assets% Mean 23.3 32 22.2 37.4 50.2 31.9Range 0.1–67.4 5.6–88.5 0.0–71.5 5.3–93.8 40–71.6 0.0–93.8
SUSTAINABILITY RATIOS
Ratio Measure $0–$1 m $1–$5 m $5–$10 m $10–$50 m >$50 m Overall
Surplus Margin% Mean 1.7 1.1 4.9 −0.6 −2.3 1.2Range −8.3–14 −12.4–14.4 −10.2–22 −19.5–18.8 −5.4–.7 −19.5–22
Return on Assets% Mean 1.8 0.9 7.2 −3.6 −6.8 0.30Range −26.6–26.5 −49.2–25.3 −11.1–20.3 −57.0–36.8 −24.7–2.0 −57.0–36.8
∗The bottom of this range was an undefined amount, due to zero liabilities; see Endnote 17.
C© 2012 CPA Australia Australian Accounting Review 191

Not-For-Profit Ratios, Resilience and Accountability C. Ryan & H. Irvine
References
ACFID (Australian Council for International Development)2010a, About ACFID, available at http://www.acfid.asn.au/ ,accessed 25 November 2011.
ACFID (Australian Council for International Devel-opment) 2010b, Facts and Figures, available athttp://www.acfid.asn.au/resources/facts-and-figures, accessed25 November 2011.
ACFID (Australian Council for International Development)2010c, Code of Conduct , available at http://www.acfid.asn.au/code-of-conduct, accessed 25 November 2011.
Agyemang, G., Awumbila, M., Unerman, J. and O’Dwyer, B.2009, NGO Accountability and Aid Delivery, ACCA ResearchReport 110.
AIP (American Institute of Philanthropy) 2010, ‘Criteria’,available at http://www.charitywatch.org/criteria.html, ac-cessed 25 November 2011.
Ashley, S. and Faulk, L. 2010, ‘Nonprofit Competition inthe Grants Marketplace. Exploring the Relationship BetweenNonprofit Financial Ratios and Grant Amount’, NonprofitManagement & Leadership, 21, 1: 43–57.
BBB (Better Business Bureau) 2010, Wise Giving Alliance ‘Na-tional Charity Report Index’, available at http://www.bbb.org/charity-reviews/national/, accessed 25 November 2011.
Bennett R. and Savani, S. 2003, ‘Predicting the Accuracyof Public Perceptions of Charity Performance’, Journal ofTargeting, Measurement & Analysis for Marketing , 11, 4:326–43.
Besel, K., Williams, C. L. and Klak, J. 2011, ‘NonprofitSustainability During Times of Uncertainty’, NonprofitManagement & Leadership, 22, 1: 53–65.
Bhattacharya, R. and Tinkelman, D. 2009, ‘How Toughare Better Business Bureau/Wise Giving Alliance FinancialStandards?’, Nonprofit and Voluntary Sector Quarterly, 38, 3:467–89.
Bowman, W. 2006, ‘Should Donors Care About OverheadCosts? Do They Care?’, Nonprofit and Voluntary SectorQuarterly, 35, 2: 288–310.
Bowman, W. 2011, ‘Financial Capacity and Sustainability ofOrdinary Nonprofits’, Nonprofit Management & Leadership,22, 1: 37–51.
Buckmaster, N., Lyons, M. and Bridges, A. 1994, ‘FinancialRatio Analysis and Nonprofit Organisations: A Review andan Exploratory Study of the Financial Risk and Vulnerabilityof Ninety Large Nonprofit Organisations in New SouthWales’, Centre for Australian Community Organisations andManagement, Working Paper No. 26, December.
Callen, J. L., Klein, A. and Tinkelman, D. 2003, ‘BoardComposition, Committees, and Organizational Efficiency: TheCase of Nonprofits’, Nonprofit and Voluntary Sector Quarterly,32, 4: 493–520.
Charity Navigator 2010, ‘Our Ratings Tables’, available athttp://www.charitynavigator.org/index.cfm?bay=content.view&cpid=48, accessed 25 November 2011.
Choice 2008, ‘Charities’, available at http://www.choice.com.au/reviews-and-tests/money/investing/advice/charities.aspx, accessed 25 November 2011.
Cnaan, R. A., Jones, K., Dickin, A. and Salomon, M. 2011,‘Nonprofit Watchdogs. Do They Serve the Average Donor?’,Nonprofit Management & Leadership, 21, 4: 381–97.
Connolly, C. and Hyndman, N. 2004, ‘Performance Reporting:A Comparative Study of British and Irish Charities’, The BritishAccounting Review,36, 2: 127–54.
Cordery, C. J. and Baskerville, R. F. 2011, ‘CharityTransgressions, Trust and Accountability’, VOLUNTAS, 22, 2:197–213.
CRA (Canada Revenue Agency) 2009, ‘Guidance –Fundraising by Registered Charities’, CPS 028, availableat http://www.cra-arc.gc.ca/chrts-gvng/chrts/plcy/cps/cps-028-eng.html, accessed 25 November 2011.
Ebrahim, A. 2003a, ‘Making Sense of Accountability: Con-ceptual Perspectives for Northern and Southern Nonprofits’,Nonprofit Management & Leadership, 14, 2: 191–212.
Ebrahim, A. 2003b, ‘Accountability in Practice: Mechanismsfor NGOs’, World Development , 31, 5: 813–29.
Ebrahim, A. 2005, ‘Accountability Myopia: Losing Sight ofOrganizational Learning’, Nonprofit and Voluntary SectorQuarterly, 34, 1: 56–87.
Flack, T. 2004, ‘The Mandatory Disclosure of Cost of Fundrais-ing Ratios: Does it Achieve the Regulators’ Purposes?’, WorkingPaper No. CPNS26, Australian Centre for Philanthropy andNonprofit Studies, Queensland University of Technology,Brisbane, Australia.
Forbes, D. P. and Milliken, F. J. 1999, ‘Cognition and CorporateGovernance: Understanding Boards of Directors as StrategicDecision-making Groups’, Academy of Management Review,24, 3: 489–505.
Frumkin, O., and Kim, M. 2001, ‘Strategic Positioning and theFinancing of Nonprofit Organizations: Is Efficiency Rewardedin the Contributions Marketplace?’, Public AdministrationReview, 61, 3: 266–75.
Fry, R. E. 1995, ‘Accountability in Organizational Life: Problemor Opportunity for Nonprofits?’, Nonprofit Management &Leadership, 6, 2: 181–95.
Gibelman, M. and Gelman, S. R. 2000, ‘Very Public Scandals:An Analysis of How and Why Nongovernmental OrganizationsGet in Trouble’, Paper presented at the InternationalSociety for Third-Sector Research (ISTR) Fourth InternationalConference, Dublin, Ireland, July 7, available at http://www.istr.org/conferences/dublin/workingpapers/gibelman.pdf, ac-cessed 25 November 2011.
Gordon, T. P. and Khumawala, S. B. 1999, ‘The Demand forNot-for-profit Financial Statements: A Model for IndividualGiving’, Journal of Accounting Literature, 18: 31–56.
Greenlee, J. and Trussel, J. 2000, ‘Predicting the Financial Vul-nerability of Charitable Organizations’, Nonprofit Management& Leadership, 11, 2: 199–210.
192 Australian Accounting Review C© 2012 CPA Australia

C. Ryan & H. Irvine Not-For-Profit Ratios, Resilience and Accountability
Greenlee, J. S. and Bukovinsky, D. 1998, ‘Financial Ratios forUse in the Analytical Review of Charitable Organizations’, OhioCPA Journal, 57, 1: 32–6.
Greenlee, J. S. and Tuckman, H. 2007, ‘Financial Health’,in D. R. Young, (ed.), Financing Nonprofits. Putting Theoryinto Practice, National Center on Nonprofit Enterprise andAltamira Press, Lanham, MD, USA: Chapter 14.
Hager, M. A. 2003, ‘Current Practices in Allocation ofFundraising Expenditures’, New Directions for PhilanthropicFundraising , 41, Fall: 39–52.
Hager, M. 2001, ‘Financial Vulnerability Among ArtsOrganizations: A Test of the Tuckman-Chang Mea-sures’, Nonprofit and Voluntary Sector Quarterly, 31, 2:376–92.
Harrow, J., Palmer, P. and Vincent, J. 1999, ‘ManagementInformation Needs and Perceptions in Smaller Charities: AnExploratory Study’, Financial Accountability & Management ,15, 2: 155–72.
Harvey, J. W. and McCrohan, K. F. 1988, ‘Fundraising CostsSocietal Implications for Philanthropies and Their Supporters’,Business & Society, 27: 15–22.
Hough, A. 2009, How Nonprofit Boards Monitor, Judgeand Influence Organisational Performance, Unpublished PhDThesis, Queensland University of Technology.
Hyndman, N. and McDonnell, P. 2009, ‘Governance andCharities: An Exploration of Key Themes and the Developmentof a Research Agenda’, Financial Accountability & Management ,25, 1: 5–31.
Hyndman, N. and McKillop, D. 1999, ‘Conversion Ratios inCharities in England and Wales: An Investigation of Economiesof Scale’, Financial Accountability & Management , 15, 2:135–53.
Hyndman, N. 1990, ‘Charity Accounting: An Empirical Studyof the Information Needs of Contributors to UK FundraisingCharities’, Financial Accountability & Management , 6, 4:295–307.
Jegers, M. 2011, Managerial Economics of Non-profit Organisa-tions, VUBPRESS, Brussels.
Kahler, J., and Sargeant, A. 2002, ‘The Size Effect in theAdministration Costs of Charities’, The European AccountingReview, 11, 2: 215–43.
Kearns, K. P. 1994, ‘The Strategic Management of Accountabil-ity in Non-Profit Organisations: An Analytical Framework’,Public Administration Review, 54, 2: 185–92.
Kearns, K. P. 1996, Managing for Accountability: Preservingthe Public Trust in Nonprofit Organizations, Jossey-Bass, SanFrancisco, USA.
Kreander, N., Beattie, V. and McPhail, K. 2009, ‘Putting OurMoney Where Their Mouth Is: Alignment of Charitable Aimswith Charity Investments – Tensions in Policy and Practice’,The British Accounting Review, 41, 3: 154–68.
Margolis, A. 2001, ‘Causes and Effects’, Financial Management ,March: 18–22.
NSW (New South Wales) Government 2008, CharitableFundraising Regulations, Under the Charitable FundraisingAct 2001, available at http://www.legislation.nsw.gov.au/sessionalview/sessional/sr/2008–354.pdf, accessed 25/11/2011.
O’Dwyer, B. and Unerman, J. 2007, ‘From Functional to SocialAccountability: Transforming the Accountability RelationshipBetween Funders and Non-Governmental DevelopmentOrganizations’, Accounting, Auditing & Accountability Journal,20, 3: 446–71.
O’Dwyer, B. and Unerman, J. 2008, ‘The Paradox of GreaterNGO Accountability: A Case Study of Amnesty Ireland’,Accounting Organizations and Society, 33, 7/8: 801–24.
Ohlson, J. 1980, ‘Financial Ratios and the ProbabilisticPrediction of Bankruptcy’, Journal of Accounting Research, 18,1: 109–31.
Posnett, J. and Sandler, T. 1989, ‘Demand for CharityDonations in Private Non-Profit Markets. The Case of theU.K.’, Journal of Public Economics, 40, 2: 187–200.
Productivity Commission 2010, Contribution of the Not-for-Profit Sector, Productivity Commission Research Report,January, Australian Government, Canberra.
Roberts, J. and Scapens, R. 1985, ‘Accounting Systemsand Systems of Accountability – Understanding AccountingPractices in their Organisational Contexts’, Accounting,Organizations and Society, 10, 4: 443–56.
Roberts, J. 1991, ‘The Possibilities of Accountability’,Accounting, Organizations and Society, 16, 4: 355–68.
Roberts, J. 2001, ‘Trust and Control in Anglo-AmericanSystems of Corporate Governance: The Individualizing andSocializing Effects of Processes of Accountability’, HumanRelations, 54, 12: 1547–72.
Sargeant, A. and Kahler, J. 1999, ‘Returns on FundraisingExpenditures in the Voluntary Sector’, Nonprofit Managementand Leadership, 10, 1: 5–19.
Sargeant, A., and Jay, E. 2004, Fundraising Management ,Routledge, London.
Sargeant, A., Lee, S. and Jay, E. 2009, ‘Communicating the“Realities” of Charity Costs: An Institute of FundraisingInitiative’, Nonprofit and Voluntary Sector Quarterly, 38, 2:333–42.
Senate Standing Committee on Economics 2008, In-quiry into the Disclosure Regimes for Charities andNot-for-profit Organizations. Background Paper, availableat http://www.aph.gov.au/senate/committee/economics_ctte/charities_08/backgroundpaper.pdf, accessed 12 October 2010.
Sinclair, A. 1995, ‘The Chameleon of Accountability: Formsand Discourses’, Accounting, Organizations and Society, 20: 2/3:219–37.
Steinberg, R. 1983, Two Essays on the Nonprofit Sector, DoctoralDissertation, University of Pennsylvania.
Strom, S. 2010, ‘To Help Donors Choose, Web Site Alters HowIt Sizes Up Charities’, The New York Times, 26 November,
C© 2012 CPA Australia Australian Accounting Review 193

Not-For-Profit Ratios, Resilience and Accountability C. Ryan & H. Irvine
available at http://www.nytimes.com/2010/11/27/business/27charity.html, accessed 25 November 2011.
Tinkelman, D. and Donabedian, B. 2007, ‘Street Lamps,Alleys, Ratio Analysis, and Nonprofit Organizations’, NonprofitManagement & Leadership, 18, 1: 5–18.
Tinkelman, D. and Donabedian, B. 2009, ‘Decomposing theElements of Nonprofit Organizational Performance’, Researchin Governmental and Nonprofit Accounting , 12, 1: 75–98.
Tinkelman, D. and Mankaney, K. 2007, ‘When is Admin-istrative Efficiency Associated with Charitable Donations?’,Nonprofit and Voluntary Sector Quarterly, 36, 1: 41–64.
Tinkelman, D. 1998, ‘Differences in Sensitivity of FinancialStatement Users to Joint Cost Allocations: The Case ofNonprofit Organizations’, Journal of Accounting, Auditing &Finance, 13, 4: 377–94.
Tinkelman, D. 2006, ‘The Decision-usefulness of Non-profit Fundraising Ratios: Some Contrary Evidence’,Journal of Accounting, Auditing & Finance, 21, 4: 441–62.
Tinkelman, D. 2009, ‘Unintended Consequences of ExpenseRatio Guidelines: The Avon Breast Cancer Walks’, Journal ofAccounting and Public Policy, 28, 6: 485–94.
Trussel, J. M. 2002, ‘Revisiting the Prediction of FinancialVulnerability’, Nonprofit Management & Leadership, 13, 1:17–31.
Trussel, J. 2003, ‘Assessing Potential Accounting Manipulation:The Financial Characteristics of Charitable Organizations withHigher than Expected Program-Spending Ratios’, Nonprofit &Voluntary Sector Quarterly, 32, 4: 616–34.
Tuckman, H. P. and Chang, C. F. 1991, ‘A Methodology forMeasuring the Financial Vulnerability of Charitable NonprofitOrganizations’, Nonprofit and Voluntary Sector Quarterly, 20,4: 445–60.
Valentinov, V. 2011, ‘Accountability and the Public Interest inthe Nonprofit Sector: A Conceptual Framework’, 27, 1: 32–42.
Wing, K., Hager, M. A., Rooney, P. M. and Pollak, T.2004, Special Issues in Nonprofit Financial Reporting. A Guidefor Financial Professionals, The Urban Institute and IndianaUniversity, available at http://www.urban.org/UploadedPDF/411120_NOCP_Guide_3.pdf, accessed 25 November 2011.
Wise, D. 1997, ‘Size and Administration Costs in the VoluntarySector: A Note’, Financial Accountability & Management , 13,1: 81–8.
194 Australian Accounting Review C© 2012 CPA Australia