not looking for trouble: understanding large-scale chinese
TRANSCRIPT

Accepted Manuscript
Not looking for trouble: Understanding large-scale Chineseoverseas investment by sector and ownership
Limin Luo, Zhen Qi, Paul Hubbard
PII: S1043-951X(17)30111-6DOI: doi: 10.1016/j.chieco.2017.08.006Reference: CHIECO 1092
To appear in: China Economic Review
Received date: 16 August 2016Revised date: 8 May 2017Accepted date: 18 August 2017
Please cite this article as: Limin Luo, Zhen Qi, Paul Hubbard , Not looking for trouble:Understanding large-scale Chinese overseas investment by sector and ownership, ChinaEconomic Review (2017), doi: 10.1016/j.chieco.2017.08.006
This is a PDF file of an unedited manuscript that has been accepted for publication. Asa service to our customers we are providing this early version of the manuscript. Themanuscript will undergo copyediting, typesetting, and review of the resulting proof beforeit is published in its final form. Please note that during the production process errors maybe discovered which could affect the content, and all legal disclaimers that apply to thejournal pertain.
ACC
EPTE
D M
ANU
SCR
IPT
1
Not looking for trouble: Understanding large-scale Chinese overseas investment
by sector and ownership
Limin LUO, Assistant Professor, Shantou University Department of Social Sciences, [email protected]
Zhen QI, Corresponding Author, Assistant Professor, Shantou University Business School,
[email protected] or [email protected]
Paul HUBBARD, Sir Roland Wilson PhD Scholar, Crawford School of Public Policy, Australian National
University, [email protected]
Acknowledgement:Funding for this project was provided by Guangdong Provincial
Innovative Young Scholar Project (2016WQNCX039 & 2016WQNCX038) & the Social
Sciences Fund of Shantou University(7400115 & 07400114).
Thanks go to Jingyi Li, Australian National University, for valuable research assistance.
ACCEPTED MANUSCRIPT
ACC
EPTE
D M
ANU
SCR
IPT
2
Not looking for trouble: Understanding large-scale Chinese overseas investment
by sector and ownership
Abstract
This paper contributes to the systematic understanding of Chinese investment abroad, and
particularly the role of state-owned enterprise (SOE) investors, in two ways. Firstly, we identify major
problems in the literature stemming from wide-spread data deficiencies in data. Specifically, the
reliability of previous research results has been limited by data sets that do not identify the final
destination for Chinese investment, nor suitably differentiate between different ownership types. By
augmenting the project-level data from the China Global Investment Tracker with detailed ownership
information for each firm, this study reveals that large-scale investment in natural resource
investment, which surged after 2008, is dominated by state-owned enterprises controlled by China’s
central government. But it also reveals a newer wave of non-resource investment after 2009 in which
non-state enterprise plays the leading role.
Further, we investigate the destination selection of large-scale Chinese investment to 192 countries
from 2005 to 2015 – to test the extent to which SOEs might be attracted to poorer institutional host
environments. We find that Chinese SOE investment in resources, regardless of ownership type is
attracted to countries with political stability, but is negatively related to the rule of law measure. For
non-resource investment, we find no strong institutional preferences. We therefore suggest that
previous findings of different investment motivations between state- and non-state investors likely
reflects the dominance of state-ownership in resource sectors, rather than different investment
behaviour based on ownership.
Key words: China’s overseas direct investment; state-owned enterprises; private enterprises; data
deficiencies
JEL Code: F21, F02, F15
ACCEPTED MANUSCRIPT
ACC
EPTE
D M
ANU
SCR
IPT
3
1. Introduction
The recent surge of Chinese overseas investment was led by state-owned enterprises (SOEs) from a
country that is still rapidly developing. Given that earlier large scale investment flows have come
tended to be private investment from developed market economies, this has provoked three major
questions about Chinese overseas investment.
To what extent is Chinese overseas investment seeking natural resources for China’s continued
urbanisation and industrialisation, compared to other market-seeking and technology seeking
motivations?
Compared to overseas investment from developed countries that flows to host countries with good
economic governance, do Chinese investors prefer, or at least better tolerate, hosts with poor
economic governance?
And finally, are there any significant differences in Chinese overseas investment behaviour on account
of its SOEs?
The final question is relevant to policy makers considering whether a country’s foreign investment
regime requires special provisions for SOEs.1 Some previous studies have argued differences in formal
property rights and corresponding political connections between SOEs and the governments can cause
their investment behaviour to diverge from private profit-seeking companies (Deng et al. 2015; Yeung
and Liu 2008), and therefore fall outside mainstream theories of overseas investment (Child, J. and
Rodrigues 2005). However, if SOEs behave like ‘ordinary’ investors, then the case for special policy
treatment is less clear.
Leading studies of the drivers and motivations of Chinese overseas investment, including Buckley et al
(2007; 2009), Cheung and Qian (2009), Pradhan (2009), Cheng and Ma (2010), Sanfilippo (2010),
Bhaumika and Co (2011), Hurst (2011), Kolstad and Wiig (2012), and Wang et al (2015) fail to reach a
consensus.2 The major problems with the literature stem from inadequate data that does not properly
identify the destination for Chinese investment, nor suitably differentiate between different
ownership types.
Attempts to compare overseas investment behaviour have been hampered by limited data as we will
discuss in detail in the next section. For example, Ramasamy et al (2012) use data for only 63 publicly-
1 For example, while Australia’s Foreign Investment Review Board (FIRB) generally reviews only very large foreign proposals, it reviews all investments foreign-government entities regardless of project value. 2 A large proportion of the empirical literature supports the hypothesis for market seeking behaviour. The market-seeking hypothesis has garnered the most supports within OECD economies (Buckley, Clegg, and Cross 2007; Y. W. Cheung and Qian 2009; Hurst 2011; Kolstad and Wiig 2012). The resource-seeking hypothesis for Chinese overseas investment has also gained some support, particularly within non-OECD countries (Buckley, Clegg, and Cross 2007; Hurst 2011; Kolstad and Wiig 2012; Pradhan 2009; Sanfilippo 2010; Wang, Du, and Wang 2015). But there is also research that does not support the resource seeking hypothesis (Bhaumik and Co 2011). There is a much larger controversy surrounding the question of whether Chinese overseas investment is attracted to countries with relatively weak institutional environments, specifically a preference for Chinese overseas investment into countries with comparatively weak institutions (Buckley, Clegg, and Cross 2007; Amighini, Rabellotti, and Sanfilippo 2013; Kolstad and Wiig 2012; Quer, Claver, and Rienda 2012; Sanfilippo 2010; Wang, Du, and Wang 2015). Of these, one strand of the literature supposes that the structure of Chinese overseas investment might be more suitable for countries which reflect China’s own domestic institution (Buckley, Clegg, and Cross 2007; Cheng and Ma 2010; Hurst 2011), while others draw the opposite conclusion (Y. W. Cheung and Qian 2009; Bhaumik and Co 2011; Q. Li and Liang 2012), detecting no strong preference for Chinese overseas investment to weak institutional environments.
ACCEPTED MANUSCRIPT

ACC
EPTE
D M
ANU
SCR
IPT
4
listed companies from 2006-2008 to compare the overseas investment motivations for SOEs and non-
SOEs, and found that listed SOEs sought host countries that had poor institutions but rich natural
resource endowments. Duanmu (2012) using investment to 47 countries from 189 companies (SOEs
and non-SOE are distinguished) in Jiangsu province between 1999 and 2008 discovered the opposite
– that countries with abundant natural resources were not especially attractive for Chinese overseas
investment, to the point of being negative. Obviously, the small samples used in these two papers are
not representative.
Amighini et al (2013) extended this earlier analysis by separating the number of green field
investments for each country-sector-year for SOEs and non-SOEs from 2003 to 2008. They discovered
that Chinese private companies preferred large markets and strategic resources (high technology),
and avoided countries with poor institutions. The investment behaviour of SOEs accorded more with
the demands of China’s domestic economy, flowing to resource rich areas, and largely insensitive to
political risk. However, their dataset (fdiMarkets) does not consistently report project size, and so the
authors had to rely solely on the count of investments. This effectively treats a $15 billion project
equally to a $100 million project. Where studies do distinguish between SOEs and non-SOEs, they do
not distinguish between central SOEs, administered by the State-Owned Assets Supervision and
Administration Commission (SASAC) and those administered by provincial and county-level authorities
or outside the SASAC system. This is a further limitation, given that the investment behaviours and
motivations of central and local SOEs may be quite different. For example, central SOEs might be
expected to fulfil a ‘national champion’ role that leans more closely to national political and
development priorities, compared to local SOEs which might fulfil more profit-oriented development
objectives of their local owners (Li, Cui, and Lu 2014).
To investigate this, we augmenting a database of large-scale overseas investment projects with
detailed information on company ownership, including distinguishing central SASAC SOEs from others.
We do find differences in the motivations of central SOEs compared to local SOEs and private investors.
However, we explain this on the basis of sectoral distribution between resource and non-resource
sectors, rather than fundamentally different drivers on the basis of ownership. The rest of this paper
is presented in three sections. Section 2 briefly describes the limitation of the data that were applied
in the existing literature and discusses our data’s representativeness and reliability. Section 3
investigates the drive of China’s ODI in different sectors and with different ownerships. Section 4
discusses the implications of this study and concludes.
2. Chinese overseas investment data
2.1. Data limitations
Official data on Chinese overseas direct investment (ODI) is reported by China’s Ministry of
Commerce.3 This is also the basis of foreign direct investment statistics reported for China by the
United Nations Conference on Trade and Development. The Ministry of Commerce provides aggregate
data on the value of the flow and stock of Chinese outbound investment categorised by industry, by
destination country, and by registered ownership type. For a subset destination country, industry-
specific breakdowns of aggregate investment flows are also reported.
The Ministry of Commerce’s role in data collection stems from its administrative function to approve
overseas investments above a certain scale, and so potentially misses cases of smaller-scale projects
3 An authoritative source from the Ministry of Commerce is the Chinese Overseas Direct Investment Statistical
Report (2002-2014) (中国对外直接投资统计公报)
ACCEPTED MANUSCRIPT

ACC
EPTE
D M
ANU
SCR
IPT
5
that do not require registration, larger-scale projects which fail to register, and the reinvestment of
retained foreign earnings (Tan 2013; Rosen and Hanemann 2009). In addition to the investment
aggregate, the website of the Ministry of Commerce also provides a searchable database of around
41,000 registered outbound investments, but does not reveal project size.
The official data records only the first destination of the overseas investment, even if the substantive
economic investment often occurs in a third country. For example, an investment from a Chinese
company into an Australian resource project, via a Hong Kong listed subsidiary, would be officially
recorded as an overseas investment to Hong Kong, rather than to Australia. As a consequence, the top
three official destinations in the official statistics are Hong Kong, the British Virgin Islands and the
Cayman Islands. These account for 68 per cent of the recorded stock. Researchers using data that
include flows to these destinations therefore introduce a large bias into their results. By contrast,
research that omits flows to these destinations without being able to track the ultimate recipient
cannot claim to be representative since it misses at least two thirds of Chinese ODI.
The official data understates the role of SOEs in Chinese overseas investment by relying on official
registration categories for state-owned enterprises.4 According to this definition, SOEs held more than
55 per cent of the stock of outbound investment in 2013. But this statistic excludes investment made
by shareholding and limited liability companies that may be partially- or wholly state owned. This
includes all publicly-listed (and therefore partially state-owned) SOEs. In 2015, the head of the SASAC
reported that 107 central SOEs had 8,515 branches in 150 countries and regions, which collectively
account for 70 per cent of the country’s total outbound direct investment (Xinhua 2015). In addition
to this are investments from state-owned institutions that are not administered by central SASAC,
which include state owned banks and financial companies, and local SOEs.
Some of the deficiencies in the official data can be remedies by reliance on third party data is available
(Table 1). Many of these independent data sources observe Chinese investments in a final destination
and then trace it back to particular owners in China. Some provide information on company ownership.
However, none presents a complete overview of Chinese direct investment – often being restricted
by tracking Chinese investment only in a certain country, above a certain monetary threshold, or of a
certain type.
4 For a discussion of these, see Hubbard (2016a)
ACCEPTED MANUSCRIPT

ACC
EPTE
D M
ANU
SCR
IPT
6
Table 1: Non-official data sources on Chinese overseas investment
Name Publisher Time Host country
Ownership Scope and Scale
Public Access
China Global Investment Tracker
American Enterprise Institute and The Heritage Foundation
2005- Final destination (world)
Owner recorded, but not classified.
Direct and indirect investment valued more than US $100 million
Open
fDiMarkets Financial Times
2003- Final destination
Yes Greenfields investment (Scale not consistently recorded)
Paid
Zephyr Database
Bureau van Dijk
1980s- Official registration
No Foreign mergers and acquisitions
Paid
China Investment Monitor
Rhodium Group
2000- Final destination (United States)
Yes China’s Investment in US
Paid
Demystifying Chinese Investment in Australia
KPMG and University of Sydney
2007- Final destination (Australia)
Yes Direct investment valued more than US$5 million
Summary report available, not project level data.
China-Canada Investment Tracker
China Institute of University of Alberta
1993- Final destination (Canada)
Yes China’s Investment in Canada
Paid
Thompson-Reuters
Thompson-Reuters
1980s- Official registration
No Foreign mergers and acquisitions
Paid
The China Global Investment Tracker (the Tracker) covers Chinese investments announced in the
open-source media valued above $100 million. It does not purport to be a comprehensive measure of
actual overseas direct investment flows. It does not distinguish between direct investments (where
the investor takes a stake of more than 10 per cent) and (indirect) portfolio investments (other than
bonds, which are excluded). The Tracker dates investments from when they are announced rather
than when (or if) actual investment flows occur, although Tracker data is continually revised on the
basis of new information. Nor does it track exit of capital and so should not be added together to
provide a net stock of Chinese investment at any particular time.
Nevertheless, there is evidence that the Tracker is a reasonable proxy for large scale Chinese
investment. Its main advantage, when compared to proprietary datasets, is that the complete list of
projects is made publicly available. This allows users of the database to identify potential mistakes or
ACCEPTED MANUSCRIPT

ACC
EPTE
D M
ANU
SCR
IPT
7
inaccuracies at the project level, and gives the authors of the database the opportunity to revise and
correct the dataset on a semi-annual basis.5
In practice there is also a strong correlation both in levels and growth rates between the Tracker and
the official Ministry of Commerce aggregate figures (Chart 1), at least until 2011 (Scissors 2014). The
biggest discrepancy between the two relates to the destination of investment, which is easily
explained through the distinction between first and final destinations (Liao and Tsui 2012). Amongst
other datasets which record the first destinations (including the MofCom, Zephyr, Thompson-Reuters
etc), the leading recipients are the Hong Kong, and tax havens in the British Virgin Islands, and the
Cayman Islands. The Tracker does not report any large-scale investments in these locations.
Chart 1: Chinese Official ODI statistics v Tracker ($US million), by destination
Source: China Global Investment Tracker, Ministry of Commerce.
This correspondence is remarkable given that Tracker only identifies 899 different projects from only
353 unique Chinese companies between 2005 and 2015. By contrast, between 2005 and 2015 there
were 41168 investment proposals from 29343 unique companies officially registered with Mofcom.
By comparing gross non-financial ODI recorded by Tracker and official dataset, this means that roughly
90 per cent6 of Chinese (non-financial) ODI during that period came from less than 2.2 per cent of
China’s officially approved overseas investments. The divergence of the series may be due to the
growth in smaller scale (below $100 million) investments (whether actual growth, or improved data
collection for smaller investments). Therefore, the Tracker should only be considered as
5 Since the most recent year’s data is the most unreliable by this measure, we rely on the 2016 version of the database but do not include the most recent year’s projects. 6 Only non-financial ODI is considered for both dataset to keep consistency.
$-
$20,000
$40,000
$60,000
$80,000
$100,000
$120,000
$140,000
Mo
fCo
m
Trac
ker
Mo
fCo
m
Trac
ker
Mo
fCo
m
Trac
ker
Mo
fCo
m
Trac
ker
Mo
fCo
m
Trac
ker
Mo
fCo
m
Trac
ker
Mo
fCo
m
Trac
ker
Mo
fCo
m
Trac
ker
Mo
fCo
m
Trac
ker
Mo
fCo
m
Trac
ker
2005 2006 2007 2008 2009 2010 2011 2012 2013 2014
Other
British Virgin Islands
Cayman Islands
Hong Kong
Canada
Australia
United States
ACCEPTED MANUSCRIPT

ACC
EPTE
D M
ANU
SCR
IPT
8
representative of large-scale investments, and is likely to under-represent smaller scale investments
which are more likely to be from private investors and local SOEs.
Out of 899 tracked projects, we identify 55 as joint ventures between multiple owners. We allocate
capital according to different ownership types according to the reported share. Where the reported
share is not available, we assume equal shares between owners. The joint venture investments
account for $53,490 million of tracked investment (7. 7per cent of total). Of this, $37,674 million
(70 per cent) are joint ventures in energy or metals sectors. This gives a total of 957 large-scale
investments.
The Tracker does not identify the ownership status of investors. However, it does name the parent
company involved, making it possible to identify the ultimate controlling owner manually. Accordingly,
we classify controlling owners into five categories. If the ultimate owner is controlled by the SASAC of
the State Council then we identify the owner as a ‘Central SASAC’ enterprise. China’s major banks and
financial institutions are also owned by the central government, but not supervised by central SASAC.
We designate these as ‘Central Finance’ enterprises. Enterprises that are supervised by provincial and
other local governments are classified as ‘Local SOEs’. Enterprises that are controlled by non-state
companies are classified as ‘Private’, although these can in fact include minority state ownership. We
cannot identify owners for 21 projects, accounting for 1.2 per cent of recorded total investment.
Table 2 shows investment-level statistics by owner. From this we see that projects from central SOEs
are by the largest, with an average value of $1.1 billion. Average project size declines for central
financial SOEs, local SOEs and private companies. Overall, state-owned investment accounts for
79 per cent,
Table 2: China Tracker Investments by Ownership Type ($US million)
Total value (%) N Average Max
1. Central SASAC $343,858
0.50 335 $1,026 $15,100
2. Central Finance
$118,184
0.17 157 $753 $5,600
3. Local SOE $77,987
0.11 134 $582 $3,500
4. Private $138,920
0.20 310 $448 $7,100
5. Unknown $8,621
0.01 21 $411 $1,990
Grand Total $687,570 1.00 957 $718 $15,100
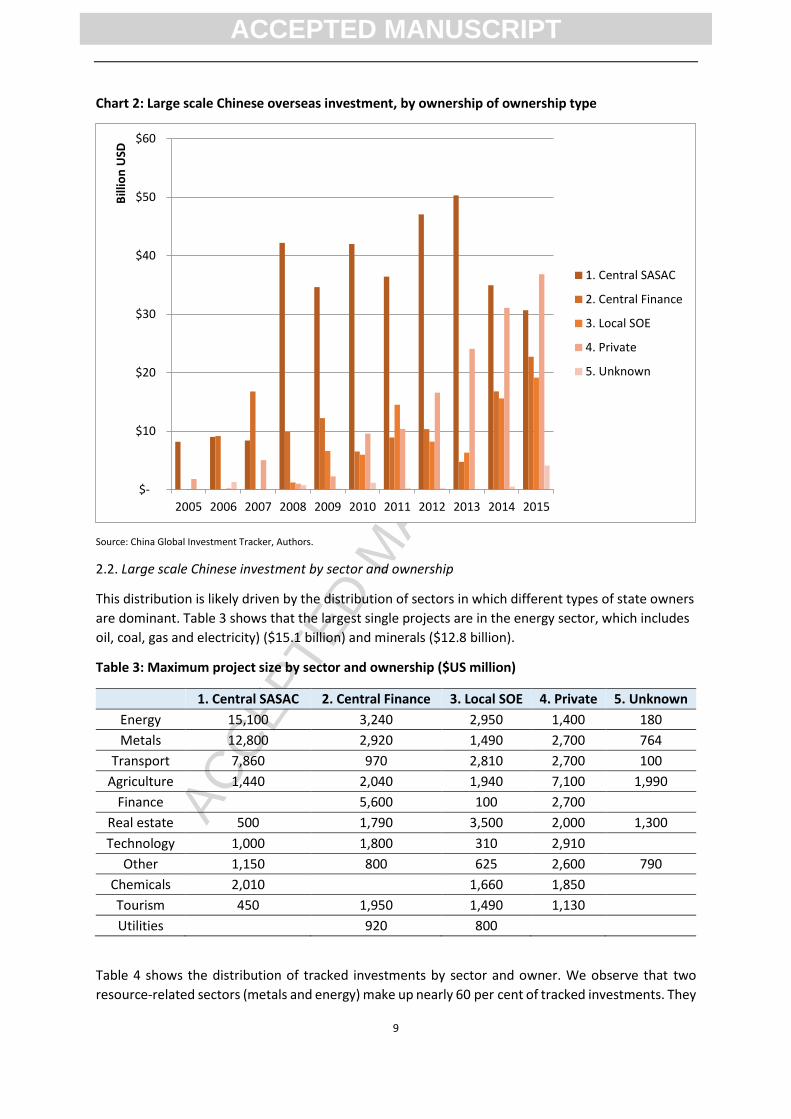
Chart 2 shows trends over time. We observe that investment from central SOEs surges from 2008 until
2013, before falling. By contrast, private investment and local SOE investment is very low before 2009,
but grows rapidly from then. This is consistent with Li et al’s (2014) proposition that local SOEs are
“more likely to follow a gradual internationalization path when conducting outward” investment than
central SOEs.
ACCEPTED MANUSCRIPT
ACC
EPTE
D M
ANU
SCR
IPT
9
Chart 2: Large scale Chinese overseas investment, by ownership of ownership type
Source: China Global Investment Tracker, Authors.
2.2. Large scale Chinese investment by sector and ownership
This distribution is likely driven by the distribution of sectors in which different types of state owners
are dominant. Table 3 shows that the largest single projects are in the energy sector, which includes
oil, coal, gas and electricity) ($15.1 billion) and minerals ($12.8 billion).
Table 3: Maximum project size by sector and ownership ($US million)
1. Central SASAC 2. Central Finance 3. Local SOE 4. Private 5. Unknown
Energy 15,100 3,240 2,950 1,400 180
Metals 12,800 2,920 1,490 2,700 764
Transport 7,860 970 2,810 2,700 100
Agriculture 1,440 2,040 1,940 7,100 1,990
Finance 5,600 100 2,700
Real estate 500 1,790 3,500 2,000 1,300
Technology 1,000 1,800 310 2,910
Other 1,150 800 625 2,600 790
Chemicals 2,010 1,660 1,850
Tourism 450 1,950 1,490 1,130
Utilities 920 800
Table 4 shows the distribution of tracked investments by sector and owner. We observe that two
resource-related sectors (metals and energy) make up nearly 60 per cent of tracked investments. They
$-
$10
$20
$30
$40
$50
$60
2005 2006 2007 2008 2009 2010 2011 2012 2013 2014 2015
Bill
ion
USD
1. Central SASAC
2. Central Finance
3. Local SOE
4. Private
5. Unknown
ACCEPTED MANUSCRIPT

ACC
EPTE
D M
ANU
SCR
IPT
10
are dominated by central SASAC SOEs (which themselves account for half of tracked investment). The
dominance of central SASAC SOEs in overseas investment in these sectors reflects the dominance of
the state in these sectors within China (Hubbard 2016b). Central financial companies (17 per cent of
total investment) are most heavily invested in finance sectors, followed by energy, real estate and
metals. Private Chinese investments (which account for 20 per cent of tracked investment) are the
dominant investor in real estate, agriculture, technology, other (including entertainment, textiles,
forestry and consumer goods) and tourism sectors. Local SOEs account for only 11 per cent of total
tracked investments. Local SOE investments range across all sectors, but dominate only in chemicals
sectors.
Table 4: Share of all tracked investment by sector and ownership
1. Central SASAC
2. Central Finance
3. Local SOE
4. Private 5. Unknown Grand Total
Energy 33.5% 3.7% 1.8% 2.0% 0.1% 41.1%
Metals 9.9% 1.9% 2.4% 2.8% 0.2% 17.2%
Real estate 0.5% 2.8% 2.5% 4.0% 0.5% 10.3%
Finance 0.0% 6.3% 0.0% 1.8% 0.0% 8.1%
Transport 3.7% 0.4% 2.0% 1.4% 0.0% 7.5%
Agriculture 0.7% 0.4% 1.2% 2.1% 0.3% 4.6%
Technology 0.7% 0.6% 0.0% 3.2% 0.0% 4.5%
Other 0.4% 0.4% 0.4% 2.3% 0.2% 3.6%
Tourism 0.1% 0.4% 0.4% 0.5% 0.0% 1.4%
Chemicals 0.4% 0.0% 0.5% 0.3% 0.0% 1.2%
Utilities 0.0% 0.3% 0.1% 0.0% 0.0% 0.4%
Grand Total
50.0% 17.2% 11.3% 20.2% 1.3% 100.0%
This suggests an appropriate categorisation of Chinese investment is into resources (energy and
minerals) and non-resource sectors. Separating resource investment from non-resource investment
reveals two time trends in Chinese investment abroad. Chart 5A shows an average $10 billion per
year of resource investment from 2005-2007, before leaping to $50 billion a year from 2008 to 2013.
By contrast, Chart 5B shows that Chinese investment in non-resource sectors has taken much longer
to grow, but by 2014 exceeded the total value of resource investment.
ACCEPTED MANUSCRIPT

ACC
EPTE
D M
ANU
SCR
IPT
11
Chart 5A: Large scale Chinese overseas investment over time – metals and energy
Chart 5B: Large scale Chinese overseas investment over time – other sectors
$-
$10
$20
$30
$40
$50
$60
$70
$80
$90
2005 2006 2007 2008 2009 2010 2011 2012 2013 2014 2015
Bill
ion
USD 5. Unknown
4. Private
3. Local SOE
2. Central Finance
1. Central SASAC
$-
$10
$20
$30
$40
$50
$60
$70
$80
$90
2005 2006 2007 2008 2009 2010 2011 2012 2013 2014 2015
Bill
ion
USD 5. Unknown
4. Private
3. Local SOE
2. Central Finance
1. Central SASAC
ACCEPTED MANUSCRIPT

ACC
EPTE
D M
ANU
SCR
IPT
12
2.3. Large scale Chinese investment by host country and ownership
The destinations for Chinese overseas investment also vary significantly between resource and non-
resource investments. Chart 6A shows the ten largest single recipients of tracked resource investment,
led by Australia and Canada. By contrast, Chart 6B shows that the United States is by far the largest
destination for non-resource investment. The private share of investment to the United States is much
greater. While central financial companies are the second largest categories, central SASAC enterprise
investment in the United States’ non-resource sectors is less than other much smaller host economies.
Chart 6A: Large scale Chinese overseas investment by host country (Metals and Energy)
Chart 6B: Large scale Chinese overseas investment by host country (Other Sectors)
$- $10 $20 $30 $40 $50 $60 $70
Australia
Canada
Brazil
Russian Federation
Kazakhstan
Peru
United States
Iran, Islamic Rep.
Indonesia
Switzerland
USD Billion
1. CentralSASAC2. CentralFinance3. Local SOE
4. Private
$- $10 $20 $30 $40 $50 $60 $70 $80 $90
United States
United Kingdom
Australia
Italy
Korea, Rep.
France
Singapore
Brazil
Russian Federation
Germany
USD Billion
1. CentralSASAC
2. CentralFinance
3. Local SOE
4. Private
ACCEPTED MANUSCRIPT

ACC
EPTE
D M
ANU
SCR
IPT
13
3. Re-estimating the motivations of China’s ODI
3.1 Descriptive research
Any early study of Chinese investment in the 1980s and 1990s found that Chinese investment
appeared to be attracted to environments that were less politically stable, and speculated that
“Chinese firms seek foreign investment opportunities in environments that resemble their home
environment” and may be “unconstrained by the ethical and governance obligations that are normally
expected of Western MNEs today” (Buckley, Clegg, and Cross 2007).
However, the relationship may not be entirely one way. Whether or not a Chinese overseas
investment occurs will also be constrained by the regulatory regime in the host economy. Less stable
countries may be forced by necessity to adopt a ‘beggars can’t be choosers approach’ to investment,
while richer hosts might for internal political reasons have more restrictive regimes (if not explicitly
against Chinese investment, then potentially relating to state-owned enterprises or in particular
‘strategic’ sectors where SOEs are more likely to invest.)
For example, not only did the political reaction of the United States to the 2005 takeover deal of
United States’ oil company Unocal by the China National Offshore Oil Corporation (a central SOE)
prevent that $13 billion transaction from occurring, but an event study of estimated that it reduced
the market value of other US oil and gas firms by nearly $59 billion (Wan and Wong 2009), presumably
by reducing the potential for other deals in that sector. If other Chinese SOEs interpreted this as
hostility to state-owned investments in general, rather than being sector-specific, this would also lead
to Chinese SOEs choosing to invest in more welcoming destinations.7
Chart 7 shows the tracked data, by owner, plotted against a proxy for the quality of governance, the
World Governance Indicators (WGI). We see that Chinese SOEs do invest in countries with below
average WGI scores. But the bulk of investment when measured in terms of value is concentrated in
countries with very high WGI scores. The largest single recipient of tracked non-state investment is to
the United States, which is ranked highly in terms of its WGI as well as being the world’s largest
economy in market exchange rate terms.
7 Thanks to Derek Scissors for pointing out this particular example.
ACCEPTED MANUSCRIPT

ACC
EPTE
D M
ANU
SCR
IPT
14
Chart 7: Total tracked investment by 2004 World Governance Indicator ($US million)
Nevertheless, we observe that state investors in particular have significant (but smaller) investments
in countries with poor governance. This pattern may be related to resource investment. Chart 8 shows
the size of tracked state and non-state investment in each host country by the size of circle. The
horizontal axis remains the same measure of world governance indicator, while the vertical axis shows
the proportion of natural resource rents in the host country’s GDP. The largest recipients on Chinese
resource investment, Australia and Canada are developed economies with high WGI scores in which
the relative share of resources is actually quite low. However, we observe significant smaller scale
Chinese investment in resource-intensive economies with poor WGI scores.
$-
$10
$20
$30
$40
$50
$60
$70
$80
-2 -1 0 1 2
USD
Bill
ion
World Governance Indicator (2004)
Non-SOE
SOE
ACCEPTED MANUSCRIPT

ACC
EPTE
D M
ANU
SCR
IPT
15
Chart 8: Tracked Chinese resource investment, by country’s average world governance indicator
and relative resource dependence
However, even large share of resource rents in a small economy (for example, Papua New Guinea)
may not be large enough in absolute value to support large scale investment. Chart 9 calculates an
absolute value of resource endowments, by multiplying the share of relative resource rents by GDP in
2004. The top four countries for resource endowments in order are Canada, Russia, Australia and
Brazil. We observe that Brazil is the third largest recipient of tracked resource investment after
Australia and Canada, even though its absolute resource rents are much less than Russia.
-0.2
-0.1
0
0.1
0.2
0.3
0.4
0.5
0.6
0.7
0.8
-3 -2 -1 0 1 2 3
Shar
e o
f G
DP
fro
m N
atu
ral R
eso
urc
e R
en
ts
World Governance Indicator
SOE
Non-SOE
ACCEPTED MANUSCRIPT

ACC
EPTE
D M
ANU
SCR
IPT
16
Chart 9 Tracked investment by country’s average world governance indicator and absolute
resource rents
Overall, there is no easily stylized fact about the institutional preferences of Chinese investors to
draw from these descriptive statistics. Untangling this requires more thorough regression analysis.
3.2 Determinants of Chinese Investment
Armed with this broadly representative dataset of large-scale Chinese investment and carefully
defined ownership categories, we are now able to overcome some of the problems with earlier studies.
Following Amighini et al (2013), we construct a variable which observers the total value of all tracked
investment for a given owner for each potential recipient country-sector-year. 8 Table 5 shows
summary statistics for the non-zero dependent variables based on the Tracker data from 2005 to 2015,
with our detailed ownership classifications.
Table 5 Dependent Variables, Summary Statistics ($US million)
Mean Sum Nonzero observations
All 1,145.4 686,080 599
All State 1,257.6 539,509 429
Central SASAC 1,374.9 343,718 250
Central Finance 957.8 117,804 123
Local SOE 684.1 77,987 114
Non-state 618.6 137,950 223
Because there are 23,232 potential country-sector-year observations, but only 957 tracked
investments, it is inevitable that most of the observations will be zero. For this reason we follow
8 Taiwan is excluded due to absence of control variables.
0
50
100
150
200
250
300
350
400
-3 -2 -1 0 1 2 3
Val
ue
of
Nat
ura
l Re
sou
rce
Re
nts
World Governance Indicator
SOE
Non-SOE
Russia
Saudi Arabia
Russia
Brazil Australia
Canada
Iran
Russia
ACCEPTED MANUSCRIPT

ACC
EPTE
D M
ANU
SCR
IPT
17
Amighini et al’s (2013) choice of a poisson regression model. Although their observations were based
on the number of projects rather than total investment value, Silva and Tenreyro (2006) show that a
Poisson pseudo-maximum-likelihood (PPML) estimation is appropriate in this situation, and has
previously been applied by Zhu (2012) and Liao and Tsui (2012) to Chinese direct investment using the
Tracker data.9
With subscripts for each country, sector, year omitted, our model takes this form.
E(investment in country i, sector j, year t) = exp ( α + β1institutionsit + β2naturalresourcesit +
β3lngdpcurrentit + β4lngdppercapitait + β5gdpgrowthit + β6hightechit + β7lndistwi + β8im_exchinait + β
9ex_importit + β10gdpgrowthchinat + β11yeart + ε )
To avoid problems of endogeneity, all independent variables are lagged by one year. Summary
statistics for each of these independent variables are presented in Table 6. A correlation matrix is
included in the appendix.
We are required to choose a measure for resource endowments.10 This could be a measure of absolute
volume or value of resource (used for example in Wang et al 2014, Hurst 2011) or a measure that is
relative to some other indicator, such as GDP or total exports. As we saw earlier in Charts 8 and 9, the
choice can present a different picture. In our study we apply both methods, for consistency with
Amighini et al (2013), we present findings in the main paper based on a relative resource measure.
However, we present findings based on absolute resource measure in the appendix. Given the
functional form of the model we are using, we argue in the appendix that the relative measure
provides a better fit.
We use WGI as a summary measure of general host country institutional quality. Following the
presentation of overall results, we will decompose this index into its six subindices for a more detailed
discussion of the influence of institutions on Chinese investment and comparison with other results.
9An anonymous reviewer also suggested incorporating fixed effects. While easily implementable for linear
models, the inclusion of fixed effects estimator in nonlinear models such as poisson is not straightforward. In
non-linear models, the estimator suffers from an “incidental parameters problem” (Neyman and Scott 1948).
This causes the maximum likelihood estimator (MLE) to be inconsistent in the presence of fixed effects when
the number of individuals (n) is large relative to the time series dimension (T) (Greene 2004). Recent research
to incorporate fixed effects into nonlinear models (Helpman, Melitz, and Rubinstein 2008; Silva and Tenreyro
2006) remains largely theoretical, and not yet incorporated into STATA code for the purpose of our study.
10 Following the advice of an anonymous reviewer, we check robustness by measuring resource and technology intensity proxied by share of fuel and mineral in the total export and R&D expenditure (% of GDP) respectively. The new regression results reveal that our ppml model is robust for different proxies’ setting (see appendix), although missing observations in the alternative proxies suggested cause the loss of around 7,000 observations.
ACCEPTED MANUSCRIPT

ACC
EPTE
D M
ANU
SCR
IPT
18
Table 6 Explanatory Variables, Summary Statistics
Variable Name Motivation, measurement and source Mean Median Max Min
institutions measure of host country governance -0.06 -0.22 1.99 -1.93
World Governance Indicators (WGI) naturalresources Relative resource endowment 0.11 0.04 0.89 0.00
natural resource rent as % of total GDP lngdpcurrent Market size of host country 23.91 23.73 30.49 18.32
GDP (logged, $US billion) lngdppercapita Market affluence in host country 8.17 8.16 11.36 4.90
per capita GDP ($US logged) gdpgrowth Growth in host market 4.08 4.05 104.49 - 62.08
annual % growth hightech Technology seeking behaviour 9.35 4.95 87.40 0.00
High-tech exports as % of total manufactured exports
lndistw Geographic proximity to China 9.01 9.05 9.86 6.93
Distance from China weighted relative to population (CEPII)
im_exchina Importance of trade with China 0.11 0.04 6.07 0.00
(imports from China + exports to China) / GDP (UN Comtrade)
ex_import Openness to trade 92.59 83.09 455.28 0.31
(imports + export) as % of GDP gdpgrowthchina Growth in China (time control) 10.00 9.82 14.19 7.27
annual % GDP growth in China year Trend in investment over time 2010 2010 2015 2004
Source is WDI: World Development Indicators (http://data.worldbank.org/data-catalog/world-development-indicators), except where
specified as WGI: Worldwide Governance Indicators (http://info.worldbank.org/governance/wgi/index.aspx#home) , CEPII (www.cepii.fr/) , UN Comtrade Database (http://comtrade.un.org/)
We have considered other possible variables that may influence Chinese overseas investment, include
the exchange rate between RMB and host countries’ currency, host countries’ inflation and total tax
rate. These variables were not significant in our preliminary regressions; therefore we dropped them
from our study.
Table 7 shows the regression results for all sectors and owners (column 1). We observe that overall
Chinese investment is attracted to countries of larger economic size with resource endowments. As
for market-seeking, most of the existing literature supports the market seeking hypothesis for
countries with good institutions (Buckley, Clegg, and Cross 2007; Y. Cheung, Haan, and Qian 2011;
Hurst 2011; Kolstad and Wiig 2012). We also spilt the whole sample into two subsamples with good
and poor institutions. In contrast to these earlier studies, our evidence support market seeking
hypothesis in both of these two subsamples (results are in the appendix).
Institutions are a significant positive attractor; although per capita incomes are not11. We note some
significant attraction to hosts with higher technology output, as well as for those that are more distant
11 The question of potential multicollinearity problem between the institutional measure and GDP per capita, as suggested by one anonymous review, is considered in the appendix.
ACCEPTED MANUSCRIPT

ACC
EPTE
D M
ANU
SCR
IPT
19
from China. The degree of trade with China is a significant positive predictor of Chinese investment,
but trade with the world more generally is not.
These results are not common across all ownership types – compared to central SASAC SOEs (column
3) or central financial enterprises (column 4), local SOEs (column 5) and non-state investors (column
6) appear not to be attracted by resources, but are significantly attracted to host countries that trade
more with China and countries with higher technology intensity.
Our results suggest that investment increases as distance from China increases, which deviates from
earlier literature. This is most likely on account of the correct treatment of investment to Hong Kong
in the Tracker database which shows that Chinese investment is not concentrated in Asia. According
to the Tracker, investment to Africa accounts for 21 per cent of investment. There are only six Asian
countries that account for more than 1 per cent of large-scale Chinese investment (Indonesia 2.4%,
Malaysia 1.1%, Singapore 1.8%, India 1.0%, South Korea 1.4%, and Kazakhstan 2.8%). This is much
lower than the United States (14.3%) or Australia (11.2%).
Table 7 Regression Results, All Sectors
(1) (2) (3) (4) (5) (6)
All
(Value)
All State
(Value)
Central SASAC
(Value)
Central Finance
(Value)
Local SOE
(Value)
Non-state
(Value)
institution 0.82*** 0.74*** 0.71** 0.65* 0.72* 1.17***
(3.92) (3.05) (2.26) (1.70) (1.72) (4.53)
relativeResource 3.67*** 3.76*** 4.30*** 3.14* -0.58 2.63
(4.85) (4.60) (4.49) (1.91) (-0.33) (1.72)
lngdpcurrent 0.74*** 0.68*** 0.62*** 0.97*** 0.56*** 0.91***
(14.49) (11.34) (7.20) (9.71) (6.59) (9.39)
lngdppercapita -0.49*** -0.44*** -0.49*** -0.30 -0.09 -0.59***
(-3.89) (-3.15) (-2.93) (-1.26) (-0.36) (-2.90)
gdpgrowth -0.01 -0.02 -0.03 -0.03 0.11** 0.06
(-0.27) (-0.86) (-1.27) (-0.84) (2.47) (1.14)
hightech 0.02*** 0.02*** 0.01 0.02 0.02*** 0.03***
(3.34) (2.61) (1.27) (1.54) (2.60) (3.37)
lndistw 0.51*** 0.53*** 0.55*** 0.62*** 0.22 0.55***
(4.06) (3.53) (2.63) (2.85) (0.75) (3.18)
im_exchina 1.41*** 1.31*** 1.20*** 0.76 1.63*** 1.87***
(4.82) (4.17) (3.13) (0.72) (3.49) (2.93)
ex_import -0.00* -0.01* -0.01 -0.00 -0.01** -0.00
(-1.86) (-1.73) (-1.17) (-0.33) (-2.25) (-0.70)
gdpgrowthchina1 0.13* 0.17** 0.16 0.22** 0.05 -0.09
(1.88) (2.23) (1.56) (2.43) (0.38) (-0.76)
year 0.23*** 0.21*** 0.19*** 0.22*** 0.33*** 0.31***
(5.88) (4.99) (3.33) (3.38) (3.96) (4.02)
_cons -489.02*** -448.98*** -401.16*** -468.80*** -670.72*** -638.12***
(-6.11) (-5.19) (-3.48) (-3.57) (-4.04) (-4.16)
Obs. 22044 22044 22044 22044 22044 22044
Log likelihood -1974202 -1793912 -1412471 -417315 -313286 -395526
Adj. R² 0.064 0.028 0.009 0.042 0.017 0.143
t statistics in parentheses * p < 0.10, ** p < 0.05, *** p < 0.01
Having observed significant differences across between ownership types across all sectors, we
investigate whether this is on account of differences in the character of the owner, or whether it
simply reflects the dominance of central SOEs in resource investment and non-state investors in other
sectors.
First we examine results for the resource sector (Table 8). We observe consistent coefficient sizes and
significant levels across the key indicators. All ownership types are attracted to resource endowments,
ACCEPTED MANUSCRIPT

ACC
EPTE
D M
ANU
SCR
IPT
20
and low income countries with the exception of central financial enterprises. This may be because
central finance companies could be more likely to make portfolio investments12 in resource assets,
which presupposes an assets market which may not exist in lowest income countries. In terms of
differences between ownership types, we note that the preference for distance only pertains
significantly to central SASAC SOEs. Other ownership types prefer hosts with more bilateral trade with
China.
Table 8 Regression Results, Resources Sectors
(1) (2) (3) (4) (5) (6)
All
(Value)
All State
(Value)
Central SASAC
(Value)
Central Finance
(Value)
Local SOE
(Value)
Non-state
(Value)
institution 1.09*** 1.05*** 0.93*** 0.94* 2.44*** 1.47***
(4.01) (3.60) (2.82) (1.65) (4.38) (3.02)
relativeResource 5.48*** 5.50*** 5.39*** 5.23** 6.75*** 5.24***
(6.19) (6.01) (5.54) (2.45) (2.87) (2.79)
lngdpcurrent 0.65*** 0.65*** 0.66*** 0.67*** 0.56*** 0.65***
(7.67) (7.12) (6.51) (4.63) (4.99) (4.49)
lngdppercapita -0.68*** -0.65*** -0.66*** -0.33 -0.86*** -0.96***
(-4.79) (-4.31) (-4.05) (-0.90) (-3.70) (-2.96)
gdpgrowth -0.03 -0.03 -0.03 -0.07 -0.01 0.05
(-1.15) (-1.41) (-1.19) (-1.59) (-0.11) (0.89)
hightech 0.01* 0.01* 0.01* 0.00 -0.03 0.01
(1.71) (1.66) (1.87) (0.10) (-0.54) (0.81)
lndistw 0.51*** 0.58*** 0.66*** 0.38 0.24 -0.00
(2.73) (2.90) (2.68) (1.40) (1.00) (-0.01)
im_exchina 1.71*** 1.58*** 1.32*** 1.62* 3.23*** 2.23***
(5.35) (4.61) (3.06) (1.84) (4.74) (4.12)
ex_import -0.01 -0.01 -0.01 -0.02** -0.04** -0.02***
(-1.62) (-1.41) (-1.00) (-2.23) (-1.97) (-3.40)
gdpgrowthchina1 0.16* 0.16* 0.15 0.23 0.14 0.11
(1.74) (1.73) (1.38) (1.47) (0.89) (0.75)
year 0.19*** 0.17*** 0.17*** 0.15 0.21* 0.40***
(3.67) (3.34) (2.85) (1.43) (1.82) (3.24)
_cons -389.79*** -365.46*** -364.28*** -323.35 -420.33* -803.10***
(-3.81) (-3.49) (-2.99) (-1.49) (-1.84) (-3.28)
Obs. 4008 4008 4008 4008 4008 4008
Log likelihood -900907 -875787 -805321 -127242 -84444 -89436
Adj. R² 0.073 0.062 0.042 0.023 0.105 0.075
t statistics in parentheses * p < 0.10, ** p < 0.05, *** p < 0.01
Table 9 presents regression results for the non-resource sector. Here we see no preference for natural
resource rich hosts, nor investment in lower-income countries. There is no longer a significant
relationship between trade with China and overall investment levels. Both local SOEs and non-state
investors are attracted to countries with a higher share of higher-technology goods, suggesting some
kind of technology seeking behavior. However, while private investors appear to prefer investment in
more remote places (probably driven by preference for the United States), we observe that local SOEs
exhibit no significant preference for distance.
Table 9 Regression Results, Non-resource Sectors
(1) (2) (3) (4) (5) (6)
All
(Value)
All State
(Value)
Central SASAC
(Value)
Central Finance
(Value)
Local SOE
(Value)
Non-state
(Value)
institution 0.00 -0.39 -1.02 0.42 -0.32 0.87***
12 The Tracker does not distinguish portfolio investment from direct investment other than excluding unconverted bonds.
ACCEPTED MANUSCRIPT

ACC
EPTE
D M
ANU
SCR
IPT
21
(0.00) (-1.01) (-1.58) (0.76) (-0.69) (2.70)
relativeResource -2.24 -4.34** -7.62** 0.43 -5.39** 1.38
(-1.50) (-2.36) (-2.08) (0.20) (-2.15) (0.54)
lngdpcurrent 0.80*** 0.71*** 0.49*** 1.08*** 0.55*** 0.97***
(11.29) (8.83) (3.94) (8.68) (4.82) (7.85)
lngdppercapita 0.15 0.35 0.79 -0.22 0.41 -0.26
(0.72) (1.24) (1.63) (-0.63) (1.09) (-0.98)
gdpgrowth 0.05 0.04 -0.01 -0.01 0.17*** 0.04
(1.64) (1.24) (-0.45) (-0.09) (2.97) (0.59)
hightech 0.03*** 0.02** -0.03 0.03 0.04*** 0.04***
(3.07) (2.17) (-1.22) (1.54) (4.15) (2.87)
lndistw 0.41*** 0.35* -0.06 0.68** 0.10 0.66***
(2.98) (1.96) (-0.35) (2.18) (0.26) (3.35)
im_exchina 0.71 0.49 1.09 -0.04 -0.40 1.15
(1.29) (0.63) (1.45) (-0.03) (-0.28) (1.57)
ex_import -0.00 -0.00 -0.01 0.00 -0.00 0.00
(-0.28) (-0.67) (-1.13) (0.54) (-0.78) (0.41)
gdpgrowthchina1 0.08 0.18* 0.24 0.23** -0.02 -0.15
(0.94) (1.86) (1.07) (2.07) (-0.15) (-0.96)
year 0.31*** 0.32*** 0.35** 0.26*** 0.42*** 0.29***
(6.30) (5.25) (2.53) (3.26) (4.21) (3.14)
_cons -655.43*** -669.16*** -731.10** -556.12*** -869.13*** -616.95***
(-6.52) (-5.43) (-2.56) (-3.46) (-4.29) (-3.29)
Obs. 18036 18036 18036 18036 18036 18036
Log likelihood -708682 -546447 -208412 -272604 -198665 -279530
Adj. R² 0.158 0.052 0.014 0.049 0.024 0.169
t statistics in parentheses * p < 0.10, ** p < 0.05, *** p < 0.01
3.3 Detailed analysis of institutions and interactions
The World Governance Indicator used above as a proxy for institutional quality is composed of six
subindices: control of corruption, government effectiveness, political stability, regulatory quality, rule
of law, and voice and accountability.
Dollar (2016) found that, unlike ODI from other countries, after controlling for other factors Chinese
investment appeared to be indifferent to the quality of governance as measured. Amighini et al (2013)
found that the SOEs in particular are not attracted specifically to politically unstable countries (as
measured the political stability index), but that investment is often drawn there because there tends
to be an abundance of resources in such places.
To examine these in more detail, we replace the ‘institution’ variable in earlier regressions with the
six subindices. All are constructed in the same way as an index with a mean of zero13 and standard
deviation of one.14 Of these, government effectiveness, rule of law, regulatory effectiveness and
control of corruption are most associated with higher income countries.
Table 10 shows the regression results. Other than replacing the ‘institution’ measure with the WGI
subindices, all the independent variables from the earlier regressions are retained. We do not report
them since the levels and significance of these is largely unchanged
The results show quite a different influence of different subindices. Overall, there is significant
attraction to political stability, and against rule of law, that is driven by central (SASAC and financial
SOEs).
13 The mean for the 192 countries in our sample of is actually less than zero, compared to 215 countries in the WGI 14 The potential problem of multicollinearity between these subindices, as suggested by an anonymous reviewer, is considered in an appendix.
ACCEPTED MANUSCRIPT

ACC
EPTE
D M
ANU
SCR
IPT
22
Table 10 Regression results summary for detailed governance indicators, all sectors
(1) (2) (3) (4) (5) (6)
All
(Value)
All State
(Value)
Central
SASAC
(Value)
Central
Finance
(Value)
Local SOE
(Value)
Non-state
(Value)
controlofcorruption 0.42 0.67** 1.12** -0.35 -0.33 -0.76**
(1.48) (1.99) (2.49) (-0.73) (-0.62) (-1.96)
governmenteffectiveness 0.10 -0.03 0.13 -0.92 0.32 0.83
(0.28) (-0.08) (0.26) (-1.23) (0.39) (1.00)
politicalstability 0.53*** 0.58*** 0.76*** 0.77** -0.36 0.40
(3.04) (2.86) (3.08) (2.31) (-1.02) (1.62)
regulatoryquality 0.81** 0.90** 0.74* 2.95*** 0.86 0.78
(2.39) (2.46) (1.74) (3.61) (1.21) (1.26)
ruleoflaw -0.69** -1.02*** -1.54*** -0.82* -0.12 0.66
(-1.96) (-2.58) (-3.03) (-1.80) (-0.20) (1.25)
voiceandaccountability -0.11 -0.11 -0.16 0.03 0.66** -0.33
(-0.83) (-0.72) (-0.89) (0.06) (2.31) (-0.94)
relativeResource 3.67*** 3.93*** 4.65*** 4.97** 1.38 1.61
(4.32) (4.27) (4.13) (2.30) (0.82) (0.78)
_cons -
499.54***
-470.84*** -429.13*** -489.82*** -715.33*** -569.87***
(-5.93) (-5.15) (-3.54) (-3.12) (-4.16) (-3.88)
Obs. 22044 22044 22044 22044 22044 22044
Log likelihood -1958111 -1773875 -1386036 -401877 -309298 -390802
Adj. R² 0.066 0.032 0.012 0.053 0.020 0.146
We again consider whether this is driven by the distribution of ownership across resources and non-
resource sectors. Consistent with our earlier findings that the sector rather than ownership drives the
difference, Table 11 shows that political stability is a significant positive factor for resource investment
across all ownership categories, while rule of law is a negative factor for all ownership types.
The coefficient on the control of corruption subindex is positive and significant for central SASAC
enterprises. That indicates that a clean government will attract larger SOE investment in its resource
sector, and contradicts notion that Chinese enterprises are somehow more capable of dealing with
corrupt environments.
Table 11 Regression results summary for detailed governance indicators, resources
(1) (2) (3) (4) (5) (6)
All
(Value)
All State
(Value)
Central
SASAC
(Value)
Central
Finance
(Value)
Local SOE
(Value)
Non-state
(Value)
controlofcorruption 1.25*** 1.42*** 1.57*** -0.90 1.33* -0.91
(3.18) (3.39) (3.46) (-1.09) (1.85) (-1.55)
governmenteffectiveness 0.57 0.51 0.41 1.05 1.90* 0.76
(1.22) (1.05) (0.74) (1.16) (1.73) (0.84)
politicalstability 1.03*** 1.05*** 1.02*** 1.51*** 1.09** 1.04***
(4.85) (4.54) (3.91) (2.73) (2.17) (2.74)
regulatoryquality 0.99** 0.94** 0.84* 1.71** 2.00** 3.13***
(2.41) (2.25) (1.83) (2.07) (2.16) (3.83)
ruleoflaw -2.10*** -2.19*** -2.16*** -1.82** -3.65*** -1.26
(-4.53) (-4.50) (-4.03) (-2.18) (-4.42) (-1.11)
voiceandaccountability -0.08 -0.12 -0.20 1.01** 0.78 0.04
(-0.48) (-0.71) (-1.09) (2.14) (1.35) (0.09)
relativeResource 6.34*** 6.39*** 6.21*** 8.76*** 9.23*** 6.93***
(6.24) (5.93) (5.30) (4.66) (3.19) (2.98)
_cons -431.15*** -409.97*** -408.26*** -339.99 -539.59** -803.95***
(-3.99) (-3.71) (-3.18) (-1.37) (-2.16) (-3.31)
Obs. 4008 4008 4008 4008 4008 4008
Log likelihood -853701 -828222 -763002 -117618 -79539 -82238
Adj. R² 0.107 0.098 0.069 0.033 0.125 0.074
ACCEPTED MANUSCRIPT

ACC
EPTE
D M
ANU
SCR
IPT
23
t statistics in parentheses * p < 0.10, ** p < 0.05, *** p < 0.01
Amighini et al (2013), Kolstad and Wiig (2012) considered the interaction between political stability
and relative resource endowments and found the interaction term to be negative and significant for
SOE investment but not for private investment. Taking the political stability measure as a proxy of risk,
this would support the notion that Chinese direct investors are prepared to take on political risk in
order to access resources. Our results reject this argument. We find the coefficient on political stability
to be either insignificant or positive, consistent with a preference for political stability.
When we interact the political stability index with the measure of relative resource endowments (politicalstability_REL in Table 12) we find that for local SOEs and non-state Chinese investors, total investment value in resources depends highly on natural resources – the more stable the government of the host country, the more Chinese investment is attracted by natural resources.
Table 12 Regression results summary for detailed governance indicators, interaction between
political stability and resources
(1) (2) (3) (4) (5) (6)
All
(Value)
All State
(Value)
Central
SASAC
(Value)
Central
Finance
(Value)
Local SOE
(Value)
Non-state
(Value)
politicalstability_REL -0.02 -0.38 -0.51 0.93 3.25* 5.81***
(-0.03) (-0.66) (-0.82) (0.96) (1.77) (2.92)
controlofcorruption 1.25*** 1.37*** 1.49*** -0.82 1.61** -0.49
(3.19) (3.27) (3.35) (-0.98) (2.02) (-0.64)
governmenteffectiveness 0.57 0.55 0.45 0.97 1.82* 0.35
(1.21) (1.10) (0.81) (1.07) (1.69) (0.40)
politicalstability 1.04*** 1.15*** 1.15*** 1.32** 0.58 0.36
(3.90) (3.87) (3.40) (2.43) (0.97) (0.86)
regulatoryquality 0.99** 0.99** 0.91* 1.63** 1.71* 2.84***
(2.41) (2.33) (1.93) (1.99) (1.71) (3.47)
ruleoflaw -2.10*** -2.21*** -2.17*** -1.79** -3.70*** -1.21
(-4.52) (-4.47) (-3.99) (-2.19) (-4.42) (-1.04)
voiceandaccountability -0.08 -0.16 -0.26 1.11** 0.93 0.07
(-0.47) (-0.88) (-1.31) (2.13) (1.54) (0.17)
relativeResource 6.34*** 6.26*** 6.01*** 8.78*** 8.47*** 5.37**
(6.32) (5.90) (5.32) (4.67) (2.63) (2.31)
_cons -431.14*** -409.79*** -408.62*** -342.48 -560.19** -845.19***
(-3.99) (-3.72) (-3.19) (-1.37) (-2.21) (-3.05)
Obs. 4008 4008 4008 4008 4008 4008
Log likelihood -853700 -827899 -762499 -117490 -78829 -78974
Adj. R² 0.107 0.098 0.070 0.034 0.125 0.078
t statistics in parentheses * p < 0.10, ** p < 0.05, *** p < 0.01
Next we test if the divergence in our results from Amighini et al (2013) might be based on the count
of the investments, rather than totally value. This approach weights all projects equally, and would
therefore fail to capture the possibility that investors might limit their exposure to risk by limiting
investment size. Table 13 shows our regression results based on count value. Again, we find a
preference for political stability, this time observing that politically-stable resource-rich countries
attract significantly more investment projects from central SASAC companies.
ACCEPTED MANUSCRIPT

ACC
EPTE
D M
ANU
SCR
IPT
24
Table 13 Regression results summary for detailed governance indicators, interaction between
political stability and resources (count data)
(1) (2) (3) (4) (5) (6)
All
(Count)
All State
(Count)
Central
SASAC
(Count)
Central
Finance
(Count)
Local SOE
(Count)
Non-state
(Count)
politicalstability_REL 1.29*** 0.99** 0.91* 0.95 2.22** 3.41***
(2.93) (2.18) (1.77) (1.11) (2.08) (2.88)
controlofcorruption 0.91*** 1.25*** 1.24*** -0.67 2.38*** -0.38
(2.58) (3.21) (3.11) (-0.77) (3.03) (-0.63)
governmenteffectiveness 0.55 0.34 0.16 1.43 0.72 1.20
(1.40) (0.83) (0.38) (1.39) (0.63) (1.45)
politicalstability 0.50*** 0.53*** 0.43** 1.25** 0.57 0.35
(2.99) (2.81) (2.05) (2.31) (1.29) (0.96)
regulatoryquality 0.78*** 0.75*** 0.45 1.87*** 2.11*** 1.54**
(2.77) (2.61) (1.49) (2.70) (2.64) (2.07)
ruleoflaw -1.69*** -1.87*** -1.50*** -2.14** -4.29*** -1.13*
(-4.87) (-4.94) (-3.66) (-2.42) (-6.19) (-1.66)
voiceandaccountability 0.20 0.15 -0.00 0.92 0.97** 0.18
(1.25) (0.82) (-0.01) (1.63) (2.22) (0.58)
relativeResource 5.39*** 5.30*** 4.55*** 8.81*** 8.10*** 5.42***
(6.69) (6.13) (4.89) (5.59) (3.99) (3.42)
_cons -358.97*** -317.38*** -269.45*** -248.85 -642.64*** -594.55***
(-5.02) (-4.34) (-3.34) (-1.62) (-3.99) (-3.35)
Obs. 4008 4008 4008 4008 4008 4008
Log likelihood -1032 -893 -724 -157 -184 -253
Adj. R² 0.191 0.148 0.104 0.057 0.129 0.169
t statistics in parentheses * p < 0.10, ** p < 0.05, *** p < 0.01
Table 14 shows a more equivocal interaction between rule of law and resource abundance. Overall,
the coefficients on rule of law remain negative and mostly significant, however, no interaction
between rule of law and resource endowment is detected.
Table 14 Regression results summary for detailed governance indicators, interaction between rule
of law and resources
(1) (2) (3) (4) (5) (6)
All
(Value)
All State
(Value)
Central
SASAC
(Value)
Central
Finance
(Value)
Local SOE
(Value)
Non-state
(Value)
ruleoflaw_REL 0.08 -0.16 -0.15 -2.09 3.78 3.52
(0.12) (-0.23) (-0.20) (-1.36) (1.30) (1.63)
controlofcorruption 1.26*** 1.41*** 1.56*** -0.99 1.34* -0.87
(3.20) (3.35) (3.43) (-1.19) (1.69) (-1.27)
governmenteffectiveness 0.56 0.52 0.41 1.18 1.73 0.61
(1.21) (1.06) (0.75) (1.27) (1.64) (0.71)
politicalstability 1.03*** 1.07*** 1.03*** 1.61*** 0.95* 1.04**
(4.79) (4.53) (3.92) (2.96) (1.81) (2.56)
regulatoryquality 0.98** 0.96** 0.86* 1.93** 1.73* 2.87***
(2.33) (2.22) (1.81) (2.13) (1.85) (3.68)
ruleoflaw -2.11*** -2.18*** -2.14*** -1.73** -3.80*** -1.54
(-4.53) (-4.43) (-3.96) (-1.96) (-4.51) (-1.26)
voiceandaccountability -0.07 -0.14 -0.22 0.90 0.82 0.20
(-0.38) (-0.72) (-1.04) (1.62) (1.44) (0.46)
relativeResource 6.38*** 6.31*** 6.13*** 8.15*** 8.15** 7.09***
(6.16) (5.76) (5.13) (4.50) (2.24) (3.01)
_cons -431.06*** -410.10*** -408.39*** -346.89 -523.45** -785.89***
(-3.99) (-3.71) (-3.18) (-1.40) (-2.14) (-3.17)
Obs. 4008 4008 4008 4008 4008 4008
Log likelihood -853686 -828167 -762960 -116992 -78543 -81040
Adj. R² 0.108 0.097 0.069 0.032 0.126 0.068
ACCEPTED MANUSCRIPT

ACC
EPTE
D M
ANU
SCR
IPT
25
t statistics in parentheses * p < 0.10, ** p < 0.05, *** p < 0.01
Finally, we consider institutional preferences in the non-resource sector. Table 15 reveals no strong
preference or aversion to any particular component of the governance indicators. Especially, for the
index of rule of law, its coefficient becomes positive for local SOE and non-state companies, rather
than significantly negative. This suggests that the observed preferences of SOEs in the full sample that
includes resources reflects the characteristics peculiar to resource investment, rather than
characteristics peculiar to state ownership.
Table 15 Regression results summary for detailed governance indicators, non-resource sectors
(1) (2) (3) (4) (5) (6)
All
(Value)
All State
(Value)
Central
SASAC
(Value)
Central
Finance
(Value)
Local SOE
(Value)
Non-state
(Value)
controlofcorruption -0.66** -0.60 -0.66 0.03 -1.06 -0.79
(-2.05) (-1.40) (-0.76) (0.05) (-1.57) (-1.50)
governmenteffectiveness -0.80 -1.59** -1.52** -2.29* -0.59 1.29
(-1.34) (-2.53) (-2.10) (-1.89) (-0.50) (1.12)
politicalstability -0.22 -0.38 -0.51 0.39 -0.80** 0.04
(-1.13) (-1.53) (-1.37) (0.81) (-2.09) (0.15)
regulatoryquality 0.95** 1.39** 0.29 3.87*** 0.24 0.02
(2.05) (2.48) (0.68) (3.43) (0.25) (0.03)
ruleoflaw 1.14*** 1.05* 1.29 -0.17 1.42* 1.25**
(2.73) (1.96) (1.30) (-0.25) (1.70) (2.17)
voiceandaccountability -0.38 -0.27 -0.08 -0.77 0.57* -0.66
(-1.31) (-0.72) (-0.11) (-1.20) (1.65) (-1.29)
relativeResource -2.58 -3.74** -6.33** -0.04 -2.59 -0.92
(-1.56) (-2.08) (-2.03) (-0.01) (-1.13) (-0.25)
_cons -
616.42***
-657.10*** -702.41*** -608.80*** -876.34*** -540.41***
(-6.32) (-5.35) (-2.80) (-2.81) (-4.11) (-3.13)
Obs. 18036 18036 18036 18036 18036 18036
Log likelihood -694462 -531558 -205315 -259058 -193376 -274534
Adj. R² 0.162 0.059 0.016 0.068 0.028 0.173
t statistics in parentheses * p < 0.10, ** p < 0.05, *** p < 0.01
4. Conclusion Using representative and reliable data on large-scale Chinese investment classified with detailed
ownership information, we show significant differences in drivers of Chinese resource and non-
resource investment. Earlier findings concerning state-ownership reflected the concentration of
central-state ownership in the resources sector, and private investment in other sectors, rather than
different preferences between ownership types. In particular, we note that local SOEs are closer in
character to non-state enterprises than they are to central SOEs, suggesting that care needs to be
taken in empirical studies to determine the nature of state ownership.
Resource investors are not indifferent to host country’s governance situation. We show that resource
investors have a preference for political stability, and non-corrupt host countries, but are nevertheless
prepared to work in weak rule of law areas.
Our overall finding is that sectoral composition between resources and non-resources rather than
ownership differences drive’s China’s large scale investment abroad. As the sector composition
continues to change from resources toward non-resource sectors, we would expect to see overall
ACCEPTED MANUSCRIPT

ACC
EPTE
D M
ANU
SCR
IPT
26
Chinese investment, whether private or state-owned, tend toward more ‘normal’ behaviour rather
than be ‘looking for trouble’.
Appendix 1 – Correlation between explanatory variables
Explanatory variables in basic regression.
| instit~n relati~e lngdpc~t lngdpp~a gdpgro~h hightech lndistw im_exc~a ex_imp~t gdpgro~1 year
-------------+----------------------------------------------------------------------------------------------------
institution | 1.0000
relativeRe~e | -0.3885 1.0000
lngdpcurrent | 0.3165 0.0364 1.0000
lngdpperca~a | 0.8299 -0.1445 0.4967 1.0000
gdpgrowth | -0.2067 0.2226 -0.0264 -0.2104 1.0000
hightech | 0.2702 -0.0886 0.1734 0.2131 -0.0443 1.0000
lndistw | -0.0390 -0.0711 -0.2274 -0.0701 -0.1099 -0.2314 1.0000
im_exchina | -0.0825 0.1174 -0.0519 -0.1153 0.0713 0.1154 -0.3044 1.0000
ex_import | 0.3003 -0.0871 -0.1075 0.2840 0.0087 0.1852 -0.2682 0.3423 1.0000
gdpgrowthc~1 | 0.0010 0.0432 -0.0662 -0.0221 0.2306 0.0232 0.0000 -0.1389 -0.0183 1.0000
year | -0.0013 -0.0215 0.1251 0.0449 -0.1782 -0.0206 0.0000 0.2202 0.0507 -0.6427 1.0000
World Governance Indicator Subindices
| lngdpp~a instit~n contro~n govern~s politi~y regula~y ruleof~w voicea~y
-------------+------------------------------------------------------------------------
lngdpperca~a | 1.0000
institution | 0.8214 1.0000
controlofc~n | 0.7888 0.9528 1.0000
government~s | 0.8342 0.9539 0.9301 1.0000
politicals~y | 0.6464 0.8078 0.7264 0.6693 1.0000
regulatory~y | 0.7953 0.9282 0.8622 0.9307 0.6231 1.0000
ruleoflaw | 0.8072 0.9747 0.9418 0.9394 0.7605 0.8999 1.0000
voiceandac~y | 0.6347 0.8679 0.7636 0.7635 0.6522 0.7777 0.8040 1.0000
An anonymous reviewer raised concerns about the potential for multicollinearity amongst our
dependent variables. For the regression with institution and GDP per capita, the multicollinearity
problem is not severe: the VIF statistics are less than 5 and thereby acceptable by conventional
standard, especially given the large number of our observations. For the regression with all sub-indices
of institution, the VIF are more than 10. This can be a sign of severe multicollinearity. However, that
does not mean our results and the explanations of the results are wrong. The main concern raised by
multicollinearity is that it increases the standard errors of the coefficients. This in turn means that
coefficients for some independent variables may be found not to be significantly different from zero.
In other words, by overinflating the standard errors, some variables appear to be statistically
ACCEPTED MANUSCRIPT

ACC
EPTE
D M
ANU
SCR
IPT
27
insignificant when they are in fact significant. Without multicollinearity (and thus, with lower standard
errors), those coefficients might be significant. Therefore, in our regression the degree of confidence
of coefficients with high significance are not violated by multicollinearity. When these sub-indices are
included in the regression individual, each is very significant. But this causes the omitted variable
problem, which would introduce even more severe bias into our analysis. For these reasons, our
preferred approach is a careful explanation of our results: we only confirm the role of sub-indices with
significant coefficients, rather than refuse the role of sub-indices with insignificance coefficients.
ACCEPTED MANUSCRIPT

ACC
EPTE
D M
ANU
SCR
IPT
28
Subsample regression for countries with above-median (>= -0.24) institutional quality
(1) (2) (3) (4) (5) (6)
All
(Value)
All State
(Value)
Central SASAC
(Value)
Central Finance
(Value)
Local SOE
(Value)
Non-state
(Value)
institution 1.008*** 1.005*** 1.174** 0.852* 0.763 0.987***
(3.05) (2.58) (2.15) (1.67) (1.39) (2.62)
relativeResource 3.082*** 3.354*** 4.178*** 1.779 -0.135 1.819
(2.71) (2.79) (2.74) (0.76) (-0.07) (0.83)
lngdpcurrent 0.756*** 0.716*** 0.706*** 0.909*** 0.541*** 0.841***
(11.15) (9.31) (6.26) (7.83) (5.41) (6.57)
lngdppercapita -0.441** -0.460** -0.558* -0.482 -0.113 -0.235
(-2.12) (-1.97) (-1.80) (-1.22) (-0.32) (-0.68)
gdpgrowth 0.00725 -0.0179 -0.0346 -0.0690 0.123* 0.102
(0.20) (-0.43) (-0.59) (-1.29) (1.86) (1.46)
hightech 0.0201** 0.0165 -0.00394 0.0322 0.0350*** 0.0356***
(2.30) (1.52) (-0.19) (1.47) (3.46) (2.77)
lndistw 0.585*** 0.604*** 0.705*** 0.790*** 0.158 0.660***
(4.39) (3.75) (2.99) (3.45) (0.54) (3.68)
im_exchina 1.895*** 1.789*** 1.824* 0.997 1.482* 2.338**
(3.11) (2.63) (1.78) (0.66) (1.95) (2.06)
ex_import -0.00447* -0.00527 -0.00411 -0.00303 -0.00845** -0.00363
(-1.65) (-1.44) (-0.68) (-0.54) (-2.29) (-0.88)
gdpgrowthchina1 0.209** 0.261*** 0.297** 0.287*** 0.0200 -0.128
(2.49) (2.98) (2.24) (2.91) (0.13) (-0.91)
year 0.304*** 0.289*** 0.279*** 0.265*** 0.330*** 0.295***
(6.18) (5.36) (3.51) (3.33) (3.55) (3.49)
_cons -631.4*** -601.3*** -580.8*** -562.3*** -676.9*** -618.2***
(-6.37) (-5.53) (-3.64) (-3.47) (-3.61) (-3.63)
N 12221 12221 12221 12221 12221 12221
R2 0.074 0.031 0.009 0.045 0.018 0.162
t statistics in parentheses
* p < 0.10, ** p < 0.05, *** p < 0.01
Subsample regression for countries with below-median (WGI < -0.24) institutional quality
(1) (2) (3) (4) (5) (6)
ACCEPTED MANUSCRIPT

ACC
EPTE
D M
ANU
SCR
IPT
29
All
(Value)
All State
(Value)
Central SASAC
(Value)
Central Finance
(Value)
Local SOE
(Value)
Non-state
(Value)
institution 0.941*** 0.790** 0.815** 0.530 0.145 2.196***
(2.74) (2.19) (2.06) (0.52) (0.21) (3.34)
relativeResource 3.777*** 3.862*** 4.363*** 0.699 -1.514 3.750
(3.51) (3.25) (3.20) (0.23) (-0.50) (1.60)
lngdpcurrent 0.615*** 0.558*** 0.518*** 0.815** 0.833*** 0.830***
(6.41) (5.26) (4.43) (2.56) (3.57) (5.64)
lngdppercapita -0.358* -0.268 -0.292 0.609 -0.438 -0.838***
(-1.87) (-1.25) (-1.24) (1.17) (-0.97) (-2.89)
gdpgrowth -0.0258 -0.0262 -0.0365 0.0514 0.0706 -0.0610
(-1.04) (-1.02) (-1.36) (1.15) (0.96) (-1.05)
hightech 0.0125* 0.0129* 0.0155* -0.00418 -0.0238 0.0118
(1.86) (1.70) (1.90) (-0.25) (-1.21) (1.32)
lndistw 0.312 0.330 0.380 -0.874 0.954 0.286
(0.87) (0.85) (0.88) (-0.77) (1.15) (0.51)
im_exchina 1.425*** 1.424*** 1.445*** 1.189 1.696*** 1.745***
(4.43) (3.98) (3.34) (1.40) (3.19) (3.63)
ex_import -0.0137** -0.0166** -0.0200** -0.00521 -0.000849 -0.00384
(-2.33) (-2.34) (-2.24) (-0.49) (-0.08) (-0.48)
gdpgrowthchina1 -0.0290 -0.0216 -0.0134 -0.197 0.163 0.0729
(-0.25) (-0.17) (-0.10) (-1.48) (0.73) (0.42)
year 0.0928 0.0781 0.0764 -0.0322 0.288 0.363**
(1.62) (1.32) (1.17) (-0.49) (1.48) (2.37)
_cons -198.0* -168.0 -163.8 49.43 -607.0 -746.6**
(-1.71) (-1.41) (-1.24) (0.37) (-1.57) (-2.42)
N 9823 9823 9823 9823 9823 9823
R2 0.017 0.013 0.010 0.016 0.004 0.019
t statistics in parentheses * p < 0.10, ** p < 0.05, *** p < 0.01
Appendix 2 – On the choices of proxy for destination country resources China’s top three destinations for foreign investment, both Australia and Canada are extremely
abundant in natural resources, and have attracted a large amount of Chinese foreign investment:
95.3 per cent of Chinese investment in Canada is related to resources, while 82.5 per cent of Chinese
investment in Australia is resource related. However, because both countries’ level of economic
development is relatively high, other economic sectors are also very advanced and so the relative
share of natural resources relative to the overall economy is not high.
ACCEPTED MANUSCRIPT
ACC
EPTE
D M
ANU
SCR
IPT
30
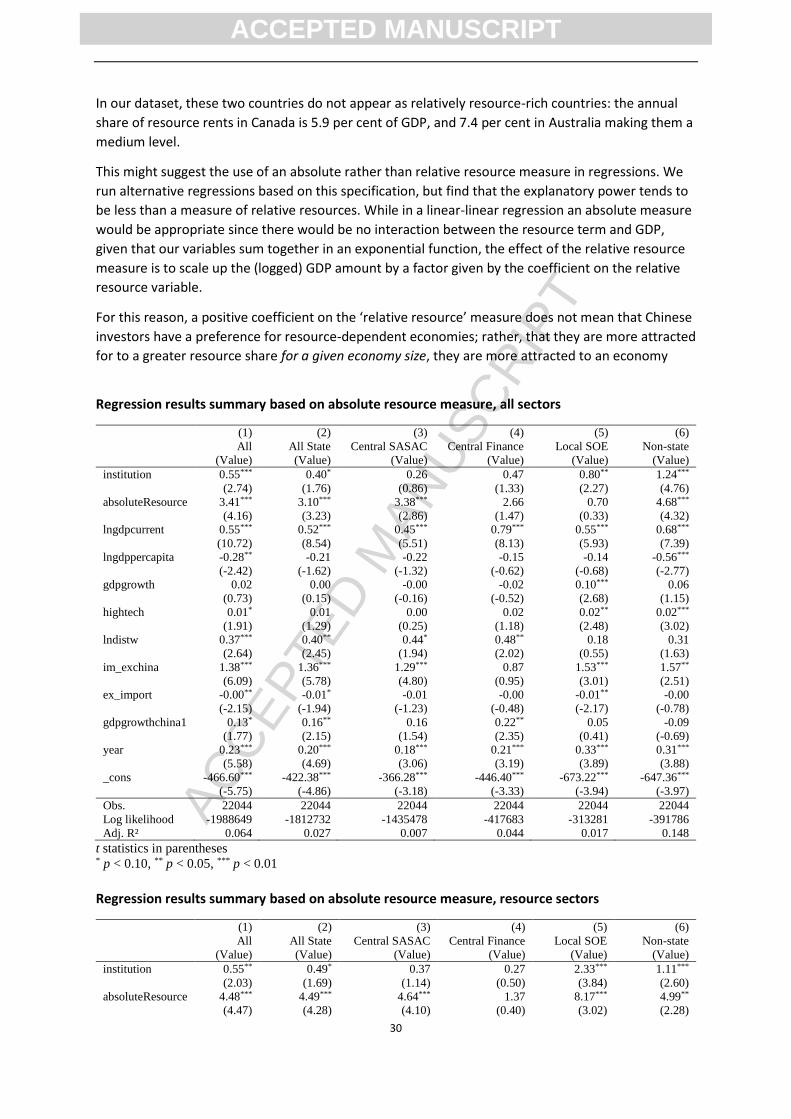
In our dataset, these two countries do not appear as relatively resource-rich countries: the annual
share of resource rents in Canada is 5.9 per cent of GDP, and 7.4 per cent in Australia making them a
medium level.
This might suggest the use of an absolute rather than relative resource measure in regressions. We
run alternative regressions based on this specification, but find that the explanatory power tends to
be less than a measure of relative resources. While in a linear-linear regression an absolute measure
would be appropriate since there would be no interaction between the resource term and GDP,
given that our variables sum together in an exponential function, the effect of the relative resource
measure is to scale up the (logged) GDP amount by a factor given by the coefficient on the relative
resource variable.
For this reason, a positive coefficient on the ‘relative resource’ measure does not mean that Chinese
investors have a preference for resource-dependent economies; rather, that they are more attracted
for to a greater resource share for a given economy size, they are more attracted to an economy
Regression results summary based on absolute resource measure, all sectors
(1) (2) (3) (4) (5) (6)
All
(Value)
All State
(Value)
Central SASAC
(Value)
Central Finance
(Value)
Local SOE
(Value)
Non-state
(Value)
institution 0.55*** 0.40* 0.26 0.47 0.80** 1.24***
(2.74) (1.76) (0.86) (1.33) (2.27) (4.76)
absoluteResource 3.41*** 3.10*** 3.38*** 2.66 0.70 4.68***
(4.16) (3.23) (2.86) (1.47) (0.33) (4.32)
lngdpcurrent 0.55*** 0.52*** 0.45*** 0.79*** 0.55*** 0.68***
(10.72) (8.54) (5.51) (8.13) (5.93) (7.39)
lngdppercapita -0.28** -0.21 -0.22 -0.15 -0.14 -0.56***
(-2.42) (-1.62) (-1.32) (-0.62) (-0.68) (-2.77)
gdpgrowth 0.02 0.00 -0.00 -0.02 0.10*** 0.06
(0.73) (0.15) (-0.16) (-0.52) (2.68) (1.15)
hightech 0.01* 0.01 0.00 0.02 0.02** 0.02***
(1.91) (1.29) (0.25) (1.18) (2.48) (3.02)
lndistw 0.37*** 0.40** 0.44* 0.48** 0.18 0.31
(2.64) (2.45) (1.94) (2.02) (0.55) (1.63)
im_exchina 1.38*** 1.36*** 1.29*** 0.87 1.53*** 1.57**
(6.09) (5.78) (4.80) (0.95) (3.01) (2.51)
ex_import -0.00** -0.01* -0.01 -0.00 -0.01** -0.00
(-2.15) (-1.94) (-1.23) (-0.48) (-2.17) (-0.78)
gdpgrowthchina1 0.13* 0.16** 0.16 0.22** 0.05 -0.09
(1.77) (2.15) (1.54) (2.35) (0.41) (-0.69)
year 0.23*** 0.20*** 0.18*** 0.21*** 0.33*** 0.31***
(5.58) (4.69) (3.06) (3.19) (3.89) (3.88)
_cons -466.60*** -422.38*** -366.28*** -446.40*** -673.22*** -647.36***
(-5.75) (-4.86) (-3.18) (-3.33) (-3.94) (-3.97)
Obs. 22044 22044 22044 22044 22044 22044
Log likelihood -1988649 -1812732 -1435478 -417683 -313281 -391786
Adj. R² 0.064 0.027 0.007 0.044 0.017 0.148
t statistics in parentheses * p < 0.10, ** p < 0.05, *** p < 0.01
Regression results summary based on absolute resource measure, resource sectors
(1) (2) (3) (4) (5) (6)
All
(Value)
All State
(Value)
Central SASAC
(Value)
Central Finance
(Value)
Local SOE
(Value)
Non-state
(Value)
institution 0.55** 0.49* 0.37 0.27 2.33*** 1.11***
(2.03) (1.69) (1.14) (0.50) (3.84) (2.60)
absoluteResource 4.48*** 4.49*** 4.64*** 1.37 8.17*** 4.99**
(4.47) (4.28) (4.10) (0.40) (3.02) (2.28)
ACCEPTED MANUSCRIPT

ACC
EPTE
D M
ANU
SCR
IPT
31
lngdpcurrent 0.43*** 0.43*** 0.43*** 0.54*** 0.28** 0.40**
(5.44) (5.18) (4.76) (3.31) (2.30) (2.55)
lngdppercapita -0.34** -0.30* -0.32* 0.08 -0.68*** -0.67**
(-2.33) (-1.94) (-1.87) (0.24) (-3.34) (-2.09)
gdpgrowth 0.01 0.00 0.00 -0.04 0.04 0.10**
(0.35) (0.03) (0.08) (-0.66) (0.66) (2.55)
hightech 0.00 0.00 0.01 -0.01 -0.06 0.00
(0.21) (0.18) (0.50) (-0.39) (-0.91) (0.33)
lndistw 0.37* 0.45** 0.54** 0.30 -0.17 -0.17
(1.78) (1.99) (2.02) (0.90) (-0.46) (-0.43)
im_exchina 1.57*** 1.51*** 1.34*** 1.91*** 2.66*** 1.96***
(6.01) (5.63) (4.48) (4.56) (4.91) (4.49)
ex_import -0.01* -0.01 -0.01 -0.02** -0.03* -0.02***
(-1.65) (-1.43) (-0.98) (-2.20) (-1.91) (-3.18)
gdpgrowthchina1 0.15* 0.15* 0.15 0.22 0.14 0.10
(1.67) (1.68) (1.36) (1.42) (0.86) (0.68)
year 0.17*** 0.16*** 0.15** 0.13 0.19* 0.39***
(3.34) (2.99) (2.52) (1.23) (1.66) (3.13)
_cons -353.55*** -325.42*** -321.51*** -283.70 -388.98 -791.77***
(-3.43) (-3.09) (-2.62) (-1.27) (-1.64) (-3.14)
Obs. 4008 4008 4008 4008 4008 4008
Log likelihood -939302 -912423 -835175 -131035 -84289 -90912
Adj. R² 0.057 0.045 0.029 0.023 0.100 0.084
t statistics in parentheses * p < 0.10, ** p < 0.05, *** p < 0.01
Regression results summary based on absolute resource measure, non-resource sectors
(1) (2) (3) (4) (5) (6)
All
(Value)
All State
(Value)
Central SASAC
(Value)
Central Finance
(Value)
Local SOE
(Value)
Non-state
(Value)
institution 0.31 -0.05 -0.60 0.63 -0.06 1.09***
(1.16) (-0.14) (-1.11) (1.31) (-0.16) (3.26)
absoluteResource 1.47 -0.28 -7.07* 3.21 -3.83 4.27***
(1.21) (-0.16) (-1.65) (1.50) (-1.47) (3.30)
lngdpcurrent 0.78*** 0.77*** 0.70*** 0.92*** 0.73*** 0.77***
(11.17) (8.92) (3.40) (8.22) (6.00) (6.95)
lngdppercapita -0.01 0.15 0.51 -0.29 0.20 -0.34
(-0.04) (0.65) (1.25) (-0.90) (0.71) (-1.35)
gdpgrowth 0.03 0.02 -0.03 -0.01 0.13*** 0.03
(0.93) (0.54) (-1.14) (-0.27) (3.77) (0.34)
hightech 0.03*** 0.03*** -0.02 0.03 0.04*** 0.03***
(3.52) (2.74) (-0.95) (1.49) (4.60) (2.79)
lndistw 0.31** 0.34* 0.20 0.48 0.24 0.40*
(2.08) (1.73) (0.92) (1.36) (0.58) (1.78)
im_exchina 0.26 -0.14 0.77 -0.64 -0.77 0.71
(0.44) (-0.17) (0.78) (-0.45) (-0.48) (0.90)
ex_import 0.00 -0.00 -0.00 0.00 -0.00 0.00
(0.09) (-0.33) (-0.84) (0.63) (-0.49) (0.48)
gdpgrowthchina1 0.10 0.19** 0.26 0.23** 0.02 -0.13
(1.09) (1.99) (1.10) (2.11) (0.12) (-0.80)
year 0.33*** 0.33*** 0.37** 0.26*** 0.45*** 0.31***
(6.26) (5.27) (2.54) (3.20) (4.02) (2.95)
_cons -676.98*** -695.83*** -774.18*** -560.94*** -928.97*** -645.16***
(-6.43) (-5.42) (-2.58) (-3.35) (-4.11) (-3.05)
Obs. 18036 18036 18036 18036 18036 18036
Log likelihood -709567 -551588 -210951 -270763 -199940 -276403
Adj. R² 0.159 0.052 0.014 0.052 0.022 0.170
t statistics in parentheses * p < 0.10, ** p < 0.05, *** p < 0.01
Following the advice of an anonymous reviewer, we also check robustness by adopting alternative
proxies for resources and technology, namely the share of fuel and mineral in the total export and
ACCEPTED MANUSCRIPT

ACC
EPTE
D M
ANU
SCR
IPT
32
R&D expenditure (% of GDP) respectively. The new regression results reveal that our poisson (ppml)
model is robust for different proxies’ setting. The downside of these alternative proxies is that, due to
data availability, around one third of total observations is lost.
(1) (2) (3) (4) (5) (6)
value_all value_soe value_sasac value_finance value_local value_private
institution 0.539** 0.476* 0.501 0.814** 0.568 0.955***
(2.56) (1.91) (1.51) (2.33) (1.49) (4.34)
ore_metal_fuel 0.0212*** 0.0228*** 0.0269*** 0.0192*** 0.0118 0.0113**
(5.97) (5.55) (5.15) (3.16) (1.37) (2.45)
lngdpcurrent 0.761*** 0.708*** 0.634*** 1.215*** 0.569*** 0.920***
(13.59) (10.27) (6.23) (7.60) (6.03) (9.46)
lngdppercapita -0.407*** -0.336** -0.379* -0.265 -0.343 -0.688***
(-3.00) (-2.16) (-1.92) (-1.06) (-1.45) (-3.07)
gdpgrowth 0.00744 -0.0106 -0.0251 -0.0473 0.0931** 0.0791
(0.32) (-0.42) (-0.85) (-1.10) (2.57) (1.60)
randdexpenditure 0.298** 0.250 0.185 -0.354 0.652** 0.441**
(2.23) (1.57) (0.87) (-1.29) (2.52) (2.24)
lndistw 0.557*** 0.583*** 0.576** 0.392 0.501* 0.605***
(3.74) (3.22) (2.18) (1.33) (1.78) (2.88)
im_exchina 1.377*** 1.325*** 1.213** -0.0679 1.584*** 1.746***
(4.16) (3.61) (2.53) (-0.05) (3.75) (2.70)
ex_import -0.00132 -0.00278 -0.00388 0.00215 -0.00349 0.00103
(-0.57) (-0.82) (-0.62) (0.40) (-1.17) (0.32)
gdpgrowthchina1 0.112 0.147* 0.138 0.218** 0.0458 -0.107
(1.55) (1.94) (1.29) (2.36) (0.38) (-0.85)
year 0.186*** 0.163*** 0.135** 0.173** 0.296*** 0.271***
ACCEPTED MANUSCRIPT

ACC
EPTE
D M
ANU
SCR
IPT
33
(4.43) (3.57) (2.19) (2.49) (3.36) (3.33)
_cons -393.9*** -347.7*** -288.6** -382.7*** -613.2*** -568.2***
(-4.66) (-3.78) (-2.34) (-2.73) (-3.44) (-3.47)
N 15312 15312 15312 15312 15312 15312
R2 0.071 0.034 0.013 0.041 0.019 0.148
References Amighini, Alessia A., Roberta Rabellotti, and Marco Sanfilippo. 2013. “Do Chinese State-Owned and
Private Enterprises Differ in Their Internationalization Strategies?” China Economic Review 27. Elsevier Inc.: 312–25. doi:10.1016/j.chieco.2013.02.003.
Bhaumik, Sumon Kumar, and Catherine Yap Co. 2011. “China’s Economic Cooperation Related Investment: An Investigation of Its Direction and Some Implications for Outward Investment.” China Economic Review 22 (1): 75–87. doi:10.1016/j.chieco.2010.09.002.
Buckley, PJ, LJ Clegg, and AR Cross. 2007. “The Determinants of Chinese Outward Foreign Direct Investment.” Journal of International Business Studies 38 (4): 499–518. doi:10.1057/palgrave.jibs.8400277.
———. 2009. “The Determinants of Chinese Outward Foreign Direct Investment (Erratum).” Journal of International Business Studies 40 (4): 353–54. doi:10.1057/palgrave.jibs.8400277.
Cheng, Leonard K., and Zihui Ma. 2010. “China’s Outward Foreign Direct Investment.” In China’s Growing Role in World Trade, edited by Robert Feenstra and Shangjin Wei, 545–78. University of Chicago Press. doi:10.1093/jiel/jgv045.
Cheung, Yin-wong, Jakob De Haan, and Xingwang Qian. 2011. “China’s Outwide Direct Investment in Africa.” 13. 2011. https://www.researchgate.net/profile/Shu_Yu/publication/228119646_Chinas_Outward_Direct_Investment_in_Africa/links/004635167d21a89e05000000.pdf.
Cheung, Yin Wong, and Xingwang Qian. 2009. “Empirics of China’s Outward Direct Investment.” Pacific Economic Review 14 (3): 312–41. doi:10.1111/j.1468-0106.2009.00451.x.
Child, J. and Rodrigues, S. B. 2005. “The Internationalization of Chinese Firms: A Case for Theoretical Extension?” Management and Organization Review 1 (3): 381–410. doi:10.1111/j.1740-8784.2005.0020a.x.
Deng, Yongheng, Randall Morck, Jing Wu, and Bernard Yeung. 2015. “Monetary and Fiscal Stimuli, Ownership Structure, and China’s Housing Market.” Review of Finance, 16871, . doi:10.1513/pats.201104-033MS.
Dollar, David. 2016. “China as a Global Investor.” 4. Order from Chaos. Asia Working Group. http://www.brookings.edu/~/media/research/files/papers/2016/05/china-as-a-global-investor-dollar/china-as-a-global-investor_asia-working-paper-4.pdf.
Duanmu, Jing Lin. 2012. “Firm Heterogeneity and Location Choice of Chinese Multinational Enterprises (MNEs).” Journal of World Business 47 (1). Elsevier Inc.: 64–72. doi:10.1016/j.jwb.2010.10.021.
ACCEPTED MANUSCRIPT

ACC
EPTE
D M
ANU
SCR
IPT
34
Greene, William. 2004. “The Behaviour of the Maximum Likelihood Estimator of Limited Dependent Variable Models in the Presence of Fixed Effects.” Econometrics Journal 7: 98–119. doi:10.1111/j.1368-423X.2004.00123.x.
Helpman, Elhanan, Marc Melitz, and Yona Rubinstein. 2008. “Estimating Trade Flows: Trading Partners and Trading Volumes.” The Quarterly Journal of Economics 123 (2): 441–87. doi:10.1162/qjec.2008.123.2.441.
Hubbard, Paul. 2016a. “Reconciling China’s Official Statistics on State Ownership and Contr.” 120. EABER Working Paper Series. http://www.eaber.org/node/25575.
———. 2016b. “Where Have China’s State Monopolies Gone?” China Economic Journal, 9 (1): 75–99. doi:10.1080/17538963.2016.1138695.
Hurst, Luke. 2011. “Comparative Analysis of the Determinants of China’s State-Owned Outward Direct Investment in OECD and Non-OECD Countries.” China and World Economy 19 (4): 74–91. doi:10.1111/j.1749-124X.2011.01251.x.
Kolstad, Ivar, and Arne Wiig. 2012. “What Determines Chinese Outward FDI?” Journal of World Business 47 (1): 26–34. doi:10.1016/j.jwb.2010.10.017.
Li, Ming Hua, Lin Cui, and Jiangyong Lu. 2014. “Varieties in State Capitalism: Outward FDI Strategies of Central and Local State-Owned Enterprises from Emerging Economy Countries.” Journal of International Business Studies 45 (8): 980–1004. doi:10.1057/jibs.2014.14.
Li, Quan, and Guoyong Liang. 2012. “Political Relations and Chinese Outbound Direct Investment : Evidence from Firm- and Dyad-Level Tests Political Relations and Chinese Outbound Direct Investment : Evidence from Firm- and Dyad-Level Tests” 47405 (February).
Liao, Wei, and Kevin K Tsui. 2012. “China’s Outward Direct Investment: Evidence from a New Micro Dataset.” 17. http://papers.ssrn.com/sol3/papers.cfm?abstract_id=2087385.
Neyman, J., and Elizabeth L. Scott. 1948. “Consistent Estimates Based on Partially Consistent Observations.” Econometrica 16 (1): 1–32. doi:http://www.jstor.org/stable/1914288.
Pradhan, Jaya Prakash. 2009. “Emerging Multinationals from India and China: Origin, Impetus and Growth.” SSRN Electronic Journal, 1–32. doi:10.2139/ssrn.1515676.
Quer, Diego, Enrique Claver, and Laura Rienda. 2012. “Political Risk, Cultural Distance, and Outward Foreign Direct Investment: Empirical Evidence from Large Chinese Firms.” Asia Pacific Journal of Management 29 (4): 1089–1104. doi:10.1007/s10490-011-9247-7.
Ramasamy, Bala, Matthew Yeung, and Sylvie Laforet. 2012. “China’s Outward Foreign Direct Investment: Location Choice and Firm Ownership.” Journal of World Business 47 (1): 17–25. doi:10.1016/j.jwb.2010.10.016.
Rosen, Daniel H., and Thilo Hanemann. 2009. “Chinas Changing OFDI Profile: Drivers and Policy Implication.” Peterson Institue, no. June: 21.
Sanfilippo, Marco. 2010. “Chinese FDI to Africa: What Is the Nexus with Foreign Economic Cooperation?” African Development Review 22 (SUPPL. 1): 599–614. doi:10.1111/j.1467-8268.2010.00261.x.
Scissors, Derek. 2014. “China Invests (Somewhat) More in the World.” Asian Outlook. http://www.aei.org/wp-content/uploads/2014/01/-china-invests-somewhat-more-in-the-world_151254764847.pdf.
ACCEPTED MANUSCRIPT

ACC
EPTE
D M
ANU
SCR
IPT
35
Silva, J.M.C. Santos, and Silvana Tenreyro. 2006. “The Log of Gravity.” The Review of Economics and Statistics 88 (November): 641–58. doi:10.1162/rest.88.4.641.
Tan, Xiaomei. 2013. “China’s Overseas Investment in the Energy/resources Sector: Its Scale, Drivers, Challenges and Implications.” Energy Economics 36. Elsevier B.V.: 750–58. doi:10.1016/j.eneco.2012.11.019.
Wan, Kam Ming, and Ka fu Wong. 2009. “Economic Impact of Political Barriers to Cross-Border Acquisitions: An Empirical Study of CNOOC’s Unsuccessful Takeover of Unocal.” Journal of Corporate Finance 15 (4). Elsevier B.V.: 447–68. doi:10.1016/j.jcorpfin.2009.03.004.
Wang, Yongqin, Julan Du, and Kai Wang. 2015. “The Determinants of Location Choices of China ’ S ODI : Institutions , Taxation and Resources” 10 (3): 540–65. doi:10.3868/s060-004-015-0024-6.
Xinhua. 2015. “SOE Overseas Assets Surge.” China Daily, Europe, June 19. http://europe.chinadaily.com.cn/business/2015-06/19/content_21055661.htm.
Yeung, Henry Wai-chung, and Weidong Liu. 2008. “Globalizing China: The Rise of Mainland Firms in the Global Economy.” Eurasian Geography and Economics 49 (1): 57–86. doi:10.2747/1539-7216.49.1.57.
Zhu, Leiyin. 2012. “DETERMINANTS OF ODI FROM CHINA AND OTHER EMERGING ECONOMIES : EVIDENCE FROM NEW MIRO-LEVEL DATASET.” Clemson University. http://tigerprints.clemson.edu/cgi/viewcontent.cgi?article=2448&context=all_theses.
ACCEPTED MANUSCRIPT

ACC
EPTE
D M
ANU
SCR
IPT
36
Highlights
1. The major problems in the literature stemming from wide-spread data deficiencies in data. Specifically, the reliability of previous research results has been limited by data sets that do not identify the final destination for Chinese investment, nor suitably differentiate between different ownership types.
2. The distribution of Chinese ODI is extremely uneven: 90 per cent of Chinese ODI came from 2 per cent of China’s officially approved overseas projects. Therefore, data representativeness and reliability are very important.
3. Chinese SOE investment in resources, regardless of ownership type is attracted to countries with political stability, but is negatively related to the rule of law measure. For non-resource investment, we find no strong institutional preferences.
4. Previous findings of different investment motivations between state- and non-state investors likely reflects the dominance of state-ownership in resource sectors, rather than different investment behaviour based on ownership
ACCEPTED MANUSCRIPT