note night in america - 2018 note market predictions
TRANSCRIPT


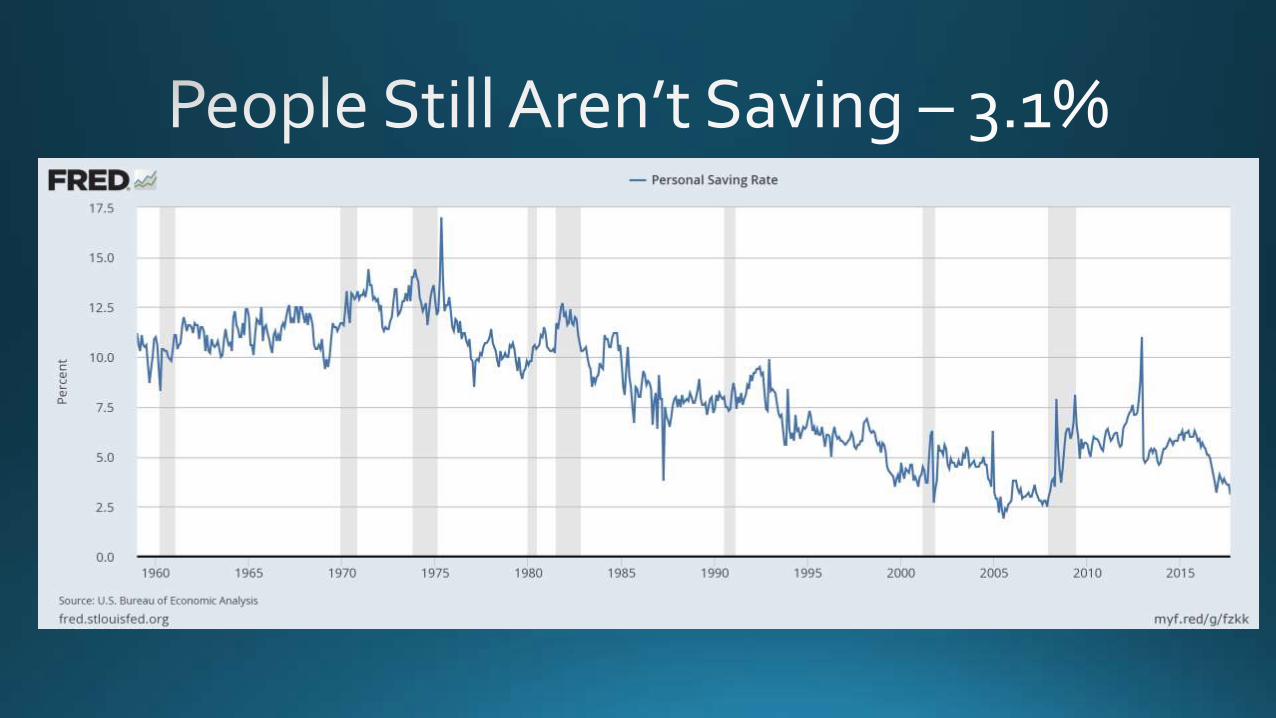
2018 Market Predictions


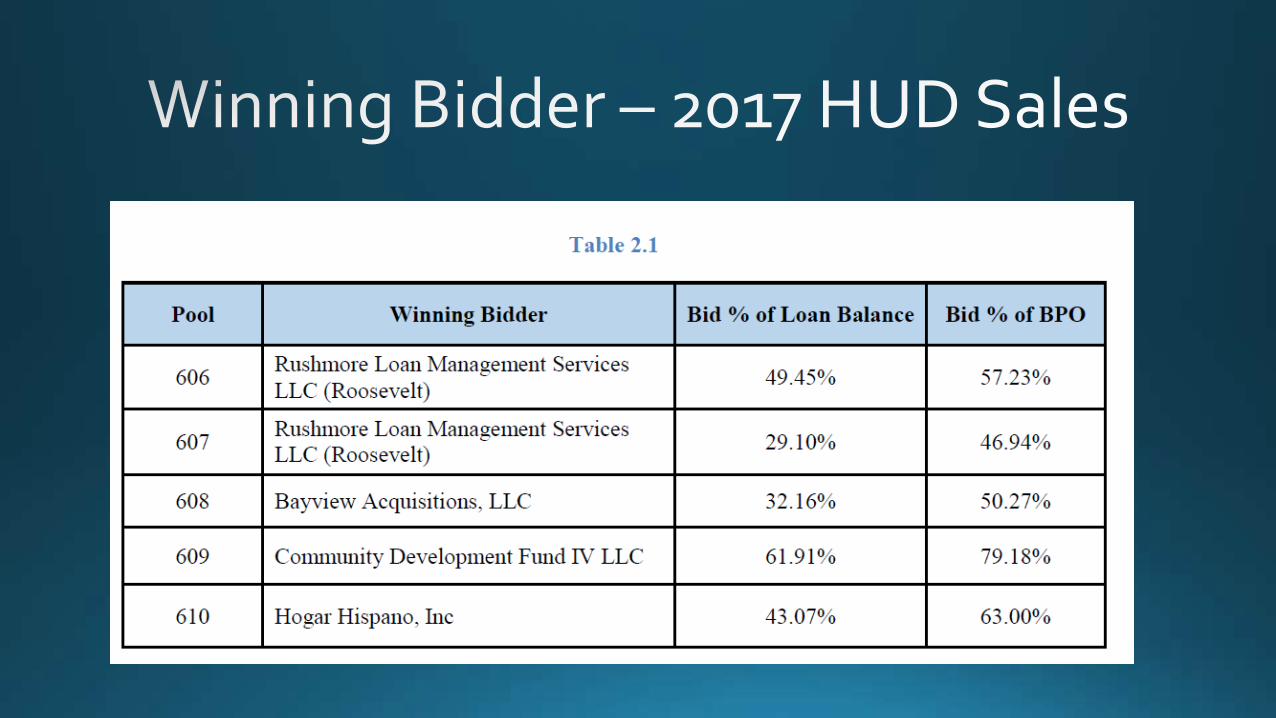
March 2017 HUD Report

EXHIBIT 2: DASP NATIONAL OFFERINGS
Sale Name Sale Date Loan Count Approximate UPB Number of Pools
DISTRESSED ASSET STABILIZATION PROGRAM - NATIONAL
SFLS 2012-3 9/12/2012 3,257 $599,380,589 6 SFLS 2013-1 3/20/2013 10,405 $1,867,712,416 10 SFLS 2013-2 6/26/2013 13,177 $2,033,081,967 14
SFLS 2014-1 (Part 1 & 2) 10/30/2013 & 12/17/2013 17,201 $3,029,135,481 23 SFLS 2014-2 (Part 1 & 2) 6/11/2014 & 9/30/2014 27,527 $4,536,417,833 26
SFLS 2015-1 7/16/2015 4,282 $661,793,348 5 SFLS 2016-1 11/18/2015 3,157 $427,588,142 5 SFLS 2016-2 9/14/2016 3,528 $560,266,376 7
DASP National Total 82,534 $13,715,376,151 96
March 2017 HUD Report

Category Count Percentage of Loans SoldPercentage of Resolved
Loans
RESOLVED
Foreclosure Avoided
Total Re-Performing 11,107 12.81% 16.53%
Re-Performing with Loan Modification 10,353 11.94% 15.40%
Re-Performing - Other 754 0.87% 1.12%
Forbearance 224 0.26% 0.33%
Paid in Full/Short Payoff 1,147 1.32% 1.71%
Short Sale 8,599 9.92% 12.79%
Deed-in-Lieu 7,555 8.71% 11.24%
Total Foreclosure Avoided 28,632 33.03% 42.60%
Foreclosure 36,711 42.34% 54.62%
Held For Rental 1,870 2.16% 2.78%
Total Resolved Outcomes 67,213 77.53% 100.00%
NOT YET RESOLVED
Delinquent Servicing 19,483 22.47%
Total Loans Sold 86,696 100.00%
EXHIBIT 10: LOAN STATUS OUTCOMES – DASP PORTFOLIO

Sale Name Sale Description Sale Date Loan Count Approximate UPBNumber of
Pools
DASP NEIGHBORHOOD STABILIZATION OUTCOME
SFLS 2012-3 NSO - Chicago, Newark, Phoenix, Tampa 9/27/2012 2,860 $554,477,501 7
SFLS 2013-1 NSO - Atlanta, Ohio, Orlando, Florida, California 03/27/2013 3,284 $522,807,467 5
SFLS 2013-2 NSO - California, Ohio, North Carolina, Chicago 07/10/2013 3,158 $492,220,506 6
SFLS 2014-1NSO - Atlanta, California, Las Vegas, Indianapolis, Baltimore, Prince
George County, Other12/19/2013 3,179 $655,600,127 7
SFLS 2014-2, Part 1NSO - Atlanta, Chicago, Cumberland County, Detroit, Miami,
Philadelphia, San Antonio, San Bernardino6/25/2014 3,319 $543,176,203 10
SFLS 2014-2 Part 2 NSO- Baltimore, New York, Texas, Florida, California, Philadelphia 11/19/2014 3,517 $662,116,329 15
SFLS 2015-1NSO- NJ Northern, NY Nassau Suffolk, Chicago, Baltimore,
PA,DE,MD7/16/2015 1,498 $342,938,149 7
SFLS 2016-1NSO - FL, NY, NJ, IL, IN, OH, PA, AL, GA, NC, TN, AZ, CO, ID, NM,
NV, UT, CA, OR, WA, CT, ME, NH, RI, IA, KY, MO, LA, OK, TX, MI, MN, WI
11/18/2015 2,630 $472,434,740 18
SFLS 2016-2NSO: AL, AR, AZ, CA, CO, DE, FL, GA, IA, ID, IL, IN, KS, KY, LA, MD, MI, MN, MO, MS, NC, ND, NE, NJ, NM, NV, NY, OH, OK, OR, PA, SC,
SD, TN, TX, VA, WA, WI9/14/2016 2,885 $482,923,164 8
DASP NSO Total NSO 26,330 $4,728,694,187 83
TOTAL National and NSO (all DASP Sales) 108,864 $18,440,070,338 179
EXHIBIT 3: DASP NSO OFFERINGSNotes: 1. This report only includes DASP transactions, which began with SFLS 2012-3. Data on all pre-DASP sales has been removed since the Purchasers have completed their required post-sale reporting.2. The total number of loans captured in this report, 108,864, is up from 104,258, despite the exclusion of pre-DASP sales. This is primarily due to the inclusion of 2016-2 loans.3. Data as of January 24, 2017.

16.0%
15.5%
17.4%
16.7%
10.8%
8.0%
8.7%
4.9%
2.0%
Decrease by 50% or more
Decrease by 40% - 50%
Decrease by 30% - 40%
Decrease by 20% -30%
Decrease by 10% -20%
Decrease by less than 10%
Increase
Unchanged
Unknown
Exhibit 4: LOAN MODIFICATION PAYMENT CHANGE( % OF MODIFIED LOANS)
For SFLS 2012-3 through SFLS 2016-1 approximately 16% of the loans were modifiedby the Purchasers. Approximately 31% of the modified loans had a payment decreaseof 40% or more. Over 66% of the modified loans had a payment decrease of 20% ormore.

37%
18%
1%
4%
32%
7%
29%
62%
60%
73%
61%
6%
Forgiveness of Principal
Deferment of Principal (Non-Interest Bearing)
Deferment of Principal (Interest Bearing)
Forgiveness of Interest
Deferment of Interest (Non-Interest Bearing)
Forgiveness of Other Indebtedness
Deferment of Other Indebtedness (Non-Interest Bearing)
Capitalization of Interest
Capitalization of Other Indebtedness
Rate Reduction
Term Extension
Other/ Unknown
EXHIBIT 5: MODIFICATION TYPE - FREQUENCY OF OCCURANCE( % OF MODIFIED LOANS)
For SFLS 2012-3 through SFLS 2016-1 approximately 16% of the loans were modified by the Purchasers.Most loans had multiple modification features. By far the most common modification feature was a RateReduction, used for 73% of the loans modified. Capitalization of Interest, Capitalization of OtherIndebtedness and Term Extensions were also common modification types, and they were each used forapproximately 60% - 62% of the loans modified.

Based on data from HUD’s Conveyance (REO) Program, in judicial foreclosure states the average time to foreclosure was approximately 10 months longer than in non-judicial foreclosure states. Thus, holding period times and holding costs are greater in the states where a majority of the loans sold are located

Notes: The Exhibit above includes loans from SFLS 2012-3 through SFLS 2016-2. Data as of January 24, 2017.

DASP National Pools
Purchaser Count UPB Percentage of Total
Bayview Asset Management 18,544 $3,221,675,530 22%
Lone Star Funds 18,000 $3,098,159,180 22%
Angelo, Gordon & Co., L.P. 6,633 $1,061,677,583 8%
Selene Residential Partners 6,388 $1,025,041,890 8%
RBS Financial Products Inc 5,489 $955,634,250 7%
Kondaur Capital Corporation 3,515 $492,995,539 4%
Neuberger Berman - PRMF 3,167 $603,911,167 4%
One William Street Capital Management 2,853 $460,318,259 3%
OHA Newbury Ventures, LLC/MCM 2,618 $412,873,223 3%
Varde Management, L.P / V Mortgage, LLC 2,445 $365,089,267 3%
Credit Suisse /DLJ Mortgage Capital 2,214 $314,153,812 3%
Altisource Residential Corporation 1,966 $307,418,583 2%
Rushmore Loan Management Service LLC 1,944 $296,440,521 2%
25 Capital Partners 1,895 $332,455,256 2%
PIMCO/LVS 1,536 $231,653,890 2%
Others 3,327 $535,878,202 4%
National Total 82,534 $13,715,376,151 100%
EXHIBIT 9: DASP PURCHASERS

NSO Pools
Purchaser Count UPB Percentage of Total
Bayview Asset Management 12,752 $2,398,422,539 48%
Oaktree Capital Management/DC Residential 4,762 $806,158,977 18%
The Corona Group 3,191 $654,331,071 12%
25 Capital Partners 2,339 $399,774,588 9%
Pretium Mortgage Credit Management, LLC 1092 $150,253,336 4%
MRF (Non-profit) 970 $131,414,729 4%
Kondaur Capital Corporation 549 $66,933,715 2%
Community Loan Fund of New Jersey, Inc. (Non-profit) 352 $76,321,821 1%
Hogar Hispano, Inc (Non-profit) 162 $27,155,687 1%
Altisource Residential Corporation 135 $15,210,744 1%
AMIP Management, LLC 26 $2,716,978 0%
NSO Total 26,330 4,728,694,187 100%
Overall Total 108,864 18,444,070,338 100%


2013 Loans 1,580,664
2014 Loans 1,083,089
2015 Loans 3,710,361
2016 Loans 4,401,616
2017 Loans 5,470,000*
Total 5 Year Loans 16,245,730
4% Default Rate 649,829