note: this is a reference cited in ap 42, compilation of air … · · 2015-09-10the primary...
TRANSCRIPT


Summary &.Descr ip t ion Pages
SOURCE TEST
SUMMARY OF EMISSIONS TO ATMOSPHERE Report No. 87-07
Report Date
Test Date 4 / 7 / 8 7 Name of p lan t ACME Concrete Co., I ~ c ,
Locat ion o f p lan t Richland, Washington
Person contacted
Type of operat ion Asphalt Batch Plant
Source tested Main Stack
Request in9 Agency Benton-Frank1 in-Walla Walla Air ~ollution Control ~uthority
Purpose Measure particulate for compliance
App 1 i cable Standard BFWWAPACA Regs.
SUMMARY OF MEASUREMENTS
TEST ENGINEER Alan T. Butler, P . E . r
FIELD PERSONNEL LAB ANALY S I S --- - -
Alan T. Butler Susan Davis
Met hods
Ecology , Method 5
1
Pol lu tan t
Particulate
Tom Harris Keith Solberg
Test Witnessed by:
ECY 020-1-62 Rev. 1/79 .
Emission/Process Factor
0.59 lb/ton
Measured h i s s ion
0 .639 gr/~sCF
106.4 lb/hr
A1 lowable Emission
0.04 gr/DSCF

Source Test 87-07 ACHE CONCRETE CO. Richland Report Date: 04/30/87 Test Date: 04/07/87
Page 2
This test was performed at the request of the Benton- Franklin-Walla Walla Air Pollution Control Authority for the purpose of measuring particulate emissions from the main stack of the ACHE Concrete, Richland asphalt batch plant during normal operation, Results will be used in the determination of compliance with Benton- Franklin-Walla Walla Air Pollution Control Authority regulations.
11. pescri~tion of the Unit Tested
The ACME Concrete, Richland asphalt batch plant is located near the I-82/I-182 interchange just outside of Richland, Washington. The unit tested is a Cedar Rapids model number 8830 ADMPR, serial number 39323.
Aggregate is heated in a no.2 diesel-fired rotary drum, which measures approximately 30 feet long by 88 inches in diameter. Asphalt is added at a point approximately midway along the length of the drum. A slat conveyor transports the asphalt mix to a hopper, where it is loaded into trucks for transportation to the job site.
The plant capacity is 300 tons of asphalt hot-mix per hour. On the day of our test the facility was being operated at a rate of 180 tons per hour, with occasional periods of downtime due to the number of available trucks and conditions at the paving site. The aggregate used during our test contained approximately 4.0 percent moisture and 5.0 percent silt (material passing a 200 mesh sieve), with 5.2 percent asphalt added to the dried aggregate, Temperature of the hotmix was 290 degrees F at the drum outlet chute. Fan speed was a nominal 1257 rpm, as calculated from the sheave diameters and a fan amperage of 76.0. The fan value was taken from instruments in the control room.
The scrubber is a variable-throat venturi type, with a cyclonic demister/particle separator before the stack fan. The scrubber was using once-through, non-recycled water at the time of our test, with no settling pond. ACME personnel had rinsed out the scrubber after the

Source Test 87-07 ACME CONCRETE CO. Richland Report Date: 04/30/87 Test Date: 04/07/87
Page 3
facility was shut down on the previous day. They also moved the venturi throat walls inward so as to increase the venturi pressure drop. Position of the inner venturi throat is set manually, usually only when the process is down. This is done by turning the adjustment nuts on threaded struts which pass through sealed openings in the rectangular scrubber duct to the movable venturi throat walls.
111. Test Procedure
Three Washington State Department of Ecology Method 5 particulate samples were collected, using a 12-point, two port traverse. Concurrent with each particulate sample, a Method 3 gas sample was collected, for quantification of stack 0 , CO , and dry gas molecular weight. Phil Cooke took aisua3 plume readings during test run 2.
Pressure and temperature readings were taken just upstream and downstream of the scrubber venturi:
~ressure, Temperature, in. H,O dea: F
Upst ream - 1.8 325 P - 115 Difference 17.2
Throughout the test we noted presence of a mud fallout from the stack plume.
IV. Results
Test results are detailed in Table 1. Particulate emissions averaged 0.639 grains per dry standard cubic foot of stack effluent, or 106.4 pounds of particulate per hour of operation.
High stack particulate concentrations were shown by mud fall-out in the general vicinity downwind of the stack, as well as test results that are significantly over the emission standard of 0.04 gr/dscf. Effluent moisture content is normally calculated by two independent means in scrubber-controlled stack tests: by moisture condensed in the sampling train back half, and by assuming saturation at the average stack temperature.

Source T e s t 87-07 ACME CONCRETE CO. Richland Report Date: 04/30/87 T e s t Date: 04/07/87
Page 4
Whenever t h e condensa t ion t echn ique g i v e s a h i g h e r number t han t h e s a t u r a t i o n t echn ique , e n t r a i n e d wate r i n t h e g a s s t ream is i n d i c a t e d . It is p o s s i b l e t h a t t h e d e r n i s t e r / p a r t i c l e s e p a r a t o r s e c t i o n of t h e c o n t r o l d e v i c e is n o t f u n c t i o n i n g adequa te ly , t he reby a l l owing c o l l e c t e d p a r t i c u l a t e s t o become r e e n t r a i n e d i n t o t h e g a s s t ream.

TABLE 1 HETHOD 5 RESULTS SUHHARY
_-_-_----------_----------------------------------------------------------------------
P l a f i t Name ACnE C o n c r e t e C o . A d d r e s s 5 1 3 H. T h i e r r a n C o u n t y Ben t o n
NEDS C i t y R i c h l a n d S t a t e U ASH Z i p c o d e
I n d u s t r y Type A s p h a i t B a t c h P l a e t P r o c e s s T e s t e d SCC U n i t C a p a c i t y 300 t a r r l h r F u e l Type Type o f C o n t r o l Equ ipmen t V e n t / s c r u T e s t e d a t I n l e t O u t l e t X
Reason Tes ted : Spec. S t u d y - - - - C o n p l i a n c e w! Fed. - S t a t e - L o c a l X O t h e r - P e r s o n n e l P r e s e n t A1 a n T . B u t l e r , Ton H a r r i s
P o l l u t a n t Measured P A R T I C U L A T E Method C
S t a c k H e i g h t , f t 30.00 Area , sq f t 13.10 D i a m e t e r s Downstream A p p r o r . 1 Ups t ream 5 f
T e s t No. 97-07
Hun Number 1 2 7 j
D a t e : No-Day-Yr. 07 -Ap r -87 37-Apr -87 07 -Ap r -87 O p e r a t i n g R a t e , t o n / h r a s h p a l t 180 1 Er? 1 BC-! Gas C o m p o s i t i o n % C02 4.50 4.20 4 - 2 0
Y, 02 15.30 15.40 15.43 Z N2 80.20 60 .40 80 .40 X O t h e r 0.90 0.00 0, Q!] % H20 1:. 94 13.45 13.3C:
E s t i ~ a t e d Y a l e W t . , k e t 27.89 27.91 -8 -I , I . 9 3
Execess A i r , % 260.52 264.35 264.35
6a5 F l o w D a t a 6as P r e s s u r e , i n . Hg. 29.83 29.83 29.83 6as Tempe ra tu re , F 126.92 125.58 125.17 Ave. S t a c k V e l , AFPS 30. 10 34.13 33.01 F l o w R a t e , SCFH Dry 17,979 2C.386 19,718
Sample I n f o r m a t i o n Va l uwe Samp! ed, SDCF 44.75 46.15 47.85 Sample D u r a t i o n , M i n . 60.0 60 .0 60.0 N o z z l e D i a . , i n . 0.313 g.3!3 (r. 313 I s o k i n e t i c R a t e , % 100.4 94. E 97 .2
R e s u l t s PORTICOLATE F r o n t H a i f Conc . , Gr!SDCF 9.531 0.553 0 .833 Conc., Gr!SDCF 7% 02 1.327 1.407 2 . 1 2 1 Conc., Sr/SDCF 12% CE2 1.415 1.579 2.38Q E ~ i s s i o n R a t e , l b / H r 81 .8 9 6 . 6 140.8 E m i s s i o n F a c t o r , I b / t o n 0.45 0.54 0 . 7 ~
4 Ave rage


HETHOD 5 CALCULATIONS Data Input
---------------------------------------------------*--*--------------------------------------------------------
P lan t ACRE Concretr Co. P i t a t Fact 0.7840 Soapling Locat ion Nain Stack Nozzle I D 0.3125 inches Sarple Type P a r t i c u l a t e H20 Height 197.00 Run Wurber 1 Orsat COZ 4.50 02 15.30 Bar Pressure 29.83 P a r t i c u l a t e Weight S t a t i c Pressure 0.0 Llash F i l t e r Inp ingers S t a c k D i a 49.00 Area 13.10 I.D. No. 11- 129 Length Width F i n a l 0.0000 0.8527
Tare 0.0000 0.7400 Dperat ing Rate 110 ton /hr Gair! 1.4266 0.1127 Sarp le Tine 60.00 !!in
Tenperature Paint Re: P Del H Stack f leter Start Val 2,177.31
1 B.? 26.1 125 55 F i n a l Yo1 2,222.99 ? - 5.0 !5.0 125 6! 3 3.5 10.5 126 54 !!oistureFract:on 0.1394 4 10.5 31.5 126 69 !ole Xelght 29.4924 C 14.0 44.2 127 74 Fo 1.24 6 14.0 44.2 127 75 Stack F!on Wet, ac!n 23,651 7 3.5 11.1 129 78 9 4.5 14.2 13C b t ? 3.5 11.1 !30 b? I0 6.0 25.3 129 7? 1 1 14.0 44.3 125 79 12 16.0 50. b 124 84 13 14 ! 5 16 ! 7 18 19 20
s c r t l d p l Vel


RETHOD 5 CALCULRTlONS Data input
Plant ACNE Concrete Co. P i t o t Fact 0.7840 Sampling Location Hain Stack Nozzle ID 0.3125 inches Sarple Type Part iculate H20 Yeight 224.20 Run Number 2 OrsatCOZ 4.20 02 15.40 Bar Pressure 29.83 Part iculate Yei ght S ta t ic Pressure Mash Fi l te r lrpingers Stack Dia 49.00 Area 13.10 D- 13 Lenq t h Width 8.00 Final 0.0000 0.9933
Tare 0.0000 0.7468 Operating Rate 180 ton/hr 6ai n 1.4778 0.2165 Sarple Time 60.00 Nin
Terperature sqrt tdpl Vel Point ?el P De! H Stack fteter S ta r t Vol 2,223.20
1 7.5 24.2 125 69 Final Yo; 2,273.49 0.55 30.54 2 5.0 16.1 126 72 0. 42 24.95 3 5.0 16.1 125 76 Roisture fract ion 0.1345 0.45 24.93 4 13.0 41.9 120 E! nole Height 29.4488 0.72 40.24 5 15.0 48.4 120 BE Fo 1.31 0.77 43.22 6 16.0 51.6 125 91 Stack Flow Yet, acfr 26,818 0.80 44.60 7 5,O 14.1 123 EO 0.45 ?4.89 8 5.0 16.1 126 86 0.45 24.95 9 5.5 17.9 127 85 0.47 26.19
10 9.5 31.0 126 87 0. b! 34.40 11 16.0 52.2 126 92 0. E9 44.64 12 17.0 55.5 126 97 0.82 46.C1 13 14 15 16 17 18 19 20
h e r age

TEST NO.
D A E
llETllOD b PARTICULATE SAWLYI A mnD R L m 1
5 5 .7g4 0
PLANT PROBE LENGTH, TY
SAMPLING LOCATION NOZZLE I.D.
SAMPLE TYPE ASSUMED MOIST U
RUN NUMBER OPERATOR x- SAMPLE BOX NUMBER RL AMBIENT TEMPERATURE *, 260-Zml WATER m u ~ E C T ~ ~ ~ & - & $ ~ o
BAROMETRIC PRESSURE ORSAT CO,
STATIC PRESSURE 4 -2- 15. PARnCUUTL WKWn
STACK DIAMETER Ares tt2 WASH FILTER (IIpIII(IcIZI
I.D. NO.
FINAL
TARE
GAIN

ETHOD 5 CALCULllT 1 DNS Data Input
_________________^_---------------------------------------------------------------------------------------------
P lant ACHE Concrete Co. P i t o t Fact 0.7840 Sa lp l i ng Locat ion Hain Stark Nozzle I D 0.3125 inches Sample Type P a r t i c u l a t e H20 Weight 260.20 Run Nurber 3 OrsatCO2 4.20 02 15.40 Bar Pressure 29.83 P a r t i c u l a t e Wei ght S t a t i c Pressure Wash F i l t e r Iepingers Stack Dia 49.00 k e a 13. 10 0-12 Length Width F i n a l 0.0000 0.9879
Tare 0.0000 0.7445 Operating Rate 180 t o n l h r 6a i n 2.3404 0.2434 Saaple T i r e 60.00 !in
Temperature s q r t l d p ! Vel Point Del P De! H Stack Heter S t a r t Vo! 2,273.75
t 9.0 29.4 125 74 Final VoI 2,324.09 0.60 33.45 2 5.0 15.7 130 80 0.45 25.04 7 5.0 10.4 124 82 n c i s t u r e F rac t i on 0.1330 0.45 24.91 4 7.5 24.7 125 87 !!oleWeight 29.4498 0.55 30.54 5 16.5 54.3 123 93 Fo 1.31 0.81 45.22 0 13.5 46.2 124 97 Stack Flow Wet, acfm 25,939 0.?3 40.93 7 5.0 !?.: 1 79 0.45 24.83 8 5.0 !? ,I 126 BZ 0.45 24.95 9 5.0 17.1 127 86 0.45 24-98 ! b 9.0 30.8 125 90 0.60 33.48 I 1 14.5 40.4 126 94 0.76 42.50 12 16.5 55.1 126 99 0.81 45.33 ! 3 14 15 16 17 ! 8 19 20
Average
STATE OF WASHINGTON DEPARRiMT OF ECOLOCI
SOURCE TEST CAWLATIONS
APPENDIX-B CALCULATIONS T e s t F?-Q7 U W ~ \
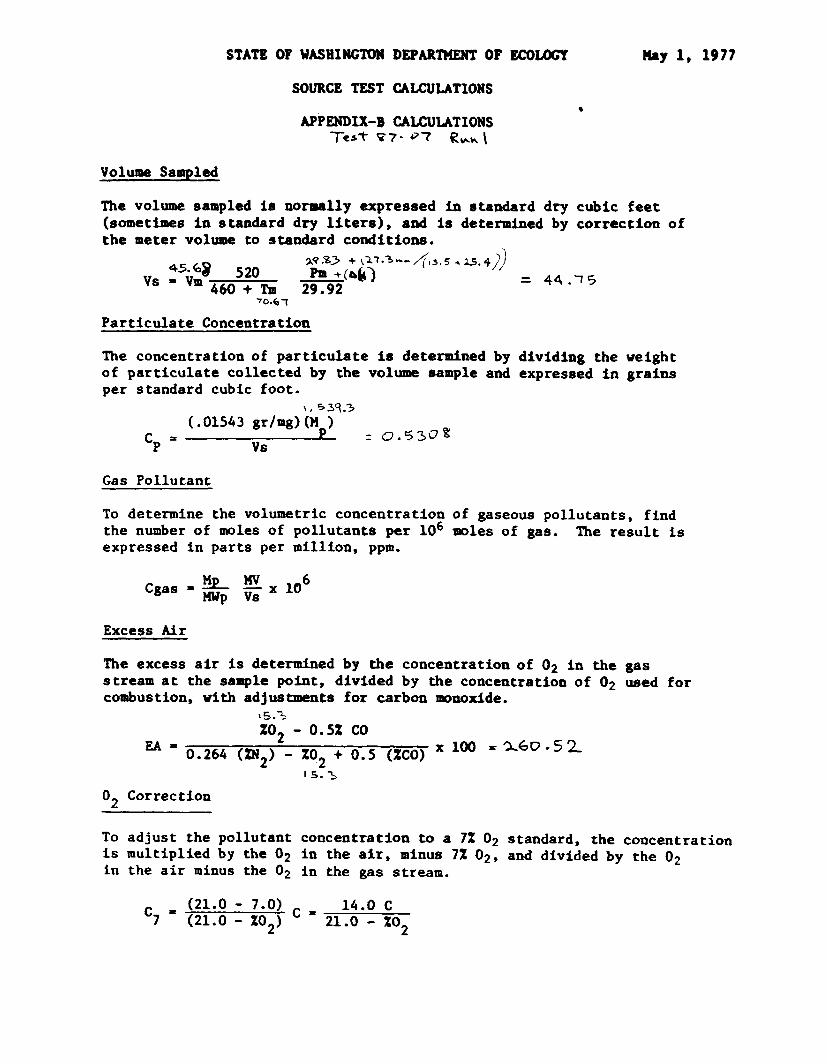
Volume Sampled
The volume sampled is normally expressed i n standard dry cubic f e e t (sometimes i n standard dry l i t e r s ) , and is determined by cor rec t ion of t h e meter volume to standard conditions.
P a r t i c u l a t e Concentration
The concentration of p a r t i c u l a t e is determined by dividing the weight of p a r t i c u l a t e co l lec ted by the volume sample and expressed i n g ra ins per standard cubic foot.
1 , 539.3 ( .01543 gr/mg) (I4
C~ = = Q . 5 3 O g
Vs
Gas Pol lu tan t
To determine the volumetric concentrat ion of gaseous po l lu tan ts , f ind the number of moles of po l lu t an t s per lo6 moles of gas. The r e s u l t is expressed i n p a r t s per mil l ion, ppm.
Excess M r
The excess a i r is determined by the concentration of O2 i n the gas stream a t the sample point, divided by the concentration of O2 used f o r combustion, with adjustments f o r carbon monoxide.
15.3
XO, - 0.5% co EA = L
0.264 (INZ) - %02 + 0.5 (XCO) x 100 =%GO-52,
0 Correction 2
To ad jus t the pol lutant concentrat ion t o a 7% O2 standard, the concentration is mult ipl ied by the O2 i n the a i r , minus 7% 02, and divided by the O2 i n the a i r minus the O2 i n the gas stream.

Uoisture Hole Fraction
Condensation Xethod - The moisture mole f rac t ion 18 determined by dividing the volume of the v r t e r vapor co l lec ted by the t o t a l volume of the sample, including water vapor.
1 9 1 . 9 3
Saturat ion Method - By the sa tu ra t ion assumption method, the moisture mole fract ion is dividing the vapor pressure of water a t t h e s tack temperature by the absolute pressure of the stack gas. 16.4
Molecular Weight
The molecular weight of the stack gas is determined by summing the mole f rac t ion and the molecular weight of each constituent.
Dry Gas Basis - md = 44.0 (FCO*) + 32.0 (PO2) + 28.0 (FCO) +
Uet Basis - MU = MWd (1.00 - Fm) + 18.0 (Fm) = 27. 39 W
Average Stack Gas Velocity -
The average s tack gas velocity expressed in ac tua l f e e t per second is determined by : .7 9 4 ;.I
35.9% Fu q ~ + ? . ~ ) ( n h ; ) = 30.10 Val?= - v m " A
,L,, , , fiu.rbec of +ravecse Stack Gas Flow Rate, Actual
The average s tack gas flow ra t e is expressed in actual cubic feet per minute and found by multiplying the average stack gas velocity by the s tack area and 60.0.
, ,.fls4
Qd = Vave(Ad)60 = .23,651

Stack Cs+ Flow Rate, Standard
The stack gae flow rate under standard conditioo. $8 expressed aa standard dry cubic feet per minute, and obtained by adjusting the stack gas flow r a t e to atandard temperature and pressure and subtracting the volume of the water vapor.
Emis s ion Rate
Emission r a t e is calculated from the product of the concentration and the f l w ra te , and normally expressed In pounds per hour.
Par t icula te - .59%
Rp = CP (Qstd.)(60 Min/Hr) , S I , Q Q
7000 G r . /Lb. I!%
Rgas - Cgas (Qa td) (Wp) (60 Hin . ) (We) (Hr.1
Isokinet ic Rate
The isokinetic ra te r a t i o of the velocity of gas through the nozzle to the velocity of gas passed the nozzle and normally expressed as percent.
I26 , q + Ts) ,,, = t ~ ( - 4 3 4 1 - Fm) Vave 9
3o.r~ 6 3 -

C
C7 Cgas
CVS02
PCO, FCD2
Dcscr lptlon
Duct area
Wozzle Area, n Dn 2
U n l ts - Sq. Pt.
Sq. In.
Concentration of Pollutant . ppm or gr/SDCF
Correction factor 7% O2 ppm or gr/SDCF
Concentration of gaseous pollutant ppm, Vol.
Volume concentration of SO2 - PPm
Duct diameter
Nozzle diameter
it.
In.
Excess Air X
Hole or volume fraction of the particular gas
CO, C02 O2 N2
Dry stack gas density with air equal to 1.0
Mole fraction of water vapor in stack stack gas
Pi tot correct ion factor
Stack height above grade Pt.
Differential pressure on pitot In. R20
Average of &- (in H20) 4
Isokinet ic Rage
Mass of gaseous pollutant W'
Mass of particulate mg
Mass of SO2 Collected mg
Holar volume at standard conditions; 3 English Units = 379 ft /Ib-mole
Molar volume at standard conditions:
Metric Units = 23.69 &/g-mole

Edit SAS data set: SAS.AETES7 I Screen 1 ;---------- mmand ===>. : N ~ H 93 *
DsNo : C o M m N Y N w E : &cK-CAkLfet -,----
HEGIST3AT ION NO: ,,---
CApfic I Ty: 222 VOLTS: &8(4P
OURCE TEST T:
;CRUB WGTER GAL/ ;TACt::: TEMP: % OPACITY: ,,,, GRAIN/FTZ: ,,,- )RY AGGH: % H20: 5.0 % f 2CJO MESH: ~ . - ~ TEMP: B Q td ,XI* 4OT MIX : T IHR: % ASFH: 5-.-3=;- DGTE: =fiN RFM: &zl- F A N AMPS: x L g FUEL TYPE: 38%
REMARKS: -- ----- --------- --- DATE: --,--,
Edit SAS data s e t : SAS-AETEST Command === >
3 Screen 2 ;---------- : New 93
COMPLIANCE INSPECTION DATA CYCLONE INPUT P: ---- CYCLONE INPUT T: ---- CYCLONE OUTPUT P: CYCLONE OUTPUT T: SCRUB/BAGHOUSE P: ,,,- SCRUB/BAGHOUSE T: ,-,, TYPE:
SCRUB WATER GAL/MIM: ,-,, PONDITANK VOL (GAL) : ,,,, STACK: TEMP: ,,-, % OPACITY: ,,,, GRAIN/FT3: ,,,- DRY AGGH: %H20: % (200 HGSH: TEMP: ,,,, HOT M I X : T/HR: ---, XASPH: ,-,, DATE: -_-,,,,
F A N RPM: -,,, FAN AMPS: ,--, FUEL TYPE: -
REMARKS: _-,,,,,-------_----- --- ------- DATE: --,---

T H R O U G H WAS -% - ' ~ E R V E R ' S NAME (PRINT)
J
OSERVER'S SIGNATURE DATE
D l AO RAM:
E M t U l O N ?O(m
- DATE
TITLE

Identif icatloa of Sample Post Weight Pre-Weight
Mf f erence

EPA Region X Lab Management System *** Lab Analysis Report * * *
Transaction #: 04221409 Seq #: 01 (15) Solids - (WE) DOE,
Ptj: ACHE CONCRETE, RICHLAND I DOE-53lA 1 Par: solids Total mg (Part 500
--dl P:b.-ft Instrument: GRAV Gravimetric Measurement QL 7G'y Method: EP1-160.3 Residue, Total, Gravimetric, Dried at 103-105 ~ e ~ - & Chemist: (DKS) Solberg, Keith DOE Hours Worked: Lab Prep:( ) ~nspecifed Date Preprd: Date Anlyzd: 870413
Matrix: (10) Water-Total Units: (52) mg
Line Sample # Result Sample Location/Description #Days to An1 ~dm-ml._- ---- -------- ---- ----------- --------- ............................ 1 87 157244 1426.6 PROBE RINSE, RUN 1 boo 870408 ( 5 ) 2 87 157245 1477.8 PROBE RINSE, RUN 2 875 870408 ( 5 ) 3 87 157246 2340.4 PROBE RINSE, RUN 3 bso 870408 ( 5)
Record Type: TRNINZ Date Verified: Transaction Status: Edited Processed: 24-APR-87 16:10:43 Status: E Batch: (In CUR DB)