note: this is a reference cited in ap 42, compilation of … · pg= -0.15 in h20 mn(back) =...
TRANSCRIPT


Asphalt Inc on 711 4/92 P.O.#115 TEST #92196 SAN DlEGO AIR POLLUTION CONTROL DISTRICT, 9150 CHESAPEAKE DRIVE, SAN DIEGO, CA. 92123
SOURCE TEST OF PARTICULATE EMISSIONS TO THE ATMOSPHERE
TEST SITE: Asphalt I~c . 12560 Highway 67 & Slaughterhouse Canyon Lakeside, CA
TEST #: 92196 P.O.#: 1 15 TEST DATE: 711 4192
UNIT TESTED: Baghouse EQUIPMENT: Hot Mix Asphalt Plant
TESTED BY: David Shina, Guy Allphin, Rick Hower, & John Gervasi DATE: 711 4/92 SITE PERSONNEL: Jerry Richardson DATE: 7114192 APCD ENGINEER: Earnest Davis DATE: 7114192
LAB ANALYSIS BY: David Shina DATE: 7128192 REPORT BY: David Shina DATE: 7128192
APPROVED BY:
SDRPCD RULES
TEST RESULTS SUMMARV:
TEST RULE 54 DUST & FUMES
LIMIT 40 lbs/hr
ITEM UNITS VALUE
TEST PARAMETERS: SYSTEM D E S ~ I O N : This asphalt plant combines crushed rock and and sand with asphalt oil in batch loc~ds of varying sizes. The rock and sand are heated in a rotary drum to dry them. The exhaust from this dryer is routed through a baghouse and finaliy to a stack. It is the emissions from this stack that are the subject of this report. PROCmuREs; The procedures and equipment utilized in these tests are based on EPA New Source Performance Standards Method 5. The sampling train was modified to utilize a back-end fitter and 5th impinger filled with silica gel (fig. 1). as outlined by the SDAPCD QA manual.
All preliminary assumptions and calculations are based on data obtained from previous tests. All equations are from EPA 40 CFR, July 1, 1991. Part 60, Appendix A, Methods 1-5 inckrsive.
The test consisted of sampling at 32 traverse points. 4 from each of 8 sample ports (fig.21, colected from 18 inches below the stack (fig.3). All field data was transferred to the computer printout. AU calculations were done by the computer and the emissions were compared to rule 54 of the SDAPCD. PNACYSES:
Gus: An integrated bag sample was collected during the test and analyzed at the APCD lab. PartlcuCate: All procedures follow EPA guidelines, except where noted in the SDAPCD QA manual.
EQumam All testing and analysis equipment was calibrated according to EPA guidelines. Analysts: Coukction: SampCLq: Temp. /Press. :
C02-Anarad AR400 Filter-Gelman US Box-Napp Therrnocwples-Ornega 02-Teledyne Ryan 320 P4 Holder-Gelman Umbilical cord-Napp Read out-Omega Macrobalance-Sargent Welch Beakers-Pyrex ColdIHot box-Napp Barornetriccalc. by APCD Miaobalance-Sartorious Impingers-Ace Pitobe tube-Napp US box-Dwyer magnehelic
ver.3APCD P/M-ISOS 4/9/92 by DNS Printed: 8/21/92 @ 3:21 PM Page 1 of 3
Q s a dscfm 25146
MEASURED 23 lbs/hr
I %
107
--
PASS/FAIL ......................... ..,.,...,.... :.:...: ..................... :.:::.. ........................ 7 B ~ I + W ~ A N , C E
TYPE OF FUEL
Diesel
Cs
gr/dsd 0.1071
E lbs/hr
23.088
RATE tons/hr
238.40
LOAD tons
270.14

ver.3APCD PIM-ISOS 4/9/92 by DNS Printed: 8/21/92 @ 3:21 PM Page 2 of 3
, - Asphalt Inc on 7/14/92 P.0.#115 TEST #92196
Circular stack (Y/N) -
g c 0 2 = 4.00% Pg= -0.15 in H20 mn(back) = 0.189272 g 0 2 = 15.60 %
final leak rate = 0.000 cfrn PassIFail PASS
Vm 45.945 f t A 3
STACK PARAMETERS: Width = 2.250 f t
Length = 5.000 f t As = 11.25 f t A 2
VPW @ tS= 9.2000 in Hg Vpw @ ti= N/A in Hg
T I ME: 0 = 64.0 min
tn = 3 2 points 0 = 2.0 rninlpt
mn(total)= 0.296086 g CO = 0.00 % Vlc 171.83 rnl N2 = 80.40 %
TEMPERATURES: t l = 85.33 OF ti= 58 F t2- 11 1.83 OF tbox- 106 F tm= 98.58 OF t ~ = 158 F

Asphalt Inc on 711 4/92 TI ONS;
I t M Y t H H l U H t S :
P.O.#115 TEST #92196
13) Vm= Vmfendl -Vmlbe&l 45.945 f t A 3
MOLECULRR WEIGHT:
FBONT HALF rnn IfrontI
Dn= 0.226 in
ver.3APCD P/M-ISOS 4/9/92 by DNS Printed: 8/24/92 @ 11 :55 AM Page 3 of 3

Asphalt Inc on 711 4/92 P.O. #:I15 TEST#: 921 96
SAN DIEGO AIR POLLUTION CONTROL DISTRICT, 9150 CHESAPEAKE DRIVE, SAN DIEGO, CA 92123
PARTICULATE TEST LABORATORY ANALYSIS DATA SHEET TEST sm: Asphalt Inc.
12560 Highway 67 & Slaughterhouse Canyon Lakeside, CA
TEST #: 921 ! 36 P.O.#: 1 15 TEST DATE: 711 4192 LAB ANALYSIS BY: David N. Shina DATE: 7/28/92
LAB REPORT BY: David N. Shina DATE: 7128192 - -
REVIEWED BY: - - DATE:
FINAL WGT. INIT WGT. NET WGT. Was silica gel used (YIN) ?=TI I Total impinger c h a r g e = l b l
Total weight c o l l e c t e d = l g
a b c d e f g h i j LOCATION SOLVENT ID END WGT INIT. WGT WEIGHT RINSES SOLV. WGT WGT (corr) Totals { WGT (con)}
9 g (e-9 g ml (g+H) g (f-h) g (Zi) 9,
FRONT ACETONE 91 086 49.5625 49.5405 0.0220 575.00 0.003426 0.0185
FRONT WATER 91075 49.5003 49.41 14 0.0889 550.00 0.000660 0.0882
FRONT ORGANIC
FRONT FILTER N/A I
u
ver.2 APCD PIM-LAB 4/9/92 Printed: 7/28/92 at 1 :38 PM Page 1 of 1
A LOCATION
BLANK
BLANK
BLANK
BACK
BACK
BACK
BACK
0
B SOLVENT
ACETONE
WATER
MeC12
STANDAHDS
RCEmNE
WATER
ORGANIC
FILTER
H
g/ml (GID)
0.00000596
0.00000120
0.00001 040
K PASS FAIL
P
P
P
C ID
292
298
299
L LIMITS
0.0010%10ppm
0.0004%4ppm
0.0010%10ppm
91084
91065
91060
91104
I %
(H'100)
0.0005957
0.0001200
0.001 0400
J
ppm (H'lP6)
5.96
1.20
10.40
49.6144
49.5226
50.0337
1.6063
D END WGT
9
28.7773
29.1294
28.7056
E INITWGT
28.7759
29.1291
28.7030
F WEtGHT
g(E-F) g
0.00140
0.00030
0.00260
49.5764
49.4402
49.9567
1.6062
G RINSES
ml
235.00
250.00
250.00
0.0380
0.0824
0.0770
0.0001
575.00
550.00
375.00
NIA
0.003426
0.000903
0.003900
N/A
0.03457
0.08150
0.0731 0
0.00010

- OMENCLATURE (concl.)
symbol units explanation equation
Qs adm Qstd dscfm
flow rate vs*A0*60 dry volumetric stack gas flow rate, 17.~SQs(l-Bws)S(Ps/Ts)
S.L. none Sea Level read from a relief man
Vlc
Vm Vm' Vm std
Vpw& v p w w vs Vw std
water collected from impingers and the silica gel (if applicable)
sample gas volume, uncorrected sample gas volume, corrected volume of gas sample by the dry gas
meter,cor?.ected to STP vapor pressure of water at ts vapor pressure of water at ti stick 6 s velocity Vol. of water vapor in gas sample,
corrected to m
from lab analysis
read from dry gas meter Vm*Y ((Vm'*Tstd)Pm)/((PstdYTm)~om Vm)
see CRC water vapor press. tables see CRC water vapor press. tables 85.49%p(fls*AP) / (Ps*Ms))"OS (VlcC2RTstd)/(Pstd*MW H20)+corr Vwm
Conversion (multiply by the number)
0.002669 in Hg-ftA3/"R-ml 0.00857 lb/gr-rnin/hr 0.04707 ftA3 /ml 15.43 17.64 "R/in HZ0 85.49 (ft/sec)-(lb-in Hg/lb-
mo-OR-in H20))" 5 (divide by the number)
144 inA2/ftA2 13.6 in H2O/in Hg
(add to the number) 460 "R/"F
Factors
conversion to get in Hg-ftA3/R conv frum gr/min to lb/hr (60/7000) conversion from ml to ftA3 conversion from g to gr Tstd/Pstd (528/2992) conversion factor to get
velodty in ft/sec
conversion from in"2 to ftA2 conversion from in H20 to in Hg
conversion from F to R
see CRC see Lange's Handbook of Chemistry see Lange's Handbook of Chemistry see Lange's Handbook of Chemistry see Lange's Handbook of Chemistry seeCRc
see CRC see CRC
ver. 3 by DNS on 9/10/91 Page 2 of 2

- NOMENCLATURT
fractional stack gas moistureequ 1 ((Vw std)/(Vw std+Vm std))100 fractional stack gas moisture-equ 2 ((Vpw @ ts)/Ps)100
Bws 9i water vapor in the aas stream lo& of Bws(1) and Bws(2)
p .,&>,- ,:/, ,- 5 -+- -. a (density) lb /ml density of water at STP 5. :-.iv: <* - . Ds in or ft stack diameter
0.002201 (see CRC) measure at site
average differential pressure avg of the readings from the pressure across the orifice meter measuring device
dry stack gas molecular wgt
particulate in impingers particulate in nozzle & probe total particulate collected wet stack gas molecular wgt mo. wgt of carbon dioxide mo. wgt of nitrogen mo. wgt of oxygen
0.44(%C02)+0.320(%02)+0280 (%NZ+inerts+CO)
measurement from lab analysis measurement from lab analysis measurement from lab analysis Md(1-Bws)+l8.0(Bws) 44 (see periodic table) 28 (see periodic table) 32 (see periodic table)
MWH2O dmole mo. w& of water 18 (see periodic table)
percent oxygen m d from measuring device
? .
t? . '. . 4 ver. 3 by DNS on 9/10/91 Page 1 of 2


F i g u r e a L/

SAN DIEGO COUNTY AIR POLLUTION CONTRDL DISTRICT
Note : 2.1.3 Pitot tube should be
FIGURE
CONDENSER SYSTEM Back end filter
Integrated Bag Sample for COz, Ot
Thennometer s
Main Valve
Dry Gas Meter Vacuum Pump
LEGEND FIELD DATA ABBREVIATIONS
FT =Point Number No, 1 Mod- 100 MLDeionized Wntex T = S t a c k h eratuxe
No, 2 Std - 100 MLDeionized Water A p = Pitot Tube h cssure Diffezential; in Hz0 V5 =StadcVeloci%fpr
No, 3 Mod- Dry A H =Orifice Meter esrue Dro t 1 'MeterInlet Tempexatue,
No, 4 Mod- Dzy OF. in H20
t 2 = Meter Outlet Tern erature, O F ~n =hp vacuum, in Ag
Mod - Modified Type Greenburg-Smith t i = Impinger Temperature Std - Standard Type " Pbar = Bammetnc h r s m
FIGURF: : PARTICULATE MATTER SAMPLING TRAIN

Engineer: Earnest Davis Test: Particulate Matter P.O. no.: 00115
Mechanical Engineering Source Test Report
Permit Renewal Test
Test Date: 7/14/92 Source: Asphalt Inc. Highway 67/ Slaughterhouse Cyn Lakeside CA 92040
Test Start Time: 715 Test Stop Time: 8:45
Equipment Description: Hot-mix Asphalt Batch Plant
I. Asphalt Composition for 3 Ton Batch
Bin # Material AGI Sand&Dust(Fines) AG2 3/8" Rock AG3 I /2" Rock AG4 3/4" Rock MF1 Mineral Filler ACI - Oil AR4000 Total
3/8" Percentage - 2580 1b.s 43% 1380 23 % 1380 23 % 600 10% 60.0 1% 348.0- - 6000 lbs 100%
I1 Accumulative Asphalt Production Data
Note: the production "totals" are raw data obtained from Batch Plant Aggregate Procduction Computer Printout . The individual tonnage of each materical (i.e 3/8" rock, mineral filler etc.,) are theoretical weights based upon the actual overall production throughput using the theroectical composition percentages listed above.
Bin # - AGI AG2 AG3 AG4 MF1 AC1 Total
MATERIAL NAME TONS @ 7:22 Sand & Rock Dust (fines) 18.36 3/8" Rock 9.82 1/2" Rock 9.82 3 / 4 Rock 4.27 Mineral Filler 0.43 Asvhalt Oil AR4000 - 2.47
45.17
TONS @ 7:35 36.69 19.62 19.62 8.53 0.85 4.95 - 90.27
" The asphalt oil weight is not normally counted in the total batch weight

Bin # MATERIAL NAME AG1 Sand & Rock Dust (fines) AG2 318" Rock AG3 I /2" Rock AG4 314" Rock MFI Mineral Filler ACI - Asphalt Oil AR4000. Total
TONS @ 247 TONS @ 8fl7 Minimun Prod. Rate TPH 54.94 73.21 29.39 39.16 29.39 39.16 12.78 17.03 1.28 1.70 7.41 - - 9.88 135.18 180.15 134.911
Bin #
AGI AG2 AG3 AG4 MF1 ACI - Total
MATERIAL NAME TONS @ 8:19 TONS @ 8.30 Maximun Prod. Rate TPH Sand & Rock Dust (fines) 91.50 109.78 318" Rock 48.95 58.73 1/2" Rock 48.95 58.73 314" Rock 21.28 25.53 Mineral Filler 2.13 2.55 Asphalt Oil ARB000 - 12.34 14.81
225.15 270.14 245.40
-From 7:22 am to 8:30am 270.14 tons was produced. (270.14 tons)(60 minl hour)
Average Production Rate = (68 min) = 238.4 TPH
111 Operational Data
Material Temperature OF: 341 + 1°F directly from dryer ( this is not temperature in mixer) (set point=340°F)
Baghouse Pressure : 5 . 2 0.1 "H20 (magnehelic gauge) : 5.4 "H20, steady (manometer )
Fuel type: diesel
Fuel pressure: 30 psig
Production through dryer stopped momentarily to allow surge of asphalt in silos to decrease as asphalt was loaded from silos into trucks.

N Visible Emissions Data Visible emissions (% opacity):
Baghouse exhaust stack : 10% averageA Rotary aft dryer seal : 0% Rotary forward dryer seal : 10%- 15% ( generated intermittently) Truck drop area : 20% to 60% per drop ; blue smoke; less than 30 seconds duration per drop Drop area from mixer to conveyor: 20% to 60%; less than 30 minute duration) Conveyor (from mixer to silo): 10% to 40% ( not over 20% for over 3 minutes, steam mostly) Asphalt tank vent: 0% ( no asphalt unloading was witnessed).
A Maximum opacity witnessed was 602, just prior to start of test


-- . - , , METHO& 5 EQUIPMENT C H E C ~ ~ IST
/ DATE:
EQUIPMENT DATA SHEET

I h a r I I I S U ~ ~ N T S ;
PRETEST Mh)
POST-TEST I
+...'.'. '...'"..' ... . . . . . . . . . . . . . . . . . . . . . . . . . . . . . . . . . ............ i:..t:,l: ....... :.: ....... :.>:.:.:.:.:.:.; ..,:.:...:* ... >............. .................. :-.: ;.:.;.., ....<.....):........... ;....<< ........................................... :. .. ................................. ... :,.,:.:.:.>: ...:. :. .............................................................. ............................................................................. .,:,:,:.. ............ ~...:,.,:,:..,. ...................................................... ; .................................................... . * FILTERS;
DATE 1 LOCATION 1 LABEL I PRETEST WGT I ACTUAL PRETEST WGT
BLANKS;
I %PPT I LOT #
GAS ANALYSIS; /
WATER
ACETONE
DAm. 7//4 I~sTRuMl3lT: r~\-fJ&?- FY&
siWt/~m , db 14-7- I
I
Cd [LC ct 0 ?>sdtI'
DATE: 7/14 GAS= c02
1 -. AP (below)l I Cp (below)! 1
'l I
r r'pm
~:::::::::::::i:j::::::::5:::::::>:::j.:j.::::::::::::::::::t::::::::::::::::::::::::: .:.:.:.:.:.:.:.:.:.:<.:.:.:.:.:.:.:.~:.:.:.:.:.:.:.:.:.:.: .:, :.: ..:.:.:.:.: .... ;..... .... .;. .................. ................................ .......................... ;...:.:.:.:.: ....................... ............................... ...., .......................................;.......................................>. .,:.:.:,:.:,:.:.:.:,:.:,:*:::::5::::::,:::.:C ... .:< ,:.:.:, E: :A:::?:<: ::::::jj:::::y,::k:::::~:::k:::::*::::i~;:z2cj~i: ............... i::%i:j::::j::::::.:k:::::::::E>~>j:>i.:~<:j:~~.;~~::::::::::~~:~: :::::::%i:~~.~~:i:~?:::::::?:?::::::::*:::::::"~~S .>:::::::::ky ..:.:i:::: ....................................... I ......................................................................................... ::.:.:.:.:.:.:.:.:.:'.><. .............. ............................... ..... ' ......" :.:::::::j::: :.:.:.:+:.:'i.:.:,:.:r+x.:.:,:,:.:.:.:<~::,~ .:,:,:.:,z:<, ... .' ................... .......................... .................. :.:,:,:.;c.:.:.:.: ................. '.'..f.'E ............................... Z:::K.::::::::::*:.:.' .. .:,:.:SF .:,:,:.:,:*
~ o w N ~ ~ ~ F ~ ~ ~ ~ i i : J ~ ~ m ~ g ~ ~ ~ ~ B ~ ~ ~ ~ ~ j i m S j i ~ ~ ~ ~ ~ ~ ~ ~ A w ~ ~ ~ ~ ~ -..... ........._.. ..._.*. .... -. ........... i... ........................................................................................... '. . . . . . . . . . . . . . . . . . . .'." ............... ". . . . . . . . . . . . . . . . . . . . . . . . . . . . . . . . . . . . . . . . . . . . . . . . . . . . . . . . . . . . . . . . . . . . . . . . . . . . . . . . . . . . . . . . . . . . . . . . . . . :':" .. / I / f
Sp CALCULATION; Cp(test)={ { [AP(test)-AP(above)Y[AP(below)-AP(above)] - ) ' [Cp(below)-Cp(above)] } + Cp(above)
RANGE:
Cal Gas Actual %= - INSTRUMENT: w & D
A P (above)
AP (test)
7 / / 3 1 .i a ~i3ia
Cal.No.= a36 -
Cp iabove)
I
I Cal Gas%=
YES @Q 2 NO
- $qT /J+&&


PARTI CULBTE SAMPLl NG F l EL0 BAT8 SHEET '.

PflRTI CULBTE SSAMPLl NG F l ELD NATA SHEET
I (Vend, hA3) - (Vstart. RA3) = (Vcalc<O.OP cfm, hA3) Q (vac) in 1 min= Pass in Hg &I@:
PRE : - - @- in Hg in-min P F Pg: in H20 Y: :A::::: " :::::::::::::A::::::: .". ::>::::::::::::.' i". ::.: ... ..................... ::::i:::::::::MF~:~::::Zi:::f~,j:yg,~..:.:.' ".:.:::.>:~.:::::~.?,:?'t::YY:KK~,;.: . . . .,. i. m ... . . . ...,.. , _ - - @- in Hg i n r n i n P F .:.?:+.........:.:. ... gz;~~@$&zk~BB&\?~#{p$@w~~ .... . _ . . . . . . . . . . . . . . . . .. . ... ,..,..._... ..... .... '.>:.::::... . ..... ... ..... ..... .... :.::q::.:.:..,:.: ..., , ......,.... @~;&i@ ........ ........,..
TF19 SAMIUNO GASMETER -aff PRESS DIFF.ACROSS STACK BQX WNiEB DRYGAS ''~k"'' 'kk = TM h3, Vm PCRoSs PTT M E ORIFICE, in H20 TEMPPF TEMPPF TEMP,F . O F VAC TME
a N3 min Vm NBES,in HZO AH AH f f F INLFT OUTLET in. Hg Hr:min
f b AP DmRQ ACTUAL th I th II th Il l (TI) 1T2)
( ( 7 2 , (17. 156 !oTziL60 8 id& 5 t - /W 5 3 R 4
~
3 6 45*%*212 rbL 3 1;5' V I /5 Y //79 ..n 8r -3
A, 21 3
I ,
- -
- . - -------
I
# 4: ?
8
--
I
I !
i j i
i I
- -- --
I


. - - ??SITE NAME?? on ??TEST DATE?? P.O.#????? TEST #?????
SAN DlEGO AIR POLLUTION CONTROL DISTRICT, 9150 CHESAPEAKE DRIVE, SAN DIEGO, CA. 92123
SOURCE TEST OF PARTICULATE EMISSIONS TO THE ATMOSPHERE
TEST SITE:
TEST #: 92196 P.O.#: 115 TEST DATE: 7/14/92
UNIT TESTED:
EQUIPMENT:
TESTED BY: DATE:
SITE PERSONNEL: DATE:
APCD ENGINEER: DATE: LAB ANALYSIS BY: DATE:
REPORT BY. DATE:
REVIEWED BY: DATE:
APPROVED BY: DATE: ROBERT YELENOSKY, SENIOR AIR POLLUTION CHEMIST
This report has been reviewed and found to be representative of the testing that was performed. - TEST I LIMIT I MEASURED I PASSIFAIL I
RULE 54 DUST & FUMES 1 40 lbs/hr I TFST RESUI TS SUMMARY: v
This asphalt plant combines crushed rock and and sand with asphalt oil in batch loads of varying s'izer The rock and sand are heated in a rotary drum to dry them. The exhaust from this dryer is routed through a baghouse and finally to a stack It is the emissions from this stack that are the subject of this report.
PROCEDURIES; The procedures and equipment utilized in these tests are based on EPA New Source Performance Standards Method 5. The sampling train was modified to utilize a backend filter and 5th impinger filled with silica gel (fig. 1 ), as outlined by the SDAPCD QA manual. C'JLI;ICUIATIONS AH preliminary assumptions and calculations are based on data obtained from previous tests. All equations are from EPA CFR 40, July 1.1991, Paris 53-60, Appendix A. Methods 1-5 inclusive.
The test consisted of sampling at 24 traverse points, 12 from each of 2 sample ports (fig.2). collected from 31 inches below the stack (fig.3). All field data was transferred to the computer printout. Al calculations were done by the computer and the emissions were compared to rule 54 of the SDAPCD.
I
Gas: An integrated bag sample was collected during the test and analyzed at the APCD lab. Particulate: All procedures follow EPA guidelines, except where noted in the SDAPCD QA manual.
zAmxmmE All testing and analysis equipment was calibrated according to EPA guidelines. Analysis: Collection: Sampling: Temp./Press. :
C02-Anarad AR400 Filter-Gelman US Box-Napp Thermocouples-Omega 02-Teledyne Ryan 320 P4 Holder-Gelman Umbilical cord-Napp Read outOmga Macrobalance-Sargent Welch Beakers-Pyrex CoIdiHot box-Napp Barometriccalc. by APCD Microbalance-Sartorious Impingers-Ace Pitobe tube-Napp US box-Dwyer magnehelic ver.3APCD P/M-ISOS 4/9/92 by DNS Printed: 8/24/92 @ 3:41 PM Page 1 of 3
@td dscfm
2,51E+04
- ITEM UNITS
VALUE
Cs gr/dscf 0.1071
I %
107
E lbs/hr 23.09
TYPE OF mJEL LOAD Tons/Hr
RATE Tons

??SITE NAME?? on ??TEST DATE:. . P.O.#????? TEST #?????
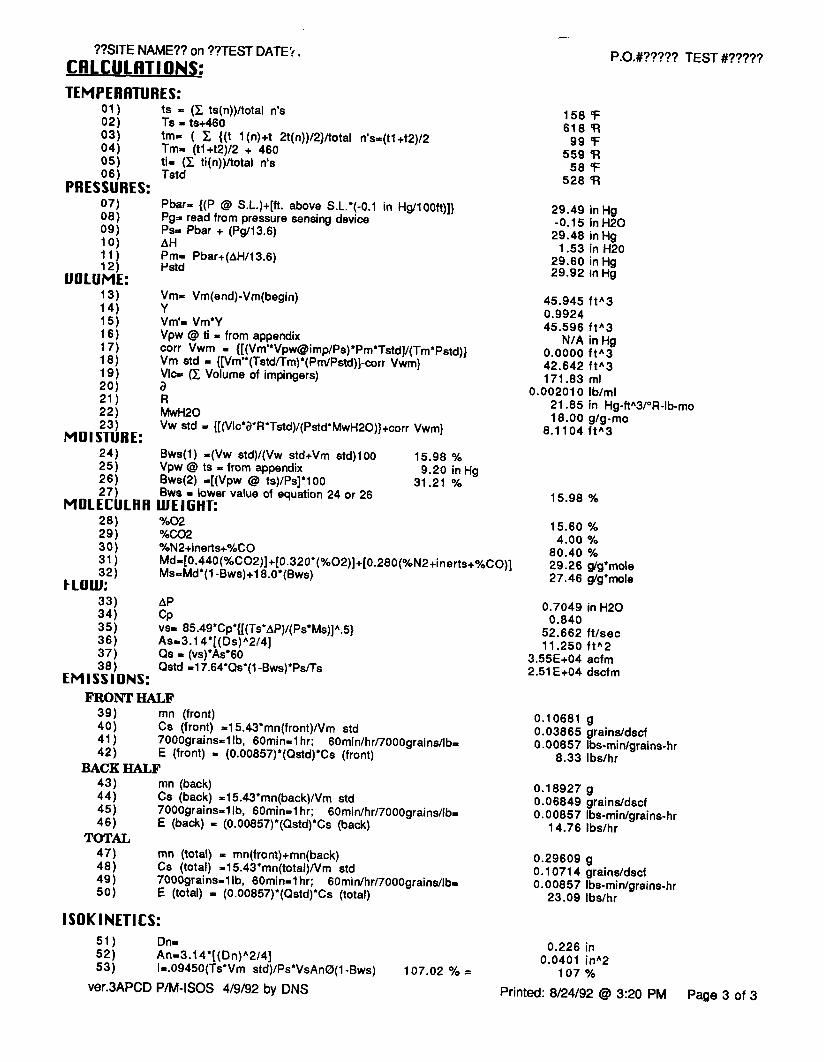
TEMPERATURES: 01 ts = (C ts(n))notal n's 02) Ts = ts+460 03) tm= ( C {(t 1 (n)+t 2t(n))l2)ltotal n's=(tl +t2)/2 04) Tm= (t l +t2)12 + 460 05 ti= (Z ti(n))ltotal n's 06) Tstd
PRESSURES: 07) Pbar= {(P Q S.L.)+[ft. above S.L.'(-0.1 in HgllOOft)]} 08) Pg= read from pressure sensing device 09 Psa Pbar + (Pg113.6) 10) AH 11) Pm= Pbar+(AH113.6) 12) Pstd
UOLUME: 13) Vm= Vm(end)-Vm(begin) 14) Y 15) Vm'= Vm'Y 16) Vpw Q ti = from appendix 17) corr Vwm = {[(Vm"Vpw@implPs)*Pm'Tstd]/(Tm*Pstd)} 18) Vm std = {[Vm"(Tstd/Tm)'(Pm/Pstd)]-corr Vwm) 19) Vlc= (C Volume of impingers) 20) a 21 R 22) MwH20 23) Vw std = {[(VI~*atR*T~td)/(P~td*M~H20)}+corr Vwm}
MOISTURE:
45.945 ftA3 0.9924 45.596 f t A 3
NIA in Hg 0.0000 f t "3 42.642 ftA3 171.83 ml
0.00201 0 lblml 21.85 in Hg-ftA3I0R-lb-mo 18.00 glg-mo
8.1 104 ftA3
24) Bws(1) =(Vw std)/(Vw std+Vm std)100 15.98 % 25) Vpw Q ts = from appendix 9.20 in Hg 26) Bws(2) =[(Vpw Q ts)/Ps]'100 31.21 % 27) Bws = lower value of equation 24 or 26 15.98 % MOLECULAR WEIGHT: 28) Yo02 29)
15.60 % %CO2 4.00 Yo
30) YoN2+inerts+%CO 80.40 % 31 Md=[0.440(%CO2)]+[0.320'(%02)]+[0.280(CO)] 29.26 glg'mole 32) Ms=Mde(l -Bws)+l 8.0*(Bws) 27.46 glg'rnole FLOW: 33) AP 34) CP 35) vs= 85.49'Cp'{[(T~'AP)l(Ps'Ms)]~.) 36) A~=3.14'[(Ds)~2/4] 37) Qs = (vs)*As'GO 38) Qstd =I 7.64'0s'(l -Bws)'Ps/Ts
E M I SS I ONS: FRONT HALF
39) mn (front) 40) Cs (front) =15.43'mn(front)/Vm std 41 7000grains=1 Ib, 60min=l hr; 6Omin/hrl7000grains/lb= 42) E (front) = (O.O0857)'(Qstd)'Cs (front)
BACK HALF 43) mn (back) 44) Cs (back) = I 5.43'mn(back)lVm std 45 7000grains=1 Ib, 6Omin=l hr; 60min/hrl7000grains/Ib= 46) E (back) = (0.00857)'(Qstd)'Cs (back)
TOTAL 47) mn (total) = mn(front)+mn(back) 48) Cs (total) =15.43'mn(total)Nm std 49 7000grains=l Ib, 6Ominll hr; 60min/hrl7000grainsllb~ 50) E (total) = (0.00857)*(Qstd)*Cs (total)
0.7049 in H20 0.840
52.662 ftlsec 11.250 ftA2
3.55E+04 acfm 2.51 E+04 dscfm
0.10681 g 0.03865 grains/dsd 0.00857 Ibs-minlgrains-hr
8.33 Ibslhr
0.18927 g 0.06849 grainsldscf 0.00857 Ibs-minlgrains-hr
14.76 lbslhr
0.29609 g 0.1 071 4 grainsldscf 0.00857 Ibs-minlgrains-hr
23.09 Ibslhr
I SOK I NET1 CS:
ver.3APCD PIM-ISOS 4/9/92 by DNS Printed: 8/24/92 @ 3:20 PM Page 3 of 3