note to users - concordia university · 2013-01-22 · productivity analysis of horizontal...
TRANSCRIPT

NOTE TO USERS
This reproduction is the best copy available.
®
UMI


Productivity Analysis of Horizontal Directional Drilling
Muhammad Adel Ahmed Mahmoud
A Thesis
in
The Department
of
Building, Civil, and Environmental Engineering
Presented in Partial Fulfillment of the Requirements For the Degree of Master of Applied Science (Building Engineering) at
Concordia University Montreal, Quebec, Canada
July 2009
© Muhammad A. A. Mahmoud, 2009

1*1 Library and Archives Canada
Published Heritage Branch
395 Wellington Street OttawaONK1A0N4 Canada
Bibliotheque et Archives Canada
Direction du Patrimoine de I'edition
395, rue Wellington OttawaONK1A0N4 Canada
Your file Votre reference ISBN: 978-0-494-63159-1 Our file Notre reference ISBN: 978-0-494-63159-1
NOTICE:
The author has granted a nonexclusive license allowing Library and Archives Canada to reproduce, publish, archive, preserve, conserve, communicate to the public by telecommunication or on the Internet, loan, distribute and sell theses worldwide, for commercial or noncommercial purposes, in microform, paper, electronic and/or any other formats.
AVIS:
L'auteur a accorde une licence non exclusive permettant a la Bibliotheque et Archives Canada de reproduce, publier, archiver, sauvegarder, conserver, transmettre au public par telecommunication ou par I'lnternet, preter, distribuer et vendre des theses partout dans le monde, a des fins commerciales ou autres, sur support microforme, papier, electronique et/ou autres formats.
The author retains copyright ownership and moral rights in this thesis. Neither the thesis nor substantial extracts from it may be printed or otherwise reproduced without the author's permission.
L'auteur conserve la propriete du droit d'auteur et des droits moraux qui protege cette these. Ni la these ni des extraits substantiels de celle-ci ne doivent etre imprimes ou autrement reproduits sans son autorisation.
In compliance with the Canadian Privacy Act some supporting forms may have been removed from this thesis.
Conformement a la loi canadienne sur la protection de la vie privee, quelques formulaires secondaires ont ete enleves de cette these.
While these forms may be included in the document page count, their removal does not represent any loss of content from the thesis.
Bien que ces formulaires aient inclus dans la pagination, il n'y aura aucun contenu manquant.
1+1
Canada

ABSTRACT
Horizontal Directional Drilling Productivity Analysis
Muhammad A. A. Mahmoud
The National Research Council of Canada reported that rehabilitation of
municipal water systems between 1997 and 2012 would cost $28 billion (NRC, 2004).
With the rapid increase of new installations, the need for replacement and repair of pipe
utilities and also the demand for trenchless excavation methods, increase. This must be
done with minimum disruption to public. One alternative to reduce disruption is to use
horizontal directional drilling (HDD) for new pipe installation scenarios. Consequently,
contractors, engineers, and decision makers are facing continuous challenges regarding to
estimation of execution time and cost of new pipe installations, while using HDD. This is
because productivity prediction and consequently the cost estimation of HDD involves a
large number of objective and subjective factors that need to be considered. It is well
known that prediction of both productivity and cost is an important process in
establishing and employing management strategies for a construction operation. This
calls for the need of developing a dedicated HDD productivity model that meets present
day requirements of this area of construction industry.
There are two main objectives of the current research. The first objective is to identify the
factors that affect productivity of HDD operations. The second objective is to develop a
productivity prediction model for different soil conditions. To achieve these two
objectives a thorough literature review was carried out. Thereafter, data on potential
factors on productivity were collected from HDD experts across North America and
hi

abroad. Following data collection, the current research identified managerial, mechanical,
environmental and pipe physical conditions parameters operating in three types of soils:
clay, rock and sandy soils. Prior to model development, Analytical Hierarchy Process
(AHP) technique was used to classify and rank these factors according to their relative
importance.
A neurofuzzy (NF) approach is employed to develop HDD productivity prediction model
for pipe installation. The merits of this approach are that it decreases uncertainties in
results, addresses non-linear relationships and deals well with imprecise and linguistic
data. The following eight factors were finally selected as inputs of the model to be
developed: operator/ crew skills, soil type, drilling rig capabilities, machine conditions,
unseen buried obstacles, pipe diameter, pipe length and site weather and safety
conditions. The model is validated using actual project data. The developed NF model
showed average validation percent of 94.7%, 82.3% and 86.7%, for clay, rock and sand,
respectively. The model is also used to produce productivity curves (production rate vs.
influencing factors) for each soil type.
Finally, an automated user-friendly productivity prediction tool (HDD-PP) based on
present NF model is developed to predict HDD productivity. This tool is coded in
MatLab® language using the graphical user interface tool (GUI). The tool was used to test
a case study. It was proved to be helpful for contractors, consultants and HDD
professionals in predicting execution time and to estimate cost of HDD projects during
the preconstruction phase in the environment of imprecise and noisy inputs.
iv

AKNOWLEDGEMENT
Foremost, I thank the Almighty Creator for giving me health, power and persistence
throughout my Master program.
I wish to express my sincere gratitude to my supervisor, Prof. Tarek Zayed, for his
continuous support, guidance, understanding and friendly attitude throughout the duration
of my study at Concordia University. I would like to thank all the faculty and staff
members of the department of Building, Civil, and Environmental Engineering.
I would like to express my special indebtedness to my precious parents for their
outstanding and extraordinary support, guidance and encouragement throughout my
entire life. Very special thanks to my mother in law for her care and unconditional love.
My never ending thanks to my wonderful sister Mahinoor. I thank you all for your
everlasting love that brought me this far.
I would like to extend my deepest appreciation to my lovely wife Ayah for her patience,
encouragement and continuous support.
Thanks are due to my brothers, Tarek El Zanaty, Mohamed Samir and Ibrahim Mashhour
for their support and encouragement.
Finally, I would like to express my special gratitude to Zafar Khan for his continuous
assistance, valuable discussion and input to the research topic. His brotherhood is an asset
v

TABLE OF CONTENTS
LIST OF FIGURES xi
LIST OF TABLES xv
NOMENCLATURE & ABBREVIATIONS xvi
CHAPTER I: INTRODUCTION 1
1.1. PROBLEM STATEMENT 2
1.2. RESEARCH OBJECTIVES 3
1.3. RESEARCH METHODOLOGY 3
1.4. THESIS ORGANIZATION 4
CHAPTER II: LITERATURE REVIEW 7
ILL TRENCHLESS TECHNOLOGY 7
11.2. HORIZONTAL DIRECTIONAL DRILLING (HDD) 13
11.3. PRODUCTIVITY OF TRENCHLESS TECHNOLOGY METHODS 15
11.3.1. Previous Work in Micro-Tunneling Productivity 16
11.3.2. Previous Work in Auger Boring Productivity 19
11.3.3. Previous Work in HDD Productivity 20
i. Deterministic Productivity Model for HDD 22
ii. Software for Planning and Cost Control in Directional Drilling Projects.. .23
11.4. NEUROFUZZY APPROACH 23
11.4.1. Artificial Neural Networks (ANN): Theory and Applications 24
11.4.2. Fuzzy Logic (FL): Theory and Applications 28
vi

II.4.3. Neurofuzzy Systems (NFS): Theory and Applications 30
11.5. NEUROFUZZY SYSTEM vs. NEURAL NETWORKS 36
11.6. ANALYTIC HIERARCHY PROCESS (AHP): Theory and Applications 37
11.7. SUMMARY OF CHAPTER II 40
CHAPTER III: RESEARCH METHODOLOGY 42
111.1. LITERATURE REVIEW 42
111.2. FACTORS THAT CONTRIBUTE TO HDD PRODUCTIVITY 44
111.2.1. Management Conditions 44
111.2.2. Mechanical Conditions 45
111.2.3. Environmental Conditions 46
111.2.4. Pipe Conditions 47
111.3. DATA COLLECTION AND ANALYSIS 48
111.4. SCORING AND RANKING FACTORS THAT CONTRIBUTE TO HDD
PRODUCTIVITY 49
111.5. MODEL DEVELOPMENT 50
111.5.1. Model Training 52
111.5.2. Model Validation 53
111.6. MODELING CASE STUDIES 53
111.7. SENSITIVITY ANALYSIS 54
111.8. AUTOMATED HDD PRODUCTIVITY PREDICTION DECISION SUPPORT
TOOL 54
111.9. SUMMARY OF CHAPTER III 56
vn

CHAPTER IV: DATA COLLECTION 57
IV.l. DATA COLLECTION AND ORGANIZATION 57
IV.2. QUESTIONNAIRE SURVEY ANALYSIS 60
IV.3. CASE STUDY PROJECTS 66
IV.3.1. Clay Case Study 66
IV.3.2. Rock Case Study 67
IV.3.3. Sand Case Study 68
IV.4 RELIABILITY OF COLLECTED DATA 68
IV.5. SUMMARY OF CHAPTER IV 70
CHAPTER V: MODEL DEVELOPMENT AND RESULTS 71
V.l. HDD PRODUCTIVITY FACTORS RANK 71
V.2. NEUROFUZZY MODEL ARCHITECTURE 75
V.3. NEUROFUZZY MODEL DEVELOPMENT 77
V.3.1. Identifying Input Factors 78
V.3.2. Calculating Output (Productivity (m/hr)) 82
V.4. HDD PRODUCTIVITY MODEL FOR CLAY SOIL 85
V.4.1. Clay Model Training 85
V.4.2. Clay Model Validation 90
V.4.3. Case Study Description and Application of Clay Model 91
V.4.4. Clay Model Productivity Curves 93
V.5. HDD PRODUCTIVITY MODEL FOR ROCK SOIL 95
V.5.1. Rock Model Training 95
viii

V.5.2. Rock Model Validation 96
V.5.3. Case Study Description and Application of Rock Model 97
V.5.4. Rock Model Productivity Curves 98
V.6. HDD PRODUCTIVITY MODEL FOR SAND SOIL 100
V.6.1. Sand Model Training 100
V.6.2. Sand Model Validation 102
V.6.3. Case Study Description and Application of Sand Model 102
V.6.4. Sand Model Productivity Curves 104
V.7. AVERAGE VALIDATION OF THE DEVELOPED HDD-PRODUCTIVITY
PREDICTION NF MODEL 106
V.8. SOIL TYPE EFFECT ON HDD PRODUCTIVITY 107
V.9. SUMMARY OF CHAPTER V I l l
CHAPTER VI: AUTOMATED PRODUCTIVITY PREDICTION MODEL 112
VI.l. FRAME WORK OF THE HDD-PP AUTOMATED TOOL 112
VI.2. GUI INTRODUCTION 114
VI.3. SELECTION OF SOIL TYPE 114
VIA IMPORTING DATA 115
VI.5. DATA PROCESSING AND RESULTS 120
VI.6. SUMMARY OF CHAPTER VI 121
CHAPTER VII: CONCLUSIONS AND RECOMMENDATIONS 122
VII.l. SUMMARY AND CONCLUSIONS 122
ix

VII.2. RESEARCH CONTRIBUTIONS 124
VII.3. RESEARCH LIMITATIONS 124
VII.4. RECOMMENDATIONS FOR FUTURE WORK 125
REFERENCES 127
APPENDICES 132
APPENDIX (A): Trenchless Technology Methods Overview 133
APPENDIX (B): Horizontal Directional Drilling Equipment 147
APPENDIX (C): Questionnaire Samplers 154
x

LIST OF FIGURES
Figure II.1 Trenchless Technology Methods 10
Figure II.2 TT Productivity Qualitative Factors 16
Figure II.3 Conceptual Layout of IMS-TC 24
Figure II.4 Neuron-The Information Processing Unit 26
Figure II.5 Typical Back Propagation Neural Network Architecture 26
Figure II.6 Schematic of Fuzzy System Modeling 29
Figure II.7 Basic Structure of a Neurofuzzy System .....31
Figure II.8 High-Level View of a Neurofuzzy Network 32
Figure II.9 Overall Architecture for a Neurofuzzy Learning Control System 33
Figure 11.10 Model Methodology Using Neurofuzzy System 35
Figure III. 1 Schematic Methodology of Studying HDD Productivity Prediction 43
Figure III.2 Basic Architecture of Neurofuzzy Network 51
Figure III.3 Data Clustering 52
Figure III.4 Output Input HDD Productivity Prediction Model Mechanism 55
Figure IV.1 Questionnaire 58
Figure IV.2 Questionnaire Continued 59
Figure IV.3 Representation of the Fuzzy Performance Scale 60
Figure IV.4 Number of Questionnaires 60
Figure IV.5 Number of Projects Collected for Each Soil Type 61
Figure IV.6 Distribution of Pipe Diameter According to Collected Data; Clay Soil....61
Figure IV.7 Distribution of Pipe Diameter According to Collected Data; Sand Soil...62
Figure IV.8 Distribution of Pipe Diameter According to Collected Data; Rock Soil.. .62
xi

Figure IV.9 Drilling Bit Sizes 63
Figure IV. 10 Distribution of Pipe Length According to Collected Data; Clay Soil 64
Figure IV. 11 Distribution of Pipe Length According to Collected Data; Sand Soil 64
Figure IV.12 Distribution of Pipe Length According to Collected Data; Rock Soil 65
Figure IV. 13 Percentage of Pipe Types 65
Figure V. 1 Investigated HDD Factors 72
Figure V.2 Modeled Factors Affecting Productivity of HDD Operations 75
Figure V.3 Schematic Representation of the Utilized NF Architecture 76
Figure V.4 Fuzzy Representation of Numerical Variables "Pipe Diameter-Clay" 79
Figure V.5 Fuzzy Representation of Numerical Variables "Pipe Length-Clay" 81
Figure V.6 Fuzzy Representation of Numerical Variables "Rig Sizes; all soil
types" 81
Figure V.7 Fuzzy Representation of Linguistic Variables
"Drilling Rig Operator & Crew Skills" 81
Figure V.8 Fuzzy Representation of Linguistic Variables "Machine Condition" 82
Figure V.9 Fuzzy Representation of Linguistic Variables "Buried Obstacles" 83
Figure V. 10 Fuzzy Representation of Linguistic Variables
"Site, Weather and Safety Conditions" 83
Figure V.l 1 Basic Architecture of Clay and Rock NF Model 86
Figure V.12 Training and Validation Data Sets; Clay NF Model 87
Figure V.13 Sample of Training Cycles (Epochs); NF Clay Model Training 88
Figure V.14 Clay NF Testing Data Set Results 89
Figure V.15 Productivity Predictions for Operator and Crew Skills; Clay Soil 93
xii

Figure V.16 Productivity Predictions for Machine Condition; Clay Soil 93
Figure V. 17 Productivity Predictions for Pipe Length; Clay Soil 94
Figure V. 18 Productivity Predictions for Site, Weather and Safety Conditions;
Clay Soil 94
Figure V.19 Relation between Productivity Rate and Pipe Diameter; Clay Soil 94
Figure V.20 Relation between Productivity Rate and Buried Obstacles; Clay Soil 95
Figure V.21 Productivity Predictions for Operator and Crew Skills; Rock Soil 98
Figure V.22 Productivity Predictions for Machine Condition; Rock Soil 99
Figure V.23 Productivity Predictions for Site, Weather and Safety Conditions;
Rock Soil 99
Figure V.24 Relation between Productivity Rate and Pipe Length; Rock Soil 99
Figure V.25 Relation between Productivity Rate and Pipe Diameter; Rock Soil 100
Figure V.26 Relation between Productivity Rate and Underground Obstacles;
Rock Soil 100
Figure V.27 Basic Architecture of Sand NF Model 101
Figure V.28 Productivity Predictions for Machine Condition; Sand Soil 104
Figure V.29 Relation between Productivity Rate and Pipe Diameter; Sand Soil 104
Figure V.30 Productivity Predictions for Site, Weather and Safety Conditions;
Sand Soil 105
Figure V.31 Relation between Productivity Rate and Underground Obstacles;
Sand Soil 105
Figure V.32 Productivity Predictions Pipe Length; Sand Soil 105
Figure V.33 Clay, Rock and Sand AIP/AVP 106
xiii

Figure V.34 HDD-PP NF Model TAIP and TAVP 106
Figure V.35 Effect of Various Factors on HDD Productivity 109
Figure VI. 1 Automated Horizontal Directional Drilling
Productivity Prediction Model 113
Figure VI.2 HDD-PP Intro (Welcome Page) 114
Figure VI.3 Soil Type Selection 115
Figure VI.4 Operator and Crew Skills Selection 117
Figure VI.5 Rig Size Selection 117
Figure VI.6 Pipe Diameter and Length Selection 118
Figure VI.7 Displaying Error; Out of Range Input 118
Figure VI.8 Machine Condition Selection 119
Figure VI.9 Underground Obstacles Expectation Selection 119
Figure VI.10 Site, Weather and Safety Condition Selection 120
Figure VI. 11 Representation of the HDD Predicted Productivity 121
Figure A.l Pilot Hole 134
Figure A.2 Pre-Reaming 135
Figure A.3 Pull Back 136
Figure A.4 Rig Site Layout 136
Figure A.5 Pipe Site Layout 137
Figure A.6 Typical Components of Pipe Jacking Operation 139
Figure A.7 Typical Components of Utility Tunneling System Techniques 140
Figure B.l Basic Component of Bore Rig 147
Figure B.2 Various Models of Back Reamers 150
xiv

LIST OF TABLES
Table II.1 Main Characteristics of Trenchless Rehabilitation Methods 11
Table IV.l Clay Case Study Activity Duration 67
Table IV.2 Rock Case Study Activity Duration 68
Table IV.3 Sand Case Study Activity Duration 69
Table V. 1 Pair-wise Comparison Matrix (Respondent No. 1) 72
Table V.2 Weight Vector for each Pair-Wise Matrix "Respondent No. 1" 73
Table V.3 Average Weight Values (Wi) for All Respondents 74
Table V.4 The Weight (Wi) of Modified Factors' Layout 74
Table V.5 Major Activities Durations (Clay Case Study) 92
Table V.6 Auxiliary Activities Durations (Clay Case Study) 92
Table V.7 Major Activities Durations (Rock Case Study) 97
Table V.8 Auxiliary Activities Durations (Rock Case Study) 97
Table V.9 Major Activities Durations (Sand Case Study) 102
Table V. 10 Auxiliary Activities Durations (Sand Case Study) 103
Table VI.l HDD-PP Models Input Limitations 116
Table A. 1 Main Characteristics of HDD Among
Horizontal Earth Boring Systems 141
Table A.2 Main Characteristics of Trenchless Rehabilitation Methods 146
Table B. 1 Classification and Characteristics of HDD Rigs 148
Table B.2 Drill Bit Types and Application Guidelines (Good practices, 2004) 149
xv

NOMENCLATURE & ABBREVIATIONS
NRC
TT
HDD
NF
ANN
FL
PP
AB
PB
MT
PJ
LP
RSR
PS&E
TCM
TRM
HEB
HAB
PR
UT
LOR'S
CIP
National Research Council
Trenchless Technology
Horizontal Directional Drilling
Neurofuzzy
Artificial Neural Network
Fuzzy Logic
Productivity Predictor
Auger Boring
Pipe Bursting
Micro-Tunneling
Pipe Jacking
Lining of Pipe
Robotic Spot Repair
Pipe Scanning and Evaluation
Trenchless Construction Methods
Trenchless Rehabilitation Methods
Horizontal Earth Boring
Horizontal Auger Boring
Pipe Ramming
Utility Tunneling
Localized Repair
Cured In Place

SL
TP
CFP
PV
HDPE
PI
PVC
ANFIS
FES
HDD-PP
GUI
AVP
AIP
TAVP
TAIP
Slip Lining
Thermoformed Pipe
Close Fit pipe
Pipe Removal
High Density Poly Ethylene
Productivity Index
Polyvinyl Chloride
Adaptive Neurofuzzy Inference Systems
Fuzzy Expert Systems
Horizontal Directional Drilling Productivity Predictor
Graphical User Interface
Average Validity Percent
Average Invalidity Percent
Total Average Validity Percent
Total Average Invalidity Percent
xvii

CHAPTER I
INTRODUCTION
Since the beginning of century, both Canada and USA, witness enormous
challenge in continuous need for maintaining and repairing existing utilities in addition to
increasing demand for constructing new utilities installations (power,
telecommunications, water mains, and sewer). These operations are proven expensive,
especially in crowded urban areas. In addition to cost involved for execution there are
cost of ground surface repair (i.e., sidewalks, pavement, brick paving) and social costs
due to traffic disruptions and unfavorable impact on nearby activities (Ariaratnam et al.
1999).
To face urgent demand of replacement or renovation of these aged utility networks, in
addition to environmental constrains that are pressing to replace aged utilities,
municipalities, utility companies and contractors started to seek alternatives to open cut
methodology in order to install or repair their underground assets. Trenchless Technology
(TT) proved to be a viable option due to its possible various alternatives of methods,
materials and equipment (Allouche et al. 2000).
Trenchless technology has gained wide popularity among municipal engineers
throughout Canada. Canadian municipalities spent $29.68/capita on new municipal
construction service lines and $18.21/capita on rehabilitation of existing lines. Over
period of 1994 to 1999, percentage of municipal projects, that utilized trenchless
1

technology methods, had increased by 180% and 270% for new installations and
rehabilitation, respectively (Ariaratnam et al. 1999). The present research focuses on
horizontal directional drilling (HDD), since it is the most rapidly growing method in pipe
installation techniques among trenchless family. The major advantage of HDD is that it
can efficiently be performed in high dense urban areas with the least potential for
settlement and minimal social, structural, road and environmental damages.
1.1. PROBLEM STATEMENT
At present, Canada and USA are facing a growing problem in rehabilitating their
decaying underground utility systems. Because of rapid increase in need for utility
service line replacement, with constraints that new installations or repairs should have
minimum disruption to surface, demand for trenchless excavation methods such as
horizontal directional drilling (HDD) has increased. These resulted in technology
advancement towards achievement of efficient and cost effective utility installation,
repair and renewal. The Canadian National Research Council emphasized that the
rehabilitation of municipal water systems would cost about $28 billion from year 1997 to
2012 (NRC, 2004).
As common practice, productivity of trenchless technology methods is usually predicted
using heuristic techniques to process expert opinions without considering effect of
subjective factors. Contractors usually consider the average production rate of previous
projects. This is mainly due to lack of models that predict productivity of trenchless
techniques (Ali et al., 2007).
2

Contractors, engineers, and decision makers are always facing a challenge to estimate the
duration and cost of new pipe installations using HDD, due to the presence of subjective
factors. The HDD process involves a large number of factors that must be considered for
productivity prediction. Therefore, there is an emergent need for developing a dedicated
productivity model designed to meet special industrial needs that are coherent with
increased complexity and size of projects.
1.2. RESEARCH OBJECTIVES
The main goal of current research is to identify key factors that affect productivity
of horizontal directional drilling (HDD) operations, and to predict productivity of HDD
operations under different soil conditions. The research has the following sub-objectives:
• identify and study factors that significantly impact productivity of HDD
operations,
• develop and validate a productivity prediction model for HDD operations, and
• develop an automated tool (Productivity Predictor) to assist professionals in
predicting HDD productivity.
1.3. RESEARCH METHODOLOGY
The research methodology consists of the following seven steps:
1. Review of literature and problem formulation are carried out for identifying all
input factors as well as HDD productivity prediction tools that are to be used in
proposed system development. The review includes the following topics:
3

problem definition, factors affecting HDD applications, cycle time and exploring
available techniques to deal with the current research problem.
2. Data collection is utilized to encompass: project information, cycle time and
surrounding factors affecting HDD operations. Questionnaire is mainly used to
collect both HDD operations information and activities duration. The collected
data is used to develop neurofuzzy model.
3. Ranking/sorting productivity factors: Analytical Hierarchy Process (a quantitative
comparison method) is applied to identify factors affecting HDD productivity and
rank them according to their relative importance.
4. Neurofuzzy model development: the model is implemented to adapt the chosen
neurofuzzy system for representing relationships between productivity and the
identified input factors.
5. Neurofuzzy system verification and validation: involves neurofuzzy model testing
for proper functionality in productivity prediction.
6. Sensitivity analysis is performed to observe inconsistent effect of main input
factors on the model performance. Sensitivity analysis holds the studied HDD
factor at actual values while other factors are kept at their constant average values.
7. Development of automated HDD productivity prediction tool: the tool is
addressed in a user-friendly graphical interface for professional use.
1.4. THESIS ORGANIZATION
Chapter II presents a literature review, beginning with overall trenchless
technology methods and ending with major disciplines needed for productivity prediction
4

for the horizontal directional drilling pipe installation technique. It embraces HDD
method, machine and equipment, factors that contribute to productivity prediction of
water and sewer pipe installation and previous work done in productivity prediction. In
addition, an overview of artificial neural network (ANN), fuzzy logic (FL), Neurofuzzy
(NF), Analytic Hierarchy process (AHP) approaches and their application was performed.
Consequently, abundance of analysis focuses on these approaches.
Chapter III provides illustrations of the proposed methodology and laying out the NF
productivity prediction model. Moreover, it presents the automated; user-friendly
graphical interface; and Horizontal Directional Drilling Productivity Prediction decision
support tool (HDD-PP).
Chapter IV describes the established data collection procedure in this study. This chapter
classifies data according to target soil type. In addition, it organizes collected data for
further analysis and modeling.
Chapter V provides an overview of the AHP implementation framework, which describes
and sorts main contributing factors to HDD productivity. It also illustrates NF framework
that identifies input and output factors, explains model development and presents training
and testing results. Moreover, it demonstrates model validation process. Finally, it
presents discussion and analysis of results and pipe installation productivity curves for
different soil types.
5

Chapter VI describes automated, graphical, user-friendly, productivity prediction
decision support tool (HDD-PP). An application is designed to describe methodology and
implementation and to demonstrate the potential of this productivity prediction tool.
Finally, it presents discussion of results and limitations of the HDD-PP user interface.
Chapter VII presents conclusions, limitations and main research contributions. In
addition, the chapter highlights future research recommendations.
6

CHAPTER II
LITERARURE REVIEW
Many of failing water and sewer pipelines are located in established urban areas,
where applying excavation and open trench methods are difficult or almost impossible.
With emerging need for installing new underground/underwater pipes or cables,
trenchless technology was addressed as the best solution and the most effective option for
new pipe installation. The most versatile method of the various trenchless procedures
available is horizontal directional drilling (HDD). It is a proven and widely used
technology for installing underground water and sewer pipes with minimal disturbance to
surrounding area and the earth surface (Lawson, 2003).
ILL TRENCHLESS TECHNOLOGY
The North American Society of Trenchless Technology (NASTT) defined
trenchless construction as "a family of methods, materials, and equipment capable of
being used for the installation of new or replacement or rehabilitation of existing
underground infrastructure with minimal disruption to surface traffic, business, and other
activities". Trenchless Technology (TT) has created new materials, methods and
equipment for underground infrastructure rehabilitation and new installation methods as
shown in Appendix (A). TT is a qualified alternative to replace the open trench method
for underground constructions. It is applied to minimize environmental and social
negative impact in addition to reducing the cost of underground works. It also provides
cost effective infrastructure asset management. Contrary to open trench methodology,
7

which causes major disturbances to surface activities, TT has minimal or no effect on
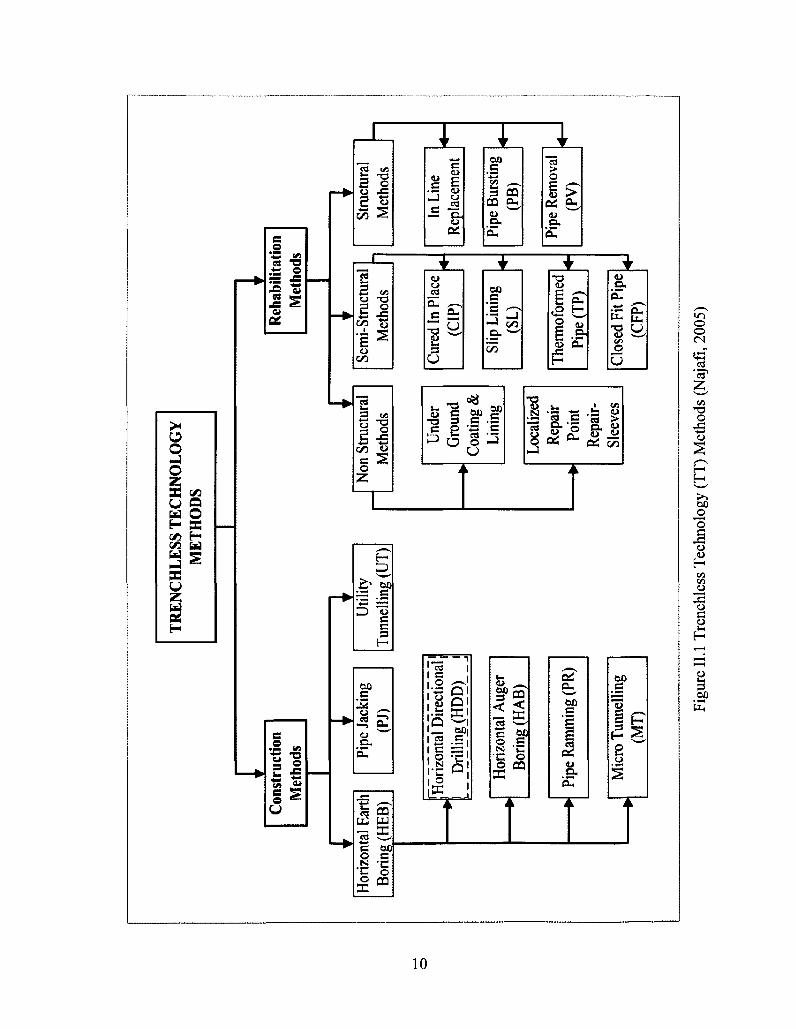
earth surface. The TT family is divided into two main categories; construction and non-
construction methods as shown in Figure (II. 1).
Wilkinson (1999) stated the following negative social impacts of the open-trench pipe
construction:
• Vehicular/pedestrian traffic: Often, roadways and sidewalks will be removed from
daily use in order to place pipes beneath them.
• Worker safety: Trench safety is a major concern for contractors when performing
open-trench construction.
• Interruption of local businesses: Local businesses are likely to lose customers due to
resulting traffic disruptions associated with open-trench pipe construction.
Residential: Major inconvenience, congestion, and delays are often imposed on
neighborhoods and their residents due to open-trench pipe construction nearby.
• The increased number of pavement joints at patched surfaces increases maintenance
resulting in additional traffic impacts and higher life-cycle costs.
• Existing utilities: During open-trench construction, existing utilities near the trench
are often damaged during the trench excavation and from subsequent soil settlement.
• Soil disposal: Contaminated soil is sometimes encountered during pipe construction.
• Air pollution: Fine soil particles may become airborne, which can blow these fine soil
particles from soil stockpiles created during the open-trench excavation.
• Water pollution: Water (rain or subsurface pumping discharge) can cause soil erosion
and solids may runoff into streams, rivers, and storm sewers.
8

• Roadways: Open-trench construction often requires sawing, demolition, or removal
of pavements followed by subsequent restoration. This significantly reduces
pavement life by up to 40% (Stahli and Hermanson, 1996).
• Noise: Open-trench excavation requires the use of heavy equipment that produces
levels of noise that cause disturbances to hospital, schools, business, and residences.
• Land defacement: Open-trench pipe construction frequently causes damage and can
have adverse short-term effects on grass, trees, and other landscaping features.
• The no dig emerging TT eliminates the need of digging up roads or pathways for
sewer, water, telecommunication and gas pipe installation, replacement or
rehabilitation. Accordingly, trenchless technology allows for the reparation of pipes
without having to excavate along the road section, thereby minimizing or eliminating
traffic problems and save on road repair costs.
Eighty-seven municipalities in Canada have participated in a survey to provide an
indication of current and future trends in the application of trenchless construction
technologies in the municipal field (Ariaratnam et al, 1999). The survey concerned the
percentage of projects that employed trenchless technology, frequency and type of
technologies employed and contractor selection methods. The municipalities were asked
to rank the technologies that had the highest possibility for future development. The
results showed that for new construction techniques, the greatest potential growth was in
horizontal directional drilling (HDD) followed by pipe bursting, auger boring, micro-
tunneling, and pipe jacking. Table II. 1, shows the summary of main advantages and
disadvantages of the most commonly used TT techniques.
9
TR
EN
CH
LE
SS T
EC
HN
OL
OG
Y
ME
TH
OD
S
Con
stru
ctio
n M
etho
ds
Hor
izon
tal
Earth
B
orin
g (H
EB
) Pi
pe J
acki
ng
(PJ)
Util
ity
Tun
nelli
ng (U
T)
Hor
izon
tal
Dire
ctio
nal
Dril
ling
(HD
D)
Hor
izon
tal A
uger
B
orin
g (H
AB
)
Pipe
Ram
min
g (P
R)
Non
Stru
ctur
al
Met
hods
Mic
ro T
unne
lling
(M
T)
Loc
aliz
ed
Rep
air
Poin
t R
epai
r-Sl
eeve
s
Reh
abili
tatio
n M
etho
ds
Sem
i-Stru
ctur
al
Met
hods
Cur
ed In
Pla
ce
(OF
)
Slip
Lin
ing
(SL
)
The
rmof
orm
ed
Pipe
(TP)
Clo
sed
Fit P
ipe
(CFP
)
Stru
ctur
al
Met
hods
In L
ine
Rep
lace
men
t
Pipe
Bur
stin
g (P
B)
Pipe
Rem
oval
(P
V)
—
4—
Figu
re I
I. 1
Tre
nchl
ess
Tec
hnol
ogy
(TT
) M
etho
ds (
Naj
afi,
2005
)

Tab
le I
I. 1
Adv
anta
ges
and
Lim
itatio
ns o
f T
renc
hles
s T
echn
olog
y (T
T)
Met
hods
(N
ajaf
i, 20
05)
TT
Met
hod
Hor
izon
tal
Aug
er B
orin
g
Hor
izon
tal
Dir
ectio
nal
Dri
lling
Pipe
R
amm
ing
Pipe
Jac
king
Pipe
Bur
stin
g
Und
ergr
ound
C
oati
ngs
and
Lin
ings
Adv
anta
ges
• C
asin
g is
inst
alle
d as
the
bore
hole
exc
avat
ion
take
s pl
ace,
and
can
be
used
in
wid
e va
riet
y of
soi
l typ
es.
• Pi
pelin
e in
stal
latio
n w
ithou
t se
riou
s in
cide
nts
of
hydr
o-fr
actu
re a
nd t
he a
lignm
ent c
an b
e m
aint
aine
d w
ithin
acc
epta
ble
limits
. •
Lar
ge d
rilli
ng e
quip
men
t co
uld
be p
reci
sely
loc
ated
in
und
ergr
ound
ope
ratio
ns w
ith s
ophi
stic
ated
tr
acki
ng s
yste
ms
like
GPS
and
GPR
.
• A
pplic
able
to
a w
ide
vari
ety
of p
ipe
leng
ths
and
size
s; c
an b
e us
ed f
or d
rivi
ng v
ertic
al p
iles.
• U
sed
in a
ll ty
pes
of s
oils
•
Hig
h de
gree
of
accu
racy
obt
aine
d, a
nd c
orre
ctio
n ac
tion
is ta
ken
imm
edia
tely
•
Rap
idly
man
ually
and
ele
ctro
nica
lly i
nspe
cted
•
Unf
ores
een
obst
acle
s id
entif
ied
and
rem
oved
.
• A
pplie
d to
non
-duc
tile
type
s of
pip
es
• A
bilit
y to
ups
ize
the
exis
ting
diam
eter
by
abou
t 30
%
• O
ne p
ass
for
appl
icat
ion,
thus
red
uce
cost
of
labo
r an
d tim
e ne
eded
for
rep
lace
men
t. •
Cle
anin
g of
hos
t pip
es n
ot r
equi
red
• M
inim
al e
xcav
atio
n sp
ace
• C
an a
ccom
mod
ate
a va
riet
y of
dia
met
ers
• Im
prov
es h
ydra
ulic
cha
ract
eris
tics,
•
Serv
ices
con
nect
ions
do
not h
ave
to b
e ex
cava
ted
Lim
itat
ions
• N
ot s
ucce
ssfu
l in
san
ds a
nd u
nsta
ble
soils
; req
uire
s de
wat
erin
g un
der
wat
er ta
ble
and
need
s in
itial
set
up.
• Sp
ecif
ic g
eote
chni
cal
inve
stig
atio
n •
Acc
urat
e Pl
anni
ng a
nd s
elec
tion
of s
uita
ble
equi
pmen
t and
pr
epar
atio
n of
a p
rope
r w
ork
area
is
requ
ired
•
Exp
erie
nce
and
qual
ific
atio
ns o
f th
e co
ntra
ctor
•
Thr
ee s
tage
s an
d eq
uipm
ent
encu
mbr
ance
dif
ficu
lt to
lau
nch
in s
ome
dow
ntow
n ar
ea.
• N
o co
ntro
l ov
er l
ine
and
grad
e du
ring
ram
min
g an
d it
is a
ver
y no
isy
appl
icat
ion.
• R
equi
res
a lo
t of
plan
ning
and
coo
rdin
atio
n •
Pipe
s an
d lin
ers
shou
ld b
e st
rong
eno
ugh
to r
esis
t jac
king
for
ces
• Pi
pes
used
to
repl
ace
the
old
pipe
s ar
e H
DPE
•
All
late
ral
serv
ices
and
fire
hyd
rant
s co
nnec
ted
to th
e ho
st p
ipe
mai
n m
ust b
e ex
cava
ted
and
unco
vere
d.
• Pu
lling
for
ce m
ust b
e le
ss th
an t
he n
ew p
ipe
tens
ile s
tren
gth
and
that
th
e ou
ter
diam
eter
of
the
new
pip
e w
ill n
ot b
e da
mag
ed b
y th
e fr
agm
ents
of
the
host
pip
e.
• A
ny u
nder
grou
nd u
tility
clo
se to
the
host
mai
n m
ust
be e
xcav
ated
and
ex
pose
d to
avo
id a
ny d
amag
e to
the
burs
ting
forc
e.
• Pi
pe m
ust b
e st
ruct
ural
ly s
ound
, cle
aned
and
dri
ed,
• Se
rvic
es m
ust b
e cl
eane
d •
Min
or r
educ
tion
in in
tern
al d
iam
eter
. •
Lim
it on
ben
ds le
ss th
an 4
5 de
gree
s

Tab
le II
. 1 A
dvan
tage
s an
d L
imita
tions
of T
renc
hles
s T
echn
olog
y (T
T) M
etho
ds (N
ajaf
i, 20
05) (
Con
tinue
d)
TT
Met
hod
Cur
ed-I
n-Pl
ace
Pipe
linin
g
Slip
-Lin
ing
The
rmof
orm
ed
Pipe
Clo
se F
it Pi
pe
Adv
anta
ges
• B
oth
stru
ctur
al a
nd n
on-s
truc
tura
l pu
rpos
e, a
nd
with
out
exca
vatio
n or
a li
ttle
exca
vatio
n •
Fast
and
sim
ple
way
to i
nsta
ll la
rge
pipe
dia
met
ers
• A
ccom
mod
atin
g be
nds
and
defo
rmat
ion
of p
ipes
(ex
: ga
ps, h
oles
and
cra
cks)
•
Gro
utin
g re
quir
ed o
nly
at m
anho
le a
nd l
ater
al
open
ings
if
requ
ired
with
hig
h co
rros
ion
resi
stan
t •
Min
imal
im
pact
on
neig
hbor
hood
• D
oes
not r
equi
re i
nves
tmen
t in
cos
tly s
peci
aliz
ed
equi
pmen
t; Si
mpl
e te
chni
que
• Ja
ckin
g pi
pes
and
fitti
ngs
can
also
be
used
for
SL
•
Can
be
used
for
str
uctu
ral
and
non-
stru
ctur
al p
urpo
ses
• In
stal
latio
n pr
oces
s is
fas
ter
sinc
e th
e pi
pe is
m
anuf
actu
red
at f
acto
ry (
effi
cien
t Q
A)
• N
o im
pact
on
the
envi
ronm
ent,
sinc
e no
use
of
chem
ical
s.
• R
educ
tion
of th
e cr
oss
sect
ion
of e
xist
ing
pipe
is
min
imal
. •
Can
sol
ve th
e co
rros
ion
prob
lem
of
pipe
line.
• E
ffic
ient
QA
sin
ce th
e pi
pe is
man
ufac
ture
d in
fac
tory
•
Red
uctio
n in
exi
stin
g pi
pe d
iam
eter
is
min
imal
•
Solu
tion
for
corr
osio
n an
d w
ater
qua
lity
prob
lem
s •
Can
be
inst
alle
d up
to 1
000'
and
can
acc
omm
odat
e 45
de
gree
ben
ds
• Po
ssib
ility
for
int
erna
l la
tera
l co
nnec
tions
.
Lim
itat
ions
• C
anno
t in
crea
se th
e di
amet
er o
f th
e ho
st p
ipe,
and
the
old
pipe
al
ignm
ent
may
res
ult
in s
truc
tura
l pr
oble
ms.
•
The
cur
ing
proc
ess
may
cre
ate
styr
ene,
ther
efor
e th
e cu
ring
wat
er
mus
t be
rem
oved
fro
m t
he jo
b si
te.
• Sa
fety
mea
sure
s re
late
d to
hot
wat
er a
nd s
team
mus
t be
cons
ider
ed.
• E
very
pro
ject
nee
ds d
iffe
rent
tub
es o
r ho
ses
whi
ch m
ay n
ot b
e av
aila
ble
• B
ypas
sing
of
the
exis
ting
flow
is
man
dato
ry d
urin
g th
e in
stal
latio
n pr
oces
s.
• C
ost-
effe
ctiv
e de
pend
ing
on s
ituat
ion.
• R
educ
tion
of p
ipe
diam
eter
•
Pit e
xcav
atio
n is
requ
ired
for
acc
ess
duri
ng i
nsta
llatio
n pr
oces
s •
For
late
ral c
onne
ctio
ns, o
pen-
cut e
xcav
atio
n is
req
uire
d.
• G
rout
ing
is g
ener
ally
req
uire
d.
• L
arge
wor
king
spa
ce is
nee
ded
for
Fuse
d an
d ex
pand
ed t
ype.
•
Dia
met
er r
ange
ava
ilabi
lity
is li
mite
d.
• L
arge
wor
king
spa
ce i
s ne
eded
for
Fus
ed a
nd e
xpan
ded
type
. •
Dur
ing
the
inst
alla
tion
Byp
assi
ng o
f flo
w i
s re
quir
ed
• T
he l
ocat
ion
of v
alve
s an
d co
nnec
tions
nee
ded
to b
e ex
cava
ted.
• D
iam
eter
ran
ge a
vaila
bilit
y an
d in
stal
latio
n le
ngth
is
limite
d.
• L
arge
wor
king
spa
ce i
s ne
eded
for
fus
ed a
nd e
xpan
ded
type
s.
• B
ypas
sing
of
flow
is
requ
ired
•
Serv
ices
nee
ded
to b
e ex
cava
ted.
•
An
inse
rtio
n pi
t is
req
uire
d.

II.2. HORIZONTAL DIRECTIONAL DRILLING (HDD)
The HDD technology is one of the horizontal earth boring methods that belong to
the trenchless technology construction methods. It is employed in the installation of
several kinds of underground facilities. Industrial applications vary across civil
engineering fields from the installation of natural gas and utility conduit pipelines,
through municipal applications, water mains, gravity sewers, to environmental and geo-
construction applications such as geotechnical investigations and remediation of
contaminated sites (Allouche et al., 2000).
Horizontal Directional Drilling (HDD) is a trenchless technique, which proposes several
advantages over traditional open-cut methods. The HDD was originally developed by the
oil industry in the United States in which this technique is now widely used for installing
all pressure pipes under obstacles such as motorways, large rivers and airport runways. A
steerable drill bit of 90mm diameter starts digging from the earth surface and generates a
pilot hole. Upon completion, the pilot string is removed and a rotating reamer is attached
to travel back along the pilot hole. Subsequent reaming continues until the required
diameter is achieved. (Allouche et al., 2000; Ariaratnam and Allouche, 2000; Ariaratnam,
2005).
According to Allouche et al. (2000), it was found that the majority of pipes installed
using the HDD technique are for 100 mm or smaller diameters, which was about 72% of
the total pipe products installed. Products in this diameter range are mostly used in
telecommunications (e.g. fiber-optic), natural gas distribution systems, electrical conduits
13

and environmental applications. Pipes in the range of 150 mm to 300 mm are found to
have 16 percent of the total product line installed. This diameter range is typically
utilized in crude oil and natural gas delivery systems, municipal applications (i.e. water
and sewer pipelines) and industrial applications. Only 12% of all product installations
account for pipes over 300 mm in diameter, where these pipes are mainly used for
utilizing water trunk lines, sewers and transmission lines. HDD equipment consist of five
group components as explained in Appendix (B): 1) Drill rigs, 2) Bore drilling, 3)
Drilling fluid system, 4) Tracking system, and 5) Accessories.
Allouche el al. (2000) reported that traditional open cut excavation has been gradually
replaced by HDD in various cases because of the high costs associated with utility
conduit installation in crowded urban areas (i.e. traffic control, the need to dig around
existing utilities and restoration costs), consideration of social costs (i.e. traffic delays,
distraction of business activities) and environmental regulations (i.e. placement of
pipelines across rivers, and other environmentally sensitive areas). Allouche et al., (2003)
stated the advantages of the HDD technique over other trenchless technologies as: 1) no
need for vertical shafts as drilling starts from the surface, 2) short installation and setup
time, 3) flexibility of borehole elevation alignment and maneuverability around the
existing underground services, and 4) one single drive installation length is longer than
any other non-man entry trenchless method.
14

II.3. PRODUCTIVITY OF TRENCHLESS TECHNOLOGY METHODS
According to Ali et al. (2007) most of the factors that affect productivity of the
TT techniques are subjective factors, which are usually predicted using heuristic
techniques and expert opinions. These factors complicate the productivity assessment
process. In addition, there is a shortage of models that predict productivity of trenchless
techniques. There are two main steps for TT productivity estimation: 1) assessment of the
effect of subjective factors on productivity and how it can be quantified and 2)
quantitative factor assessment (i.e. duration of activities, labor, equipment rates, etc.). Ali
et al. (2007) have developed a methodology for calculating the productivity Index (PI) in
order to represent the subjective effect in refining productivity assessment. The proposed
PI model was developed using AHP and Fuzzy Logic (FL) based on 12 sub-factors
categorized under three main categories as shown in Figure II.2:
1. Management Conditions
• Managerial skills, safety regulations, mechanical conditions and operator skill
2. Environmental Conditions
• Unseen soil obstacles, water table level, soil conditions and site conditions
3. Physical Conditions
• Pipe type, pipe usage, pipe length and pipe depth
The designed tool demonstrates its robustness in assessing the PI with 89% validity. Due
to the limitation of collected data, the developed models are limited to new HDD and
Micro-tunneling operations, in only clay and sand soils (Ali et al., 2007).
15

->
->
- »
- >
4-Management Conditions
Managerial Skills
Safety Regulations
Mechanical Conditions
Operators Skills
- >
->
->
->
Productivity Factors
V
Environmental Conditions
Unseen Soil Obstacles
Water Table Level
Soil Conditions
Site Conditions
->
->
->
->
1 Physical
Conditions
Pipe Type
Pipe Usage
Pipe Length
Pipe Depth
Figure II.2 TT Productivity Qualitative Factors (Adopted form Ali et ah, 2007)
II.3.1. Previous Work in Micro-Tunneling Productivity
Nido et ah, (1999) identified the factors that influence micro-tunneling
productivity based on expert opinion:
Cutting Head Soil Conditions Separation equipment Geotechnical investigation Use of intermediate jacking station Water jets at the excavation face Use of appropriate machine type Obstruction or unusual soil conditions Groundwater conditions Slurry flow rate
Straight Vs curved alignment Use of lubricant Crew/operator experience Drive length Pipe section length Pipe material Shaft design Technical support Restrictions to working hours Rotating cutter torque
16

The limitation of Nido et ah, (1999) work was that the significance/effect of the above
factors on productivity of micro-tunneling operations was not presented. However,
understanding the relative importance of these factors is very essential. Actual data was
collected by Nido et ah, (1999) to predict the productivity of the micro-tunneling
machine with a diameter of 305mm using simulation techniques. Penetration rate, cycle
time, and daily production were recorded. On the other hand same factors were predicted
for a number of percentage combinations of sand and clay. The research concluded that
soil condition has the most significant influence on productivity, followed by the jacking
system, which affects the operation performance (Nido et ah, 1999).
Based on a pilot survey conducted to validate and rank twenty factors that affect micro-
tunneling productivity, Hegab (2003) developed a statistical productivity model for
micro-tunneling operations. Preparation, delay and penetration times were modeled. A
deterministic technique was used to predict the penetration time in different soil types,
while a probabilistic technique was used to predict preparation and delay times. The
factors are classified into four categories to facilitate the analysis of the results. The most
important category was found to be the underground conditions followed by the
operator's experience. This was followed by the system mechanism and finally "others".
Productivity factors were ranked as follows:
17

1. Soil Conditions 11. Shape of cutting tool 2. Geotechnical investigation 12. Drive length 3. Crew/operator experience 13. Technical support 4. Obstruction or unusual soil conditions 14. Working hours 5. Use of lubricant during tunneling 15. Slurry flow rate 6. Rotating cutter torque 16. Water jetting 7. Jacking thrust and its maximum limit 17. Shaft design 8. Separation equipment 18. Ground water condition 9. Curved alignment 19. Pipe section length 10. Machine type 20. Pipe material
In order to calculate the overall productivity of the micro-tunneling machine for different
soil types, Hegab (2005) used 17,000 data points collected from thirty-five micro-
tunneling projects to develop a probabilistic model using statistical regression techniques.
The developed model is considered as a tool to help the contractor estimate costs in
bidding phase before any operational data has been obtained. It should be noted that
quantitative factors were only considered in this research. Nevertheless, most of the
factors affecting the productivity analysis are qualitative where the soil type has the
largest influence in productivity prediction (Hegab, 2003). However, it was hard to
incorporate this factor in a statistical model due to the lack of sufficient data. Therefore,
the proposed factors that are affecting the project time prediction model were driven
length (L), machine diameter (D) and number of driven pipes (n). The overall time was
given as follows:
Overall Time - Penetration Time + Preparation Time + Delay Time
Equation II 1
18

According to Hegab (2005), soil was classified according to its shear strength, into three
categories:
1. Soil with high shear strength (hard clay and dense sand (H/D Soil)).
2. Soil with medium shear strength (medium clay and medium sand)
3. Soil with low shear strength (soft clay and loose sand (S/L Soil)).
The model developed by Hegab (2005) was limited to the applications with drives of
length less than 400 m., diameters between 400 and 1760 mm., a jacking force of 700
tones, and shearing forces less than 300 tones.
H.3.2. Previous Work in Auger Boring Productivity
According to Iseley and Gokhale (1997), which defined the factors affecting the
selection of trenchless technology methods; and Nido et al. (1999), which identified the
factors affecting the micro-tunneling methods; Salem et al. (2003) found that upon
conversations with auger boring contractors, it was found that micro-tunneling and auger
boring productivity factors are common. The main factors affecting auger boring are as
follows:
1. Cutter head
2. Boring machine and equipment 3. Drive length, Length of pipe section 4. Accuracy of geotechnical
investigation 5. Soil condition 6. Crew and operation experience 7. Diameter of borehole and casing
needed for installation
19
8. Installation depth 9. Obstruction or unusual soil conditions 10. Ground water conditions 11. Restriction to working hours 12. Appropriateness to auger boring method 13. Accuracy of line and grade 14. Existing under/above ground utilities and
structures 15. Pipe alignment and laying path.

Research was conducted by Salem et al. (2003) in order to study the effect of bore length
on productivity and cost of auger boring operations. Two simulation models were
developed using Micro-CYCLONE and Arena to simulate the auger boring process and
predict its productivity. Both simulations illustrate that as the bore length increases the
productivity increases. This is due to the fact that when repetition of drilling and auger
removal cycles at one location are increased, the number of shafts, necessary blocks and
installation time are reduced. This model was limited only to the effect of bore length on
auger boring productivity and cost. However further studies are essential to understand
the influence of other factors like casing diameter on productivity and cost, and to obtain
a more accurate tool to help contractors in planning, productivity prediction and cost
estimation.
II.3.3. Previous Work in HDD Productivity
Over the last 15 years, the horizontal directional drilling (HDD) industry in North
America has grown from a few contractors concerned about a few directional drilling
units operations, to a multi-billion dollar industry (Kirby et al., 1997). During 1998,
about 20 million meters of underground pipes were installed across North America
through the use of approximately 6,000 directional drilling rigs, where it was owned and
operated by hundreds of devoted HDD contractors and general underground construction
corporations (Allouche et al., 2000).
At present, Canada and USA is facing a growing problem to rehabilitate its decaying
underground utility systems (Ali et ah, 2007). Currently, HDD has become the chosen
20

method for new underground conduits and pipeline installations (Lueke and Ariaratnam,
2005). The number of HDD contractors has increased as a result of the growth in size and
difficulty of the HDD projects. Therefore, there is a need to develop devoted software to
meet the special needs and requirements of the industry (Allouche et al., 2003). Due to
the lack of HDD productivity prediction models, the research literature is extended to
productivity prediction models of earth boring trenchless technology techniques (i.e.
micro-tunneling, auger boring), in addition to the available horizontal directional drilling
previous works.
Allouche et al. (2000) stated that the subsurface conditions and pipe diameter are the two
main factors affecting productivity in the utility projects. In his research, contractors were
required to identify the average productivity rate in terms of meters per day (based on an
8-h day). The following conclusions were obtained:
• Productivity decreases when pipe diameter increases.
• Drilling in clay and silty clay resulted in the highest productivity scores.
• Drilling in cobble and gravel resulted in the lowest productivity scores.
• Drilling in sand and sandstone resulted in reasonably satisfactory productivity
rates.
A comprehensive geotechnical investigation is essential to determine the suitability of the
trenchless installation technique and the potential productivity of construction.
Productivity is highly dependent on the geological makeup of the working area, therefore
21

it is always difficult to predict with certainty, since the borehole only gives a snapshot of
the ground at one small location (Dubey et al. 2006).
i. Deterministic Productivity Model for HDD
Dubey et al. (2006) developed a deterministic productivity assessment model for
HDD. Data was collected from several contractors in Canada and the USA. The model
was validated through two case studies:
• 40 mm PE Pipe inserted beneath a green area for a distance of 880 ft in sandy soil.
• 60 mm HDPE inserted in a roadside area in a sandy soil.
Two regression linear models were designed between bore length and cycle time, to
calculate the productivity of HDD operations.
The study considered several factors in order to have a full productivity prediction of the
entire HDD installation process as follows:
• soil Type (sand and silty sand), • rig size and capabilities, • drilling bit (compaction head or mud motor), • pipe/cable [material (HDPE, steel), diameter, and type of connection, • bore characteristics (length and curvature), • connection type between pipe segments (fusing, joint), • operator skill, • weather conditions, • job and management conditions, and • steering problems (correction in direction).
Dubey et al., (2006) defined two main steps to set different productivity factors: first
major HDD steps (pilot hole drilling, pre-reaming/Hole enlargement and pipe pull back)
and second minor HDD steps (rod angle adjustment at the entrance, joining of drill pipe
22

segments, attachment of reamer with shackle for pre-reaming, connection of pipe/cable
segments, pipe assembling for the pullback and tracking and monitoring). The skills of
contractor and his or her expertise, coupled with the geological conditions of soil, were
found to be the most significant considerations for HDD operations productivity.
The study considered the connection type between pipe segments (fusing, joint) as a
quantitative factor which will be considered in site preparation time. This is a major
limitation. In addition, in some cases, pipe connection time may exceed the site
preparation time. Moreover, uncertainties were not considered in this study.
ii. Software for Planning and Cost Control in Directional Drilling Projects
Allouche et al., (2003) developed two computerized applications tailored for the
HDD industry. The first is an integrated data management system for trenchless
contractors (IMS-TC) that combines asset management, cost control, estimating, and
project tracking capabilities, enabling decision makers to intimately monitor field
performance in terms of expenses and productivity, see Figure II.3. The second is a
simulation model developed to optimize the utilization of drilling rigs and hydro-vacuum
trucks on large-scale urban projects.
II.4. NEUROFUZZY APPROACH
The integration of neural networks and fuzzy logic are receiving attention for use
in the development of real-world applications (Medsker, 1996). A neurofuzzy approach
refers to a hybrid of artificial neural networks and fuzzy logic.
23

Maintenance Records Daily Productivity Date
Equipment Maintenance Data
Project Status
Time series analysis of * expenditures
Administration of inpnt data and information inquires
Preparation of reports and summaries
Estimating Financial Planning
Figure II.3 Conceptual Layout of IMS-TC (Allouche et al, 2003)
II.4.1. Artificial Neural Networks (ANN): Theory and Applications
Neural Network Technology mimics the brain's own problem solving process.
Similar to human thinking and decision-making ability, a neural network takes previously
solved examples to build a system of neurons that makes new decisions, classifications
and forecasts. Neural network learns patterns that are being presented to it during the
training or learning phase. During the course of training, it develops by itself, the ability
to generalize, thereby becoming able to correctly classify new patterns or to make
forecasts and predictions.
Network Structure: The basic building block of neural network technology is the
simulated neuron. An independent neuron is interconnected into a network. The neuron
24

processes a number of inputs fed into it, to produce an output in terms of network
classification and predications as shown in Figure (II.4). The neurons have weights
associated with them that are applied to the values passed from one neuron to the next. A
group of neurons is called a slab. Neurons are also grouped into layers by their
connection to the outside world. There are three types of layers as shown in Figure (II.5).
The first input layer takes the inputs from the user, whereas the last layer (output layer)
shows the network output. Neurons in between the input and output layer are in the
hidden layer(s). A layer may contain one or more than one slab of neurons.
Network Learning: A typical neural network is a back propagation network that
normally has three layers of neurons. Input values in the first layer are weighted and
passed to the second hidden layer. Neurons in the hidden layer fire or produce outputs
that are based upon the sum of the weighted values passed to them. The hidden layers
pass values to the output layer in the same fashion, and the output layer produces the
desired results. The network learns by adjusting the interconnection weights between the
layers. The answers that the network is predicting are repeatedly compared with the
correct answers, and each time the corresponding weights are adjusted slightly in the
direction of the correct answer depending upon the settings chosen for learning rate and
momentum. Eventually, if the problem can be learned, a stable set of weights adaptively
evolves and produces good answers for all of the sample decisions and predictions.
Neural Network Modeling Applications: Since the proposal of the back-propagation
algorithm, a number of successful neural network models have been developed (Fletcher
25

and Goss 1993; Karunanithi et al, 1994; Refenes et al. 1994; Faghri and Hua 1995; Goh
1995; and Chua et al., 1997). The application of neural networks in civil engineering can
be traced to the late 1980s (Zafar, 2005).
Al A2
An
Teaching Input
7 \
; '1 NEURON ft
Teach / Use
^> Output
Figure II.4 Neuron -The Information Processing Unit
Output Layer
Hidden Layer
Input Layer
Figure II.5 Typical Back Propagation Neural Network Architecture
26

Karshenas and Feng (1992), and Chao and Skiniewski (1994) developed neural network
models to analyze the productivity of earth-moving equipment and predict excavator
productivity, respectively. Their studies examined the effect of the operational elements
on the productivity. Portas and AbouRizk (1997) developed a neural network model to
predict the productivity of concrete formwork tasks in construction operations. Abu Rizk
and Hermann (2000) estimated the industrial labor productivity by developing a
probability inference neural network model. Another neural network methodology is
presented by Abu Rizk (2001) in developing a model for the estimation of industrial labor
production rates.
Moselhi (2005) introduced a neural network model capable of quantifying the impacts of
change orders on construction labor productivity. Samer and Sharara (2006) developed
three productivity estimation models to calculate the concreting time using the artificial
neural network (ANN). Productivity estimation models have been developed to estimate
the productivity of formwork assembly, concrete pouring and steel fixing activities. The
artificial neural network (ANN) approach was used in developing these models in order
to overcome the variability and impact of subjective factors on the cost of concrete-
related activities in developing countries. The study considered fourteen qualitative and
quantitative factors. The developed framework results indicate a relatively strong
generalization capability. In addition, the sensitivity analysis of the input factors that are
influencing the productivity of the developed three models, demonstrated a good
potential in identifying trends of these factors. Elwakil et al. (2009) developed a NN
27

model to predict the performance of a construction organization based on estimated
values of its success factors.
II.4.2. Fuzzy Logic: Theory and Applications
The potential of fuzzy expert systems lies in their ability to handle imprecise,
uncertain and vague information used by human experts. Fuzzy knowledge based expert
systems are of two types; subjective and objective. The objective models are constructed
from input and output data of the system by using a systematic process with a specific
objective function. In either case, a set of Fuzzy IF-THEN rules forms the fuzzy
knowledge based body of the system. This fuzzy knowledge based system identification
and modeling process is composed of two parts; variable identification and factor
identification.
In variable identification, the significant variables of the system are identified among the
set of possible variables, as shown Figure (II.6). In factor identification, the factors of the
knowledge based systems that describe the relationship between input and output
variables are identified. These are the factors of the membership functions (i.e. the factors
describing the rules). For variable identification and modeling a problem, fuzzy
clustering is utilized. Fuzzy clustering is a process to obtain a partition Z of a set A of N
objects -*-i = (1, 2, 3, N) using a resemblance or dissemblance measure such as
distance measure 'd' between Xj and Xj, where i, j =1, 2, 3.. .N. A partition Z is normally
a set of disjoint or partially overlapping subsets of A, and the elements ZC of Z are
28

regarded as clusters centers. The intended purpose of clustering is to segregate the data
into its natural grouping sets to produce a concise representation of a system's behavior.
1 Rule Generation
*
Fuzzy System Modeling
1
System Identification
1 I
Identifing Variables
i
Identifying Parameters
L r
Input Selection and Membership
+ Reasoning Mechanism
1 Membership
Function Tuning
1 Inference Parameter
Adjustment
Figure II.6 Schematic of Fuzzy System Modeling
Fuzzy Logic Modeling Applications: During the last decade, "Fuzzy Techniques" have
been increasingly applied to the construction management research discipline (Albert et
ah, 2009). Fuzzy logic applications can be seen in the disciplines of project scheduling
(Ayub and Hadlar, 1984), resource strategies (Padilla, 1991), resource constrained
scheduling (Loterapong, 1984), and project network analysis, (Loterapong and Moselhi,
1996).
Zayed and Halpin (2004) developed a productivity index model using analytic hierarchy
process (AHP) and Fuzzy Logic to assess the effect of subjective factors on the
productivity of bored pile construction. Fayek and Oduba (2005) developed a model to
predict labor productivity of two common industrial construction activities; rigging pipe
29
and welding pipe. The fuzzy expert systems were used in developing these models in
order to overcome the impact of variability and subjective factors on real world activities.
The application of fuzzy expert systems (FES) framework based on fuzzy IF-THEN
rules, relates the linguistic input and output factor(s) together. The IF-THEN rules are
composed of fuzzy premises and fuzzy conclusions, which are represented by the
membership functions of the input and output factors, respectively.
II.4.3. Neurofuzzy Systems: Theory and Applications
The application of the neurofuzzy technique is based on the integration of the
explicit knowledge representation of the fuzzy logic with the learning power of the neural
networks (Simon and Biro, 2005). A common characteristic of neural and fuzzy systems
are model-free function estimators that can be adjusted or trained for improved
performance, where they are by nature readily implemented with parallel processing
techniques. Neural networks consist of a connection among a distribution of nodes. In
addition, fuzzy systems process rules that associate, in parallel, fuzzy inputs with fuzzy
output sets (Medsker, 1996). Neurofuzzy logic can be implemented throughout different
types including, Neurofuzzy Systems for Function Approximation, NEFPROX (Nauck
and Kruse, 1999), Adaptive Neurofuzzy Inference Systems, ANFIS (Jang et al, 1997),
and Adaptive Spline Modeling of Data, ASMOD (Bossley, 1997). The ASMOD split the
model into smaller sub-models using the involved global partitioning. One option of
integrating neural networks incorporating fuzzy techniques and produce an improved
performance neural network, is to allow the neurofuzzy network to receive and process
fuzzy input.
30

Another approach is adding layers on the front end of the network to "fuzzify" the crisp
input data to the fuzzy neural processing. The fundamental concept used in many
approaches to integrate fuzzy and neural network is the fuzzy neuron. Nodes in every
layer in networks that maps fuzzy input to crisp output can have modified neurons. The
mechanism of a neurofuzzy system can simply be explained as having the input vector
consist of a set of fuzzy values, as well as having the connection weights of the nodes to
the nodes in the previous layer in fuzzy values, as shown in Figure (II.7). In addition, the
weights and input values are each represented by a membership function. A further
summation process is implemented to find the product of the membership function of the
fuzzy inputs and weights and then add the resulting membership function to get another
single that represents the integration of weighted fuzzy inputs to the node. Lastly, a final
operation takes place on the resultant finding out a crisp value for the node output
(Medsker, 1996).
Figure II.7 Basic Structure of A Neurofuzzy System (Adapted from Bossley, 1997)
31

Neurofuzzy methods provide supervised learning methods. The heuristic methods
combine the two learning steps of competitive learning with the idea of error back
propagation. After a system output is computed by a forward propagation, an output error
is identified by comparing the given sample output data with the system output. The
neural networks can be used as the design and tuning tool for the fuzzy system where,
fuzzy principles can be used in the neural network design embedding fuzziness in the
internal workings of the basic neural system (Medsker, 1996).
A Major limitation of the fuzzy systems is that as the number of system inputs and
outputs increases, the designing of the fuzzy rule base becomes complicated. Neurofuzzy
networks can have three main functions, as shown in Figure (II.8). The starting layers
process crisp input data by assigning groups of nodes to the linguistic variable labels and
implementing membership functions in nodes (Medsker, 1996).
Fuzzifier
Crisp Data , Input
Fuzzy Rules 0 •
r—2
:
•
(O 1 '
Evaluator | and i Defuzzifier
i «\.
! • /
o 6
« •
V
Figure II.8 High-Level View of aNeuro-fuzzy Network
32

Therefore, crisp input data can be transformed into membership function values that
represent the output of the first layers of nodes. These values move to the layers that
function as fuzzy rules operating on the fuzzified input. Finally, the last layers collect the
results of applying the rules and defuzzify the results to get crisp values that can receive
further processing as part of a decision or control system, or become outputs of the
network. The neurofuzzy network can be implemented as several layers of nodes, where
these first layer nodes can correspond to the different crisp values in the input vector.
Furthermore, they can distribute those values to sets of nodes in the second layer which
represent the different linguistic variables (Medsker, 1996), as shown in Figure (II.9).
Research and development addressing the neurofuzzy approach is proceeding at a rapid
rate as of the distributed nature of neural and fuzzy systems, which provides such rich
opportunities for creative combinations of the two for powerful, useful implementations.
The goal of fuzzy systems is to mimic the aspect of human cognition that can be called
approximate reasoning, in which it is more like our every day experiences as human
decision makers. Fuzzy systems allow users to give inputs in imprecise real-world
situations and reason terms like tall, large or rarely and use them to give either fuzzy or
precise advice (Medsker, 1996).
Kohonen network Multilayer NN with backpropagation
Rule generation
Rule base
Membership functions
Tu ning
Figure II.9 Overall Architecture for Neurofuzzy Learning Control System (Medsker, 1996)
33

Neurofuzzy Modeling Applications: Symeon (2004) utilized the neurofuzzy systems and
multidimensional risk analysis algorithm to present a methodology for reaching the
optimum bid markups in static competitive bidding environments. In order to assess the
engineering performance in industrial construction projects, engineering performance
predicting models were developed by Georgy (2000); Georgy et al, (2005) and Georgy
and Chang (2005) to predict such performance by utilizing the neurofuzzy intelligent
systems. The data set used for the study consisted of 50 industrial construction projects,
in which the model was developed based on 25 input parameters.
A performance prediction model is developed to estimate the engineering performance in
industrial construction projects. A neurofuzzy approach is used in developing this model
because of their fault tolerance, ability to model nonlinearity and their systematic
procedure for modeling linguistic variables. The application of NF network framework
passes through two phases; training and validation. In the training phase, the qualitative
variables are translated into numeric format (i.e. project size, contract type). The training
phase consists of five steps that are: 1) data input, 2) data fuzzification, 3) intermediate
layer, 4) data defuzzification and 5) data output. In the validation phase, the data subset is
fed into the trained NF network to generate the outputs that will be later compared to
confirm the neurofuzzy model validity. Based on different factors such as; project size,
contract type, relative size of project, relative level of complexity and site conditions, an
engineering prediction model is developed.
34

Twenty-five input variables (three numeric and 22 linguistic) are identified and selected
based on data availability. The system architecture is composed often NFs. Each network
deals with one of the identified performance measures, in which 10 performance
measures are addressed. Chae and Abraham (2001) developed this model by obtaining
data from the Sewer Scanning and Evaluation Technology (SSET) for the City of San
Jose, California. The development of the automated interpretation system using ANN's is
divided into four steps - image acquisition, preprocessing, defect recognition using
multiple neural networks, and estimation of overall condition using fuzzy system, as
shown in Figure (11.10). A fuzzy implication technique identifies, classifies and rates pipe
defects while minimizing the errors from the neural network system. The major
advantage of using a fuzzy system is that instead of sharp switching between modes
based on break points, the outputs can glide smoothly from regions where the system's
behavior is dominated by either one rule or another. The distance between joint and crack
is taken between 0 to 10, where 10 signifies a large distance, and number of cracks
detected is taken 0 to 20, where 20 is the maximum number of cracks in a pipe section.
Data acquisition
and digitization
y
Preprocessing
image
Image recognition using
multiple ANNs
Identify defects using fuzzy estimator
ANN A^ft&K»cfCtt3»
we talsnli
\— f\>—1 *"r Esm*or
Ortfjl CflfdlfflA <f the pipe
Figure 11.10 Model Methodology Using NeuroFuzzy System
(Adopted from Chae and Abraham, 2001)
35

U.S. NEUROFUZZY SYSTEM VS NEURAL NETWORKS
Shahin et al. (2003) developed a model to predict the settlement of shallow
foundation on granular soils. The model is also used to provide a better understanding
regarding the relationships between settlement and the factors affecting settlement. The
model is developed by using neurofuzzy techniques to overcome the multi-layer
perceptions (MLPs) shortcoming, which occurs in the knowledge that is acquired during
training, is distributed across their connection weights in a complex manner that is often
difficult to interpret. Therefore, in MLPs it is difficult to quantify the rules governing the
relationships between the network input/output variables.
The results indicate that neurofuzzy networks are able to make good predictions for the
settlement of shallow foundations on granular soils and are able to provide a clear
understanding of the relationships between settlement and the affecting factors. Also, the
results indicate that modifying neurofuzzy networks by fitting it in existing engineering
knowledge can enhance model performance and improve the constructed model
interpretation.
Neural networks play a significant role in detecting complex non-linear relationships
between a set of inputs and outputs. In addition, they aid in the estimation of the
magnitude of the relationships without requiring a mathematical description regarding
how the output functionally depends on the input (Taylor, 1996). However, the neural
network interpretation cannot be expressed in a simple form (Colobourn, 2003).
Nevertheless, the use of sensitivity analysis makes it possible to interpret simple models
36

(Olden and Jackson, 2002). Therefore, hybrid systems are needed, as it is difficult to
handle complex models with large numbers of inputs. Neurofuzzy is one approach to
increase insight (Shao et al, 2006) where it integrates the generality of representation of
fuzzy logic with the adaptive learning capabilities from neural networks (Zadeh, 1965).
Neurofuzzy not only can produce predictive models as a neural network, but it also
generates understandable rules in an "IF-THEN" format explicitly representing the cause-
effect relationships (Shao et ah, 2006).
Shao et ah, (2006) compared the performance of neurofuzzy logic and neural networks as
applied to an immediate release tablet formulation database. Both approaches are
successful in developing quality models that gave good predictions. Neural network
models showed a better capability of predicting unseen data than neurofuzzy logic
models (as judged by validation R2). Nevertheless, neural networks are not able to show
or give information about how output is reached. In addition, while training new data, the
existing knowledge held by the trained network can be lost. Conversely, the neurofuzzy
technique has the advantage of generating understandable and reusable knowledge. The
generated neurofuzzy rule sets revealed the hidden knowledge from within the
interrogated data set.
II.6. ANALYTIC HIERARCHY PROCESS (AHP): Theory and Applications
Saaty, (1982) stated that construction hierarchies, establishing priorities and
logical consistency form the basis for analytical problem resolution. Ersoz, (1995)
defined AHP as a theory of measurement that deals with qualitative and/or intangible
37

criteria that affect a decision. Saaty, (1982; 1991) addressed several steps to model a
problem using AHP, which are summarized as follows:
1. Setting up hierarchy
Problem definition and development of a hierarchy, which defined problem by breaking
it down into its components, are carried out.
2. Pair-wise comparison matrix
Through the use of a pair-wise comparison matrix that compares the identified factors
with themselves, the AHP structure relation is established. The main matrix diagonal has
a value of one, where the elements below the main diagonal are the reciprocal of the
elements above.
3. Assigning Priorities
The matrix is then filled by numerical values representing the relative importance of one
factor over the others based on the common attribute they share to achieve the main goal.
A priority ratio could be established based on a qualitative scale of 1 to 5 or 1 to 9. This
method could be applied on both qualitative and quantitative data. The higher the factor
value the greater the relative importance will be.
4. Establishing priority vector
Saaty (1982) developed the eigenvalue method and used it to calculate the weighting
vector for each pair-wise matrix. The overall priority weights for each factor are achieved
by using the matrix eigenvalues according to Saaty's (1982) method. The results provide
the relative weights for each factor on a scale out of 1.0. The weight of each factor
represents its relative importance among all factors.
38

5. Logical consistency
Calculating the consistency ratio helps decision makers check on the previous step by
verifying that the achieved results are acceptable and the consistency ratio is equal to or
less that 10%. If inconsistent results of more than 10% were achieved, then decision
makers have to repeat the weighting process until a consistent result of 10% or less is
achieved.
6. Combining priority weights
Lastly, decision makers linearly combine the various priority matrices to achieve the final
rank for each factor.
AHP Application in Engineering Research: Semaan (2006) developed a condition
assessment model for subway stations. His model identified and evaluated the various
functional/operational criteria for subway stations; architectural, structural, mechanical,
electrical, security and communications criteria. He utilized AHP in order to determine
the criteria weights. Hassan (2006) and Hassan and Zayed (2006) used the AHP
technique to develop a condition rating model for the evaluation of water mains. They
utilized the AHP to set the hierarchy for the factors that contribute to water main
deterioration. Consequently, using the pair-wise comparison matrix of the main factors
and sub-factors, the relative importance weight of these factors are obtained, in which
each factor weight represents its relative importance among the other factors. Zayed and
Halpin (2004) used AHP and Fuzzy Logic to assess and identify the effect of subjective
factors of bored pile construction productivity. Fuzzy logic and AHP approaches were
used in developing this model by translating the subjective modeling factors into
39

quantitative measured values in order to overcome the impact and variability of
subjective factors on the bored piling activities.
II.7. SUMMARY OF CHAPTER II
HDD is a complex construction operation. Its productivity depends on various
uncertain factors, which affect construction time. HDD is a relatively new technique to be
used in wide infrastructure market. As a result, literature in predicting its productivity,
estimating execution time, cost and number of man to accomplish the job is not available.
Due to the lack of HDD productivity prediction models, the literature was extended to the
previous work done on productivity prediction of other HEB techniques (micro-tunneling
and augur boring) and the factors affecting their productivity. However, Dubey et al.,
(2006) developed a simplified deterministic productivity assessment model for HDD.
Their application is based on few incomplete projects and they validated their results by
two projects only, in which two linear regression models were designed between bore
length and cycle time. The model is limited to operations in sandy and silty sand soil and
medium drilling rigs. In addition, installed pipe connection time is not considered for this
study, while soil type, pipe material and diameter, drilling bit capabilities are considered
to affect the drilling, pre-reaming and pull back time. Other factors such as weather
condition, contractor experience and job & management conditions are entered as
efficiency factors. Moreover, Allouche et al., (2003) developed two customized computer
applications for the HDD industry. The first software is designed to intimately monitor
field performance in terms of expenses and productivity, while the second is developed to
optimize the utilization of hydro-vacuum trucks and drilling rigs. Accordingly, current
40

research proposes productivity prediction models for HDD operations in clay, rock and
sand soils, using AHP and NF approaches. The proposed decision support tool can be
used as a pre-investigation tool during the bidding phase to help allocate crew, budget
and time.
41

CHAPTER III
RESEARCH METHODOLOGY
Research on factors affecting TT industry and its construction progress rate has
gained more attentions in recent years. This research intends to analyze and identify the
factors that affect the HDD construction method and to develop a model to predict HDD
productivity in the pre-construction phase taking into account both practical and
academic concerns. Canadian municipalities as well as contractors, consultants and
infrastructure professionals worldwide might find benefit from this study.
The research methodology (see Figure III. 1) is proposed in order to conduct the target
research work. Data collection and analysis come along with the thorough literature
review related to factors affecting productivity of HEB systems with a focus on HDD.
Also, literature review is extended to previous models conducted to calculate HDD
productivity, neurofuzzy modeling techniques and AHP. A new automated HDD
productivity prediction model is developed, followed by conclusion of present work and
recommendations of future work..
III.1. LITERATURE REVIEW
This literature review focused on factors that affect HEB techniques in the
construction industry, particularly HDD technique. In addition to HEB and HDD, current
productivity prediction practices and the neurofuzzy systems and its productivity
modeling applications were also reviewed. Moreover, a literature review was performed
through interviewing site engineers, contractors, industry professionals and researchers as
42

well as through intensive readings of the related papers, journals, thesis and related
books.
Literature Review & Expert Knowledge
Problem Formulation
• Data Acusiton Qualitative Productivity
Factors
Neuro-fuzzy
Identify Productivity Factors
Generic Productivity Prediction Model Development
Productivity Prediction Model Verification, Validation and Automated Use.
Identify Input Variables And
HDD Productivity Measures
Questionnaire
Quantitative Productivity
Factors
Data Analysis and
Preparation
Statistical Analysis
Productivity Factors Ranking and Selection
(AHP)
Neuro-fuzzy System For Input Output Relationship
Verification & Validation
Prediction of HDD
Productivity
Sensitivity Analysis
Figure III. 1 Schematic Methodology of Studying HDD Productivity Prediction
43

III.2. FACTORS THAT CONTRIBUTE TO HDD PRODUCTIVITY
The presented study focuses on both quantitative and qualitative factors affecting
productivity calculation. Due to lack of HDD productivity studies, the thorough literature
review on HEB techniques and available previous studies on HDD productivity, as well
as the industry experts, resulted in the identification of thirteen main factors as being the
most significant factors affecting the HDD industry. These thirteen factors are
categorized under four main categories; management conditions, mechanical conditions,
environmental conditions and pipe conditions.
HI.2.1. Management Conditions
i. Crew and Operator Skills
The experience of the crew and rig operator might have a direct impact on the
preparation time and finishing time of pipe installation (Hegab, 2003). A three-person
crew is sufficient for Mini-HDD rigs. Skilled operators finish the job faster, avoid losing
the connection with pipes and maintain the right pipe track, (Dubey et ah, 2006).
Therefore, crew experience, harmony and understanding can directly affect project
productivity.
iu Rig size/Drilling Bit Capabilities
The bore length in HDD operations is determined according to the soil type and
the site conditions. The selection of the appropriate machine type may affect the
complexity and productivity of the operation. Drilling bit and reamers have teeth or
cutting disks that are used for soil excavation. The design, inclination, shape, strength and
number of teeth, in addition to the rotational force applied to the drill stem joints affect
44

the performance of drilling the pilot hole. Accordingly, it is important to choose suitable
drilling bit and reamer for given soil conditions and bore size.
Hi. Legal Issues and Safety Regulations
According to safety manual, which is submitted during the bidding phase,
contractors include operating procedures that comply with the applicable regulations,
such as excavations and shoring of pits when required. In addition, the installed pipe
section must be cleaned prior to the introduction of the product (Ariaratnam and
Allouche, 2000). These activities might affect preparation time of installed pipe and may
have an indirect effect on productivity.
IH.2.2. Mechanical Conditions
i. Machine Conditions
It is recommended to have periodical technical visits by a technician from the
machine manufacturer for all projects to ensure fast problem solving (Hegab, 2003). The
condition of the machine affects the performance speed, accuracy and quality of the HDD
operation.
it Slurry Flow Rate
Slurry is used during the HDD borehole drilling and back reaming accompanied
with the pipe pull back. The slurry minimizes the friction between the soil and the drilling
head/installed pipe. In addition, it carries the muck out of the drilling hole. Moreover, the
slurry acts as a lubricant for the pipe that facilitates its insertion and being laid in its
place, and support the annular space around the pipe to prevent earth settlements.
45

Accordingly, HDD equipment performance is affected by the flow rate of slurry, which
may affect the production rate indirectly.
Hi. Steering Problems (Correction in Direction)
The steering tool is placed within the first drill rod, located directly behind the
drill bit. The steering tool is connected to the control unit to be able to direct and locate
the drilling bit. Any error occurs from the steering tool may cause work delay in which a
direction correction process might take place.
III.2.3.Environmental Conditions
L Geotechnical investigation and Soil Type
The quality and quantity of the available geological information during the design
and bidding phase is very important in estimating the production rates, shaft design and
maximum drive length for any construction method (Allouche et al., 2001). Geotechnical
investigations are used to define the existing soil types and conditions to enable the
contractor to make the best arrangement for the HDD machine and to choose the most
suitable equipment for maximum productivity.
ii. Unseen Soil Obstacles/Buried Utilities
Unforeseen ground conditions represent major challenge to the HDD machine.
Obstructions, buried utilities, old foundations and unexpected soil conditions might cause
a loss of connection with the drilling head and delay the whole pipe installation process.
HDD drilling bits are used according to soil type and pipe length. Machine performance
might drop dramatically as the number of boulders exceeds the drilling head capability
limit. In addition, slurry system may be damaged by rock fragments (Hegab, 2003).
46

Hi. Site and Weather Conditions
Ariaratnam and Allouche (2000) stated that prior to job initiation, work field
should be visited for visual inspection to address some important issues that affect quality
and speed of work (i.e. sufficient room for entrance and exit pits; HDD equipments;
support vehicles; and fusion machines). In addition, it is noted from HDD experts that
weather conditions have a major effect on the HDD pipe installation process.
Temperature, humidity, rainfall and snowing might cause an obvious delay in work due
to their direct effect on the machine, soil and worker productivity.
III.2.4.Pipe Conditions
i. Pipe Material (HDPE, Steel, PVC)
The effect on productivity by pipe material is realized as a result of friction
between pipe and soil. However, slurry flow acts as a lubricant to facilitate pipe
alignment. Therefore, as long as the pipe material is well fabricated and properly
installed, material should have no major effect on productivity (Hegab, 2003). HDD pipe
installations require special pipe characteristics. The installed pipelines must show high
tensile and buckling strengths. In addition, pipelines must be flexible enough to allow
curved alignment that exists in HDD pipeline installations (Allouche, 2003). High-
density polyethylene (HDPE) and steel are the two most common pipe materials that
have been installed by using HDD (Ariaratnam, 2001).
iu Pipe Length
The pipe section length affects preparation time and entry shaft size for pipe
installation. By increasing pipe section length, both construction cost of entry shaft and
47

construction time increase (Hegab, 2003). Hence, it is concluded that pipe section length
through both aligning of drilling segments and preparation time affects HDD process.
UL Pipe Depth
The increase of pipe installation depth increases installation time of the pipe;
however, it decreases the risk of hitting buried utilities. Depth of installation affects the
productivity indirectly (Hegab, 2003). To prevent heaving or hydraulic fracturing of the
soil, a sufficient cover depth should be applied when installing a utility pipeline using
HDD. Recommended minimum cover depths for different pipe diameters are as follows:
minimum cover depth of 1.2 m for pipes 50-150 mm in diameter, 1.8 m for pipes 200-
350 mm in diameter, 3.0 m for pipes 750-600 mm in diameter and 7.5 m for pipes 625-
1,200 mm in diameter.
/v. Pipe Diameter
Based on an actual data survey, Allouche et al. (2000) stated that when diameter
increases the productivity tends to decrease. As diameter increases, a multi-reaming
process may take place to reach the desired borehole diameter gradually to avoid earth
heaving. In addition, a longer time is needed for pipe pull back. A rule-of-thumb is to
have a borehole 1.5 times the outer diameter of the installed pipe (Popelar et al. 1997). In
other words, the bigger the diameter, the wider the borehole, which means that multi back
reaming should take place.
III.3. DATA COLLECTION AND ANALYSIS
The main set of collected data includes real HDD project data representing the
project input variables, cycle time and productivity measures which were identified in the
48

problem formulation stage. This set of data was mainly used to train the structure
connections of the neurofuzzy system to properly relate the defined HDD input variables
with the corresponding productivity measures.
A questionnaire was designed based on literature review and interviews of construction
industry professionals to investigate the most effective factors on HDD productivity. The
questionnaire was sent to professionals, consultants, contractors and equipment operators
associated with the HDD technique. The first and second parts were designed to collect
the participant and project's information in which some qualitative and quantitative
factors were involved (i.e. soil type and pipe diameter). The third part collected the HDD
cycle time duration. The last part of the questionnaire collected the effect of the various
qualitative factors on productivity using a unified fuzzy performance scale (i.e.
crew/operator skills, machine condition...etc.). The participants were given the option of
adding more factors and evaluate their impact.
III.4. SCORING AND RANKING FACTORS THAT CONTRIBUTE TO HDD
PRODUCTIVITY
Analysis was implemented using analytical hierarchy process in order to rank the
thirteen factors (discussed in section III.2) that affect HDD according to their relative
importance. The identified factors were compared via a pair-wise matrix, establishing the
AHP structure. The eigenvalue method (Saaty, 1982) was used to calculate the weighting
vector for each pair-wise matrix. Accordingly, the overall priority weights of factors were
achieved. Based on the conducted weights and relative importance ranking, the results
49

were proposed to HDD professionals in which five of these factors were eliminated or
merged. Only eight factors were considered in the presented study. Accordingly, this
research plans to analyze and assess cycle time and productivity using the eight most
comprehensive factors: operation/crew skills, pipe diameter, drilling bit capabilities,
machine condition, unseen obstacles, pipe length and site, weather and safety conditions,
as well as the identification of their relevant impact.
III.5. MODEL DEVELOPMENT
The hybrid integration of neural networks and fuzzy logic is called a neurofuzzy
system. The neurofuzzy systems are capable of addressing nonlinear relations,
minimizing level of uncertainties in modeling, addressing imprecision of input-output
values and modeling linguistic (non-numerical) data. Accordingly, the current research
utilized the neurofuzzy technique in developing the HDDPP model.
The neurofuzzy approach uses the neural network technique to generate fuzzy logic rules
and membership functions automatically. The neurofuzzy network model has three main
functions as shown in Figure III.2. The input layer processes crisp and fuzzy input data of
the eight input factors. Therefore, crisp input data can be transformed into membership
function values that are the output of the input layer. These values move to the next
layer(s), which function as fuzzy rules operating on the fuzzified input. Finally, the last
layer collects the results of applying the rules and defuzzify the results to get the crisp
value representing the HDD predicted output (i.e. productivity).
50

Figure III.2 Basic Architecture of Neurofuzzy Network
The input data of an HDD project will be clustered according to the eight identified input
factors; see Figure (III.3). These eight input factors are clustered into four levels. The
first level identifies the working soil type. The model soil types are limited to clay, rock
and sand due to limitation of collected data. The second input cluster level defines pipe
condition and operational conditions. The third level, pipe length and diameter, represents
pipe conditions and drilling bit capabilities, machine condition, site/weather conditions
and operator/crew skills, which represents the operational conditions. The last input
cluster is the HDD project productivity that represents the targeted model output.
51

• Level 1. HDD Productivity Modeling Factors
Soil Type
Level 2.
• Level 3. 1 (Management^
Conditions
g
Environmental Conditons
1
Buried] grew Skilly/ ^Size) ^ObstaclesJ
i i | f Mechanical ^ [^Pipe Physical^ _) \^ Conditions J V Conditions J
(Site, Weather f Machine ^ f Pipe ^ f~~Pi v^and Safety J v Condition J ^Lengthj Ipiati
Pipe ^Diameter
• Level 4. [Productivity Value I Meter/Hour
Figure III.3 Data Clustering
III.5.1. Model Training
The model implementation is divided into training and validation phases. The
training phase starts by both qualitative and quantitative data entry in terms of factor
weights, cycle time, and production rate, respectively. The model was developed by using
MatLAB® version 7.0 using the Adaptive Neurofuzzy Inference Systems toolbox ANFIS.
The training process starts by data fuzzification where the degree of each factor is
determined. The data then proceeds to the training phase via ANN. The fuzzy outcome is
then deffuzified, where the crisp input factor variable is determined given its degree of
membership. In other words, the functions performed by the neurofuzzy networks are to
fuzzify systems inputs, develop a structure weight that properly represent the nonlinear
52

relationships among the model inputs and outputs, and to defuzzify model outputs. This
system is able to build a relationship between the factors affecting the HDD process and
the overall productivity. Therefore, the model can predict HDD process productivity
given a specified set of project input variables (factors) with an adequate percent error.
This research utilized the neurofuzzy technique as a credible approach for predicting or
estimating HDD technique productivity, because of their fault tolerance, ability to model
nonlinearity and their systematic procedure for modeling qualitative variables.
III.5.2.Model Validation
The developed model is tested during the modeling phase, in which the
neurofuzzy technique can split the modeling data into training and testing data. However,
twenty percent of the total collected data points will be unexposed to the neurofuzzy
system during modeling phase and is used for validation purposes afterwards. Validation
will be performed according to Zayed and Halpin (2005) model, which will be described
in Chapter V.
III.6. MODELING CASE STUDIES
After developing the neurofuzzy models for HDD, three case studies are
implemented using the developed clay, rock and sand NF models. After running the
models and obtaining output (production rate), each case study is validated and the results
are compared to actual calculated onsite productivity.
53

111.7. SENSITIVITY ANALYSIS
After model validation and achieving robust results, sensitivity analysis will take
place to observe how independent factors (e.g. crew and operator skills, pipe diameter,
length) affect productivity of HDD. Sensitivity analysis will be carried out for the case
study of each soil type, in which the studied HDD factor is kept at actual values while
other factors are kept at their constant average values. Sensitivity results are achieved
using MatLAB® (ver. 7.6.0.324) and the developed NF models.
111.8. AUTOMATED HDD PRODUCTIVITY PREDICTION DECISION
SUPPORT TOOL
An automated decision support tool will be designed for the developed HDD
productivity model. The purpose is that the model provides a significant tool to assist
HDD professionals in predicting project production rates and aid them in the
determination of project cost and duration according to Figure (III.4). In this section, a
descriptive example of clay study case will be demonstrated.
A typical prediction of productivity starts usually by recalling data from previous work
done and collecting data related to constraints and requirements of any project. A HDD
user-friendly interface software is developed to help both experienced and new
contractors, engineers, consultants and field experts to establish an estimation of hourly
rate progress in HDD projects. This, in turn, leads to a better understanding of the actual
cost and duration required for the HDD project. The user is required to enter a simple set
of input data that illustrates the project details, environment and user requirements. The
54

system is then performed and derived from the input data. MatLAB starts calling the
developed neurofuzzy system. A report is engendered illustrating the hourly production
rate of the targeted project.
T PHASE - I
TRAINING PROCESS
(Qualitative Data ^ (
Linguistic Factors J iDci
bt Quantitative Data
Deterministic Factors & Production Rate
Input To ANFIS Using MATLab
• Training Process
Problem Solve
I Data Fuzzification J
f ANN j
+ \ C Data ^
Difuz/iflcation )
ANUS Output
D
£ Productivity Rate Cycle Time J PHASE - II
VALIDATION
c Input From Validation Set to The Trained ANFIS )
Testing Process
J Invalid V 1 ANFIS P "
Automation
Process ( Model ^ I Automation )
Figure III.4 Output Input HDD Productivity Prediction Model Mechanism
55

III.9. SUMMARY OF CHAPTER III
The methodology of this research work is presented, in which it illustrates the
following steps:
(1) Literature review was carried out on all main disciplines that are necessary to predict
the productivity of HDD construction method. The review defines the problem, and
provides an overview of the HDD technique, factors affecting the HDD productivity
and the neurofuzzy modeling technique.
(2) Collection of data, this includes real-time project cycle time and affect of qualitative
and quantitative factors on productivity in comprising production rate information.
(3) Use of analytical hierarchy process to establish the relative importance of each
modeling factor; this section ranks the factors according to their effect on
productivity and helps in reorganizing the input factors.
(4) Use of neurofuzzy systems to address prospect of input data. This section defines
main criteria of neurofuzzy systems and use of MatLab 7.0 software that is used to
develop the model,
(5) HDDPP model development; where training, validation and case study application for
each soil type are implemented.
(6) Performing sensitivity analysis to achieved results for three case studies of each soil
type, which studies the effect of the variability of the main input factors to the
analysis of the final predictions.
(7) Generation of the HDD-PP automated user-friendly interface software and the
presentation of the clay case study.
56

CHAPTER IV
DATA COLLECTION
Data collection is the main driving force to this research work. Almost, 220
trenchless technology contractors in Canada and USA were contacted to obtain real time
HDD project data. An online questionnaire was designed and created to help engineers
and professionals easily respond and complete the questionnaire. In addition, traditional
electronic formats and hard questionnaire copies were collected.
IV.l. DATA COLLECTION AND ORGANIZATION
Data are collected through two methods: direct and questionnaire. Direct data
collection is done using onsite interviews, field visits and phone calls. The second
technique is through an online questionnaire. A questionnaire was designed based on
literature review and interviewing construction industry professionals to investigate the
most effective factors on HDD productivity. The survey was sent to professionals,
consultants, contractors and equipment operators in relation to HDD technique, as
depicted in Figure (IV.l and IV.2). The first part was designed to collect the participant
and project information, in addition to pipe dimensions and soil characteristics. The
second part of the questionnaire was designed to collect the HDD cycle time duration and
productivity information. The last part of the questionnaire was designed to collect the
effect of qualitative factors on HDD productivity using a unified fuzzy performance scale
from (1-5), (see Figure IV.3). Approximately, 220 questionnaires were sent to TT
professionals in North America with response rate of 12% (28 projects). All replies
represent the new pipe/cable installations using HDD in clay, sand, and rock soils.
57

Almost 20% of data are excluded from the modeling phase in order to be used for
validation purposes.
QUESTIONNAIRE
I. Personate Information
Name: Email: Phone:
II. Time and Pipe Information:
Please select one previously completed project for each questionnaire you will be completing and answering the following questions.
Project Start Date: No. of Actual Working hours/day: Pipe/Cable Type: Pipe/Cable Diameter (mm):
Project End Date: Pipe/Cable Length (in): Pipe/Cable Depth (m): Soil Type:
Drilling Rig Size: a Small • Medium • Large Project Place:
III. Activities Information:
A. Estimate most probable duration of each HDD activity cycle time for the selected project.
1 Activities • H Site Preparation | p ^ Pilot hole drilling H i Reaming P ^ Final pipe pulling ^ H Ande adjusting at bit entrance ^ H Drill pipe segments joining ^ 9 Reamer with shackle attaching for pre-reaming • 1 1 Pipe/Cable segments connection and layout • 3 Pipe swivel assembly for pipe pullback ^ H All tracking activities ^ H All Assessment Activities
Estimated Time (Minutes) Most Probable
Figure IV. 1 Questionnaire
58

Ineffective Performance (Quality) Level Effective Performance (Quality) Level
1 2 <—h—*•
4 5
Extremely Ineffective
Moderately Ineffective
Neither Effective nor
Ineffective
Moderately Effective
Extremely Effective
[ Subject ive Per formance Scale
B. According to the above scale, please, rate the effect of the following factors on HDD process productivity.
^m^^^^^BS
Questions Drilling rig operator and crew skills? Rig size/drilling bit capabilities?
Safety regulations?
Machine condition? Slurry flow rate and slurry recycle equipment? Steering problems? (Correction
in direction)
Soil type?
Unseen buried obstacles?
Site and weather conditions?
1 Pipe type? 1 Pipe length? Pipe depth?
Pipe diameter?
Scale 1 2 3 4 5
Figure IV.2 Questionnaire Continued
The collected data are organized and analyzed according to the various soil types so that
they would be ready for neurofuzzy modeling. In this study, both qualitative and
quantitative data are needed, in which qualitative data are collected via part II of the
questionnaire and the quantitative data were collected via part I and III.
59

1 -
0.9 '
u 0.8 ' 3
T3 0.7 •
a °6 ' •S °-5 ' j> 0.4 •
£ 0.3 •
2 0.2 •
0.1 •
1
\ / \ / \ / \ / l
\ / \ / \ / \ I • \ / \ / \ / \ / l
\ / \ / \ / \ / j V V V V I A A A A '
/ \ / \ / \ / \ i / \ / \ / \ / \ i / \ / \ / \ / \ •
2 3 4 5
Significance Scale (Quality Level)
• Extremely Ineffective
—•— Moderately Ineffective
—A— Neither Effective Nor Ineffective
—X— Moderately Effective
—*— Extremely Effective
Figure IV.3 Representation of the Fuzzy Performance Scale
IV. 2. QUESTIONNAIRE SURVEY ANALYSIS
As stated before, approximately 220 questionnaires; hard copies, soft copies or
online copies; were sent to HDD contractors, consultants, field technicians and individual
experts in North America. However, only questionnaires for 28 projects were received
(12.73%) as shown in Figure (IV.4).
Number
JLSXJ
-28-
No. of Sent Questionnaires No. of Received Questionnaires
Figure IV.4 Number of Questionnaires
60

Collected questionnaires are classified according to soil types. Figure IV.5 shows that
clay, sand and rock soil types are represented by 11, 9 and 8 questionnaires, respectively.
The various pipe diameters (d) that were indicated in the questionnaire replies are
classified into three main categories: 1) small (25% of collected data), 2) medium (18%
of collected data) and 3) large (57% of collected data), with diameter range of (d) <
150mm, 150mm < (d) < 250mm , (d) > 250mm , respectively. Figures (IV.6 - IV.8)
shows the classification of pipe diameter size for the projects collected for each soil type.
Figure IV.5 Number of Projects Collected for Each Soil Type
6 i
5 -- 4 - * o . o 4 -"o4
s -
No.
ofP
Small
A 100-150
Clay Large • •
Medium ^ ^ H
• 1 151-250 251-610
Pipe Diameter (cm)
Figure IV.6 Distribution of Pipe Diameter According to Collected Data; Clay Soil
61

Sand Large
ts 3
&H 2
o
i i
Small
Medium
40-150 151-250 251-815
Pipe Diameter (cm)
Figure IV.7 Distribution of Pipe Diameter According to Collected Data; Sandy Soil
Rock Large
VI
8 4 •g1
OH 3 tl—1
o d 2
Medium
151-250 251-770
Pipe Diameter (cm)
Figure IV.8 Distribution of Pipe Diameter According to Collected Data; Rock Soil
By analyzing pipe diameter, and its relation with the calculated onsite productivity, it was
found that the larger the diameter, the lower the productivity due to the need of multi-
reaming process.
62

Manufacturers have classified horizontal directional drilling (HDD) rigs into three main
categories: 1) small, 2) medium and 3) large according to their capabilities (maximum
torque (ft-lb)), small rigs < 4000 ft-lbs, medium rigs 4000 - 20000 ft-lbs and large rigs >
20000 ft-lbs. The collected data was limited to utilizing medium and large rigs only. Data
analysis showed that medium and large rigs represent 68% and 32% of collected data,
respectively, as shown Figure IV.9. Each rig category is capable of installing certain
lengths and diameters of pipe product based on their respective thrust/pullback and
rotational torque. Experts indicated that HDD industry is dominated by medium rigs, as
dictated by need to increase production rates and due to project size and environment.
The small drilling bit capabilities have a respectable market; however, it was not involved
in this study due to data limitations. Collected HDD projects data indicates that 82% of
HDD operations in clay utilized medium rigs and 18% utilized large rigs, while 75% of
HDD projects in rock utilized large rigs and 25% only utilized medium rigs. In addition,
all HDD projects in sands utilized medium rigs.
Medium "^ 68%
COLLECTED DATA - RIG SIZE
Large - ^ 3 2 %
Figure IV.9 Drilling Bit Sizes
The current research studied a wide range of pipe lengths, which varied from 84 to 2300
meters. Pipe length was classified into short, medium and long length according to Good
63

Practices Guidelines, (2004). Figure (IV. 10 - IV. 12) shows various lengths of installed
pipes for different soil types; short (L) < 300m; 300m < medium (L) < 500m; and long
(L) > 500m. The shortest pipe installation was found to be in sandy soil with a length of
85 m, while the longest installation was in rock soil (2300 m).
5 -.
£2 4 -1
's1 31 O H
° 1 d Z 1 1
0 +-
Short
j 1 50-300
Clay
Medium
^ ^ | Long
1 I 301-500 501-1500
Pipe Length (m)
Figure IV. 10 Distribution of Pipe Length According to Collected Data; Clay Soil
4 -,
ects
w
NO
. of I
Short
• • 1 50-300
Sand
Long
Medium ^ ^ H
1 1 301-500 501-1300
Pipe Length (m)
Figure IV. 11 Distribution of Pipe Length According to Collected Data; Sandy Soil
64

Rock Long
/i
>f P
roje
cts
NJ
CO
4
O 1
2 1 "
n -
Medium
Short
50-300 301-500 501-2300
Pipe Length (m)
Figure IV. 12 Distribution of Pipe Length According to Collected Data; Rock Soil
Two pipe types were utilized in this study: steel and HDPE. It is worth to mention that
HDPE is mostly used in HDD applications due to its high workability and flexibility.
Figure IV. 13 shows that seventy-one percent of the collected projects data utilized HDPE
pipes, while 29% utilized steel pipes. Collected HDD projects data indicates that 82% of
HDD operations in clay utilized HDPE pipes and 18% utilized steel pipes, while 50% of
operations in rock utilized HDPE and 50% utilized steel pipes. Operations in sand
utilized almost 78% HDPE pipes and only 22% steel pipes.
Figure IV. 13 Percentage of Pipe Types
65

IV.3. CASE STUDY PROJECTS
One comprehensive HDD project was selected for clay, rock and sand soil to be
implemented and validated through the developed productivity prediction NF models.
After data analysis and preparation, both qualitative and quantitative factors were
identified and prepared as inputs to developed models. Data for modeling, testing,
validation and case studies were collected from specialized HDD companies (e.g.
Fordirect, Johnston-Vermette, Directed Technologies Drilling Inc. and Golder
Associates). However, company and personnel data were not presented in this study due
to privacy and confidentiality agreements that were made during data collection.
In this research, HDD Activities are classified into major and auxiliary drilling activities.
Major drilling activities include the three main drilling steps pilot hole drilling, back
reaming, pipe pull back (Good Practices Guidelines, 2004) and site preparation. While,
all other activities are considered as auxiliary drilling activities. Pipe connection & layout
time is considered as auxiliary activity because in some projects its time is neglected if it
was done parallel to site preparation, however, in some projects (long pipe installations)
pipe connection time may exceed any major activity time.
IV.3.1.Clay Case Study
A 300 m long water main was installed at 3 m depth in clay soil. The pipe was
200 mm in diameter and made of HDPE. The project was implemented by utilizing a
medium drilling rig size (maximum torque; 4000 - 20000 ft-lb), a highly skilled operator
and crew, moderate machine condition, with moderate expectations of unseen buried
66

obstacles. In addition, a moderate site, weather and safety conditions were also
implemented. The onsite project work was done in 2 working days based on a 10 hour
work day. Table (IV. 1) shows the clay case study activities duration filled by the HDD
expert and collected from the questionnaire.
Table IV. 1 Clay Case Study Activity Duration
Drilling Activity
Maj
or
Aux
iliar
y
Site preparation (SP) Pilot hole drilling (PH) Reaming (R) Pipe Pull Back (PP) Pipe connection & layout Angle adjusting Drill pipe segments joining Attaching reamer/shackle Pipe swivel assembly Tracking activities All assessment activities
Duration (min) 45 210 210 30
430 15 30 30 30 60 60
IV.3.2.Rock Case Study
A 440 m long water main was installed at 4.5 m depth in black shale (rock) soil.
The pipe was 139.7 mm in diameter and made of HDPE. The project was implemented
by utilizing a large drilling rig (maximum torque > 20000 ft-lb), a highly skilled operator
and crew, very good machine condition, with low expectations of unseen buried obstacles
and bad site, weather and safety conditions. The job was accomplished in 4 working days
based on a 12 hour work day. Table (IV.2) shows the rock case study activities duration
filled by the HDD expert and collected from the questionnaire.
67

Table IV.2 Rock Case Study Activity Duration
Drilling Activity
Maj
or
Aux
iliar
y
Site preparation (SP) Pilot hole drilling (PH) Reaming (R) Pipe Pull Back (PP) Pipe connection & layout Angle adjusting Drill pipe segments joining Attaching reamer/shackle Pipe swivel assembly Tracking activities All assessment activities
Duration (min) 180 180 0
120 1140
15 90 120 270 180 180
IV.3.3. Sand Case Study
A 660 m long water main was installed at 2.5 m depth in sandy soil. The pipe was
101.6 mm in diameter and made of HDPE. The project was implemented by utilizing a
medium drilling rig size (maximum torque; 4000-20000 ft-lb), a highly skilled operator
and crew, moderate machine condition, with high expectations of unseen buried
obstacles, and good site, weather and safety conditions. The job was accomplished in 7
working days based on an 8 hour work day. Table (IV.3) shows the sand case study
activities duration filled by the HDD expert and collected from the questionnaire.
IV.4 RELIABILITY OF COLLECTED DATA
Miaoulis and Michener (1976) stated the main factors that need to be specified to
determine a representing sample size as: 1) study purpose, 2) population size, 3) precision
level (sampling error), 4) confidence level and 5) degree of variability in the measured
attributes. Yamane (1967) has provided a simple formula to calculate a reliable sample
68

size with a confidence level of 95% and 50% level of accuracy (degree of variability),
which is usually used to determine a general level of accuracy for a known sample size,
as shown below:
N 1 + N(e)2
Equation VI. 1
Where, (n) is the sample size, (N) is the population size, and (e) is the level of precision.
According to NASTT (2007), there are 220 TT contractors (population size) operating in
Canada and USA. There for the margin of error of collected data is found to be 17.34%.
Therefore, the more collected projects data the less the margin of error, which may
improve the current research application results.
Table IV.3 Rock Case Study Activity Duration
Activity
Maj
or
Aux
iliar
y
Site preparation (SP) Pilot hole drilling (PH) Reaming (R) Pipe Pull Back (PP) Pipe connection & layout Angle adjusting Drill pipe segments joining Attaching reamer/shackle Pipe swivel assembly Tracking activities All assessment activities
Duration (min) 600 960 720 360 600 60
360 60 60 60 120
69

IV.5. SUMMARY OF CHAPTER IV
This chapter covers procedure of data collection and a description of tools used.
Both direct data collection and questionnaires were utilized in the study. Two-hundred
and twenty (220) questionnaires were sent to four countries. Only 12.73% of the
questionnaires received with replies. The collected data have been sub-divided into three
main categories; clay, rock and sandy soils. Furthermore, three data projects were
selected in order to be applied by the developed productivity prediction NF models (one
project for each soil type). These projects help validate and understand model
mechanism.
70

CHAPTER V
MODEL DEVELOPMENT AND RESULTS
This chapter covers the ranking system used for the HDD productivity factors, the
development of the NF models for each soil type, and the validation process. This
includes the relative importance of each factor, a schematic representation of input and
output variables, and the process of system adaptation and training. Furthermore, the
chapter presents the productivity factor sensitivity curves.
V.l. HDD PRODUCTIVITY FACTORS RANK
The purpose of establishing the input factor ranking is to highlight the relative
importance of the factors used to model HDD productivity. The AHP technique is
utilized to determine the relative importance of each of the previously investigated HDD
productivity factors. The investigated factors that affect HDD productivity are divided
into four major levels as shown in Figure (V.l). A pair-wise comparison matrix was
developed considering the thirteen factors, as shown in Table (V.l). In order to assign
priorities, the AHP methodology is applied to these matrices in order to determine each
factor's weight.
The eigenvector or weighting vector (Wj) for each pair-wise matrix is then established
using Saaty's methodology (1982), as shown in Table V.2. Each of these weights
represent its relative importance among the other factors, therefore the total weight value
of each matrix is equal to one. Table V.2 shows the weight of factors (Wi) using
respondent # 1 in which operator and crew skills, steering problems and soil type have
71

the highest priority and effect on HDD productivity (0.1136). Safety regulations and
unseen obstacles have the lowest effect of (0.0227).
* Management Conditions
* r
*Crew/Operator Skills (OS)
•Drilling Bit Capabilities (DBC)
•Safety Regulations (SR)
* Qualitative Factor
Investigated HDD Productivity
Factors
1 1
Mechanical Conditions
i f
*Machine Condition (MC)
*Slurry Flow Rate (SFR)
•Steering Problems (SP)
V"""'""
1 Environmental
Conditions
i '
*Soil Type (ST)
*Unseen Buried Obstacles (UBO)
•Site & Weather Conditions
(SWC)
1 Pipe
Conditions
" APipe Diameter
(Pdia) APipe Length
(PL) APipe Depth
(Pdpth) APipe Type
(PT)
Figure V.l Investigated HDD Factors
Table V.l Pair-wise Comparison Matrix (Respondent No. 1)
OS DBC SR MC SFR SP ST
UBO SWC PT PL
Pdpth Pdia
OS 1
0.8 0.2
0.8 0.8 1 1
0.2
0.8 0.4 0.4 0.4 1
DBC 1.25
1 0.25
1 1
1.25
1.25
0.25
1 0.5 0.5
0.5
1.25
SR 5 4 1 4 4 5 5 1 4 2 2 2 5
MC 1.25
1 0.25
1 1
1.25
1.25
0.25
1 0.5 0.5
0.5
1.25
SFR 1.25
1 0.25
1 1
1.25
1.25 0.25
1 0.5
0.5
0.5
1.25
SP 1
0.8 0.2
0.8 0.8 1 1
0.2
0.8 0.4 0.4 0.4 1
ST 1
0.8 0.2
0.8 0.8 1 1
0.2
0.8 0.4 0.4 0.4 1
UBO 5 4 1 4 4 5 5 1 4 2 2 2 5
SWC 1.25
1 0.25
1 1
1.25
1.25
0.25
1 0.5 0.5
0.5 1.25
PT 2.5 2
0.5 2 2
2.5 2.5 0.5
2 1 1 1
2.5
PL 2.5 2
0.5 2 2
2.5 2.5 0.5 2 1 1 1
2.5
Pdpth
2.5 2
0.5 2 2
2.5 2.5 0.5
2 1 1 1
2.5
Pdia
1 0.8 0.2 0.8 0.8 1 1
0.2
0.8 0.4 0.4 0.4 1
72

The weights (Wi) for all factors will be similarly calculated for the 28 respondents. Table
V.3 shows the average of the calculated factors' weights (Wi) for the 28 respondents.
Operator and crew skills, soil type and pipe diameter are the most important factors
where their values are 0.1024, 0.0988 and 0.0905, respectively, while pipe depth and pipe
length have the least weight of 0.0578 and 0.0575, respectively.
Table V.2 Weight Vector for each Pair-Wise Matrix "Respondent No.l"
1
2 3 4 5 6 7 8 9 10 11
12 13
Factors Operator and crew skills
Drilling bit capabilities
Safety Regulations
Machine Condition
Slurry Flow Rate
Steering Problems
Soil type
Unseen Obstacles
Site/weather conditions
Pipe type Pipe length
Pipe depth
Pipe diameter
Weight (Wi)
0.1136
0.0909
0.0227
0.0909
0.0909
0.1136
0.1136
0.0227
0.0909
0.0455 0.0455
0.0455
0.1136
The factors relative importance were then introduced and discussed with five HDD
professionals. After these discussions, a new factor layout was developed, as shown in
Table (V.4). Safety regulations (Wi=0.0623) and site/weather conditions (Wi=0.0604)
were merged due to the fact that they are a parallel-performed activity in the HDD
industry. Site/weather and safety conditions were then assigned a weight of 0.0614.
Steering problems (Wi=0.0854) and slurry flow rate (Wi=0.0785) were considered as a
subcategory of the machine condition (Wi=0.0852). According to HDD Good Practices
Guidelines, (2004) the change of pipe type has no effect on pipe installation time.
73

Therefore, pipe type and pipe depth were eliminated in the modeling phase due to their
low effect on productivity.
Table V.3 Average Weight Values (Wi) for All Respondents
1
2
3 4
5
6
7
8
9
10 11
12
13
HDD Productivity Investigated Factors Operator and crew skills
Soil type
Pipe diameter Drilling bit capabilities
Steering Problems Machine Condition
Slurry Flow Rate
Unseen Obstacles
Pipe length
Safety Regulations
Site/weather conditions
Pipe type
Pipe depth
Weight (Wi)
0.1024
0.0988
0.0905 0.0875
0.0854
0.0852
0.0785 0.0702
0.0635
0.0623
0.0604
0.0578
0.0575
Table V.4 The Weight (Wi) of Modified Factors' Layout
1 2 3 4
5
6 7
8
Modified Factors Layout Operator and crew skills
Soil type Pipe diameter
Drilling bit capabilities
Machine Condition (Steering Problems, Slurry Flow Rate)
Unseen Obstacles
Pipe length
Site/Weather Conditions (Safety Regulations)
Weight (Wi)
0.1024
0.0988
0.0905
0.0875
0.0830
0.0702
0.0635
0.0614
74

V.2. NEUROFUZZY MODEL ARCHITECTURE
In the previous section, eight productivity input variables were identified to have
the largest impact on HDD productivity in pipe/cable installation, Figure (V.2).
Therefore, this research considered these eight factors in developing a model to measure
the pipe/cable installation productivity when utilizing the HDD technique. Neurofuzzy
systems were utilized in developing this productivity prediction model. To improve
system adaptation and training, three neurofuzzy networks were designated NFciay, NFr0Ck
and NFsand. Each of the three structures was employed to deal with one soil type, based on
seven input variables II, 12... 17 (Figure V.3).
1 Management Conditions
i ' Crew/Operator
Skills
i r
Rig Size
Modeled HDD Productivity
Factors
+ Mechanical Conditions
V
Machine Condition
Slurry Flow Rate
Steering Problems
1 *
Environmental Conditions
" Soil Type
i Unseen Buried
Obstacles
1 Site/Weather and Safety Conditions
* Pipe
Conditions
* Pipe Diameter
* Pipe Length
____i_____ Pipe Depth Pipe Type
(Eleminated)
Figure V.2 Modeled Factors Affecting Productivity of HDD Operations
The functions of the neurofuzzy network are to fuzzify the system inputs, defuzzify the
system outputs and develop a weight structure that suitably represents the non-linear
75

relationships between the system inputs and outputs. To follow a proper NF system
training, the neurofuzzy system is able to generalize the relationships between the inputs
and outputs using actual industrial project data. Accordingly, the developed system can
be used for predicting HDD productivity, given a specified set of project input variables,
to an acceptable error level.
Figure V.3 Schematic Representation of the Utilized NF Architecture
76

V.3. NEUROFUZZY MODEL DEVELOPMENT
The current research developed three NF productivity prediction models for clay
rock and sand. The reason of developing three models (clay and rock considered 7
factors, sand considered 5 factors) instead of just one model (considering 11 factors) is
due to neurofuzzy system limitation. As the number of NF system inputs and outputs
increase, designing of fuzzy rule base becomes complicated, dramatically increase
number of fuzzy rules, needs longer run time and special computer hardware
specifications (memory size). The neurofuzzy network model development involves the
training and adaptation of three different structures for clay, rock, and sand.
Questionnaire survey, Appendix C, was used for acquiring real time industrial project
data relevant to the eight project input variables and one single output. The model
mechanism was divided into training and validation phases. The training starts with both
qualitative and quantitative data entry in terms of factor weights and cycle
time/production rate, respectively. The model was developed using MATLAB® (ver.
7.6.0.324) using the Adaptive Neurofuzzy Inference Systems toolbox (ANFIS). The data
entry layer takes both crisp and fuzzy factors and processes all factors to the training
process, which starts by data fuzzification where the degree of each factor is determined.
The data are then sent to be trained via ANN. The fuzzy outcome is then defuzzified,
where the crisp input factor variable is determined given its degree of membership. In
other words, the functions performed by the neurofuzzy networks are to fuzzify system
inputs, defuzzify model outputs and develop a structure weight that properly represent the
nonlinear relationships across the model inputs and outputs, Figure (V.3). This system is
able to build relationships between the factors affecting the HDD process and the overall
77

productivity. Therefore, the model can predict HDD process productivity given a
specified set of project input variables (factors), with an adequate percent error.
V.3.1. Identifying Input Factors
The neurofuzzy system inputs represent a wide range of deterministic and
linguistic variables. The modeled linguistic (non-numerical) variables are soil type,
drilling rig size (capabilities), operator and crew skills, machine condition, unseen buried
obstacles and site and weather conditions. On the other hand, the deterministic model
variables are pipe length and pipe diameter. Linguistic variables generally have higher
levels of uncertainty than deterministic variables. However, this degree of uncertainty
defines the fuzziness in variable description.
For appropriate neurofuzzy system functionality, both deterministic and linguistic
variables need to be described in a fuzzy form, as shown in Figures V.4 to V.10.
Deterministic variables usually have exact or near-exact values. Therefore, they have low
levels of uncertainty associated with them. Hence, a triangular membership function is
used in the representation of deterministic fuzzy variables because of their steep change.
Triangular or n membership functions centered at the particular value can be used for
describing these linguistic terms. Nevertheless, the triangular membership function is
commonly used in practical applications due to its mathematical simplicity. Therefore,
this model employed the triangular form to present the input variable membership
functions.
78

Allouche et al., (2000) and Najafi M., (2004), classified the pipe diameter into three main
categories; 50-100 mm (72% of the HDD market), 150-300 mm (16% of the HDD
market) and >300mm (12% of the HDD market). It was found that the largest HDD
market share is for the installation of 50-100 mm pipe diameters. Products in this
diameter range are mostly used in the telecommunication industry (e.g. fiber-optic),
natural gas distribution systems, electrical conduits and environmental applications. This
is followed by the 150-300 mm diameter range, which is typically utilized in crude oil
and natural gas delivery systems, municipal applications (i.e. water and sewer pipelines)
and industrial applications. Diameters of greater than 300 mm are mainly used for
utilizing water trunk lines, sewers, and transmission lines. This research considered this
classification in designing the membership functions for pipe diameter for all soil types
according to the maximum diameter collected (see Figure V.4 as an example).
Membership function for the small pipe category is designed from 50-200 mm, medium
from 100-300 mm and large consisting of diameters >200 mm.
==•== Small
— • — Medium
=*> - Large
50 100 150 200 250 300 350 400 450 500 550 600 650
Pipe Diameter (mm)
Figure V.4 Fuzzy Representation of Numerical Variables "Pipe Diameter-Clay"
79

According to Good Practices Guidelines (2004) the pipe length (L) was classified for the
collected clay soil project data in to three main categories (short, medium and long), it
was found that 45% of the clay projects is (L) < 300m, 35% 300m < (L) < 500m, and
20% (L) > 500m. Accordingly, pipe length membership function of clay soil was
designed, see Figure (V.5).
According to drilling rig manufacturers and Good Practices Guidelines (2004), HDD rigs
are classified into small, medium and large rigs according to their maximum torque (ft-
lb). Therefore, three membership functions were developed to present their fuzzy values
for clay, sand and rock, as shown Figure V.6; Small rigs < 4000 ft-lbs, Medium rigs 4000
- 20000 ft-lbs and large rigs > 20000 ft-lbs.
The fuzzy presentation of qualitative factors was based on their data collection fuzzy
scale. Five membership functions were designed for each qualitative factor and named
according to the factor quality. However, due to data limitations, the collected data were
limited to some parts of the factor membership functions. Clay and rock models were
trained based on skilled and highly skilled operator and crew, modeling inputs vary
between skilled and highly skilled membership functions only. The sand model was
limited only to a highly skilled operator and crew, (Figure V.7). Machine condition inputs
vary from poor to very good for all models (Figure V.8), while very poor does not have
any input as it is not ideal to use a very poor condition rating unless the machine is
repaired, since it might cause a loss of track and a waste of time.
80

alue
> &,
J3 Cfl
X I
s <U
2
0.8
0.6
04
0?
\ — 5 ^ \ ' >
\ / > •Short
- -« - - Medium
- -A- - Long
200 400 600 800 1000 1200 1400 1600
Piple Length (m)
Figure V.5 Fuzzy Representation of Numerical Variables "Pipe Length-Clay'
o 3 !*5 > OH
J3 w t-i
JO
s >•
1
0.8
0.6
0.4
0.2
0
- •"- • • Large Rig
—•— Medium Rig
*•-- Small Rig
8 12 16 20 24 28 32 36 40
Thousands
Drilling Rig Capabilities (Maximum Torque (ft-lb))
Figure V.6 Fuzzy Representation of Numerical Variables "Rig Size; all soil types"
0 *•
/ \
1 1.5 2 2.5 3 3.5 4 4.5 5
Skill Degree (Level)
•«-- Highly Skilled
— - Skilled
-*— Moderate
- - • - -Poor
-••-•-V.Poor
Figure V.7 Fuzzy Representation of Linguistic Variables
"Drilling Rig Operator & Crew Skills"
81

- •-•- -V.Good
- • * - • • G o o d
—•— Moderate
- - • - - Poor
—-•—- V.Poor
Figure V.8 Fuzzy Representation of Linguistic Variables "Machine Condition"
As shown in Figure V.9, unseen obstacles and site, weather and safety condition
modeling inputs are limited to four membership function areas. Very low expectation of
underground obstacles does not have inputs because HDD are commonly used in urban
and crowded areas, in which there are many buried infrastructure services (e.g. telephone
lines, water mains and internet cables). Weather, site and safety does not have very good
condition, (see Figure V.10).
V.3.2. Calculating Output (Productivity (m/hr))
Based on the surveys and five personal meetings with HDD professionals, finding
a universal deterministic productivity rate for the overall HDD construction process was
not possible. Contractors, engineers, consultants and field experts rarely keep track of the
overall project production rate on their database; however, they keep track of small
activity production rates (i.e. pilot hole drilling, back reaming). Moreover, working hours
per day vary from one contractor to another and may be unique for each project.
82
2 3 4 f
Machine Condtion (Level)

Contractors may work eight, ten or twelve hours per day, while other contractors perform
longer operations on crew shift basis.
1 t
"3 > a .s VI
4) £>
s s
0.8
0.6
0.4
0.2
0
•-•- -V .High Expectation
-*— High Expectation
- -*- - Moderate Expectation
—•— Low Expectation
1 1.5 2 2.5 3 3.5 4 4.5 5
Unseen Obstacles (Level)
Figure V.9 Fuzzy Representation of Linguistic Variables "Unseen Obstacles''
0 t 1 1.5 2 2.5 3 3.5 4 4.5 5
Site, Weather and Safety Conditions (Level)
—-*-— V. Bad
- • • - • • Bad
— * — Moderate
-•-•-•-Good
— • — V.Good
Figure V.10 Fuzzy Representation of Linguistic Variables
"Site, Weather and Safety Conditions"
This research attempts to break down the HDD construction process into small activities
and calculate the most probable time for each activity, in order to find the process
production rate in m/hr for each project. The time for each HDD process is calculated in
minutes, based on the surveyed data. HDD processes are defined according to major and
auxiliary activities as follows:
83

Major Drilling Activities & Site Preparation Time (TJ:
1. Site preparation (Tsp)
2. Pilot hole drilling (Tph)
3. Reaming (Tr)
4. Final pipe pulling (Tpp)
*major Isp -" - Iph""" 1 r """ ^ | PP
(Equation V.l)
Auxiliary Drilling Activities and Pipe Connection Time (T^):
1. Angle adjustment at bit entrance (Ta(jj)
2. Joining of drill pipe segments (TSj)
3. Reamer with shackle attaching for pre-reaming (TSh)
4. Pipe/cable segment connection and layout (Tsc)
5. Pipe swivel assembly for pipe pullback (Ts)
6. All tracking activities (TV)
7. All assessment activities (Tass)
1 auxiliary 1 adj "*" 1 sj "*" 1 sh "*" 1 sc """ * s ~*~ * tr "*" A a
(Equation V.2)
Accordingly, the modeling output is achieved based on the formula shown below:
Productivity (m/hr) = Total Pipe Length (L)
(Tmajor + Tauxiliary)/60
(Equation
Note: All activities durations (Tmaj0r & TaUxiiiary) include idle time.
84

V.4. HDD PRODUCTIVITY MODEL FOR CLAY SOIL
V.4.1. Clay Model Training
The Clay NF model considered seven input factors: 1) operation and crew skills,
2) pipe diameter, 3) rig size, 4) machine condition, 5) site and weather conditions, 6) pipe
length and 7) unseen obstacles, where each factor has its own number of membership
functions according to its data range, (see Figure V.ll). Data for the clay projects,
acquired through the questionnaire, were used for the neurofuzzy system development,
verification and validation. The clay model was trained and tested via 80% and 20% of
the collected data points, respectively. Furthermore, the clay NF model was developed
based on 1992 nodes (fuzzification layer 22 nodes, Intermediate layer 1948 nodes and
defuzzification layer 22 nodes), 32 training data pairs, and 972 fuzzy rules, see Figure
(V.12). As shown in Figure V.13, 30 training cycles (epochs), are used for the clay soil
model training. The training process engages the tuning of the network weight structure
for more precision, thereby producing the target output for the network. Neurofuzzy
systems use back-propagation algorithm to minimizing the error, which is the difference
between the target and calculated output.
The developed model was then tested after the modeling phase, where the neurofuzzy
system splits the modeling data into training and testing data. Twenty percent of the total
collected data points were unexposed to the neurofuzzy system during the training phase
and were used for testing and validation purposes. The testing data set was then used to
predict productivity and compare the results with the real time productivity, (Figure
V.14).
85

Input Layer
Intermediate Fuzzification Layer Defuzziflcation
Layer r , Layer
2.
3.
; sJQperator & i Crew Skills ,1
5.
6; ^' Site& " **, Weather
Detailed Network
7.
Output Layer
Productivity Value Meter/Hour
rCr isp^ ' Fuzzy N| l^FactorJ Factor,1
Figure V.l 1 Basic Architecture of Clay and Rock NF Model
86

?1
3
1
m
mum
fi^eSSSIS
o c a c o ss 3 u
S S f I S R 3 8
2
« — * . *
1 8
I S
I o
?
I
i c
I c
5 1 c
I 5
1 o
1 g
1 r,
? =
1 1 •"•
1 o
2 °
1 1 »
I s
§
=
u n
n 7> O
52 3 o
mmmmmmnmmmm
iiiiiiiiiiiiiiiiiiiiiiiiiiiiiiii J d - e e s J a i d - d d s s d s - d i i d e e s d - d d a c d d Sg
||J||||j|||||||l||Jj|||||||||||j jf
llllllilillillllllllliliiillllll f|
liiisiiiiiiiii§iiiiiioiisiiiiis 1; d d c d d d d d d d d d d d r i c d d d d i d d d d d d d d d d d ! '
iSlSlas: i f > S i C l O » O « s 3 0 !
Ilililillllllllil i © o c o o e c t O D O O * © © o o s
4 i
U.UU. JlLtt.
T- W - S> P?
11ISSS
8 S
AH
111
•=1 > T
l i
S=1:
n
**
§ . .
« f .-
T 1
S'.. . a .,
1.
«k
H
., «
• m
*"
±;
f
s ""
•H R
f
8 ta
~ J l Figure V.12 Training and Validation Data Sets; Clay NF Model
87

Ffle
E
dt
Deb
ug
Pa
raM
D
esk
op
Win
dow
H
elp
____
_ __
___
''. O
-
3 {
Jt
%
<|
•')
<P"
! J
>
30
^1
i •©
• '
Cu
rren
t D
irec
tory
: j G
:\M
y D
ocum
entc
\MA
TL
AB
: S
ho
rtcu
ts
|£|
ho
w t
o A
dd
^J
wh
at'
s N
ew
^^
00
00
pa
ren
t D
irec
tory
- G
:\f1y
Poc
wnc
nUX
MA
Ttf
tB
J^ a
llinp
iitsf
iqiia
tinn
SiJ
Cla
v 4K
. csv
^C
lay
mo
de
l m
at
fjse
nst
ivrt
y.m
^3
Ula
yll_
4x
csv
5J
iiftn
udB
lttia
l
Ty
p«
Sb*i
rW-M
ftrfif
iM
Mic
roso
ft O
ffi...
M
AT
-file
M
-file
M
icro
soft
Utti
...
MA
T-f
ild
1 K
P,
^jT
TR
/m 3
34
P
2KB
20J
057D
9 7:
10P
18 K
B 2
0/05
/09
8:24
P
1 K
B 2
5yD
&C
8 1
2:4
4!
2Wd
^bV
U^U
yy:Z
JH
20 K
B 2
0/05
)09
9,25
P
lom
man
d H
isto
ry
tlo
n(C
lay
_4
x,
[3
6
k—
25
/07
/08
10
:02
AH
--
%
•%—
15
/01
/09
4:2
5 PH
—
%
-%—
1
8/0
1/0
9 9
:19
PH
—*
%—
1
B/0
1/0
9 9
:52
PH
—%
%
--
28
/02
/09
7:4
7 PH
—
1 !
%~
2B
/02
/O9
8:4
6 PH
—
H
loa
d c
lap
loa
d c
lay
_4
x [p
rod
uc
, e
rro
r]
=a
llin
p\>
tse
q
loa
d c
lay
- 0
3/0
3/0
9 2
:42
PH
—V
-
03
/03
/09
3:0
3 PH
—
4 -
09
/03
/09
10
:02
PH
--*
- 2
1/0
4/0
9 9
:45
PH
—\
ma
de
lgu
ua
d -
21
/04
/09
10
:17
PH
—*
mad
elg
uw
ad
- 2
6/0
4/0
9 5
:46
PH
—%
-
20
/05
/09
7:1
1 PH
--
H
[produc, error] =a11inputsequatIon (Clay_4x, [3
- 2
0/0
5/0
9 7
:15
PH
—\
[pro
du
c,e
rro
r]=
all
inp
-ut3
eq
ua
tio
n(C
lay
_4
x,
[3
- 2
0/0
5/0
9 8
:30
PH
—4
[pro
du
c,e
rro
rj^
all
inp
-uts
eq
ua
tio
ntC
lay
ll
4x Sr
1
0 N
ew to
MAT
LAB?
Wst
dh th
is V
ideo
, see
Dem
os, o
r re
ad G
ettin
g St
arte
d.
Sta
rt
tra
inin
g JL
HFI
S ..
.
1 0
.02
86
77
1 2
0.0
28
6822
3
0.0
28
68
1 4
0.0
28
6762
5
0.0
28
6777
6
0.0
28
68
15
7 O
.02
6 6
70
3 O
O
.0Z
0G75
O
9 O
.02
86
B1
in
n.n7fifi7S7
Designated epoch number reached -
-n
AN
FIS
tr
ain
ing
co
mp
lete
d a
t e
po
ch
10
.
cypc
o
nd
Hcc
bo
d o
rHe
tho
d ri
pf n
it a
Mpt
-.hnr
l U
nv
Het
ho
d a
gg
He
tho
d in
pu
t-
an
t is
'
pro
d1
max
' [1
x7
str
uc
t]
ou
tpu
t:
[lx
l s
tru
ct]
ru
le:
[1x
97
2 s
tru
ct]
ANFIS info:
Nuntocx: of nodes i 1QD2
Nuottoer
o± linear parameters: 7776
Number of nonlinear parameters: 57
Total number of parameters: 7833
Number of training data pairs: 32
Number of checking data pairs: 0
Number of fuzsy rules: 972
Warning: number ox data is smaller than nuirOer o£ noodLtiabie parameters
3tact tcalaiug ANFIS ...
1 n
.fl2
f,fi
75
7 2
0.0
28
67
91
3 0
.02
66
9 4
0.0
28
68
17
5 0
.02
86
75
3 6
0.0
26
67
89
7 0
.02
66
76
2 8
U.U
iib
b/5
y 9
0.0
2B
6S
1 10
C
.02
B6
77
2
Designated epoch number reached -
ANFIS training completed at epoch 10.
-si
[ow.

1
— § • i i i ? § 6
S T - $ ;
g> s s « •
»!|i|ii|i i » n H n !> i i »« « r> m * i
yi > c * ffi a
i
s I f .
; r 4
J I . I
a. a. a,:; u. a.
assess IT MTI 2 on *
Jill •.- <D *•' r j I D
S S
iJlili
111
! ft
c ; i
1
1 ;? 1 £ 1 u
,3 1
.
-
.
"in: "r u
; - • : • * . - .
• • < " • " • • . ' " r ^ T ^ c
. f, * w B
' S i 2 3
,
. : : '•
<e « • . s
* > ' . • *
:
B
« •'I-t> • d
1 '
- » ! i h ~ z. s $ s «
V § _
U U M V • 4J
• » • J " : *
S 1 /8 U LI U
£ ' £ • S
, , ,• 7
Figure V.14 Clay NF Testing Data Set Results
89

V.4.2. Clay Model Validation
The model was tested by utilizing a portion of project data already used in system
training to verify the network adaptability for the proper estimate of its inputs.
Furthermore, system functionality was investigated and validated utilizing a sample
project data (20% of clay data) not previously employed in system training. The
validation process of the developed models was performed as shown in the following
sections.
i. Average Invalidity and Validity Percent (Clay)
A mathematical validation diagnostic was utilized for model validation.
According to Zayed and Halpin, (2005), the average invalidity and validity percents are
calculated for validation data using the following formulas:
AIP = '~H VC';| X 100 (Equation V.4)
and AVP = 100 - AIP (Equation V. 5)
Where, AIP represents the average invalidity percent, AVP is the average validity
percent, E; is the predicted value, Q is the actual calculated value and n is the number of
observations. The AVP varies between 0 and 1. As the AIP value approaches zero, the
better the model fits the data. Similarly, the closer the AIP Value is to one, the more
inappropriate is the model. Therefore, for a satisfactory validation results, the AVP
should be closer to one. For the clay productivity prediction model, the values were as
follows:
90
- AIP = 5.5611%
• AVP = 94.4389 %
The validation process shows that the developed model could predict the actual outputs
with accuracy of almost 94.7%. The AVP value obtained could be considered as a
satisfactory validation result. Therefore, the clay prediction model could be utilized for
HDD prediction.
V.4.3. Case Study Description and Application of Clay Model
A water main is to be installed underground at 3 m depth (Project 1, which is
located in Saint lazarre, Montreal West). An HDPE pipe with a diameter of 200 mm is to
be used. The pipe is to be laid at a distance of 300 m in clay soil. A medium size rig is
utilized for job implementation. The job is accomplished in 2 working days based on a 10
hour work day. Tables V.5 and V.6 show the major and auxiliary activities' durations for
the case study in hand. Based on productivity calculation equations V.l, V.2 and V.3
mentioned earlier in this chapter, the total activity time Tj, Tx and productivity were
calculated.
Tj = 495min and Tx
Then, Calculated Productivity (m/hr)
= 655min
= 15.65 m/hr (495 + 655)/60
91

Table V.5 Major Activities Durations (Clay Case Study)
Major Drilling & Site Preparation Activities Site preparation (SP) Pilot hole drilling (PH) Reaming (R) Pipe Pull Back (PP) Total Major Activities Duration
Duration (min)
45 210 210 30
495
Table V.6 Auxiliary Activities Durations (Clay Case Study)
Auxiliary Drilling & Pipe Connection Activities Pipe connection & layout Angle adjusting Joining of drill pipe segments Attaching reamer/shackle Pipe swivel assembly Tracking activities All assessment activities Total Auxiliary Activities Duration
Duration (min) 430 15 30 30 30 60 60
655
The calculated on site HDD productivity in clay soil is 15.65 m/hr. The project is
implemented by utilizing a medium drilling rig size (max torque; 4000-20000 ft-lb), a
highly skilled operator and crew, a moderate machine condition, with moderate
expectations of unseen buried obstacles and moderate site, weather and safety conditions.
The input of the qualitative factors is based on their membership functions as shown in
Figures V.6 to V.10. The clay NF model is recalled and processes the project inputs. The
predicted productivity by the clay NF model is calculated to be 13.67 m/hr. The predicted
result showed a validation of 87.34%.
92

V.4.4. Clay Model Productivity Curves
Based on the developed NF clay model, a relationship between productivity
performance and each productivity factor (sensitivity analysis) was done, for the
previously mentioned HDD application in clay soil. This was done in order to predict the
HDD production rate based on different management, mechanical, environmental and
pipe physical conditions. The performed sensitivity analysis holds the studied HDD
factor at actual values while the other factors are kept at their constant average values.
Figures V.15 to V.20 show the direct relationship between the production rate and each
of the factors affecting the HDD process.
Figure V.15 Productivity Predictions for Operator and Crew Skills; Clay Soil * 80-100% Highly Skilled, 60-80% Skilled, 40-60% Moderate, 20-40% Poor, 0-20% Very Poor
16.90
16.40
65% 70% 75% 80% 85%
Machine Condition* (Performance)
Figure V.16 Productivity Predictions for Machine Condition; Clay Soil * 80-100% Very Good, 60-80% Good, 40-60% Moderate, 20-40% Poor, 0-20% Very Poor
93

I Q
19.00
17.00
£• 15.00
o 3 -s
13.00
11.00
200 220 240 260 280 300 320 340 360 380 400
Pipe Length* (m)
Figure V. 17 Productivity Predictions for Pipe Length; Clay Soil * L< 300m short, L= 300-500m, L> 500 Long
Figure V.18 Productivity Predictions for Site, Weather and Safety Conditions; Clay Soil
* 80-100% V. Good, 60-80% Good, 40-60% Moderate, 20-40% Poor, 0-20% V. Poor
Figure V.19 Relation between Productivity Rate and Pipe Diameter; Clay Soil
94

18.00
11 1700
"3 >-. 2 •-
ft. .fe 16.00
s s ft, 15.00
21
Figure V.20 Relation between Productivity Rate and Buried Obstacles; Clay Soil * 80-100% V. High Expectation, 60-80% High Expectation, 40-60% Moderate, 20-40% Low Expectations,
0-20% V. Low Expectations
It can be seen that operator and crew skills, machine, site, weather and safety conditions
and pipe length figures show a direct relationship with productivity rate. The slope of the
productivity and pipe length has inclination at 300m as it is the transition point between
short and medium length installations, in which HDD productivity tends to decrease. Pipe
diameter and underground obstacles show an inverse relationship with productivity rate.
V.5. HDD PRODUCTIVITY MODEL FOR ROCK SOIL
V.5.1. Rock Model Training
Similar to the Clay NF model, the Rock NF model considered seven input factors,
(operation and crew skills, pipe diameter, rig size, machine condition, site and weather
conditions, pipe length and unseen obstacles) as shown in Figure (V.ll), where each
factor had its own number of membership functions according to its data range. Data for
rock projects, acquired through the questionnaire, was examined for consistency and
completeness. The rock model was trained and tested via 80% and 20% of the collected
data points, respectively. The rock NF model was developed based on 1992 nodes
95
% 22% 23% 24% 25% 26% 27% 28% 29% 30%
Expectations of Unseen Obstacles*

(fuzzification layer 22 nodes, Intermediate layer 1948 nodes and defuzzification layer 22
nodes), 27 training data pairs, and 972 fuzzy rules. Thirty training cycles (epochs) were
used for rock soil model training. The training process engaged the tuning of the network
weight structure for more precision, thereby producing the target output for the network.
It should be noted that neurofuzzy systems use a back-propagation algorithm to minimize
errors, which is the difference between the target and calculated output.
The developed model is tested after the modeling phase, where the neurofuzzy system,
splits the modeling data into training and testing data. Twenty percent of the total
collected data points are unexposed to the neurofuzzy system during the training phase to
be used for testing and validation purposes. Afterwards, the testing data set is used to
predict productivity and compare the result with the real time productivity.
V.5.2. Rock Model Validation
i. Average Invalidity and Validity Percent (Rock)
Similarly, Equations V.4 and V.5 are utilized to validate the rock NF model. For
the rock productivity prediction model, values are as follows:
• AIP= 17.71% and AVP = 82.29%
The validation process showed that the values of the predicted outputs are almost 82.3 %
accurate. The AVP value can be considered as a satisfactory validation result. Therefore,
the rock prediction model can be utilized for HDD prediction.
96

V.5.3. Case Study Description and Application of Rock Model
A water main is to be installed underground at 4.5 meter depth (Project 2, which
is located in seaway, Longuell/Notredame). An HDPE pipe with a diameter of 139.7 mm
is used. The pipe is to be laid at a distance of 440 m in black shale (rock) soil. A large
size rig is utilized for job implementation. The job was accomplished in 4 working days
based on a 12-hour work day. On site productivity was then calculated. Tables V.7 and
V.8 show the activities durations. Based on productivity calculation equations V.l, V.2
and V.3, the total activity time Tj, Tx and productivity was calculated.
Tj = 480min and Tx = 1995min
440
Then, Calculated Productivity (m/hr) = —————— = 10.67m/hr
Table V.7 Major Activities Durations (Rock Case Study)
Major Drilling and SP Activities
Site preparation (SP) Pilot hole drilling (PH) Reaming (R) Pipe Pull Back (PP) Total Major Activities Duration
Duration (min)
180 180 0
120 480
Table V.8 Auxiliary Activities Durations (Rock Case Study)
Auxiliary Drilling and Pipe Connection Activities Pipe connection & layout Angle adjusting Joining of drill pipe segments Attaching reamer/shackle Pipe swivel assembly Tracking activities All assessment activities Total Auxiliary Activities Duration
Duration (min) 1140
15 90 120 270 180 180
1995
97

The project was implemented by utilizing a large drilling rig size (max torque > 20000 ft-
lb), highly skilled operator and crew, very good machine condition, with low
expectations of unseen buried obstacles and bad site, weather and safety conditions. The
input of the qualitative factors was based on their membership functions shown in
Figures V.6 to V.10. The rock NF model processed the project inputs and the predicted
productivity was calculated to be 9.47m/hr. The predicted result showed a validation of
88.75%.
V.5.4. Rock Model Productivity Curves
Similar to clay soil NF model, a NF rock model was recalled and a relationship
between productivity performance and each productivity factor (sensitivity analysis) was
done. Similar to clay soil, the performed sensitivity analysis holds the studied HDD
factor at actual values while the other factors are kept at their constant average values.
Figures V.21 to V.26 show the direct relationship between the production rate and each
of the factors affecting the HDD process. All factors are directly related to outputs except
for pipe diameter and underground obstacles, which are inversely related.
Figure V.21 Productivity Predictions for Operator and Crew Skills; Rock Soil * 80-100% Highly Skilled, 60-80% Skilled, 40-60% Moderate, 20-40% Poor, 0-20% Very Poor
98

10.00 -I
9.00
£ g 8.00 -.— •£• £> .1? 7.00 -
0. .> g 1' 6.00 -
£ 5.00 -
4.00 -
85 % 90% 95%
Machine Condition* (Performance)
100%
Figure V.22 Productivity Predictions for Machine Condition; Rock Soil * 80-100% Very Good, 60-80% Good, 40-60% Moderate, 20-40% Poor, 0-20% Very Poor
7.00
85% 90% 95%
Site,Weather and Safety Condition Effect*
100%
Figure V.23 Productivity Predictions for Site, Weather and Safety Conditions; Rock Soil * 80-100% V. Good, 60-80% Good, 40-60% Moderate, 20-40% Poor, 0-20% V. Poor
10.56
320 340 360 380 400 420 440 460 480 500 520 540 560
Pipe Length* (m)
Figure V.24 Relation between Productivity Rate and Pipe Length; Rock Soil * L< 300m short, L= 300-500m, L> 500 Long
99

10.00 11.00 12.00 13.00 14.00
Pipe Diameter (cm)
15.00 16.00
Figure V.25 Relation between Productivity Rate and Pipe Diameter; Rock Soil
18.00
£ § 17.00
« .is a- .£ Q "5 16.00
15.00 22% 23% 24% 25% 26% 27% 28% 29%
Expectations of Unseen Obstacles*
Figure V.26 Relation between Productivity Rate and Underground Obstacles; Rock Soil * 80-100% V. High Expectation, 60-80% High Expectation, 40-60% Moderate, 20-40% Low Expectations,
0-20% V. Low Expectations
V.6. HDD PRODUCTIVITY PREDICTION MODEL FOR SAND SOIL
V.6.1 Sand Model Training
The sand NF model considered five inputs: 1) pipe diameter, 2) machine
condition, 3) site and weather conditions, 4) pipe length, and 5) unseen obstacles, as
shown in Figure V.27. Similar to clay and rock models, each factor has its own number
of membership functions according to its data range. The sand model was trained via
80% of the collected sand data points, while it was tested by the remaining 20%.
100

Furthermore, sand NF model was developed based on 360 nodes (fuzzification layer 14
nodes; intermediate layer 332 nodes; defuzzification layer 14 nodes), 30 training data
pairs, and 9162 fuzzy rules. Thirty training cycles were used for training the sand soil
model. The training process engaged the tuning of the network weight structure for more
precision, thereby producing the target output for the network. Twenty percent of the
total collected data points were unexposed to the neurofuzzy system during the training
phase and were used for validation purposes.
2.
Fuzzification Layer
Intermediate Layer Defuzzification
Layer
Laver Output Layer
3; ji Burned ^
5; «,' Machine] (Condition) s .' I
Figure V.27 Basic Architecture of Sand NF Model
101

V.6.2. Sand Model Validation
i. Average Invalidity and Validity Percent (AIP & AVP)
As previously explained in clay soil, Equations V.4 and V.5 were used to
calculate the AIP and AVP for the sand NF model, which shows that AIP = 13.3313 %
and AVP = 86.6686 %. The validation process showed that the values of the predicted
outputs were almost 86.7% accurate. The AVP value can be considered as a satisfactory
validation result and the sand prediction model can be utilized for HDD prediction.
V.6.3. Case Study Description and Application of Sand Model
A pipe is installed underground at 2.5 meter depth (Project 3, which is located in
Connecticut, USA). An HDPE pipe is used with a diameter of 101.6 mm. The pipe is to
be laid at a distance of 660 m in sandy soil. A medium size rig is utilized for job
implementation. On site productivity was then calculated. The job was accomplished in 7
working days based on an 8 hour work day. Tables V.9 and V.10 show the durations of
various activities involved in the HDPE installation process.
Table V.9 Major Activities Durations (Sand Case Study)
Major Drilling and SP Activities
Site preparation (SP) Pilot hole drilling (PH) Reaming (R) Pipe Pull Back (PP) Total Major Activities Duration
Duration (min) 600 960 720 360
2640
102

Table V.10 Auxiliary Activities Durations (Sand Case Study)
Auxiliary Drilling and Pipe Connection Activities Pipe connection & layout Angle adjusting Drill pipe segments joining Attaching reamer/shackle Pipe swivel assembly Tracking activities All assessment activities Total Auxiliary Activities Duration
Duration (min)
600 60 360 60 60 60 120
1320-600 = 720
In this case study, the pipe connection and layout and site preparation was done at the
same time. Therefore, the pipe connection and layout time was neglected, as it was
already done in parallel with the site preparation time. Based on Equations V.l, V.2 and
V.3, the total activity time, Tj, Tx, and onsite productivity was calculated as:
Tj = 2640min and Tx = 720min
Then, Calculated Productivity (m/hr) = 640
(2640 + 720)/60 = 11.43m/hr
The project was implemented utilizing a medium drilling rig size (max torque; 4000-
20000 ft-lb), highly skilled operator and crew, moderate machine condition, with a high
expectation of unseen buried obstacles, and good site, weather and safety conditions.
Based on the above-mentioned input factors, the sand NF model processes the project
inputs. The predicted productivity was calculated to be 10.21 m/hr. The predicted result
showed a validation of 89.32%.
103

V.6.4. Sand Models Productivity Curves
Similar to the process used on clay and rock, the performed sensitivity analysis
for the sand NF model held the studied HDD factor at actual values while all other factors
were kept at their constant average values. Figure V.28 shows direct linear relation
between the production rate and the machine condition, while Figure V.29 shows inverse
linear relation of the pipe diameter with productivity. Furthermore, Figures V.30 and
V.31 show direct and inverse exponential relations of site, weather and safety condition,
and existence of unseen obstacles, respectively. The HDD productivity and pipe length
has a direct relationship in which the longer the pipe installation the more productive the
project, see Figure (V.32).
2 t» •5 Cu Q Q X
19.00 /~-v
,£ 18.90
S 18.80
£> •g 18.70
1 18.60
-a S 18.50 cu
18.40
Figure V.28 Productivity Predictions for Machine Condition; Sand Soil * 80-100% Very Good, 60-80% Good, 40-60% Moderate, 20-40% Poor, 0-20% Very Poor
T3
£ O •3
Q Q X
^ J3 — £>
ivi
o
Prod
u
19.04
18.99
18.94
18.89
18.84
18.79
Figure V.29 Relation between Productivity Rate and Pipe Diameter; Sand Soil
90% 95% 100%
Machine Condition* (Performance)
8 9 10 11 12 13
Pipe Diameter (cm)
104

20.00
10.00
65% 70% 75% 80% 85% 90% 95% 100%
Site,Weather and Safety Condition Effect*
Figure V.30 Productivity Predictions for Site, Weather and Safety Conditions; Sand Soil * 80-100% V. Good, 60-80% Good, 40-60% Moderate, 20-40% Poor, 0-20% V. Poor
Figure V.31 Relation between Productivity Rate and Underground Obstacles; Sand Soil * 80-100% V. High Expectation, 60-80% High Expectation, 40-60% Moderate, 20-40% Low Expectations,
0-20% V. Low Expectations
19.00
18.80
460 500 540 580 620 660 700 740 780
Pipe Length* (m)
820 860
Figure V.32 Productivity Predictions Pipe Length; Sand Soil * L< 300m short, L= 300-500m, L> 500 Long
105

V.7. AVERAGE VALIDATION OF THE DEVELOPED HDD-PRODUCTIVITY
PREDICTION NF MODELS
Three HDD productivity prediction models were developed and validated in order
to help HDD professionals during the pre-construction phase as a decision support tool.
Clay, rock and sand models show an AVP of 94.44%, 82.29%, 86.67%, respectively, (see
Figure V.33). Accordingly, the total average invalidity percent (TAIP) and total average
validity percent (TAVP) are calculated for the developed NF models to be TAIP = 12.2
% and TAVP = 87.8 % as shown in Figure V.34. The developed models display robust
validation results.
Figure V.33 Clay, Rock and Sand AIP/AVP
12.2%
a TAIP
a TAVP
Figure V.34 HDD-PP NF Model TAIP and TAVP
106

V.8. SOIL TYPE EFFECT ON HDD PRODUCTIVITY
The effect of various productivity factors of HDD operations in clay, sand and
rock soils are studied based on the developed NF models. Some of the HDD productivity
factors are studied within different ranges of data; however, the study is able to give an
idea about the relation between productivity performance and the various soil types
according to these studied factors.
Figures V.35a&c show the direct relation between HDD productivity and crew
performance and pipe length. HDD productivity is more sensitive to operator and crew
skills performance while operating in clay rather than rock soil. This is due to the non-
homogenous nature of clay soil conditions and the higher possibility of facing boulders or
underground obstacles. In addition, the longer the operation in rock soil the more need to
change the drilling head due to fraction, while the longer the drilling process in sandy soil
the more need of performing multi-reaming travels due to the heaving nature of sandy
soil. Figure V.35b shows the inverse relation of HDD productivity and the presence of
underground obstacles while operating in clay soil. This is because clay soil is more
likely to have boulders or voids, which might break the drilling head or get stuck. On the
other hand, rock and sandy soils show slight inverse relation with HDD productivity
because of their homogenous nature and less possibilities of facing underground
obstacles (i.e. sandy soil has no voids and rock soil has no boulders) compared to clay
soil. Therefore, HDD operations in clay soil are more sensitive to crew skills, pipe length
and underground obstacles than operating in rock and sand.
107

Figures V.35d&f present a direct relation between HDD productivity and machine, site
weather, and safety conditions in clay, sand and rock soils. Machine condition is more
sensitive to HDD productivity while operating in rock compared to clay and sand soils.
The difficulties of operating HDD machine in rock, due to its hard nature and continuous
need of changing the drilling head while operating, is significantly affected by the
operating machine conditions. Site weather and safety condition effect on HDD
productivity is almost similar for various soil types. Figure V.35e shows the inverse
relation of pipe diameter to HDD productivity. Pipe diameter has very small effect on
HDD productivity in various soil conditions.
108
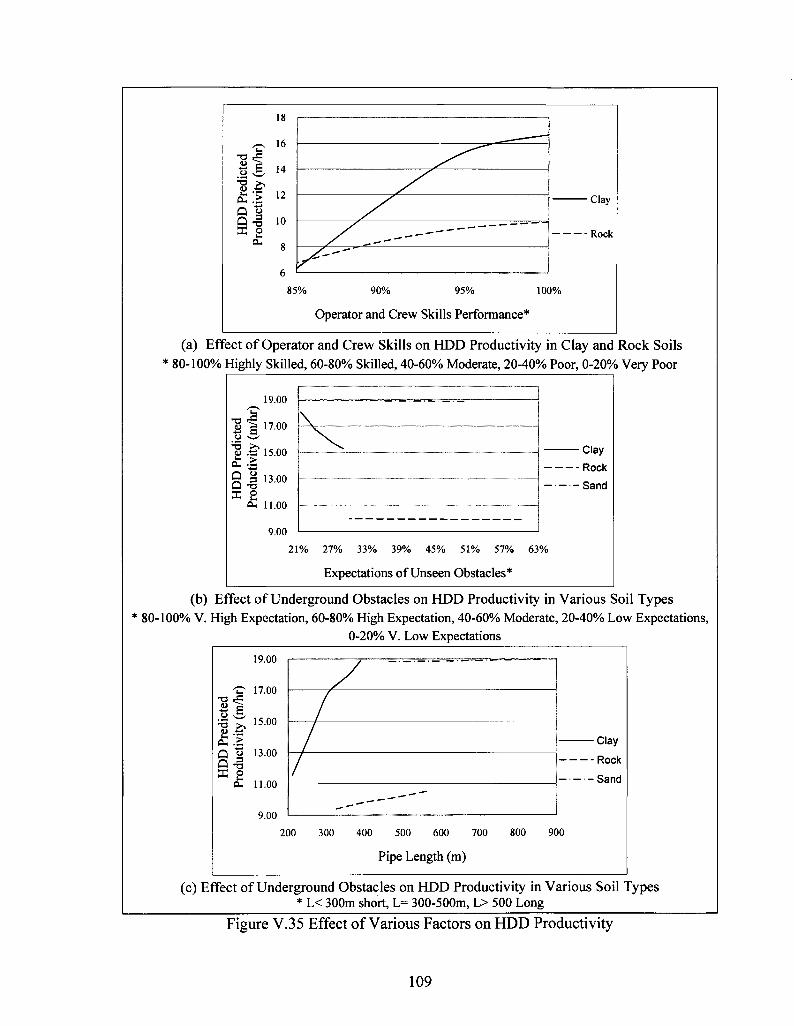
•Clay
Rock
85% 90% 95% 100%
Operator and Crew Skills Performance*
(a) Effect of Operator and Crew Skills on HDD Productivity in Clay and Rock Soils * 80-100% Highly Skilled, 60-80% Skilled, 40-60% Moderate, 20-40% Poor, 0-20% Very Poor
19.00
17.00 - o <u
1 £ 15.00
S 3 13.00 Q T3 X £
ftn 11.00
9.00
Clay
Rock
Sand
21% 27% 33% 39% 45% 51% 57% 63%
Expectations of Unseen Obstacles*
(b) Effect of Underground Obstacles on HDD Productivity in Various Soil Types * 80-100% V. High Expectation, 60-80% High Expectation, 40-60% Moderate, 20-40% Low Expectations,
0-20% V. Low Expectations
19.00
' D 17.00 -o «c •*-* e
15.00 •a >^ <u £ a. >. Q "8 13.00 D -5
a. 11.00
9.00
Clay
Rock
Sand
200 300 400 500 600 700
Pipe Length (m)
800 900
(c) Effect of Underground Obstacles on HDD Productivity in Various Soil Types * L< 300m short, L= 300-500m, L> 500 Long
Figure V.35 Effect of Various Factors on HDD Productivity
109

18.00
1? 16.00
£ J3, 14.00
2 « 12.00
Q 2 10.00 Q -3 X £ 8.00
0. 6.00 4.00
64
s /
Rock
Sand
% 69% 74% 79% 84% 89% 94% 99%
Machine Condition (Performance)
(d) Effect of Machine Condition on HDD Productivity in Various Soil Types * 80-100% V. Good, 60-80% Good, 40-60% Moderate, 20-40% Poor, 0-20% V. Poor
19.50
17.50
,ted
m/h
i
Q 3 9-^ X o
a.
15.50
13.50
11.50
9.50
Clay
Rock
Sand
7 8 9 10 11 12 13 14 15 16 17 18 19 20 21 22 23 24
Pipe Diameter (cm)
(e) Effect of Pipe Diameter on HDD Productivity in Various Soil Types * 80-100% Very Good, 60-80% Good, 40-60% Moderate, 20-40% Poor, 0-20% Very Poor
-a
20.00
18.00
16.00
•a >. 14.00
& . £ Q t3 12.00 Q -o X £ 10.00
D.
8.00
6.00
•Clay
•Rock
•Sand
20% 40% 60% 80% 100%
Site Weather and Safety Condition Effect
(f) Effect of Site Weather and Safety Condition on HDD Productivity in Various Soil Types
Figure V.35 Effect of Various Factors on HDD Productivity (Continued)
110

V.9. SUMMARY OF CHAPTER V
Eight factors were identified to be the most important factors affecting the HDD
construction operation. These factors were then ranked based on their relative
importance. Three NF models were developed to predict and assess the productivity of
HDD construction operations in clay, rock and sand soils. Eight input factors, i.e.
management, mechanical, environmental and pipe conditions and one output factor (i.e.
productivity) were used to represent the productivity prediction process. Comparing the
NF model results to the calculated on site actual results shows its robustness in predicting
the HDD construction operation productivity. The model validation results show that
clay, rock and sand models had an average validity percent of 94.44, 82.29 and 86.66,
respectively. Therefore, the proposed NF models are robust and can be used to predict the
productivity of HDD operations. It should also be noted that operator/crew skills, soil
type and pipe diameter are the most influential, while pipe length and site, weather and
safety condition are the least influential factors on HDD productivity. Results show an
inverse relationship between productivity and pipe diameter and existence of
underground obstacles. Results also show a direct relationship with all other factors.
I l l

CHAPTER VI
AUTOMATED HDD PRODUCTIVITY PREDICTION MODEL
(HDD-PP)
Recent developments in modeling software have resulted in facilitating the use of
this software and provided a wide range of applications that can be utilized with other
users. This chapter presents a methodology of developing an automated decision support
system for productivity prediction of HDD applications. The modeling software
(MatLAB, ver. 7.0) provides a graphical friendly user interface to facilitate common use.
This system is developed to assist contractors, consultants and engineers in predicting
time and cost for HDD applications, in the preconstruction (bidding) phase. The HDD-
PP program is developed using the interactive MatLab tools. The program is written by
the high-performance MatLAB language that is very similar to C and Fortran
programming languages. The following part will demonstrate the clay study case
mentioned in the previous section.
VI.1. FRAME WORK OF THE HDD-PP AUTOMATED TOOL
As discussed earlier in chapter III, HDD-PP requires data related to the factors
that affect the application process. The results include productivity prediction values in
m/hr. A high predicted value indicates a high expected production rate. The flowchart in
Figure VI. 1 summarizes the function of the proposed automated HDD-PP model. It uses
the graphical user interface MatLAB (ver. 7.6.0.324) to import and export data.
112

Out
put
Dis
play
R
ecal
ling
Mod
el
-H
l«
H H
-G
UI
inpu
t C
ontr
olle
rs
GU
I
n > o 3 I eu
O
O
*0
>-t O
D-
C
o <'
&
5*
3 O
a.
0)
Q.
3.
n>
Z z
s 3
2 05
1
8.""
o
Z
f I.
20
0 8.
o
Z
c/i
O
3 3
> a.
3 3 ist rat <• »

VI.2. GUI INTRODUCTION
The first graphical user interface page will welcome the user and introduce him to
the program as shown in Figure IV.2. The proposed automated decision support tool is
called Horizontal Directional Drilling Productivity Predictor (HDD-PP). It applies the
principles of neurofuzzy network technique. The HDD-PP will assist contractors and
consulting engineers to predict the HDD production rate based on their recourses and
project requirements in the preconstruction phase.
CONCORDIA UOTVERSITY-
Building, Civil and Environmental Engineering Department
WELCOME TO
HORIZONTAL DIRECTIONAL DRILLING PRODUCTIVITY PREDICTOR (HDD-PP)
Press Ok to Continue
Ok Cancel
Figure VI.2 HDD-PP Intro (Welcome Page)
VI.3. SELECTION OF SOIL TYPE
The next step allows users to select soil type. Three types of soil could be
obtained from this model; Clay, Sand and Rock. The selected model would be recalled by
the system, as shown in Figure VI.3. Users may select one soil type at a time.
114

• y Soil Type
r- CONCORDIA UNIVERSITY-
Building, Civil and Environmental Engineering Department
Soil Type Selection
Soil Type clay
rock sand
Ok Back
Figure VI.3 Soil Type Selection
VI.4. IMPORTING DATA
The next step for the user is to start inputting project data, as shown Figure VI.4
to VI. 10. The level of skill for operator and crew, diameter of installed pipe, capabilities
(size) of the rig utilized, condition of machines used, degree of expectations for
underground obstacles, length of target installation and site conditions, weather and
safety. However, for sandy soil, inputs will be limited to five as the model is developed
for a highly skilled operator and crew and medium rig size. This GUI demonstrates the
same inputs and values for the clay example explained earlier in the previous chapter.
Table VI. 1 shows the general limitation of inputs for all models. Nevertheless, the
program is designed to display the limit of accepted data values for each input.
115

Table VI. 1 HDD-PP Models Input Limitations
Soil Type
Cla
y R
ock
Sand
Modeling Factors
Operator & Crew Skills Pipe Diameter Drilling bit capabilities Machine Condition Unseen Obstacles Pipe Length Site & Weather Conditions Operator & Crew Skills Pipe Diameter Drilling bit capabilities Machine Condition Unseen Obstacles Pipe Length Site & Weather Conditions Operator & Crew Skills Pipe Diameter Drilling bit capabilities Machine Condition
Unseen Obstacles
Pipe Length Site & Weather Conditions
Limitations
Good and Very Good Between 101.6 mm and 609.06 mm Medium and Large Poor, Moderate, Good and Very Good Low, Moderate, High and V. High Expectations >250 and <1500 meters V. Bad, Bad, Moderate and Good Highly, Moderate and Very good From 150 to 762 mm Medium and Large Moderate, Good and Very Good Low, Moderate, High and V. High Expectations >213 and <2300 meter V. Bad, Bad and Moderate Very Good From 40 mm to 815 mm Medium Good and V. Good V. Low Expectations, High Expectations and Very High Expectations 85 and 1230 meter Good, Moderate and Bad
A number of choices are displayed for each qualitative factor based on its input range; i.e.
V. Poor, Poor, Moderate, Good and V. Good. The values available for each factor will be
active, where the user will be able to select. Other values, which are out of model range,
will appear inactive and cannot be selected. Each page carries the name of the target
input.
i. Clay Case Study Data Input
The first input factor is operator and crew skill degree and the user should be able
to choose between one of two options; Skilled and Highly Skilled, (V. Poor, Poor and
116

Moderate will appear as inactive). Similarly, in the following steps, the program will ask
users to select specific information based on the factors limitation shown in Table VI. 1.
rrappl OCS Clay
CONCORDIA UNIVERSITY-
Building, Civil and Environmental Engineering Department
Operator and Crew Skill Degree
Crew Skill
r r c
C Good
C V. Good Next Back
Figure VI.4 Operator and Crew Skills Selection
DRCClay
r- CONCORDIA UNIVERSITY-
Building, Civil and Environmental Engineering Department
Drilling Rig Capabilities
I— Rig Size-
(• Medium
C Large
[majdmum torque: medium 4000-20000 ft-lbs - laige> 20000 fl-lbs] Nej£t
--Tal'li
Back
Figure VI.5 Rig Size Selection
117

Pipe Diameter and Length:
A notice of diameter and length limits will be displayed (i.e. clay model can only
accept pipe diameters between 101.6 and 609.06 mm and pipe length between 250 and
1500 meters, see Figure VI.6). If the user entered an out of range value, an error message
will appear tagging the error type, see Figure (VI.7).
'_ :_:. [=jssi
CONCORDIA UNIVERSITY
Building Civil and Environmental Engineering Department
Diameter and Length of Installed Pipe
Model is limited to pipe diameter between 101.6 and 609.06 mm
300|
Model is limited to pipe length between 250 and 1300 meters
Next Back
Figure VI.6 Pipe Diameter and Length Selection
m • IQIxi
CONCORDIA UNIVERSITY
Building, Civil and Environmental Engineering Department
Diameter and Length of Installed Pipe
Model is limited to pipe diameter between 1016 and £09.06 mm
• tBIx l
Model is limited O the pipe diameter must be between 101.6 and 609.06
Next
OK
Back
Figure VI.7 Displaying Error; Out of Range Input
118

>MCCIay
CONCORDIA UOTVERSITY-
Building, Civil and Environmental Engineering Department
Utilized Machine Condition
r- Machine Condition
r C Poor
C Medium
ff Good
C V.Good
Next
i-iDiiXl
Back
Figure VI.8 Machine Condition Selection
>UGOCIay ,4
enter fxnms Trron/iroCTTV
Building, Civil and Environmental Engineering Department
Expectation of Under Ground Obstacles
C V. High Expectations
r HighExpectations
(• |M oderate Expectati. J
f* Low Expectations
r
-Plfxl
Next Back
Figure VI.9 Underground Obstacles Expectation Selection
119

SWSC Clay
CONCORDIA UHIVERSITY-
Building, Civil and Environmental Engineering Department
Site, Weather and Safety Condition
i- Site and Weather Condition-
r C Good
<• jModeratej
C Bad
C V. Bad Next
m fu. "Tnfxl
Back
Figure VI. 10 Site, Weather and Safety Condition Selection
VI.5. DATA PROCESSING AND RESULTS
Lastly, to achieve the result, the user must click the Productivity Predictor button.
The recalled soil type model processes the imported data for calculation of production
rate and displays the result as shown in Figure VI. 11. For performing another operation,
the user can click the "Back Home Button" and model will start over.
120

oasi
CONCORDIA UNIVERSITY-
Building, Civil and Environmental Engineering Department
PREDICTED PRODUCTIVITY
13.67 m/hr
Submitt Home Quit
Figure VI. 11 Representation of the HDD Predicted Productivity
VI.6. SUMMARY OF CHAPTER VI
The developed automated decision support tool will help the contractor and
consulting engineers to have an initial understanding about their target project time and
cost. This decision support tool is developed using the same modeling tool (MatLAB®),
thereby minimizing errors and bugs that would occur from integrating multiple software.
Therefore, the program will provide a robust platform for future research expansion.
121

CHAPTER VII
CONCLUSIONS AND RECOMMENDATIONS
VII.1. SUMMARY AND CONCLUSIONS
HDD has proven itself in the underground construction market as being one of the
most effective TT methods for new underground pipe/cable installations. Due to
competitive market conditions, client expectations and technological advancements, there
is an emergent need for HDD contractors to identify the major factors affecting their
project implementation. Utilizing a productivity prediction model helps in managing,
projects especially in the bidding phase. Despite the fact that it is one of the most widely
used TT techniques applied for new installations, there is little progress in models and
software development for the HDD technique.
Current research first investigated and identified main factors that affect HDD pipe/cable
installation technique. By means of a thorough literature review, application of AHP
technique and discussions with HDD experts, it was found that crew and operator skills,
drilling bit capabilities, machine condition, soil type, unseen buried obstacles, site and
weather conditions, pipe diameter and pipe length, are the important factors that affect
HDD.
In recent years, neurofuzzy technique has been applied to model the productivity of
subjective factors. The presented research work used a neurofuzzy approach to predict
and assess productivity of HDD based on identified management, mechanical,
122

environmental and pipe conditions in clay, sand and rock soils. Average validity percent
(AVP) of the clay, sand and rock models were 94.4%, 86.7% and 82.3%, respectively,
which showed their robustness in predicting HDD productivity. It was found that soil
type, crew and operator skills and pipe diameter are the most significant factors affecting
HDD productivity while weather conditions has the least effect. The developed NF
models will help experts to estimate and predict the HDD project duration.
Moreover, a user-friendly interface productivity prediction tool (HDDPP) is developed
by using MatLAB® (Version: 7.6.0.324 (R2008a)) based on ANFIS. The proposed tool
calculates the productivity of HDD based on different management, mechanical,
environmental and pipe factors that are selected by the user. Results are obtained through
the MatLAB® GUI and are represented in m/hr.
These models are tools for experts and professionals to help them perform productivity
calculation by quantifying the effect of some of the subjective factors. These tools will
help them to perform accurate schedules and reliable estimate cost for HDD works.
Moreover, they provide researchers and experts with the most significant factors that
contribute to HDD installations. The developed neurofuzzy methodology could be used
in similar research applications.
123

VII.2. RESEARCH CONTRIBUTIONS
The current research contributes to the HDD industry on various soil types, in the
following areas:
• Identify and study some of the important factors and their effect on predicting
HDD operation productivity and combines them with the knowledge of industry
experts.
• Develop productivity prediction models to estimate HDD productivity in clay,
sand and rock soils considering both quantitative and qualitative factors.
• Develop productivity curves for pipe installation based on the developed models.
• Develop an automated decision support tool (Productivity Predictor), which
provides productivity prediction cycle time in order to assist the construction
professional to estimate water, sewer and underground pipe installation duration.
VII.3. RESEARCH LIMITATIONS
Due to various data and time constraints, the research scope sustained some
limitations as follows:
• Limited number of variables and productivity measures that have an impact on
HDD pipe/cable installation.
• The collected data sets are limited due to lack of data and lack of finding a quality
database for HDD projects.
• The developed models are limited to clay, sand, and rock soils.
124

VII.4. RECOMMENDATIONS FOR FUTURE WORK
The integrated nature of HDD projects plays an important role in a successful
implementation of the HDD productivity predictor. The presented research work
addresses the comprehensive assessment of HDD productivity in such integrated
environment. It provides a simple platform to predict the HDD productivity and improve
HDD practices. Nevertheless, the timeframe of this research prevented the expansion of
the research to enhance factor selection as well as the developed HDDPP model. Various
latent research activities can be pursued in the future as follows:
> Current study enhancement areas:
• The collection of life-cycle data of HDD projects is subject to the availability and
accuracy of data and whether contractors and consultants keep such type of data
or not. With the availability of more data for HDD projects obtained from the
same facility type and from various construction fields, the neurofuzzy system
could be better trained and generate predictions that are more satisfactory. The
validity of the predicted HDD productivity models is still subject to the
consolidation of more customized project data.
• The present research work considered eight input factors. Nevertheless, this list
could be refined to only include the most significant factors or add other
important factors in order to increase the developed models accuracy. This could
reduce the system performance error and improve its results.
125

• The advantage of the developed methodology is that with some slight
modifications in the input factors more outputs could be obtained (i.e. cost, crew
size.. .etc.), which will manifold the usefulness of the model.
• Developing a web-based tool with neurofuzzy engine in order to allow for
executable file usage of FNN engine.
> Current study extension areas:
• Standardize data acquisition tools for contractors that cover more management,
mechanical, environmental and pipe physical factors. Integrate the in-house work
and the field dissembling time into the developed HDD productivity prediction
models.
• The research considered only three soil types (clay, sand and rock), where the
investigation into more soil types and calculating HDD productivity within these
soil types is subject to more customized data collection.
• Extension of the developed HDD pipelines installation prediction methodology to
other HEB trenchless techniques.
• Enhance the developed automated HDD-PP tool in order to provide better
representation of the analysis and results. In addition, the developed model GUI
can be linked to HDD projects database with the viewpoint of updating the model
every time a new HDD project data is acquired. This continuous retraining of the
developed model will increase its accuracy and decrease the error.
126

REFERENCES
AbouRizk, S. and Hermann, Ulrich H. (2000). Estimating Labor Productivity Using Probability Inference Neural Networks". Journal of Computing in Civil Engineering, ASCE, 14(4), pp. 241-248.
AboRizk, S., Knowles, P. and Herman, U.R. (2001). "Estimating Labor Production Rates for Industrial Construction Activities". Journal of Construction Engineering and Management, ASCE, 127(6).
Al-Aghbar, A. (2005). "Automated Selection of Trenchless Technology for Rehabilitation of Water Mains", Thesis in BCEE Department, Concordia University, April 2005.
Al-Barqawi, H. (2006). "Condition Rating Models for Underground Infrastructure: Sustainable Water Mains", Master's Thesis, Department of Building, Civil and Environmental Engineering, Concordia University.
Al-Barqawi, H. and Zayed, T. (2006). "Condition Rating Models for Underground Infrastructure: Sustainable Water Mains". Journal of Performance of Construction Facilities, ASCE, 126-135.
Albert, P. C , Daniel W. M. and John F. Y. (2009). "An Overview of the Application of Fuzzy Techniques in Construction Management Research". Journal of Construction Engineering and Management, ASCE, posted ahead of print, 22 May, 2009).
Ali, S., Zayed, T. and Hegab, M. (2007). "Modeling the Effect of Subjective Factors on Productivity of Trenchless Technology Application to Buried Infrastructure Systems". Journal of Construction Engineering and Management, October, Vol. 133, pp. 743-748.
Allouche, E. N., Ariaratnam S. T. and MacLeod C. W. (2003). "Software for Planning and Cost Control in Directional Drilling Projects". Journal of Construction Engineering and Management, ASCE, Vol. 129, No. 4, July/August 2003, pp. 446-453.
Allouche, E. N., Ariaratnam, S. T. and AbouRizk, S. (2001). "Applications of Horizontal Characterization Techniques in Trenchless Construction". Journal of Construction Engineering and Management, Vol. 127, No. 6, November/December 2001, pp. 476-484.
Allouche, E., Ariaratnam, S. and Lueke, J. (2000). "Horizontal Directional Drilling: Profile of an Emerging Industry" Journal of Construction Engineering and Management, January/February, Vol. 126, No. 1, pp. 68-76.
Ariaratnam, S. T. (2005)." Invited Presentation Development of Good Practices for Horizontal Directional Drilling ", Toward 21st Century for Trenchless Technology, Guangzhou, China.
Ariaratnam S. T. and Allouche, E. N. (2003). "Assessment of Emerging Pulled-in-Place Pipe Products for Trenchless Applications". Proceedings of Construction Research Congress In Construction - Wind of Change: Integration and Innovation, March 19-21, 2003, Honolulu, Hawaii.
Ariaratnam, S.T. and Allouche, E.N. (2000). "Suggested practices for installations using horizontal directional drilling", Practice Periodical on Structural Design and Construction, ASCE, November, Vol. 5, No. 2, pp. 142-149.
127

Ariaratnam, S., Lueke, J. and Allouche, E. (1999). "Utilization of Trenchless Construction Methods by Canadian Municipalities". ASCE- Journal of Construction Engineering and Management, March/April, Vol. 125, No. 2, pp. 76-86.
Ayub, B. M. and Haldar, A. (1984). "project Scheduling Using Fuzzy Set Concepts", Journal of Construction Engineering and Management, ASCE, 110, pp. 189-203.
Bossley, K.M. (1997). "Neurofuzzy Modelling Approaches in System Identification". Ph.D. Thesis in the Faculty of Engineering and Applied Science. Department of Electronics and Computer Science, University of Southampton.
Chae, M.J. and Abraham, D.M. (2001). "Neuro-fuzzy Approaches for Sanitary Sewer Pipeline Condition Assessment", Journal of Computing in Civil Engineering, ASCE, 15(1), pp. 4-14.
Colbourn, E. (2003). "Neural Computing: Enable Intelligent Formulations". Pharm. Technol. Suppl., 16-20.
Dubey, B., Gupta, M. and Zayed, T. (2006). "Deterministic Productivity Model for Horizontal Directional Drilling". INFRA 2006, Quebec City, QC, Canada, November 20-22.
Ersoz, H. Y. (1995). "A New Approach to Productivity Estimation: AHP and Fuzzy Set Application." MSc thesis, Construction Engineering and Management Division, School of Civil Engineering, Purdue Univ., West Lafayette, Ind.
Elwakil, E., Ammar, M., Zayed, T., Muhammad, M., Ahmed, E. and Ibrahim, M. (2009). "Investigation and Modeling of Critical Success Factors in Construction Organizations". Proceeding of Construction Research Congress, ASCE, pp. 350-359.
Faghri, A., and Hua, J. (1995). "Roadway Seasonal Classification Using Neural Networks". Journal of Computing in Civil Engineering, ASCE, 9(3), pp. 209-215.
Fayek, A. R. and Oduba, A. (2005). "Predicting Industrial Construction Labor Productivity Using Expert Systems". Journal of Construction Engineering and Management. August 1, 2005, Vol. 131, No. 8, pp. 938-941.
Fletcher, D. and Goss, E. (1993). "Forecasting with Neural Networks". Information and Management, 24, pp. 159-167.
Georgy, M., Chang, L. and Zhang L. (2005). "Prediction of Engineering Performance: A Neurofuzzy Approach". Journal of Construction Engineering and Management, ASCE, May, 131 (5), pp. 548-557.
Georgy, M.E. and Chang, L.M., (2005). "Quantifying Impacts of Construction Project Characteristics on Engineering Performance: A Fuzzy Neural Network Approach". Computing in Civil Engineering, ASCE.
Georgy, M.E. (2000). "Utility-based Neurofuzzy Approach for Engineering Performance Assessment in industrial Construction Projects". PhD Dissertation, School of Civil Engineering, Purdue Univ., West Lafayette, Ind.
Goh, A. T. C. (1995), "Modeling Soil Correlations Using Neural Networks". Journal of Computing in Civil Engineering, ASCE, 9(4), pp. 275-278.
Hegab, M. (2005). "Prediction of Productivity for Microtunneling Projects in Bidding Phase". Construction Research Congress 2005: Broadening Perspectives, Proceedings of the conference, April 5-7, 2005. San Diego, California.
Hegab, M. (2003). "Productivity Modeling of Microtunneling Projects". North Dakota State University of Agriculture and Applied Science, August, 2003.
Horizontal Directional Drilling HDD Consortium Good Practices Guidelines, May 2004.
128

Inliner Technologies Inc., "http://www.inliner.net/index.php". March 24, 2007, 16:37. Insituform Technologies Inc., "http://www.insituforrn.com/munsewers/mun_l_01.html".
March 24,2007,16:37. Iseley, T. and Gokhale, S. (1997). "Trenchless Installation of Conduits Beneath
Roadways". Synthesis of Highway Practice 242, Transportation Research Board, National Academy Press, Washington, D.C.
Jang, J., Sun, C. and Mizutani, E. (1997). "Neuro-Fuzzy and Soft Computing; a Computational Approach to Learning and Machine Intelligence. Upper Sadie River: Prentice-Hall.
Karshenas, S. and Feng, X. (1992). "Applicaton of Neural Networks in Earth Moving Equipment Production Estimating". Preceeding of the 8th Conference on Computing in Civil Engineering, pp. 841-847.
Karunanithi, N., Grenney, W. J., Whitley, D., and Bovee, K. (1994). "Neural Networks for River Flow Prediction". Journal of Computing in Civil Engineering, ASCE, 8(2), pp. 201-220.
Kirby, M., Kramer, S., Pittard, G. and Mamoun, M. (1997). "Design Guidelines and Procedures for Guided Horizontal Drilling. Part II". No-Dig Engineering, 3(4), pp. 13-15.
Kramer, S., McDonald, W. and Thomson J. (1992). "An Introduction to Trenchless Technology". Springer, ISBN: 04121213IX
Laney Directional Drilling, "http://www.laneydrilling.com". March, 2007. Lawson, G. (2003). "Water and Sewer Construction with Horizontal Directional Drilling
Equipment". American Society of Civil Engineers, May 8, pp. 1472-1480. Lorterapong, P. (1994). "A Fuzzy Heuristic Method for Resource-Constrained Project
Scheduling". Project Management Journal, XXV, pp. 12-18. Lorterapong, P. and Moselhi, O. (1996). "Project-Network Analysis Using Fuzzy Sets
Theory", Journal of construction Engineering and Management, ASCE, 122(4), pp. 308-318.
Lueke, J. and Ariaratnam, S. (2005). "Surface Heave Mechanisms in Horizontal Directional Drilling". Journal of Construction Engineering and Management, May, Vol. 131, No. 5, pp. 540-547.
Medsker, L. (1996). "Microcomputer Applications of Hybrid Intelligent Systems". Journal of Network and Computer Applications, Vol. 19, pp 213-234.
Miaoulis, George, and R. D. Michener. 1976. An Introduction to Sampling. Dubuque, Iowa: Kendall/Hunt Publishing Company.
Moselhi, O. (2005), "Change Orders Impact on Labor Productivity". Journal of Construction Engineering and Management, 131(3), pp. 354-359.
Najafi, M., (2005). "Trenchless Technology: Pipeline and Utility Design, Construction, and Renewal". McGraw-Hill, 2005, New York, ISBN: 0071422668.
National Research Council of Canada (NRC), 2004. "Assessing Canada's Infrastructure Needs: A Review of Key Studies" September 2004 < http://www.infrastructure.gc.ca/research-recherche/rresul/rs/rs09_e.shtml> surfed on Dec. 2006.
Nauck, D. and Kruse, R. (1999). "Neuro-Fuzzy Systems for Function Approximation. Fuzzy Sets and Systems". Journal of Fuzzy Sets and Systems, Vol. 101, pp. 261-271.
129
Nido, A. (1999). "Productivity Projection Model for Microtunneling Operations Based on a Quantitative Analysis of Expert Evaluation". MS Independent Research Study, School of Civil Engineering, Purdue University, West Lafayette, IN.
Nido, A. A., Knies, C. J., and Abraham, D. M. (1999). "Role of Operation Simulation in the Analysis and Improvement of Microtunneling Projects". Tunneling and Underground Space Technology, VI4, pp. 1-9, 1999.
North American Society of Trenchless Technology, "http://www.nastt.org". March 24, 2007, 16:37.
Olden, J. D. and D.A. Jackson. (2002). Illuminating the 'black box': Understanding variable contributions in artificial neural networks. Ecological Modeling, Vol. 154, pp.135-150.
Padilla, B. M. and Carr, R. I. (1991). "Resource Strategies for Dynamic Project Management". Journal of Construction Engineering and Management, ASCE, 117(2), pp. 279-293).
Portas, J. and AbouRizk, S. M. (1997). "Neural Network Model for Estimating Construction Productivity". Journal of construction Engineering and Management, ASCE, 123(4), pp. 339-410.
Refenes, A. P., Zapranis, A. and Francis, G. (1994). "Stock performance Modeling Using Neural Networks: A Comparative Study with Regression Models". Journal of Construction Engineering and management. ASCE, 119(1), 163-179.
Saaty, T. (1982). "Decision Making for Leaders: The Analytic Hierarchy Process for Decision in a Complex World". Lifetime Learning Publications, Belmont, California.
Saaty, T. (1991). " Decision Making with dependence and feedback: the analytic network process". Pittsburgh, PA, RWS Publications
Salem, O., Galani, N. and Najafi, M. (2003). "Productivity Analysis of Auger Boring Trenchless Pipe Installed Using Simulation". New Pipeline Technologies, Security, and Safety International Conference on pipeline Engineering and Construction 2003, July 13-16, 2003. Baltimore, Maryland.
Samer, E.A. and Sharara, L.M. (2006). "Neural Networks for Estimating the Productivity of Concreting Activities". Journal of Construction Engineering and Management, ASCE, June 2006, pp. 650-656.
Semaan, N. (2006). "Subway Station Diagnosis Index (SSDI): A Condition Assessment Model", Master's Thesis, Department of Building, Civil and Environmental Engineering, Concordia University.
Shahin, M. A., Maier, H. R. and Jaksa, M. B. (2003). "Settlement Prediction of Shallow Foundation on Granular Soils Using B-spline Neurofuzzy Models". Computer and Geotechnics, Vol. 30, pp 637-647.
Shao, Q., Raymond, C. and York, P. (2006). "Comparison of Neurofuzzy Logic and Neural Networks in Modeling Experimental Data of an Immediate Release Tablet Formulation". European Journal of Pharmaceutical Science, Vol. 28, pp 394-404.
Simon, A. and Biro, D. (2005). "About Neurofuzzy Module of the FuzzyTECH 5.5 Software". Online Edition at College of Nyiregyhaza, Proc. of 6th International Symposium of Hungarian Researchers on Computational Intelligence, Budapest, http://bmf.hu/conferences/SAMI2005/Agnes.pdf.
Staheli K. and Hermanson G. E. (1996). "Microtunneling : When, where, and how to use it'. Journal of Water Environment and Technology, Vol. 8, no 3, pp.31-36
130

Symeon C. (2004). "Optimum Bid Markup Calculation Using Neurofuzzy Systems and Multidimensional Risk Analysis Algorithm". Journal of Computing in Civil Engineering, ASCE, 18(4), pp. 322-330.
Taylor, J.G. (1996). Neural Networks and Their Applications. John Wiley & Sons Ltd.,, August 15, 1996, England. ISBN-13: 978-0471962823.
TT Technologies Inc., Products, "http://www.tttechnologies.com/''. February, 2007. Vermeer Manufacturing Company, HDD Catalogue, "http://www.vermeer.com". April,
2007. Wilkinson, D. (1999). "Successful Micro-tunneling: Matters Which Must Be Considered"
Tunneling and Underground Space Technology, Volume 14, Supplement 2, pp. 47-61(15).
Yamane, Taro. 1967. Statistics, An Introductory Analysis, 2nd Ed., New York: Harper and Row.
Zadeh, L.A. (1965). "Fuzzy Set Information Control". 8, 338-353. Zafar, K. (2005). " Modeling and Parameter Ranking of Construction Labor
Productivity". Master's Thesis, Department of Building, Civil and Environmental Engineering, Concordia University.
Zayed, T. and Halpin, D. (2005). "Pile Construction Productivity Assessment." ASCE-Journal of Construction Engineering and Management, Vol. 131, No. 6, June 1. pp.705-714.
Zayed, T. and Halpin D. (2004). "Quantitative Assessment for Piles Productivity Factors". Journal of Construction Engineering and Management. ASCE, 130(3), pp. 405-414.
131

APPENDICES
132

Appendix (A): Trenchless Technology Methods Overview
Trenchless technology systems utilized on underground pipelines fall into two
broad categories:
A. Trenchless Construction Methods (new pipelines and services installation)
• Horizontal Earth Boring (HEB)
- Horizontal Auger Boring (HAB)
- Horizontal Directional Drilling (HDD)
- Pipe Ramming (PR); Closed End; Open Face
- Micro Tunneling (Slurry - Auger)
• Pipe Jacking (PJ)
• Utility Tunneling (UT)
B. Trenchless Rehabilitation Methods (replacement & renovation of existing pipes)
Non-Structural Methods:
• Under Ground Coating & Lining
• Localized Repair (LOR'S) (Point Repair - Sleeves)
Semi-Structural Methods:
• Cured In Place (CIP)
• Slip Lining (SL)
• Thermoformed Pipe (TP)
• Close Fit pipe (CFP)
Structural Methods:
• In Line Replacement
- Pipe Bursting (PB) and Pipe Removal (PV)
133

A. Trenchless Construction Methods (new pipelines and services installation)
1. Horizontal Earth Boring
Based on the mode of operation, the Horizontal Earth Boring could be subdivided
into four major groups depending on how excavated material are transported either by
slurry or by auger, and how excavating is achieved either by boring, hammering or
manually.
L Horizontal Directional Drilling.
There are three main steps for achieving a successful pipe installation using HDD
technique (Ariaratnam and Allouche, 2000).
Pilot Bore
Firstly, is making the pilot hole by using the drilling rig and start drilling from the
earth surface at a pre-determined angle and along a defined path using drilling rig, drill
bit, the steering tool and the bentonite slurry injection under high pressure, as shown in
Figure (A.l). Steering is controlled by rotating the drill head and pushing the drill string
forward until the required direction is obtained, forth while drilling is continued along the
realigned path.
Figure A.l Pilot Hole (Adapted from Richard, 2004)
134

Reaming/Hole Enlargement
Once the drill bit exits the other end of the drill hole, the drill bit and steering tool,
are detached and a reamer is fastened to the drill string, as shown in Figure (A.2).
Depending on the pipe diameter to be installed, several reaming times could be applied to
reach the determined diameter. During the reaming process, bentonite-drilling mud is
pumped, under high pressure to the reamer. While pulling back the reamer by the drill
rig, drill pipe is attached continuously behind the reamer for the successive scrub and
pipe pulling operations (Good practices, 2004)
Figure A.2 Pre-Reaming (Adapted from Richard, 2004)
Pipe Pullback
On the finish of the hole reaming, the swab, where the high pressure drilling mud
is pumped, is pulled through the hole. Then the pulling head is connected, to the drill
string via a swivel. The swivel isolates and prevents the pipe from rotation during the
pullback, as shown in Figure (A.3). The pipe is then pulled back toward the entrance hole
by the drill rig. Once the pipe has been fully pulled in, usually hydrostatically is tested by
the client (Good practices, 2004).
135

Figure A.3 Pull Back (Adapted from Richard, 2004)
Layout and Site Preparation
Permanent access to the entrance and exit sites for the HDD must be constructed
prior to starting the job, and a hard standing area for the drilling operation prepared at
each of these points as shown on Figure (A.4) and (A.5).
Layout of Rig Site
1 drill r'p
3 fl'J pips raU
4 five- pufflp
ft TJ .3 tar.<
6 recydrcg unit {Sfspara: on tf aftngs 'rem mudj
9 generators
1 a i-tf-saiin ccrte-'tet
v cfee
52 crew ccrtaner
13 cxy pit
14 mci pit (twriporary storage fc- used dr '*HJ nwdj
wit? i i . ^ l ^ "'H.
^ . .
Figure A.4 Rig Site Layout (Adopted from Laney Directional Drilling, 2007)
136

V Layout of Pipe Site = j
Figure A.5 Pipe Site Layout (Adopted from Laney Directional Drilling, 2007)
For an effective and safely implementation of any HDD operation, a sufficient space
based on the drilling bit capabilities is required on the rig side. A large river crossing unit
requires a minimum working area of 30 x 50 m, whereas a mini-rig may requires a
working space of about 3 x 3 m. As a safety factor, same as the rig space dimensions
should be required on the pipe side in case there is a need to move the rig on the other
side and attempt drilling from this end of the crossing. In addition, to conduct a
productive single continuous pullback operation, a sufficient space should be provided at
the pipe side to fabricate the product pipeline into one string (Ariaratnam and Allouche,
2000).
ii. Horizontal A uger Boring (HAB)
Auger Boring is accomplished with an Auger Boring Machine by jacking a casing
pipe through the earth while at the same time removing earth spoil from the casing by
137

means of a rotating auger inside the casing. The typical Auger Boring installation begins
with the installation of bore pits at the beginning and end of the proposed bore. Bore pit
dimensions vary depending on the size and length of the casing being used, and on the
depth of the boring. Generally, the length varies from 26 to 40 feet long and 8 to 12 feet
wide (Najafi M., 2005).
ii'i. Pipe Ramming (PR)
Pipe ramming is a trenchless method of installing a steel pipe or casing using a
pneumatic tool to hammer the pipe or casing into the ground. The pipe could be rammed
with the leading edge either open or closed. Pipes up to 8 inches could be rammed with
the end closed; however, this method is more difficult and is not normally recommended..
This method is frequently used under railway and road embankments for installation of
medium to large diameter pipes. Steel pipe is used for the casing, as no other material is
strong enough to withstand the impact forces generated by the hammer.
/v. Micro-tunneling (Slurry - A uger)
Micro-tunneling has been increasingly used for installing new pipe construction.
According to ASCE's "Standard Construction Guidelines for Micro-tunneling," Micro-
tunneling can be defined as "a remotely controlled and guided pipe jacking technique that
provides continuous support to the excavation face and does not require personnel entry
into the tunnel". There are two major types of Micro-tunneling; (1) slurry method and (2)
auger method. In the slurry-type method, slurry is pumped to the face of the MTBM.
Excavated materials mixed with slurry are transported to the driving shaft, and
138

discharged at the soil separation unit above the ground. In an auger-type method,
excavated materials are transported to the drive by the auger in a casing pipe, and then
hoisted to the ground surface by a crane (Najafi M., 2005 and Karmer et al. 1992).
2. Pipe Jacking
As a specific installation technique, pipe jacking is the process of installing an
underground prefabricated pipe from a drive shaft to a reception shaft. When referred to
as a process it is a tunneling operation using thrust boring and pushing pipes with
hydraulic jacking forces (http://www.inliner.net/index.php, March 24, 2007, 16:37). It
could be applied to other trenchless technologies such as auger boring and micro-
tunneling. The Pipe Jacking as a specific installation technique is a cyclic procedure that
uses the thrust power of hydraulic jacks to force the pipe into the soil. As the pipe is
pushed the ground is excavated and the spoil is transported through the pipe to the drive
shaft where it will be disposed from. After the successful installation of a pipe the rams
of the jacks are retracted so that another pipe could be installed using the same cycle
again (Iseley and Gokhale, 1997), see Figure (A.6).
Figure A.6 Typical Components of A Pipe Jacking Operation (Iseley and Gokhale, 1997)
139

3. Utility Tunneling
Utility tunneling is different from other general tunneling in virtue of the tunnel
size and applications. Utility tunnels are used as conduits for utilities and pipelines rather
than traffic passages. The method of excavation for utility tunneling and pipe jacking are
similar with one difference which is the lining. The pipe is the lining for the pipe jacking
method while in utility tunneling special liner plates or rib and lagging systems are used
to support the ground temporarily, as shown in Figure (A.7), (Najafi, 2005 and Iseley and
Gokhale, 1997).
Power Generator —>. pack '
Laser target Conveyor
Ventilation blower
Oirt
I ii ill Q^irFn-
o f o
Tunnel boring z Haul unit L T h r u s t ^-Tunnel machine section liner
Laser
Skid base
Tunnel support
Pit floor
Figure A.7 Typical Components of Utility Tunneling System Techniques
(Iseley and Gokhale, 1997)
The main characteristics of the horizontal directional drilling for new pipeline installation
technique among other HEB pipe installation systems are shown in Table (A.l).
140

Table A. 1 Main Characteristics of HDD Among Horizontal Earth Boring Systems
Method
Horizontal Directional Drilling
Horizontal Auger Boring
Mini
Midi
High
Auger Boring
AB Steered on grade
AB Steered on line grade
Pipe Ramming
Micro Tunneling
Diameter Range (in)
2 - 1 2
12-24
24-48
4 - 6
4 - 6
4 - 6
Up to 120
10-136
Max Installation
(ft)
Up to 600
Up to 1000 H
Up to 6000 H
600
600
600
400
500-1500
Pipe Material
PE, Steel, PVC Clay, FRP PE, Steel
Ductile iron
PE, Steel
Steel
Steel
Steel
Steel
RCP,GRP,VCP DIP, Steel,
PCP
Typical Application
Pressure pipe Cable
Pressure pipe
Pressure pipe
Road & rail crossing
Pressure & gravity pipe
Pressure & gravity pipe
Road & Rail Crossing
Gravity Pipe
Accuracy
Varies
Varies
Varies
(+/-)1% of bore length
(+/-) 12 inch
(+/-) 12 inch
Dependent on set up
(+/-) 1 inch
B. Trenchless Rehabilitation Methods (Replacement & Renovation of Existing Pipes)
1. Non Structural Methods (Najafi, 2005)
i. Underground Coatings and Linings
A method of pipeline renewal is spraying the pipe with a thin mortar or a resin
coating to protect it against corrosion and improve its hydraulic characteristics. Such
treatment is suitable for pipes that are less than 48" in diameter (Najafi, 2005). Structural
integrity is not well enhanced with this method but sealing joints and leak prevention are
suited. The materials used can be categorized into four categories: cementitious,
polymers (epoxies and polyesters), sheet liners (PVC) and cured in place liners (polymer
epoxy), these material types could also be used together.
141

ii. Localized Repair:
Localized Repair is when the pipe defects are repaired temporarily and/or locally
without renewal of the whole pipe section. Localized repair (LOR) or point source repair
(POR) are used to different problems such as cracks, broken pipes, hammer taps, root
intrusion, infiltration, debris, soil erosion, ex-filtration and misaligned pipe sections. LOR
uses different techniques to fix these problems such as: robotic repair, grouting, cured in
place pipe (CIPP), internal seal and shotcrete. The repair is done by spraying the pipe
with a thin mortar or a resin coating to protect it against corrosion and improve its
hydraulic characteristics.
2. Semi Structural Methods
L Cured-In-Place Pipelining (CIPP)
Cured-In-Place Process (CIPP) is a trenchless technology invented in England by
Insituform Inc. in 1971. It is a unique process for reconstructing deteriorating pipeline
systems in various applications. Avoids unnecessary costs associated with digging and
replacing buried pipeline. Also, does not require bonding to the host pipe wall to operate
successfully (http://www.insituform.com/munsewers/mun_l_01.html, March 24, 2007,
16:37). A new pipe is formed inside the existing conduit; water, steam or ultraviolet is
used to install a flexible tube saturated with a liquid thermosetting resin; this process
results in a continuous, tight-fitting, pipe-within-a-pipe. The finished cured-in-place pipe
liner fit tightly and neatly against the existing pipe walls.
142
ii. Slip-lining (SL)
In the slip-lining process, a winch cable is inserted through the existing line and
then attached to the front of the new liner. The new liner pipe is then pulled into the
existing pipe, and the new liner pipe reconnected to the system. If needed, the void
between the new and old pipes can be filled by grouting. Slip-lining (SL) is categorized
into two categories: continuous and segmental (Dias B. et al, 2007).
Hi. ThermoformedPipe (http://www.nastt.org, March 24, 2007,16:37)
This type of trenchless pipeline uses PVC or P.E. pipe that can be repeatedly
softened by heating and hardened by cooling through a temperature range characteristic
of the plastic and that in the softened state can be shaped by flow into articles by molding
or extrusion.
iv. Close Fit Pipe (Najafi, 2005)
This method could be used for both structural and non structural purposes, in the
first we use the reduced diameter pipe method (4" to 30" dia.) while in the later we use
the mechanically folded pipe method (up to 64" dia and 1000' in length).
Reduced diameter pipe method:
The usage is mainly to pressurized pipelines, It involves the use of long butt fused
section of P.E. pipe then the diameter of the P.E. pipe is reduced from its original state by
thermal method (swage) or mechanically (roll down). After insertion of P.E pipe, it is
reverted to its extruded diameter making a close fit with host pipe.
143

Mechanically folded pipe method:
It is similar to the reduced diameter pipe method but the P.E. pipes are butt fused
and mechanically folded at site then after insertion of P.E. pipe it is reverted to its
original state by pressurization with water at ambient temperature to form a close fit with
the host pipe.
3. Structural Methods
L Pipe Bursting
Pipe Bursting is a replacement system called also Pipe Cracking, Pipe Splitting
and Pipe Eating. This technique is used to replace deteriorated pipes rather than
rehabilitating or repairing them. The replacement is performed by crushing the old pipe
and removing its fragments to create a void that will be filled with a new pipe. This
method is applied only to structural replacements since the old host pipe is broken into
bits. (Al-Aghbar A., 2005)
ii. Pipe removal methods: (Najafi M., 2005)
Pipe Reaming: It is used in directional drilling for pipe replacement. The pilot is inserted
through the pipe then the existing pipe is pulled back by a reaming tool which grinds it
while the new pipe is installed. The excess material from the grinding is carried with the
drilling fluid to the reception pit. This method is used for removal of vitrified clay pipe,
PVC, and asbestos cement then replaced by HDPE or PVC pipe of equal or larger
diameter.
144

Pipe Eating: It is a modified micro tunneling adapted for pipe replacement. The new pipe
installed after the existing pipe is crushed by the micro tunneling boring machine, which
is remotely controlled, and laser guided. The particles of the crushed pipe are circulated
by the slurry system. The boring machine is launched from the insertion pit and a jacking
frame is used to provide a thrust force to push the new pipe and the machine forward.
Pipe Ejection or Extraction: Pipe Ejection is a modified pipe jacking where the jacking
frame in the insertion pit pushes out the existing pipe, and Pipe Extraction is a modified
static pipe bursting where the extraction machine placed in insertion pit pulls out the
existing pipe. The new pipe is installed while the existing pipe is being removed. This
method is used only with existing pipes that can withstand the push or pull without being
broken
Table (A.2) shows the main characteristics of trenchless rehabilitation methods for
existing pipelines.
145

Table A.2 Main Characteristics of Trenchless Rehabilitation Methods
Method
Cured In Place
Modified Slip Lining
Inverted in place
Winched in place Panel Lining Spiral
Wound Formed In
Place
Under Ground Coating & Lining
Slip Lining
In Line Replacement
Close Fit pipe
Localized Repair
Point source repair
Segmental
Continuous
Pipe bursting
Pipe Removal
Pipe Insertion Structural
Non-Structural
Robotics
Grouting
Internal Seal
Point CIPP
Thermoformed Pipe
Diameter Range (in)
4-108
4-100
More than 48 inch
6 -108
8- 144
3-180
24-160
4 - 6 3
4 - 4 8
Up to 36
Up to 24
3 - 2 4
3-36
8 - 3 0
NA
4 - 2 4
4 -48
4 -30
Max Installation
(ft)
3000
1500
Varies
1000
Varies
1000
1000
1000
1500
300
500
1000
1000
NA
NA
NA
50
1500
Pipe Material
Thermoset resin/fabric composite
Thermoset resin/fabric composite
GRP
PE, PVC, PP, PVDM
PVC, HDPE
Epoxy,polyster,silicon Vinyl ester, polyurethane & cementations material
PE, PP, PVC, GRP (-EPand-Up) PE, PP, PVC,
PE/EPDM
PE, PVC, PP, GRP
PE, PVC, PP, GRP
Clay, Ductile Iron
HDPE, MDPE
HDPE, MDPE
Epoxy resins/cement mortar
Chemical Gel, Grouts, Cement based grouts
Special Sleeves
Fiber Glass, Polyester
HDPE, PVC
Typical Application
Gravity & pressure pipe
lines
Gravity pipe lines
Gravity & pressure pipe
lines
Gravity & pressure pipe
lines
Pressure and gravity pipe
lines
Pressure and gravity pipe
lines
Gravity
Any
Any
Gravity Gravity &
pressure pipe lines
146

Appendix (B): Horizontal Directional Drilling Equipment
1. Drilling Rigs
Najafi, (2005) classified the drill rigs into three main categories: mini; midi; and
high, see Table (B.l). Rigs in each category are able to installing certain diameters and
lengths of pipes based on their particular thrust/pullback and rotational torque. The "drill
rig" consists mainly of the inclined ramp equipped with a carriage, control cab and the
hydraulic power unit as shown in Figure (B.l):
• Inclined ramp equipped with a carriage: that can be moved up and down the ramp to
advance and retract the drill string. The carriage slide forward on a frame and pushes
the pipe into the borehole. The carriage is then retracted and a new pipe segment is
attached.
• Control cab: houses the controls and personnel necessary to operate the drill rig.
Hydraulic power unit: provides power to the directional drilling rig. The power unit is
typically either mounted on a semi trailer along with the control cab or positioned
next to the rig as a stand-alone piece of equipment.
Semiautomatic break-away service
Anchoring unit
Drill rod magazine All-round lamp
Bore head
Remote control / Operator panel
Chain drive
Hatz Motor
Hydraulics
Operator seat Stabilisors Track-mounted undercarriage
Figure B.l Basic Component of Bore Rig (Adopted from TT Technologies Inc., 2007)
147

Table B.l Classification and Characteristics of HDD Rigs (Good Practices Guidelines, 2004)
Thrust/Pullback
Maximum Torque
Rotational Speed Carriage speed Carriage drive
Drill Pipe Length Drilling Distance Power source Mud Pump Weight of Drill Rig Rig Footprint Area (width x length) Recommended Work Area Requirement (width x length)
Small Rigs
< 40000 lbs
< 4000 ft-lbs
> 130 rpm > 100 ft/min Chain, Cylinder, or Rack & Pinion 5 - 10ft < 700 ft <150hp < 75 gpm <15000 lbs 3 ft x 10 ft. to 7 ft x 20 ft
20 ft x 60 ft
Medium Rigs 40000-100000 lbs 4000 - 20000 ft-lbs 90-210 rpm 90-100 ft/min
Chain or Rack & Pinion
10-30 ft < 2000 ft 150-250 hp 50 - 200 gpm < 60000 lbs 7 ft x 20 ft. to 8 ft x 45 ft
100 ftx 150 ft
Large Rigs
>100000 lbs
> 20000 ft-lbs
< 210 rpm < 90 ft/min Rack & Pinion with or without cable Assist 3 0 - 4 0 ft < 6000 ft > 250 hp > 200 gpm > 60000 lbs
>8f tx45f t .
150 ftx 250 ft
2. Bore Drilling.
Bore drilling equipments include drill bits, drill pipes, and reamer.
a. Drill Bits
Drill bits are used to facilitate steering and to excavate the soil or rock at the face of
the bore, see Table (B.2). Common types of drill bits used in the HDD industry are:
• Slanted face bits: These are generally used in unconsolidated soils and soft to
medium consolidated soil conditions (i.e. clay, silt, sand and soft sandstone).
• Slanted face rock bits: Slanted face rock bits are applicable in harder ground
conditions and soft rock that can't be readily penetrated with thrust alone. The
face of the tool usually has one or more nozzles emitting pressurized drilling
148

fluid. In the harder ground conditions, steering is accomplished by wiggling
clockwise and counters clockwise
• Hard rock or Mud motors: These are utilized in ground conditions ranging from
hard soil to medium rock, where an aggressive cutting bits and mud motors are
used. This system uses a positive displacement motor, which generates torque
and rotation at the drill bit from the flow output of the mud pump.
Table B.2 Drill Bit Types and Application Guidelines (Good practices, 2004)
Drill Bit Type Applications Comments Slanted-Face Bits Flat Spade
Bent Spade
Modified Spade
Rock bits
Clay
Sand Organic soils Hard Ground conditions Rock Hard Pan
Increase width, length, and/or angle for more aggressive steering
May be modified by adding teeth, tapers, etc. to match conditions Small surface steering area; abrasion and impact resistant cutters
Mud Motor Rock Bits Roller-cone (Mill tooth) Sealed Bearing roller-cone (Tungsten Carbide Inserts) Sealed Bearing Roller-cone/Drag bit Polycrystal Diamond Compact (PDC) Drag bit
Soft rock Medium rock
Hard rock
Hard rock formations
Generally too expensive and fragile for HDD applications
Compressive strength of rock types
Soft rock: < 5000 PSI, Medium rock: 5000 - 10000 PSI and Hard rock: > 10000 PSI
b. Back Reamer
Mainly used for enlarging the bore sufficiently to facilitate and fit the pipe
installation. The reamer should be able to carry the native material or minimizing it to
149

convenient cuttings, mixing those cuttings with the slurry, and preparing the bore for the
pipe installation, see Figure (B.2).
All purposes Compaction Mixing Hole opener.
Figure B.2 various models of back reamers (Adopted from Vermeer, 2007)
3. Drilling Fluid, Delivery, Recovery and Containment System
Drilling fluid system main functions are carrying out spoils, cleaning, cooling,
lubricating, stabilize borehole and driving mud motors.
Mixing and delivery system (Ariaratnam and Allouche, 2000)
Proper drilling fluid additives are added to water producing the drilling fluid
mixture (slurry) as for the local geological conditions. Mixing system components
include a gasoline or diesel powered engine, a hopper for mixing and adding materials,
one or more centrifugal pumps, delivery hoses and tanks to minimum of 300 gallons. The
mud pump carries out the drilling fluid to the rig at the required flow rate and pressure.
Storage tanks
"Steel Water storage tanks", is a must at locations lacking an adequate source of
fresh water. They are located next to the mud system.
150

Cleaning systems
Cleaning systems are used to remove the cuttings and to recycle the drilling
fluids. The drilling fluid enters a shale shaker for initial coarse particle separation, and
then the slurry undergoes further cleaning through de-sanding and de-silting units.
4. Bore Tracking Equipments
Tracking systems are required to guide drill bit in the right path and direction of
installation. A sensing unit is attached to the rear of the steering tool. It defines the exact
location of the drilling tool (position, depth and orientation) for the operator.
Accordingly, from this data, the operator identifies the location of the drill bit at all times
and fixes the path if needed.
Typical methods of bore tracking (Ariaratnam and Allouche, 2000; Ariaratnam 2005)
a. Walkover system
This is the common used system for drilling operation. It consists of transmitter,
receiver, and an optional remote monitor, see Figure (B.3). The transmitter is equipped
behind the drill bit, in which it transmits the signals to the surface. A hand-held receiver
detects these signals on the surface, and analyzes the data. Signals received are displayed
in numeric values or graphical forms. The remote monitor reduces drilling time by
providing the driller with the required information needed to locate and deduce the
reaction of the drill head to the steering and drilling conditions, thus minimizing over
steering and miscommunication and increasing productivity
151

Advantages: In spite of its market price, the only major cost is the batteries and sondes
replacement, in addition to its higher productivity among the other systems.
Limitations: Tracking is limited according to the geological and site conditions, i.e.: in
case of drilling work across river or freeway, it is not an easy task to walk over.
The signal transmitted from the sonde often interferes with signals from other media
such as overhead power lines, traffic signals, rebar in foundation (Ariaratnam and
Allouche, 2000; Ariaratnam 2005)
Figure B.3 Bore Tracking Equipment-Walkover System
b. Wire line system
It consists of the probe placed inside a nonmagnetic drill collar near the drill bit,
wire connecting the probe to an interface unit on the drill rig, readout box, computer and
printer at the driller's station. Therefore, the position can be located with the signal from
the transmitter to the receiver through the wire. The remote device displays the position
information. The bore path is monitored during the pilot bore by taking periodic readings
of the inclination and azimuth of the probe. The probe's accelerometer measures gravity
and resolves the tool's vertical-horizontal inclination. A magnetometer measures the
earth's magnetic field and dip angle to resolve the tool's relationship to magnetic north.
152

Information is transmitted to the interface unit, which connects to a laptop computer and
printer and provides the driller with constant updates of drill head roll, pitch, and
direction.
Advantages: No depth limitation, minimize reading errors, no interference of signal,
more efficient versus the time loss in walkover system for battery change.
Limitations: high capital costs and the need for highly skilled operators (Ariaratnam and
Allouche, 2000; Ariaratnam 2005).
5. Accessories (Cable/Pipe Pulling Devices/Swivels)
Cable grip: This is attached to the outside of the pipe and can be fixed or bind
with embrace or nylon ties at the end to avoid pulling off.
Pipe pulling devices: This consists of the duct puller and pulling head. Duct puller has
two sides, one end has one piece for cable connection; the other side has one or many
pieces which are used for pipe connection. Pulling heads are made from pre-fabricated
heavy steel with a central hole to fasten the swivel.
Swivel: This is utilized to connect the pull section with the leading reaming assembly to
reduce the torsion transmitted to the pipe; which could happen with large diameter pipe,
by a flexible link with the pulling head.
153

Appendix (C): Questionnaire Samplers
QUESTIONNAIRE SAMPLE I
I. Personal Information : (Removed due to confidentiality and privacy Policy)
Name: Email: Phone:
II. Time and Pipe Information:
Please select one previously completed project for each questionnaire you will be completing and answering the following questions.
Project Start Date: 21/07/07 No. of Actual Working hours/day: 10 Pipe/Cable Type: HDPE Pipe/Cable Diameter (mm): 100
Project End Date: 23/07/07 Pipe/Cable Length (m): 200 Pipe/Cable Depth (m): 10 Soil Type: Clay
Drilling Rig Size: • Small • Medium • Large Project Place:
III. Activities Information:
A. Estimate most probable duration of each HDD activity cycle time for the selected project.
1 Activities H H Site Preparation B H Pilot hole drilling
^ H Reaming
^ ^ Final pipe pulling H H Angle adjusting at bit entrance ^^M Drill pipe segments joining ^^M Reamer with shackle attaching for pre-reaming H 9 Pipe/Cable segments connection and layout E | Pipe swivel assembly for pipe pullback ^^M All tracking activities ^ ^ f l All Assessment Activities
Estimated Time (Minutes)
Most Probable 120 240
480
60 10 5 15
600 120 60 90
154

Ineffective Performance (Quality) Level Effective Performance (Quality) Level Ineffective Performance (Quality) Level
1 2
Effective Performance (Quality) Level
4 S
Extremely Ineffective
Moderate ly Ineffective
Nei ther Effective nor
Ineffective
Modera te ly Effective
Ext remely Effective
Subjective Performance Scale
B. According to the above scale, please, rate the effect of the following factors on HDD process productivity.
1 Questions ^ ^ ^ H Drilling rig operator and crew
H S H Rig size/drilling bit capabilities?
Hi&f l Safety regulations?
H H I Machine condition? H§f l | l Slurry flow rate and slurry B ^ T M r e cyc le equipment? B=Kj9 Steering problems? (Correction ^ M ^ indirection)
I 9 | Soil type?
E S | I Unseen buried obstacles?
^ ^ ^ H Site and weather conditions?
^ ^ ^ 9 Pipe type?
B S a PiPe length? • J H 9 Pipe depth?
^Hfifl Pipe diameter?
Scale 1
X
2
X
X
3
X
X
4
X
X
X
X
X
X
X
5
X
Thank you for your valuable time.
155

Questionnaire Sample II
I. Personal Information : (Removed due to confidentiality and privacy Policy)
Name: Email: Phone:
II. Time and Pipe Information:
Please select one previously completed project for each questionnaire you will be completing and answering the following questions.
Project Start Date: 9/9/2005 No. of Actual Working hours/day: 10 Pipe/Cable Type: HDPE Pipe/Cable Diameter (mm): 500
Project End Date: 6/10/2005 Pipe/Cable Length (m): 600 Pipe/Cable Depth (m): 4 Soil Type: Rock
Drilling Rig Size: • Small • Medium • Large Project Place:
III. Activities Information:
A. Estimate most probable duration of each HDD activity cycle time for the selected project.
1 Activities H H Site Preparation H p | Pilot hole drilling
B»fl Reaming
^ ^ Final pipe pulling H H Angle adjusting at bit entrance ^ H Drill pipe segments joining H 9 Reamer with shackle attaching for pre-reaming H 9 Pipe/Cable segments connection and layout BSfl Pipe swivel assembly for pipe pullback ^ H All tracking activities ^ ^ 1 All Assessment Activities
Estimated Time (Minutes)
Most Probable 1200 1200
2400
1800 600 1200 120 600 200 1200 300
156

Ineffective Performance
Ineffective P e r f o r m a n c e (Quality) Level
1 2 1 1 1 1
Extremely Moderate ly Ineffective Ineffective
(Quality) Level Effective Performance (Quality) Level
3 l 1
Neither Effective nor
Ineffective Subjec t ive Performance Scale
Effective P e r f o r m a n c e (Quality) Level
4 S 1 1 1 1
Moderate ly Extremely Effective Effective
B. According to the above scale, please, rate the effect of the following factors on HDD process productivity.
•S^^^H?!
Questions Drilling rig operator and crew-skills? Rig size/drilling bit capabilities?
Safety regulations?
Machine condition? Slurry flow rate and slurry recycle equipment?
Steering problems? (Correction indirection)
Soil type?
Unseen buried obstacles?
Site and weather conditions?
1 Pipe type?
| Pipe length?
| Pipe depth?
Pipe diameter?
Scale 1 2
X
X
3
X
X
4
X
X
X
X
X
X
5
X
X
X
Thank you for your valuable time...
157

Questionnaire Sample III
I. Personal Information : (Removed due to confidentiality and privacy Policy)
Name: Email: Phone:
II. Time and Pipe Information:
Please select one previously completed project for each questionnaire you will be completing and answering the following questions.
Project Start Date: 5/11 No. of Actual Working hours/day: 10 Pipe/Cable Type: HDPE Pipe/Cable Diameter (mm): 323
Project End Date: 9/11 Pipe/Cable Length (m): 500 Pipe/Cable Depth (m): 2.5 Soil Type: Silty Sand
Drilling Rig Size: • Small • Medium • Large Project Place: Laval III
III. Activities Information:
A. Estimate most probable duration of each HDD activity cycle time for the selected project.
1 Activities H H Site Preparation H 3 Pilot hole drilling
^ ^ Reaming
^ ^ Final pipe pulling H H Angle adjusting at bit entrance ^^M Drill pipe segments joining ^ H Reamer with shackle attaching for pre-reaming
B = B Pipe/Cable segments connection and layout
I g f l Pipe swivel assembly for pipe pullback
^^M All tracking activities
^ ^ 1 All Assessment Activities
Estimated Time (Minutes)
Most Probable 360 600
600
600 60 120 60
Parallel to major activities
60 Parallel to pilot hole
drill 100
158

Ineffective Performance Ineffective Performance (Quality) Level
1 2 1 1 1 1
Extremely Moderately Ineffective Ineffective
(Quality) Level Effective Performance (Quality) Level
3 1 1
Neither Iv Effective nor
Ineffective Subjective Performance Scale
Effective Performance (Quality) Level
4 S 1 1 1 1
loderately Extremely Effective Effective
B. According to the above scale, please, rate the effect of the following factors on HDD process productivity.
1 Questions H 9 H Drilling rig operator and crew
H 3 J H Rig size/drilling bit capabilities?
HjJISfl Safety regulations?
B M W Machine condition? ^ ^ E f l Slurry flow rate and slurry H I E 3 recycle equipment? B B B E M Steering problems? (Correction ^ 3 B ^ in direction)
I 9 | Soil type?
KJE|fl Unseen buried obstacles?
^ ^ ^ H Site and weather conditions?
^ H | M Pipe type? J B H Pipe length? p £ | ^ Pipe depth?
^ ^ B f l Pipe diameter?
Scale 1 2
X
X
3
X
X
X
4
X
X
X
X
X
X
X
5
X
Thank you for your valuable time..
159