notes chapter 6 management of quality -...
TRANSCRIPT

L E A R N I N G O U T C O M E S
After reading this chapter, you will be able to:
LO 6.1 Discuss the philosophies of quality gurus. LO 6.2 Define the term quality as it relates to products and as it relates to
services. LO 6.3 Identify the determinants of quality. LO 6.4 Explain why quality is important and the consequences of poor quality. LO 6.5 Describe and give examples of the costs associated with quality. LO 6.6 Discuss the importance of ethics in managing quality. LO 6.7 Compare the quality awards. LO 6.8 Discuss quality certification and its importance. LO 6.9 Describe TQM.LO 6.10 Give an overview of problem solving.LO 6.11 Give an overview of process improvement.LO 6.12 Describe the six sigma methodology.LO 6.13 Describe and use various quality tools.
Chapter 6Management of Quality
In this chapter, you will learn about the evolution of quality management, definitions of quality, the costs of quality and the consequences of poor quality, some quality awards and quality certification, total quality management, and quality tools.
The importance of quality cannot be overstated; two key elements of every purchasing decision are price and quality. Consequently, having a focus on quality and quality improvement should be a part of every business organization, whether the organization’s business is making cars, selling electronic goods, providing financial services, providing medical services, or baking cookies.
INTrODUcTION
Broadly defined, quality refers to the ability of a product or service to consistently meet or exceed customer requirements or expectations. How-ever, different customers will have different requirements, so a working definition of quality is customer-dependent.
For a decade or so, quality was an important focal point in business. But after a while, the emphasis on quality began to fade, and quality took a backseat to other concerns. However, there
Quality The ability of a product or service to con-sistently meet or exceed customer expectations.
Notes
Management of Quality
163Self-Learning
Material
OS_IMT_06.indd 163 6/18/2015 4:07:02 PM

Whatever Happened to Quality?Quality is more than just a statistical analysis tool for manufacturing lines. When done right, qual-ity should encompass the entire enterprise.Some 50 years after the advent of the total quality management (TQM) movement champi-oned by W. Edwards Deming, manufacturers of all different sizes and stripes are still being dogged by high-profile manufacturing quality defects. The list is long, and getting longer every week, and crosses every manufacturing vertical. At least a token “quality program” is de rigueur for U.S. manufacturers, but many are still at lip-service level agreement with the means required to reach the necessary ends. However, talk is cheap—recalls are not. From tainted beef to spinach, from lead-painted toys to poisoned pet food and blood thinners to exploding laptop batteries and malfunctioning medical devices, the costs in scrapped product, consumer lawsuits and lost brand equity from defects and recalls are huge. Persistent, expensive and well-publicized recalls are striking companies with even the most stellar quality reputations. Toyota, the progenitor of a legendary quality-focused production system, has suffered a rash of defects that have caused the company to drop in Consumer Reports’ Annual Car Reliability Survey ratings—an important market barometer for its consumers. On a perhaps less dangerous but equally costly front, Microsoft’s X-box 360 video gaming platform suffered a high-profile manufacturing defect that at one point had up to one-third of all units suffering from a “fatal error” (device owners called it “the red ring of death”) that led at least indirectly to markedly weaker competitive positioning in the crucial holiday selling season, as well as a warranty extension that is estimated at more than $6 billion in unplanned accruals. Many of these manufacturing problems are coming from global supply chains, which is a failure as much of management as it is the defective products themselves. However bleak the situation may seem, all is not lost. Indeed, the responsibility for quality manufacturing finally seems to be taking hold across all levels of the enterprise.
Quality Goes Upstream
Talk to the manufacturing community about quality’s place in today’s environment and a clear pattern emerges—companies are finally grasping the “shared responsibility” aspect of Deming’s teachings. If quality is truly everyone’s responsibility, then the idea goes beyond the shop floor and into the front office, the service department and everywhere else that provides value to cus-tomers and shareholders. Ron Atkinson, chairman of the American Society for Quality (ASQ), has been watching this trend unfold. He describes the path that the idea of quality management in manufacturing has taken over the years. “When I started in manufacturing 35 years ago, there was a policeman installed at the end of the line who looked at the parts and said, ‘That one is OK, that can be shipped and that one can’t.’ Gradually, it got to, ‘Let’s find better ways to do the checking,’ and then to, ‘Let’s find a way to predict what the parts are going to look like when they hit the end of the line,’ so we started doing defect prevention. Now where we’re at is that quality is expanding to cover everything, including outside of the actual manufacturing process, to ‘how do we improve the quality of our HR services and support services? How do we improve the quality of the decisions that are made?” According to Atkinson, concepts crucial to establishing a top-quality manufacturing line have been driven upstream, and expanded to become part of an overall continuous improvement strategy. “Quality has become a systems approach, rather than focusing on one part at a time and whether it’s dimensionally correct. Quality is continuous improvement.”
Source: Excerpted from Brad Kenney, Industry Week, April 1, 2008.
Cr
itiC
al P
er
sP
eC
tiv
e
has been an upsurge recently in the need for attention to quality. Much of this has been driven by recent experience with costs and adverse publicity associated with wide-ranging recalls that have included automobiles, ground meat, toys, produce, dog food, and pharmaceuticals.
THE EVOLUTION OF QUALITY MANAGEMENT
Prior to the Industrial Revolution, skilled craftsmen performed all stages of production. Pride of workmanship and reputation often provided the motivation to see that a job was done right.
Operations Strategy
Notes
164 Self-Learning Material
OS_IMT_06.indd 164 6/18/2015 4:07:02 PM

Lengthy guild apprenticeships caused this attitude to carry over to new workers. Moreover, one person or a small group of people were responsible for an entire product.
A division of labor accompanied the Industrial Revolution; each worker was then responsible for only a small portion of each product. Pride of workmanship became less meaningful because workers could no longer identify readily with the final product. The responsibility for quality shifted to the foremen. Inspection was either nonexistent or haphazard, although in some instances 100 percent inspection was used.
Frederick Winslow Taylor, the “Father of Scientific Management,” gave new emphasis to quality by including product inspection and gauging in his list of fundamental areas of manu-facturing management. G. S. Radford improved Taylor’s methods. Two of his most significant contributions were the notions of involving quality considerations early in the product design stage and making connections among high quality, increased productivity, and lower costs.
In 1924, Bell Telephone Laboratories introduced statistical control charts that could be used to monitor production. Around 1930, H. F. Dodge and H. G. Romig, also of Bell Labs, introduced tables for sampling. Nevertheless, statistical quality control procedures were not widely used until World War II, when the U.S. government began to require vendors to use them.
World War II caused a dramatic increase in emphasis on quality control. The U.S. Army re-fined sampling techniques for dealing with large shipments of arms from many suppliers. By the end of the 1940s, the U.S. Army, Bell Labs, and major universities were training engineers in other industries in the use of statistical sampling techniques. About the same time, professional quality organizations were emerging throughout the country. One of these organizations was the American Society for Quality Control (ASQC, now known as ASQ). Over the years, the society has promoted quality with its publications, seminars and conferences, and training programs.
During the 1950s, the quality movement evolved into quality assurance. In the mid-1950s, total quality control efforts enlarged the realm of quality efforts from its primary focus on manufactur-ing to include product design and incoming raw materials. One important feature of this work was greater involvement of upper management in quality.
During the 1960s, the concept of “zero defects” gained favor. This approach focused on em-ployee motivation and awareness, and the expectation of perfection from each employee. It evolved from the success of the Martin Company in producing a “perfect” missile for the U.S. Army.
In the 1970s, quality assurance methods gained increasing emphasis in services including government operations, health care, banking, and the travel industry.
Something else happened in the 1970s that had a global impact on quality. An embargo on oil sales instituted by the Organization of Petroleum Exporting Countries (OPEC) caused an in-crease in energy costs, and automobile buyers became more interested in fuel-efficient, lower-cost vehicles. Japanese auto producers, who had been improving their products, were poised to take advantage of these changes, and they captured an increased share of the automobile market. The quality of their automobiles enhanced the reputation of Japanese producers, opening the door for a wide array of Japanese-produced goods.
American producers, alarmed by their loss of market share, spent much of the late 1970s and the 1980s trying to improve the quality of their goods while lowering their costs.
The evolution of quality took a dramatic shift from quality assurance to a strategic approach to quality in the late 1970s. Up until that time, the main emphasis had been on finding and cor-recting defective products before they reached the market. It was still a reactive approach. The strategic approach is proactive, focusing on preventing mistakes from occurring in the first place. The idea is to design quality into products, rather than to find and correct defects after the fact. This approach has now expanded to include processes and services. Quality and profits are more closely linked. This approach also places greater emphasis on customer satisfaction, and it involves all levels of management as well as workers in a continuing effort to increase quality.
LEArNING OUTcOME 6.1
THE FOUNDATIONS OF MODErN QUALITY MANAGEMENT: THE GUrUS
A core of quality pioneers shaped current thinking and practice. This section describes some of their key contributions to the field.
Notes
Management of Quality
165Self-Learning
Material
OS_IMT_06.indd 165 6/18/2015 4:07:02 PM
Walter ShewhartWalter Shewhart was a genuine pioneer in the field of quality control, and he became known as the “father of statistical quality control.” He developed control charts for analyzing the output of processes to deter-mine when corrective action was necessary. Shewhart had a strong influ-ence on the thinking of two other gurus, W. Edwards Deming and Joseph Juran.
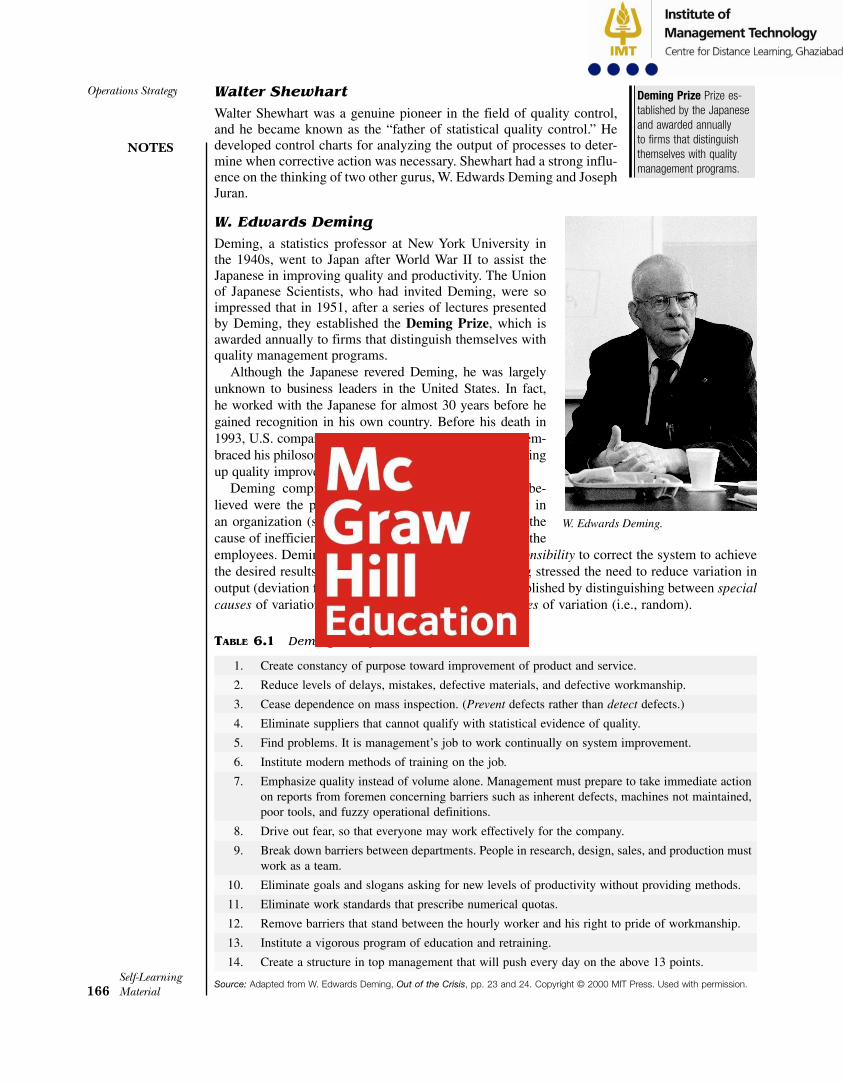
W. Edwards DemingDeming, a statistics professor at New York University in the 1940s, went to Japan after World War II to assist the Japanese in improving quality and productivity. The Union of Japanese Scientists, who had invited Deming, were so impressed that in 1951, after a series of lectures presented by Deming, they established the Deming Prize, which is awarded annually to firms that distinguish themselves with quality management programs.
Although the Japanese revered Deming, he was largely unknown to business leaders in the United States. In fact, he worked with the Japanese for almost 30 years before he gained recognition in his own country. Before his death in 1993, U.S. companies turned their attention to Deming, em-braced his philosophy, and requested his assistance in setting up quality improvement programs.
Deming compiled a famous list of 14 points he be-lieved were the prescription needed to achieve quality in an organization (see Table 6.1). His message was that the cause of inefficiency and poor quality is the system, not the employees. Deming felt that it was management’s responsibility to correct the system to achieve the desired results. In addition to the 14 points, Deming stressed the need to reduce variation in output (deviation from a standard), which can be accomplished by distinguishing between special causes of variation (i.e., correctable) and common causes of variation (i.e., random).
Deming Prize Prize es-tablished by the Japanese and awarded annually to firms that distinguish themselves with quality management programs.
W. Edwards Deming.
table 6.1 Deming’s 14 points
1. Create constancy of purpose toward improvement of product and service.
2. Reduce levels of delays, mistakes, defective materials, and defective workmanship.
3. Cease dependence on mass inspection. (Prevent defects rather than detect defects.)
4. Eliminate suppliers that cannot qualify with statistical evidence of quality.
5. Find problems. It is management’s job to work continually on system improvement.
6. Institute modern methods of training on the job.
7. Emphasize quality instead of volume alone. Management must prepare to take immediate action on reports from foremen concerning barriers such as inherent defects, machines not maintained, poor tools, and fuzzy operational definitions.
8. Drive out fear, so that everyone may work effectively for the company.
9. Break down barriers between departments. People in research, design, sales, and production must work as a team.
10. Eliminate goals and slogans asking for new levels of productivity without providing methods.
11. Eliminate work standards that prescribe numerical quotas.
12. Remove barriers that stand between the hourly worker and his right to pride of workmanship.
13. Institute a vigorous program of education and retraining.
14. Create a structure in top management that will push every day on the above 13 points.
Source: Adapted from W. Edwards Deming, Out of the Crisis, pp. 23 and 24. Copyright © 2000 MIT Press. Used with permission.
Operations Strategy
Notes
166 Self-Learning Material
OS_IMT_06.indd 166 6/18/2015 4:07:03 PM

Deming’s concept of profound knowledge incorporates the beliefs and values about learning that guided Japan’s rise to a world economic power.
Joseph M. JuranJuran, like Deming, taught Japanese manufacturers how to improve the quality of their goods, and he, too, can be regarded as a major force in Japan’s success in quality.
Juran viewed quality as fitness-for-use. He also believed that roughly 80 percent of quality defects are management controllable; thus, management has the responsibility to correct this de-ficiency. He described quality management in terms of a trilogy consisting of quality planning, quality control, and quality improvement. According to Juran, quality planning is necessary to establish processes that are capable of meeting quality standards; quality control is necessary in order to know when corrective action is needed; and quality improvement will help to find better ways of doing things. A key element of Juran’s philosophy is the commitment of management to continual improvement.
Juran is credited as one of the first to measure the cost of quality, and he demonstrated the potential for increased profits that would result if the costs of poor quality could be reduced.
Armand FeigenbaumFeigenbaum was instrumental in advancing the “cost of nonconformance” approach as a reason for management to commit to quality. He recognized that quality was not simply a collection of tools and techniques, but a “total field.” According to Feigenbaum, it is the customer who defines quality.
Philip B. CrosbyCrosby developed the concept of zero defects and popularized the phrase “Do it right the first time.” He stressed prevention, and he argued against the idea that “there will always be some level of defectives.” The quality-is-free concept presented in his book, Quality Is Free, is that the costs of poor quality are much greater than traditionally defined. According to Crosby, these costs are so great that rather than viewing quality efforts as costs, organizations should view them as a way to reduce costs, because the improvements generated by quality efforts will more than pay for themselves.
Crosby believes that any level of defects is too high and that achieving quality can be relatively easy, as explained in his book Quality Without Tears: The Art of Hassle-Free Management.
Kaoru IshikawaThe late Japanese expert on quality was strongly influenced by both Deming and Juran, although he made significant contributions of his own to quality management. Among his key contributions were the development of the cause-and-effect diagram (also known as a fishbone diagram) for problem solving and the implementation of quality circles, which involve workers in quality improvement. He was the first quality expert to call attention to the internal customer—the next person in the process, the next operation, within the organization.
Genichi TaguchiTaguchi is best known for the Taguchi loss function, which involves a formula for determining the cost of poor quality. The idea is that the deviation of a part from a standard causes a loss, and the combined effect of deviations of all parts from their standards can be large, even though each indi-vidual deviation is small. An important part of his philosophy is the cost to society of poor quality.
Taiichi Ohno and Shigeo ShingoTaiichi Ohno and Shigeo Shingo both developed the philosophy and methods of kaizen, a Japa-nese term for continuous improvement (defined more fully later in this chapter), at Toyota. Con-tinuous improvement is one of the hallmarks of successful quality management.
Table 6.2 provides a summary of the important contributions of the gurus to modern quality management.
Notes
Management of Quality
167Self-Learning
Material
OS_IMT_06.indd 167 6/18/2015 4:07:03 PM

table 6.2 A summary of key contributors to quality management
Contributor Key Contributions
Shewhart Control charts; variance reduction
Deming 14 points; special versus common causes of variation
Juran Quality is fitness-for-use; quality trilogy
Feigenbaum Quality is a total field; the customer defines quality
Crosby Quality is free; zero defects
Ishikawa Cause-and-effect diagrams; quality circles
Taguchi Taguchi loss function
Ohno and Shingo Continuous improvement
LEArNING OUTcOME 6.2
INSIGHTS ON QUALITY MANAGEMENT
Successful management of quality requires that managers have insights on various aspects of quality. These include defining quality in operational terms, understanding the costs and benefits of quality, recognizing the consequences of poor quality, and recognizing the need for ethical behavior. We begin with defining quality.
Defining Quality: The Dimensions of Quality
One way to think about quality is the degree to which performance of a product or service meets or exceeds customer expectations. The difference between these two, that is Performance – Ex-pectations, is of great interest. If these two measures are equal, the difference is zero, and expec-tations have been met. If the difference is negative, expectations have not been met, whereas if the difference is positive, performance has exceeded customer expectations.
Customer expectations can be broken down into a number of categories, or dimensions, that customers use to judge the quality of a product or service. Understanding these helps organiza-tions in their efforts to meet or exceed customer expectations. The dimensions used for goods are somewhat different from those used for services.
Product QualityProduct quality is often judged on nine dimensions of quality:
Performance—main characteristics of the product.
Aesthetics—appearance, feel, smell, taste.
Special features—extra characteristics.
Conformance—how well a product corresponds to design specifications.
Reliability—dependable performance.
Durability—ability to perform over time.
Perceived quality—indirect evaluation of quality (e.g., reputation).
Serviceability—handling of complaints or repairs.
Consistency—quality doesn’t vary.
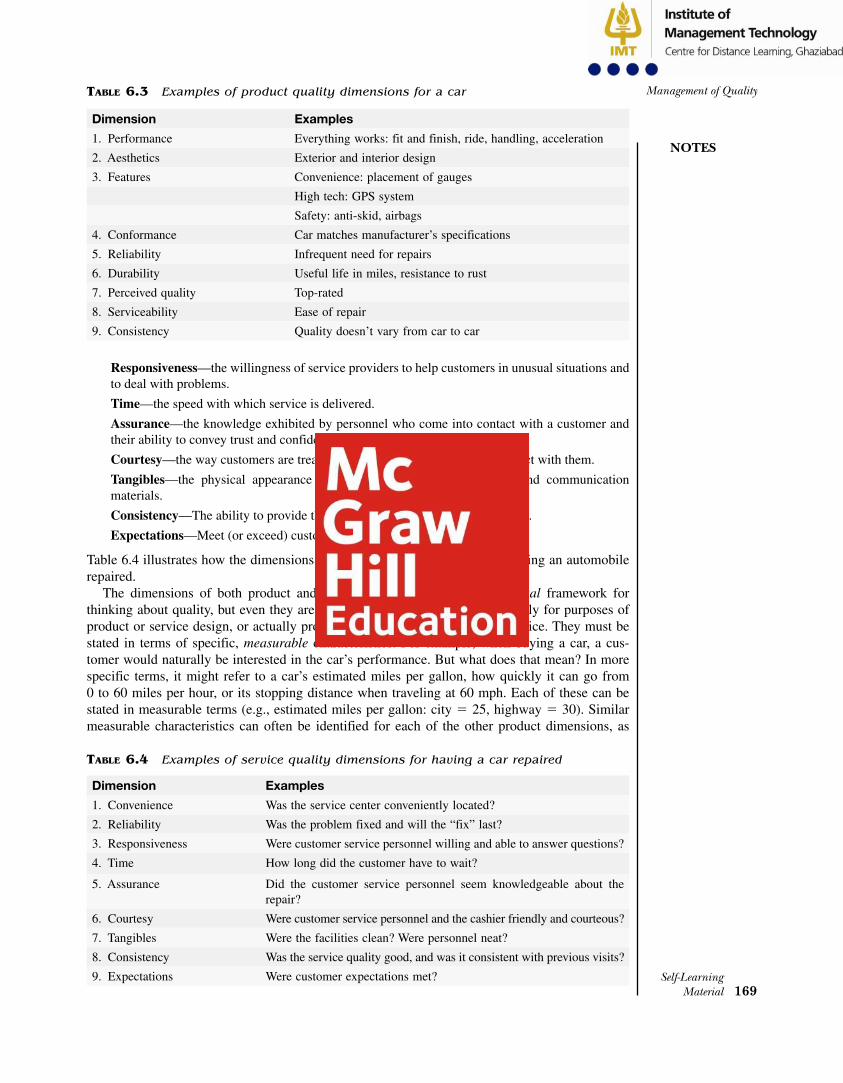
These dimensions are further described by the examples presented in Table 6.3. When refer-ring to a product, a customer sometimes judges the first four dimensions by its fitness for use.
Notice that price is not a dimension of quality.
Service QualityThe dimensions of product quality don’t adequately describe service quality. Instead, service quality is often described using the following dimensions:
Convenience—the availability and accessibility of the service.
Reliability—the ability to perform a service dependably, consistently, and accurately.
Operations Strategy
Notes
168 Self-Learning Material
OS_IMT_06.indd 168 6/18/2015 4:07:03 PM
Responsiveness—the willingness of service providers to help customers in unusual situations and to deal with problems.
Time—the speed with which service is delivered.
Assurance—the knowledge exhibited by personnel who come into contact with a customer and their ability to convey trust and confidence.
Courtesy—the way customers are treated by employees who come into contact with them.
Tangibles—the physical appearance of facilities, equipment, personnel, and communication materials.
Consistency—The ability to provide the same level of good quality repeatedly.
Expectations—Meet (or exceed) customer expectations.
Table 6.4 illustrates how the dimensions of service quality might apply to having an automobile repaired.
The dimensions of both product and service quality establish a conceptual framework for thinking about quality, but even they are too abstract to be applied operationally for purposes of product or service design, or actually producing a product or delivering a service. They must be stated in terms of specific, measurable characteristics. For example, when buying a car, a cus-tomer would naturally be interested in the car’s performance. But what does that mean? In more specific terms, it might refer to a car’s estimated miles per gallon, how quickly it can go from 0 to 60 miles per hour, or its stopping distance when traveling at 60 mph. Each of these can be stated in measurable terms (e.g., estimated miles per gallon: city 5 25, highway 5 30). Similar measurable characteristics can often be identified for each of the other product dimensions, as
table 6.3 Examples of product quality dimensions for a car
Dimension Examples
1. Performance Everything works: fit and finish, ride, handling, acceleration
2. Aesthetics Exterior and interior design
3. Features Convenience: placement of gauges
High tech: GPS system
Safety: anti-skid, airbags
4. Conformance Car matches manufacturer’s specifications
5. Reliability Infrequent need for repairs
6. Durability Useful life in miles, resistance to rust
7. Perceived quality Top-rated
8. Serviceability Ease of repair
9. Consistency Quality doesn’t vary from car to car
table 6.4 Examples of service quality dimensions for having a car repaired
Dimension Examples
1. Convenience Was the service center conveniently located?
2. Reliability Was the problem fixed and will the “fix” last?
3. Responsiveness Were customer service personnel willing and able to answer questions?
4. Time How long did the customer have to wait?
5. Assurance Did the customer service personnel seem knowledgeable about the repair?
6. Courtesy Were customer service personnel and the cashier friendly and courteous?
7. Tangibles Were the facilities clean? Were personnel neat?
8. Consistency Was the service quality good, and was it consistent with previous visits?
9. Expectations Were customer expectations met?
Notes
Management of Quality
169Self-Learning
Material
OS_IMT_06.indd 169 6/18/2015 4:07:03 PM

well as for the service dimensions. This is the sort of detailed information that is needed to both design and produce high-quality goods and services.
Information on customer wants in service can sometimes be difficult to pin down, creating chal-lenges for designing and managing service quality. For example, customers may use words such as friendly, considerate, and professional to describe what they expect from service providers. These and similar descriptors are often difficult to translate into exact service specifications. Moreover in many instances, customer wants are often industry specific. Thus, the expectations would be quite different for health care versus dry cleaning. Furthermore, customer complaints may be due in part to unrelated factors (e.g., customer’s mood or general health, the weather).
Other challenges with service quality include the reality that customer expectations often change over time and that different customers tend to have different expectations, so what one customer might view as good service quality, another customer might not be satisfied with at all. Couple these with the fact that each contact with a customer is a “moment of truth” in which service quality is instantly judged, and you begin to understand some of the challenges of achieving a consistently high perception of service quality.
If customers participate in a service system (i.e., self-service), there can be increased poten-tial for a negative perception of quality. Consequently, adequate care must be taken to make the necessary customer acts simple and safe, especially since customers cannot be trained. So error prevention must be designed into the system.
It should also be noted that in most instances, some quality dimensions of a product or service will be more important than others, so it is important to identify customer priorities, especially when it is likely that trade-off decisions will be made at various points in design and production. Quality function deployment is a tool that can be helpful for that purpose.
Assessing Service Quality
A widely used tool for assessing service quality is SERVQUAL, an instrument designed to obtain feedback on an organization’s ability to provide quality service to customers. It focuses on five of the above-mentioned service dimensions that influence customers’ perceptions of service quality: tangibles, reliability, responsiveness, assurance, and empathy. The results of this service quality audit help management identify service strengths and weaknesses. Of particular interest are any gaps or discrepancies in service quality. There may be discrepancies between: 1. actual customer expectations and management perceptions of those expectations. 2. management perceptions of customer expectations and service-quality specifications. 3. service quality and service actually delivered. 4. service actually delivered and what is communicated about the service to customers. 5. customers’ expectations of the service provider and their perceptions of provider delivery.
The Sounds of QualityConsumers often associate quiet operation as a sign of product quality, and they are willing to pay extra to get it. Such is the case with clothes washers, dishwashers, air conditioners, shredders, and automobiles. In the case of automobiles, designers know that buyers associate a quiet ride with quality, so doors, hood, windshield and exhaust systems have extra soundproofing and sealing to keep noise out. They also know that buyers value safety, and that buyers associate safety with how solid a car door sounds when it is closed, so designers have given extra attention to those sorts of details. A sign of the growing importance of sound in the auto industry is that J.D. Power & Associates measures “pleasantness of sound” for doors, signals, and engine acceleration in its Initial Quality Study. Likewise, cell phone manufacturers are giving careful attention to ring tones and other sounds emitted by their products, as are manufacturers of other electronic gadgets.
Source: Based on David Kiley, “Fine-Tuning a Brand’s Signature Sound,” BusinessWeek, August 13, 2007.
Cr
itiC
al P
er
sP
eC
tiv
e
Check Your Progress
Use the dimen-sions of quality to describe typical characteristics of these products and services: (a) A television
set (b) A restaurant
meal (service) (c) Painting a
house (d) Surgery and
post-surgery care
Operations Strategy
Notes
170 Self-Learning Material
OS_IMT_06.indd 170 6/18/2015 4:07:03 PM

Quality of design Intention of designers to include or exclude features in a product or service.
Quality of confor-mance The degree to which goods or services conform to the intent of the designers.
Notes
Management of Quality
171Self-Learning
Material
If gaps are found, they can be related to tangibles or other service quality dimensions to ad-dress the discrepancies.
LEArNING OUTcOME 6.3
The Determinants of Quality
The degree to which a product or a service successfully satisfies its intended purpose has four primary determinants: 1. Design. 2. How well the product or service conforms to the design. 3. Ease of use. 4. Service after delivery.
The design phase is the starting point for the level of quality eventu-ally achieved. Design involves decisions about the specific characteristics of a product or service such as size, shape, and location. Quality of design refers to the intention of designers to include or exclude certain features in a product or service. For example, many different models of automobiles are on the market today. They differ in size, appearance, roominess, fuel economy, comfort, and materials used. These differences reflect choices made by designers that determine the quality of design. Design decisions must take into account customer wants, production or service capabilities, safety and liability (both during production and after delivery), costs, and other similar considerations.
Designers may determine customer wants from information provided by marketing, perhaps through the use of consumer surveys or other market research. Marketing may organize focus groups of consumers to express their views on a product or service (what they like and don’t like, and what they would like to have).
Designers must work closely with representatives of operations to ascertain that designs can be produced; that is, that production or service has the equipment, capacity, and skills necessary to produce or provide a particular design.
A poor design can result in difficulties in production or service. For example, materials might be difficult to obtain, specifications difficult to meet, or procedures difficult to follow. Moreover, if a design is inadequate or inappropriate for the circumstances, the best workmanship in the world may not be enough to achieve the desired quality. Also, we cannot expect a worker to achieve good results if the given tools or procedures are inadequate. Similarly, a superior design usually cannot offset poor workmanship.
Quality of conformance refers to the degree to which goods and ser-vices conform to (i.e., achieve) the intent of the designers. This is affected by factors such as the capability of equipment used; the skills, training,
Customers shopping for appliances at an Abt Electronics store in Glenview, Illinois. Abt is an independent, family-owned retailer known for quality products and great customer service.
OS_IMT_06.indd 171 6/18/2015 4:07:04 PM

and motivation of workers; the extent to which the design lends itself to production; the monitoring process to assess conformance; and the taking of corrective action (e.g., through problem solving) when necessary. One important key to quality is reducing the variability in process outputs (i.e., reducing the degree to which individual items or individual service acts vary from one another).
The determination of quality does not stop once the product or service has been sold or de-livered. Ease of use and user instructions are important. They increase the chances, but do not guarantee, that a product will be used for its intended purposes and in such a way that it will continue to function properly and safely. (When faced with liability litigation, companies often argue that injuries and damages occurred because the user misused the product.) Much of the same reasoning can be applied to services. Customers, patients, clients, or other users must be clearly informed on what they should or should not do; otherwise, there is the danger that they will take some action that will adversely affect quality. Some examples include the doctor who fails to specify that a medication should be taken before meals and not with orange juice and the attorney who neglects to inform a client of a deadline for filing a claim.
Much consumer education takes the form of printed instructions and labeling. Thus, manufactur-ers must ensure that directions for unpacking, assembling, using, maintaining, and adjusting the product—and what to do if something goes wrong (e.g., flush eyes with water, call a physician, induce vomiting, do not induce vomiting, disconnect set immediately)—are clearly visible and easily understood.
For a variety of reasons, products do not always perform as expected, and services do not always yield the desired results. Whatever the reason, it is important from a quality standpoint to remedy the situation—through recall and repair of the product, adjustment, replacement or buyback, or reevaluation of a service—and do whatever is necessary to bring the product or service up to standard.
LEArNING OUTcOME 6.4
responsibility for Quality
It is true that all members of an organization have some responsibility for quality, but certain parts of the organization are key areas of responsibility:
Top management. Top management has the ultimate responsibility for quality. While establishing strategies for quality, top management must institute programs to improve quality; guide, direct, and motivate managers and workers; and set an example by being involved in quality initiatives. Examples include taking training in quality, issuing periodic reports on quality, and attending meetings on quality.
Design. Quality products and services begin with design. This includes not only features of the product or service; it also includes attention to the processes that will be required to produce the products and/or the services that will be required to deliver the service to customers.
Procurement. The procurement department has responsibility for obtaining goods and services that will not detract from the quality of the organization’s goods and services.
Production/operations. Production/operations has responsibility to ensure that processes yield products and services that conform to design specifications. Monitoring processes and finding and correcting root causes of problems are important aspects of this responsibility.
Quality assurance. Quality assurance is responsible for gathering and analyzing data on prob-lems and working with operations to solve problems.
Packaging and shipping. This department must ensure that goods are not damaged in transit, that packages are clearly labeled, that instructions are included, that all parts are included, and that shipping occurs in a timely manner.
Marketing and sales. This department has the responsibility to determine customer needs and to communicate them to appropriate areas of the organization. In addition, it has the responsibility to report any problems with products or services.
Customer service. Customer service is often the first department to learn of problems. It has the responsibility to communicate that information to appropriate departments, deal in a reasonable manner with customers, work to resolve problems, and follow up to confirm that the situation has been effectively remedied.
Operations Strategy
Notes
172 Self-Learning Material
OS_IMT_06.indd 172 6/18/2015 4:07:04 PM

Poor quality increases certain costs incurred by the organization. The following section provides further detail on costs associated with quality.
Benefits of Good Quality
Business organizations with good or excellent quality typically benefit in a variety of ways: an enhanced reputation for quality, the ability to command premium prices, an increased market share, greater customer loyalty, lower liability costs, and fewer production or service problems—which yields higher productivity, fewer complaints from customers, lower production costs, and higher profits. Annual studies by the National Institute of Standards indicate that winners of the Baldrige quality award, described later in the chapter, outperform the S&P 500 Index by a significant amount.4
The consequences of Poor Quality
It is important for management to recognize the different ways in which the quality of a firm’s products or services can affect the organization and to take these into account in developing and maintaining a quality assurance program. Some of the major areas affected by quality are 1. Loss of business. 2. Liability. 3. Productivity. 4. Costs.
Poor designs or defective products or services can result in loss of business. Failure to devote adequate attention to quality can damage a profit-oriented organization’s reputation and lead to a decreased share of the market, or it can lead to increased criticism and/or controls for a govern-ment agency or nonprofit organization.
In the retail sector, managers might not be fully aware of poor product or service quality because customers do not always report their dissatisfaction. Even so, dissatisfied customers do tend to voice their dissatisfaction to friends and relatives, which can have negative implications for customer perceptions and future business.
Organizations must pay special attention to their potential liability due to damages or inju-ries resulting from either faulty design or poor workmanship. This applies to both products and services. Thus, a poorly designed steering arm on a car might cause the driver to lose control of the car, but so could improper assembly of the steering arm. However, the net result is the same. Similarly, a tree surgeon might be called to cable a tree limb. If the limb later falls and causes damage to a neighbor’s car, the accident might be traced to a poorly designed procedure for cabling or to improper workmanship. Liability for poor quality has been well established in the courts. An organization’s liability costs can often be substantial, especially if large numbers of items are involved, as in the automobile industry, or if potentially widespread injury or damage is involved (e.g., an accident at a nuclear power plant). Express written warranties as well as implied war-ranties generally guarantee the product as safe when used as intended. The courts have tended to extend this to foreseeable uses, even if these uses were not intended by the producer. In the health care field, medical malpractice claims and insurance costs are contributing to skyrocketing costs and have become a major issue nationwide. It’s been estimated that medical mistakes result in about 98,000 deaths annually in the United States. Surprisingly, this number has remained fairly steady for more than a few years. If medical errors were classified as a disease, they would rank about sixth on the list of major causes of death.
Productivity and quality are often closely related. Poor quality can adversely affect productivity during the manufacturing process if parts are defective and have to be reworked or if an assembler has to try a number of parts before finding one that fits properly. Also, poor quality in tools and equipment can lead to injuries and defective output, which must be reworked or scrapped, thereby reducing the amount of usable output for a given amount of input. Similarly, poor service can mean having to redo the service and reduce service productivity.
Cost to remedy a problem is a major consideration in quality management. The earlier a problem is identified in the process, the cheaper the cost to fix it. The cost to fix a problem at the customer end has been estimated at about five times the cost to fix a problem at the design or production stages.
Notes
Management of Quality
173Self-Learning
Material
OS_IMT_06.indd 173 6/18/2015 4:07:04 PM

short Case 6.1Hyundai: Kissing Clunkers Goodbye
Moon Ihlwan, with Larry Armstrong and Michael EidamWhen Hyundai Motor Co. Chairman Chung Mong Koo said his company could increase the quality of its cars to “Toyota levels” five years ago, few took him seriously. After all, Hyundai was the butt of talk-show jokes and a target of industry disdain for tinny cars that were about as reliable as a go-kart. So when J. D. Power & Associates Inc. on April 28 said the Korean carmaker had virtually caught up with Toyota in terms of quality, jaws dropped from Detroit to Tokyo. “We still have a long way to go,” says Suh Byung Kee, the senior executive vice-president heading Hyundai’s quality-control team. “But we have completed the first phase of our task.” The second phase could well be tougher. The eye-opening survey measured initial quality—the num-ber of complaints customers had in the first 90 days of ownership. Hyundai owners reported just 102 problems per 100 cars sold—earning a tie with Honda as the second-best carmaker on the list and falling just below Toyota’s tally of 101. And its Sonata sedan was the top-ranked car in the “entry mid-sized” category. On longer-term measures, though, Hyundai remains a laggard: In Power’s July, 2003, Vehicle Dependability Study, Hyundai tallied 342 problems per 100 vehicles after three years of ownership, vs. an industry average of 273. Hyundai execs counter that it will take time before the recent improvement shows up in the longer-term statistics. There’s reason to agree with Hyundai’s optimism. First wooed by the company’s generous war-ranty—10 years for the drive train and five years for everything else—U.S. consumers are starting to believe that Hyundai is a changed brand. Last year they bought 400,000 of its cars. . . . Jeff Ball, a phar-macist from Laurence Harbor, N.J., has four of them: He and his wife share a Santa Fe SUV and a Sonata sedan (“I call it my Jaguar without the cat,” he says), and he has bought smaller models for his sons. Sales like that are helping Hyundai’s bottom line. . . .
A Team with TeethHyundai’s focus on quality comes straight from the top. Since 1999, Chairman Chung has boosted the quality team to 865 workers from 100, and virtually all employees have had to attend special seminars on improving Hyundai’s cars. Chung presides over twice-monthly quality meetings in a special conference room and an adjacent workshop, with vehicle lifts and high-intensity spotlights for comparing Hyundais head-to-head with rivals. And this team has teeth: In the past year, the introduction of three new models was delayed by months as engineers scrambled to boost quality in response to problems found by the team. The focus is on the details. In 1998, for instance, customers reported faulty warning lights and difficulty starting engines. So Chung set up a $30 million computer center where 71 engineers simulate harsh conditions to test electronics and pinpoint defects. The result: In Power’s 2004 initial quality survey, Hyundai had only 9.6 problems in these areas per 100 vehicles, vs. an industry average of 13.8. Three years ago Hyundai had 23.4 problems, vs. the industry’s 17.9. “This is not a shotgun approach,” says Robert Cosmai, president of the company’s U.S. affiliate, Hyundai Motor America. The big test comes next year when Hyundai is due to begin building redesigned Santa Fes and Sonatas in Alabama. One encouraging sign: DaimlerChrysler and Mitsubishi Motors Corp. plan to use a Hyundai-designed four-cylinder engine in their own small and midsize cars. “This is a vote of confidence for Hyundai’s engine quality,” says Ahn Soo Woong, an auto analyst at Han-wha Securities Co. Now it’s up to consumers to decide whether Hyundai really makes the grade.
Source: “Hyundai: Kissing Clunkers Goodbye,” BusinessWeek, May 17, 2004. Copyright © 2004 The McGraw-Hill Companies, Inc. Used with permission.
LEArNING OUTcOME 6.5
THE cOSTS OF QUALITY
Any serious attempt to deal with quality issues must take into account the costs associated with quality. Those costs can be classified into three categories: appraisal, prevention, and failure.
Appraisal costs relate to inspection, testing, and other activities in-tended to uncover defective products or services, or to assure that there are none. They include the cost of inspectors, testing, test equipment, labs, quality audits, and field testing.
Appraisal costs Costs of activities designed to ensure quality or uncover defects.
Operations Strategy
Notes
174 Self-Learning Material
OS_IMT_06.indd 174 6/18/2015 4:07:04 PM

Prevention costs Costs of preventing defects from occurring.
Failure costs Costs caused by defective parts or products or by faulty services.
Internal failures Failures discovered during produc-tion.
External failures Failures discovered after delivery to the customer.
Return on quality An approach that evaluates the financial return of investments in quality.
Notes
Management of Quality
175Self-Learning
Material
Prevention costs relate to attempts to prevent defects from occurring. They include costs such as planning and administration systems, working with vendors, training, quality control procedures, and extra attention in both the design and production phases to decrease the probability of defective workmanship.
Failure costs are incurred by defective parts or products or by faulty services. Internal failures are those discovered during the production process; external failures are those discovered after delivery to the customer. Internal failures occur for a variety of reasons, including defective material from vendors, incorrect machine settings, faulty equipment, incorrect methods, incorrect processing, carelessness, and faulty or improper material handling procedures. The costs of internal failures include lost production time, scrap and rework, investigation costs, possible equipment damage, and possible employee injury. Re-work costs involve the salaries of workers and the additional resources needed to perform the rework (e.g., equipment, energy, raw materials). Beyond those costs are items such as inspection of reworked parts, dis-ruption of schedules, the added costs of parts and materials in inventory waiting for reworked parts, and the paperwork needed to keep track of the items until they can be reintegrated into the process. External failures are defective products or poor service that go undetected by the producer. Resulting costs include warranty work, handling of complaints, replacements, liability/litigation, payments to customers or discounts used to offset the inferior quality, loss of customer goodwill, and opportunity costs related to lost sales.
External failure costs are typically much greater than internal failure costs on a per-unit basis. Table 6.5 summarizes quality costs.
Internal and external failure costs represent costs related to poor quality, whereas appraisal and prevention costs represent investments for achieving good quality.
An important issue in quality management is the value received from expenditures on preven-tion. There are two schools of thought on this. One is that prevention costs will be outweighed by savings in appraisal and failure costs. This is espoused by such people as Crosby and Juran, discussed in further detail later in this chapter. They believe that as the costs of defect preven-tion are increased, the costs of appraisal and failure decrease by much more. What this means, if true, is that the net result is lower total costs, and, thus, as Crosby suggests, quality is free. On the other hand, some managers believe that by attempting to go beyond a certain point, such expenditures on quality reduce the funds available for other objectives such as reducing product development times and upgrading technology. The return on quality (ROQ) approach focuses on the economics of quality efforts. In this approach, quality improvement projects are viewed as invest-ments, and, as such, they are evaluated like any other investment, using metrics related to return on investment (ROI).
table 6.5 Summary of quality costs
Category Description ExamplesAppraisal costs Costs related to measuring, evaluat-
ing, and auditing materials, parts, products, and services to assess conformance with quality standards
Inspection equipment, testing, labs, inspectors, and the interruption of production to take samples
Prevention costs Costs related to reducing the potential for quality problems
Quality improvement programs, train-ing, monitoring, data collection and analysis, and design costs
Internal failure costs Costs related to defective products or services before they are delivered to customers
Rework costs, problem solving, mate-rial and product losses, scrap, and downtime
External failure costs Costs related to delivering substandard products or services to customers
Returned goods, reworking costs, warranty costs, loss of goodwill, liability claims, and penalties
OS_IMT_06.indd 175 6/18/2015 4:07:05 PM

short Case 6.2Rework and MoraleLarry Coburn, vice president of operations at high-tech audio equipment manufacturer Crown Audio, has seen the need for strong management and employee commitment in his company’s recent quality improvements. The market in his industry was driving the development of more complex products that need to be produced more cheaply, and these twin trends put so much pressure on his manufacturing operations that things were breaking down. Their first-pass yields had gotten so bad that their rework inventory had piled up, and even became a major line item on the balance sheet. “We had areas that were designated for rework that were so large that they were getting on our inven-tory control list because they were major entities in terms of dollars in inventory,” he recounts. In fact, the problem was large enough to conceal what Coburn and his team call ‘hidden factories’—millions of dol-lars of untapped production and sales potential existing within their production line. “We started analyz-ing these hidden factories and we actually identified $4 million of cost related to poor quality,” Coburn says. To stem the tide of red ink, Crown Audio embarked on a drastic plant-floor triage process that involved stopping production entirely, so as not to generate any more rework. They then analyzed and tested the defective inventory, broke the components up into groups based on the common problems they exhib-ited, and used those groupings to analyze potential process improvements and defect reduction strategies before plugging them back through the process. Once they finished, they not only had saleable inventory to get out the door, but also had a pretty good handle on the parts of their process that needed changing, says Coburn. “When we started, we had months and sometimes close to a year of backlog that needed to be fixed and repaired,” he relates. “Now we are talking in terms of hours of rework in front of us.” However positive and dramatic this change, Coburn and his management team also realized that it wouldn’t help much if the scrap and rework inventory piles kept growing, he says, which is where he says the less-tangible “employee engagement” part of the equation comes in. The first aspect is enabling them to do their jobs. “We’re continuing to empower our workers to get real-time data at their fingertips so they’re making good decisions without two-week-old data, or without estimating or just evading what they think the problem is,” he says. Rather than having his workers hang-ing their heads, Crown Audio’s management team is now in the enviable situation of having different lines and shifts brag about their first-pass yields to each other. Sustaining this motivated, engaged workforce is itself a team effort, says Coburn, who says that he has learned over the course of Crown Audio’s continuing quality initiative that solidly designed manufacturing processes backed up by an engaged and empowered workforce is the essential combination to move any company forward. Quality truly is everyone’s responsibility, and everyone appreciates a job well done. “There is nothing more frustrating than working hard and then knowing that what you did, did not work out or did not come through.” Coburn stresses this point in no uncertain terms. “Morale is every-thing in quality,” he says. “People want to do a good job, and we have to enable that.”
Source: Excerpted from Brad Kenney, Industry Week, April 1, 2008.
Operations Strategy
Notes
176 Self-Learning Material
LEArNING OUTcOME 6.6
ETHIcS AND QUALITY MANAGEMENT
All members of an organization have an obligation to perform their duties in an ethical manner. Ethical behavior comes into play in many situations that involve quality. One major category is substandard work, including defective products and substandard service, poor designs, shoddy workmanship, and substandard parts and raw materials. Having knowledge of this and failing to correct and report it in a timely manner is unethical and can have a number of negative conse-quences. These can include increased costs for organizations in terms of decreased productivity, an increase in the accident rate among employees, inconveniences and injuries to customers, and increased liability costs.
A related issue is how an organization chooses to deal with information about quality problems in products that are already in service. For example, automakers and tire makers in recent years have been accused of withholding information about actual or potential quality problems; they failed to issue product recalls, or failed to divulge information, choosing instead to handle any complaints that arose on an individual basis.
OS_IMT_06.indd 176 6/18/2015 4:07:05 PM

Baldrige Award Annual award given by the U.S. government to recognize quality achievements of U.S. companies.
European Quality Award European award for organizational excel-lence.
Notes
Management of Quality
177Self-Learning
Material
LEArNING OUTcOME 6.7
QUALITY AWArDS
Quality awards have been established to generate improvement in quality. The Malcolm Baldrige Award, the European Quality Award, and the Deming Prize are well-known awards given annually to recognize firms that have integrated quality management into their operations.
The Baldrige Award
Named after the late Malcolm Baldrige, an industrialist and former secretary of commerce, the annual Baldrige Award is administered by the National Institute of Standards and Technology. The purpose of the award competition is to stimulate efforts to improve quality, to recognize quality achievements, and to publicize successful programs.
When the award was first presented in 1988, the award catego-ries were manufacturing and small business. A few years later a service category was added, and then categories for education and health care were added a few years after that. The earliest winners included Motorola, Globe Metallurgical, Xerox Corporation, and Milliken & Company. Since then, many companies have been added to the list. For a complete listing of current and former winners, go to www.quality.nist.gov/Award_Recipients.htm.
Applicants are evaluated in seven main areas: leadership, information and analysis, strategic planning, human resource management, customer and market focus, process management, and business results.
Examiners check the extent to which top management incorporates quality values in daily management; whether products or services are at least as good as those of competitors; whether employees receive training in quality techniques; if the business works with suppliers to improve quality; and if customers are satisfied. Even organizations that don’t win benefit from applying for the award: All applicants receive a written summary of the strengths and weaknesses of their quality management and suggestions for improvement.
Most states have quality award programs based on the Baldrige criteria. These award programs can serve as an entry point for organizations that want to eventually apply for the national award.
For more information, visit www.quality.nist.gov.
The European Quality Award
The European Quality Award is Europe’s most prestigious award for organizational excellence. The European Quality Award sits at the top of regional and national qual-ity awards, and applicants have often won one or more of those awards prior to applying for the European Quality Award.
The Deming Prize
The Deming Prize, named in honor of the late W. Edwards Deming, is Japan’s highly coveted award recognizing successful quality efforts. It is given annually to any company that meets the award’s standards. Although typically given to Japanese firms, in 1989, Florida Power and Light became the first U.S. company to win the award.
The major focus of the judging is on statistical quality control, making it much narrower in scope than the Baldrige Award, which focuses more on customer satisfaction. Companies that win the Deming Prize tend to have quality programs that are detailed and well-communicated throughout the company. Their quality improvement programs also reflect the involvement of senior management and employees, customer satisfaction, and training.
OS_IMT_06.indd 177 6/18/2015 4:07:05 PM

LEArNING OUTcOME 6.8
QUALITY cErTIFIcATION
Many firms that do business internationally recognize the importance of quality certification.
ISO 9000, 14000, and 24700
The International Organization for Standardization (ISO) promotes worldwide standards for the improvement of quality, productivity, and operating efficiency through a series of standards and guidelines. Used by industrial and business organizations, regulatory agencies, governments, and trade organizations, the standards have important economic and so-cial bene fits. Not only are they tremendously important for designers, manufacturers, suppliers, service providers, and customers, but the standards make a tremendous contribution to society in general: They increase the levels of quality and reliability, productivity, and safety, while making products and services affordable. The standards help facilitate international trade. They provide governments with a basis for health, safety, and environmental legislation. And they aid in transferring technology to developing countries.
Two of the most well-known of these are ISO 9000 and ISO 14000. ISO 9000 pertains to quality management. It concerns what an organization does to ensure that its products or services conform to its customers’ requirements. ISO 14000 concerns what an organization does to mini-mize harmful effects to the environment caused by its operations. Both ISO 9000 and ISO 14000 relate to an organization’s processes rather than its products and services, and both stress continual improvement. Moreover, the standards are meant to be generic; no matter what the organization’s business, if it wants to establish a quality management system or an environmental management system, the system must have the essential elements contained in ISO 9000 or in ISO 14000. The ISO 9000 standards are critical for companies doing business internationally, particularly in Europe. They must go through a process that involves documenting quality procedures and on-site assessment. The process often takes 12 to 18 months. With certification comes registration in an ISO directory that companies seeking suppliers can refer to for a list of certified companies. They are generally given preference over unregistered companies. More than 40,000 companies are registered worldwide; three-fourths of them are located in Europe.
A key requirement for registration is that a company review, refine, and map functions such as process control, inspection, purchasing, training, packaging, and delivery. Similar to the Baldrige Award, the review process involves considerable self-appraisal, resulting in problem identification and improvement. Unlike the Baldrige Award, registered companies face an ongoing series of audits, and they must be reregistered every three years.
In addition to the obvious benefits of certification for companies that want to deal with the European Union, the ISO 9000 certification and registration process is particularly helpful for companies that do not currently have a quality management system; it provides guidelines for establishing the system and making it effective.
Eight quality management principles form the basis of the latest version of ISO 9000: 1. A customer focus. 2. Leadership. 3. Involvement of people. 4. A process approach. 5. A system approach to management. 6. Continual improvement. 7. Use of a factual approach to decision making. 8. Mutually beneficial supplier relationships.
The standards for ISO 14000 certification bear upon three major areas:
Management systems—systems development and integration of environmental responsibilities into business planning.
Operations—consumption of natural resources and energy.
ISO 9000 A set of international standards on quality management and quality assurance, critical to international business.
ISO 14000 A set of international standards for assessing a company’s environmental perfor-mance.
Operations Strategy
Notes
178 Self-Learning Material
OS_IMT_06.indd 178 6/18/2015 4:07:05 PM

Environmental systems—measuring, assessing, and managing emissions, effluents, and other waste streams.
ISO 24700 pertains to the quality and performance of office equipment that contains reused components. ISO/IEC 24700 specifies product char-acteristics for use in an original equipment manufacturer’s or authorized third-party’s declaration of conformity to demonstrate that a marketed product that contains reused components performs equivalent to new, meeting equivalent-to-new component specifications and performance criteria, and continues to meet all the safety and environmental criteria required by responsibly built products. It is relevant to marketed products whose manufacturing and recovery processes result in the reuse of components.
If you’d like to learn more about ISO standards, visit the International Organization for Stan-dardization Web site at www.ISO.org/ISO/en/ISOonline.frontpage or the American Society for Quality Web site at www.asq.org.
QUALITY AND THE SUPPLY cHAIN
Business leaders are increasingly recognizing the importance of their supply chains in achieving their quality goals. Achievement requires measuring cus-tomer perceptions of quality, identifying problem areas, and correcting those problems.
When dealing with supplier quality in global sup-ply chains, companies are finding a wide range in the degree of sophistication concerning quality as-surance. Although developed countries often have a fair level of sophistication, little or no awareness of modern quality practices may be found in some less-developed countries. This poses important liability issues for companies that outsource to those areas.
An interesting situation is outsourcing in the pharmaceutical industry. Offshore suppliers offer low prices that domestic producers can’t match. However, the cost advantage of offshore producers is not based solely on lower labor costs; a significant “advantage” is the fact that domestic producers undergo strict and costly government quality regulations and unan-nounced inspections that offshore producers are not subject to. While this lowers the costs to importers, it also increases their liability risks.
Increasingly, the emphasis in supply chain quality management is on reducing outsourcing risk as well as product or service variation and overhead. Risk comes from the use of substandard materials or work methods, which can lead to inferior product quality and potential product liabil-ity. Tighter control of vendors and worker training can reduce these risks. Variation results from processes that are not in control; it can be reduced through statistical quality control. Overhead can be reduced by assigning quality assurance responsibility to vendors, while customers operate in a quality audit mode, with some monitoring of vendor quality efforts.
Supply chain quality management can benefit from a collaborative relationship with suppliers that includes helping suppliers with quality assurance efforts as well as information sharing on quality-related matters. Ideally, improving supply chain quality can become part of an organiza-tion’s continuous improvement efforts.
The following reading offers some guidelines for improving quality and reducing outsourcing risk.
ISO 24700 A set of international standards that pertains to the quality and performance of office equipment that contains reused components.
The acting chair of the Consumer Product Safety Commission spoke at a press conference on a recall of Mattel Inc. toys manufactured in China. Mattel recalled 18.6 million products around the world because they contained magnets that could fall out and be swallowed by children.
Check Your Progress
What is ISO 9000, and why is it important for global businesses to have ISO 9000 certification?
Notes
Management of Quality
179Self-Learning
Material
OS_IMT_06.indd 179 6/18/2015 4:07:09 PM

Improving Quality and Reducing Risk in OffshoringWilliam E. Mitchell, chairman, president and CEO of Arrow Electronics, offered 10 guidelines on how to reduce product quality and related risks in an offshore supply chain. The guidelines were nominally targeted at electronics suppliers, but offer a good starting point for many companies looking to reduce risk and potential quality problems.
1. Source from reputable, well-established companies with tight internal controls. 2. Conduct comprehensive background checks, including checking trade references and past
business history, of supply chain partners before conducting business with them. 3. Implement site inspections of supply chain partners and find out what systems have been put
in place to track quality. 4. Conduct ongoing performance reviews of supply chain partners and engage in ongoing com-
munications with them to benchmark against preset goals and define improvement plans. 5. Only source from companies that are willing to provide a guarantee for products in writing. 6. Be cautious of buying from companies that do not have franchised relationships with distribu-
tion partners to avoid a greater potential risk of counterfeit product. 7. Beware of unusually low pricing. 8. Look for International Organization for Standardization (ISO) or other equivalent, globally
recognized certifications in a supply chain partner’s operations. 9. Establish relationships with third-party organizations. 10. Translate quality into measurable and clearly defined targets with supply chain partners and
ensure these metrics are communicated regularly with employees.
As the Supply Chain Digest notes, to do this right will involve greater costs, reducing the relative price advantage of offshore strategies to a degree, and certainly requiring companies to build a substantial infrastructure to develop and maintain these monitoring programs.
Source: Excerpted from “Improving Quality and Reducing Risk in Offshoring,” Supply Chain Digest, August 7, 2007. Copyright © 2007 SCDigest. Used with permission.
Cr
itiC
al P
er
sP
eC
tiv
e
LEArNING OUTcOME 6.9
TOTAL QUALITY MANAGEMENT
A primary role of management is to lead an organization in its daily operation and to maintain it as a viable entity into the future. Quality has become an important factor in both of these objectives.
Although ostensibly always an objective of business, customer satisfaction, in customer terms, became a specific goal in the late 1980s. Providing high quality was recognized as a key element for success. Most large corporations taking that path have documented their success. First, they survived the strong overseas competition that had set the high quality levels and now have regained some of their former markets. Smaller companies are also adopting similar goals.
Management plays a critical role in TQM. The approach is reflected in an operating philosophy. For example, among the 14 Toyota Way Principles is:
Principle 1. Base your management decisions on a long-term philosophy, even at the expense of short-term financial goals. . . . Generate value for the customer, society, and the economy; it is your starting point. Evaluate every function in the company in terms of its ability to achieve this.5
The term total quality management (TQM) refers to a quest for quality in an organization. There are three key philosophies in this ap-proach. One is a never-ending push to improve, which is referred to as continuous improvement; the second is the involvement of everyone in the organization; and the third is a goal of customer satisfaction, which means meeting or exceeding customer expectations. TQM expands the traditional view of quality—looking only at the quality of the final prod-uct or services—to looking at the quality of every aspect of the process that produces the product or service. TQM systems are intended to prevent poor quality from occurring.
We can describe the TQM approach as follows: 1. Find out what customers want. This might involve the use of surveys, focus groups, inter-
views, or some other technique that integrates the customer’s voice in the decision-making
Total quality man-agement (TQM) A philosophy that involves everyone in an orga-nization in a continual effort to improve quality and achieve customer satisfaction.
Operations Strategy
Notes
180 Self-Learning Material
OS_IMT_06.indd 180 6/18/2015 4:07:09 PM

Fail-safing Incorporating design elements that pre-vent incorrect procedures.
Continuous improve-ment Philosophy that seeks to make never-ending improvements to the process of converting inputs into outputs.
Kaizen Japanese term for continuous improve-ment.
Notes
Management of Quality
181Self-Learning
Material
process. Be sure to include the internal customer (the next person in the process) as well as the external customer (the final customer).
Sign on the wall of a company cafeteria:Sometimes they can be cranky, and it may sometimes seem like they expect too much, but they do provide our paychecks and our benefits, such as sick leave, maternity leave, health insurance, and three weeks of paid vacation time each year. And what about all the new equipment we’ve been get-ting lately? They pay for that, too. And a lot more. So the next time you see them, give them a great big smile to show how much you appreciate them—our customers!
2. Design a product or service that will meet (or exceed) what customers want. Make it easy to use and easy to produce.
3. Design processes that facilitate doing the job right the first time. Determine where mistakes are likely to occur and try to prevent them. When mistakes do occur, find out why so that they are less likely to occur again. Strive to make the process “mistake-proof.” This is sometimes referred to as a fail-safing: Elements are incorporated in product or service design that make it virtually im-possible for an employee (or sometimes a customer) to do something incorrectly. The Japanese term for this is pokayoke. Examples include parts that fit together one way only and appliance plugs that can be inserted into a wall outlet the correct way only. Another term that is sometimes used is foolproofing, but use of this term may be taken to imply that employees (or customers) are fools—not a wise choice!
4. Keep track of results, and use them to guide improvement in the system. Never stop trying to improve.
5. Extend these concepts throughout the supply chain. 6. Top management must be involved and committed. Otherwise, TQM will just be another
fad that fails and fades away.Many companies have successfully implemented TQM programs. Successful TQM programs
are built through the dedication and combined efforts of everyone in the organization.The preceding description provides a good idea of what TQM is all about, but it doesn’t tell
the whole story. A number of other elements of TQM are important: 1. Continuous improvement. The philosophy that seeks to improve
all factors related to the process of converting inputs into outputs on an ongoing basis is called continuous improvement. It cov-ers equipment, methods, materials, and people. Under continuous improvement, the old adage “If it ain’t broke, don’t fix it” gets transformed into “Just because it isn’t broke doesn’t mean it can’t be improved.”
The concept of continuous improvement was not new, but it did not receive much interest in the United States for a while, even though it originated here. However, many Japanese companies used it for years, and it became a cornerstone of the Japanese approach to pro-duction. The Japanese use the term kaizen to refer to continuous improvement. The successes of Japanese companies caused other companies to reexamine many of their approaches. This resulted in a strong interest in the continuous improvement approach.
2. Competitive benchmarking. This involves identifying other organizations that are the best at something and studying how they do it to learn how to improve your operation. The company need not be in the same line of business. For example, Xerox used the mail-order company L.L. Bean to benchmark order filling.
3. Employee empowerment. Giving workers the responsibility for improvements and the authority to make changes to accomplish them provides strong motivation for employees. This puts decision making into the hands of those who are closest to the job and have con-siderable insight into problems and solutions.
4. Team approach. The use of teams for problem solving and to achieve consensus takes advantage of group synergy, gets people involved, and promotes a spirit of cooperation and shared values among employees.
OS_IMT_06.indd 181 6/18/2015 4:07:09 PM

5. Decisions based on facts rather than opinions. Management gathers and analyzes data as a basis for decision making.
6. Knowledge of tools. Employees and managers are trained in the use of quality tools.
7. Supplier quality. Suppliers must be included in quality assurance and quality improvement efforts so that their processes are capable of delivering quality parts and materials in a timely manner.
8. Champion. A TQM champion’s job is to pro-mote the value and importance of TQM prin-ciples throughout the company.
9. Quality at the source. Quality at the source refers to the philosophy of making each worker responsible for the quality of his or her work. The idea is to “Do it right the first time.” Workers are expected to provide goods or services that meet specifications and to find and correct mistakes that occur. In effect, each worker becomes a quality inspector for his or her work. When the work is passed on to the next operation in the process (the internal customer) or, if that step is the last in the process, to the ultimate customer, the worker is “certifying” that it meets quality standards.
This accomplishes a number of things: (a) it places direct responsibility for quality on the person(s) who directly affect it; (b) it removes the adversarial relationship that often exists between quality control inspectors and production workers; and (c) it motivates workers by giving them control over their work as well as pride in it.
10. Suppliers are partners in the process, and long-term relationships are encouraged. This gives suppliers a vital stake in providing quality goods and services. Suppliers, too, are expected to provide quality at the source, thereby reducing or eliminating the need to inspect deliveries from suppliers.
It would be incorrect to think of TQM as merely a collection of techniques. Rather, TQM reflects a whole new attitude toward quality. It is about the culture of an organization. To truly reap the benefits of TQM, the organization must change its culture. Table 6.6 illustrates the differences between cultures of a TQM organization and a more tra-ditional organization.
Obstacles to Implementing TQM
Companies have had varying success in implementing TQM. Some have been quite successful, but others have struggled. Part of the difficulty may be with the process by which it is implemented rather than with the principles of TQM. Among the factors cited in the literature are the following: 1. Lack of a companywide definition of quality: Efforts aren’t coordinated; people are working
at cross-purposes, addressing different issues, and using different measures of success. 2. Lack of a strategic plan for change: Without such a plan the chance of success is lessened
and the need to address strategic implications of change is ignored. 3. Lack of a customer focus: Without a customer focus, there is a risk of customer dissatisfac-
tion. 4. Poor intraorganizational communication: The left hand doesn’t know what the right hand
is doing; frustration, waste, and confusion ensue.
Quality at the source The philosophy of making each worker responsible for the quality of his or her work.
The iPod Shuffle stops playing music when the earphone jack is unplugged. When the earphones are plugged back in, the music resumes right where it left off. This keeps the battery from running down and is an example of mistake proofing.
Operations Strategy
Notes
182 Self-Learning Material
OS_IMT_06.indd 182 6/18/2015 4:07:09 PM

table 6.6 Comparing the cultures of TQM and traditional organizations
Aspoct Overall mission
Traditional Maximize Return on Investment
TQM Meet or Exceed Customer
ExpectationsObjectives Emphasis on short term Balance of long term and short
term
Management Not always open; sometimes inconsistent objectives
Open; encourages employee input; consistent objectives
Role of manager Issue orders; enforce Coach; remove barriers; build trust
Customer requirements Not highest priority; may be unclear Highest priority; important to iden-tify and understand
Problems Assign blame; punish Identify and resolve
Problem solving Not systematic; individuals Systematic; teams
Improvement Erratic Continuous
Suppliers Adversarial Partners
Jobs Narrow, specialized; much individual effort Broad, more general; much team effort
Focus Product oriented Process oriented
5. Lack of employee empowerment: Not empowering employees gives the impression of not trusting employees to fix problems, adds red tape, and delays solutions.
6. View of quality as a “quick fix”: Quality needs to be a long-term, continuing effort. 7. Emphasis on short-term financial results: “Duct-tape” solutions often treat symptoms; spend
a little now—a lot more later. 8. Inordinate presence of internal politics and “turf” issues: These can sap the energy of an
organization and derail the best of ideas. 9. Lack of strong motivation: Managers need to make sure employees are motivated. 10. Lack of time to devote to quality initiatives: Don’t add more work without adding additional
resources. 11. Lack of leadership: Managers need to be leaders.
This list of potential problems can serve as a guideline for organizations contemplating imple-menting TQM or as a checklist for those having trouble implementing it.
criticisms of TQM
TQM programs are touted as a way for companies to improve their competitiveness, which is a very worthwhile objective. Nonetheless, TQM programs are not without criticism. The following are some of the major criticisms: 1. Overzealous advocates may pursue TQM programs blindly, focusing attention on quality
even though other priorities may be more important (e.g., responding quickly to a competi-tor’s advances).
2. Programs may not be linked to the strategies of the organization in a meaningful way. 3. Quality-related decisions may not be tied to market performance. For instance, customer
satisfaction may be emphasized to the extent that its cost far exceeds any direct or indirect benefit of doing so.
4. Failure to carefully plan a program before embarking on it can lead to false starts, employee confusion, and meaningless results.
5. Organizations sometimes pursue continuous improvement (i.e., incremental improvement) when dramatic improvement is needed.
6. Quality efforts may not be tied to results.Note that there is nothing inherently wrong with TQM; the problem is how some individuals or
organizations misuse it. Let’s turn our attention to problem solving and process improvement.
Notes
Management of Quality
183Self-Learning
Material
OS_IMT_06.indd 183 6/18/2015 4:07:09 PM

Plan-do-study-act (PDSA) cycle A framework for problem solving and improvement activities.
Operations Strategy
Notes
184 Self-Learning Material
LEArNING OUTcOME 6.10
PrOBLEM SOLVING AND PrOcESS IMPrOVEMENT
Problem solving is one of the basic procedures of TQM. In order to be successful, problem-solving efforts should follow a standard approach. Table 6.7 describes the basic steps in the TQM problem-solving process.
An important aspect of problem solving in the TQM approach is eliminating the cause so that the problem does not recur. This is why users of the TQM approach often like to think of problems as “opportunities for improvement.”
table 6.7 Basic steps in problem solving
Step 1 Define the problem and establish an improvement goal. Give problem definition careful consideration; don’t rush through this step because this will serve as the focal point of problem-solving efforts.
Step 2 Develop performance measures and collect data.The solution must be based on facts. Possible tools include check sheet, scatter diagram, histogram, run chart, and control chart.
Step 3 Analyze the problem. Possible tools include Pareto chart, cause-and-effect diagram.
Step 4 Generate potential solutions. Methods include brainstorming, interviewing, and surveying.
Step 5 Choose a solution. Identify the criteria for choosing a solution. (Refer to the goal established in Step 1.) Apply criteria to potential solutions and select the best one.
Step 6 Implement the solution. Keep everyone informed.
Step 7 Monitor the solution to see if it accomplishes the goal. If not, modify the solution, or return to Step 1. Possible tools include control chart and run chart.
The Plan-Do-Study-Act cycle
The plan-do-study-act (PDSA) cycle, also referred to as either the Shewhart cycle or the Deming wheel, is the conceptual basis for problem-solving activities. The cycle is illustrated in Figure 6.1. Representing the process with a circle underscores its continuing nature.
Recognizeproblem
ManagementCommitment
Form qualityimprovement
teams
Continuousimprovement
Defineproblem
Ensurepermanence
Developperformance
measures
Analyzeproblem
Implementsolution
Evaluatesolution
Determinepossiblecauses
PLAN
STUDY
ACT
DO
Plan
Study
Act Do
Figure 6.1 A. The PDSA cycle B. The PDSA cycle applied to problem solving
Source: Figure from Donna Summers, Quality, 2nd ed., p. 67. Copyright © 2000 Prentice Hall, Inc. Reprinted by permission of Pearson Education, Inc., Upper Saddle River, NJ.
OS_IMT_06.indd 184 6/18/2015 4:07:10 PM

Notes
Management of Quality
185Self-Learning
Material
There are four basic steps in the cycle:
Plan. Begin by studying the current process. Document that process. Then collect data on the process or problem. Next, analyze the data and develop a plan for improvement. Specify measures for evaluating the plan.
Do. Implement the plan, on a small scale if possible. Document any changes made during this phase. Collect data systematically for evaluation.
Study. Evaluate the data collection during the do phase. Check how closely the results match the original goals of the plan phase.
Act. If the results are successful, standardize the new method and communicate the new method to all people associated with the process. Implement training for the new method. If the results are unsuccessful, revise the plan and repeat the process or cease this project.
Employing this sequence of steps provides a systematic approach to continuous improvement.
LEArNING OUTcOME 6.11
PrOcESS IMPrOVEMENT
Process improvement is a systematic approach to improving a process. It involves documentation, measurement, and analysis for the purpose of im-proving the functioning of a process. Typical goals of process improvement include increasing customer satisfaction, achieving higher quality, reducing waste, reducing cost, increasing productivity, and reducing processing time.
Table 6.8 provides an overview of process improvement.
Process improvement A systematic approach to improving a process.
table 6.8 Overview of process improvement
A. Map the process
1. Collect information about the process; identify each step in the process. For each step, determine:
The inputs and outputs.
The people involved.
The decisions that are made.
Document such measures as time, cost, space used, waste, employee morale and any employee turnover, accidents and/or safety hazards, working conditions, revenues and/or profits, quality, and customer satisfaction, as appropriate.
2. Prepare a flowchart that accurately depicts the process. Make sure that key activities and decisions are represented.
B. Analyze the process
1. Ask these questions about the process:
Is the flow logical?
Are any steps or activities missing?
Are there any duplications?
2. Ask these questions about each step:
Could it be eliminated?
Does the step add value?
Does any waste occur at this step?
Could the time be shortened?
Could the cost to perform the step be reduced?
Could two (or more) steps be combined?
C. Redesign the process
Using the results of the analysis, redesign the process. Document the improvements; potential measures include reductions in time, cost, space, waste, employee turnover, accidents, safety hazards, and increases/improvements in employee morale, working conditions, revenues/profits, quality, and customer satisfaction.
OS_IMT_06.indd 185 6/18/2015 4:07:10 PM

Operations Strategy
Notes
186 Self-Learning Material
LEArNING OUTcOME 6.12
SIx SIGMA
The term six sigma has several meanings. Statistically, six sigma means having no more than 3.4 defects per million opportunities in any process, product, or service. Conceptually, the term is much broader, referring to a program designed to reduce the occurrence of defects to achieve lower costs and improved customer satisfaction. It is based on the application of certain tools and techniques to selected projects to achieve strategic business results. In the business world, six-sigma programs have become a key way to improve quality, save time, cut costs, and im-prove customer satisfaction. Six-sigma programs can be employed in design, production, service, inventory management, and delivery. It is important for six-sigma projects to be aligned with organization strategy.
Motorola pioneered the concept of a six-sigma program in the 1980s and actually trademarked the term. Today, six sigma concepts are widely used by businesses, governments, consultants, and even the military as a business performance methodology.
There are management and technical components of six-sigma programs. The management component involves providing strong leadership, defining performance metrics, selecting projects likely to achieve business results, and selecting and training appropriate people. The technical component involves improving process performance, reducing variation, utilizing statistical meth-ods, and designing a structured improvement strategy, which involves definition, measurement, analysis, improvement, and control.
For six sigma to succeed in any organization, buy-in at the top is essential. Top management must formulate and communicate the company’s overall objectives and lead the program for a successful deployment. Other key players in six-sigma programs are program champions, “master black belts,” “black belts,” and “green belts.” Champions identify and rank potential projects, help select and evaluate candidates, manage program resources, and serve as advocates for the program. Master black belts have extensive training in statistics and use of quality tools. They are teachers and mentors of black belts. Black belts are project team leaders responsible for implementing process improvement projects. They have typically completed four weeks of six-sigma training and have demonstrated mastery of the subject matter through an exam and successful completion of one or more projects. Green belts are members of project teams.
Black belts play a pivotal role in the success of six-sigma programs. They influence change, facilitate teamwork, provide leadership in applying tools and techniques, and convey knowledge and skills to green belts. Black belt candidates generally have a proven strength in either a technical discipline such as engineering or a business discipline. Candidates also must have strong “people skills” and be able to facilitate change. And they must be proficient in applying continuous im-provement and statistical methods and tools. A black belt must understand the technical aspects of process improvement as well as the expected business results (time, money, quality improvement).
Six sigma is based on these guiding principles: 1. Reduction of variation is an important goal. 2. The methodology is data driven; it requires valid measurements. 3. Outputs are determined by inputs; focus on modifying and/or controlling inputs to improve
outputs. 4. Only a critical few inputs have a significant impact on outputs (the Pareto effect); concentrate
on those.DMAIC (define-measure-analyze-improve-control) is a formalized problem-solving process of six sigma. It is composed of five steps that can be applied to any process to improve its effective-ness. The steps are: 1. Define: Set the context and objectives for improvement. 2. Measure: Determine the baseline performance and capability of the process. 3. Analyze: Use data and tools to understand the cause-and-effect relationships of the process. 4. Improve: Develop the modifications that lead to a validated improvement in the process. 5. Control: Establish plans and procedures to ensure that improvements are sustained.
Six sigma A business process for improving quality, reducing costs, and increasing customer satisfaction.
OS_IMT_06.indd 186 6/18/2015 4:07:10 PM

short Case 6.3What Keeps Six Sigma Practitioners Up at Night?
BillKowalskiIt may be the most widely acclaimed performance improvement system across the business world, yet Six Sigma is not immune to a paradox common to most large-scale change efforts:
You can’t expect to sustain top executive support without producing consistent bottom-line results . . . yet consistent results aren’t likely without sustained top executive support.
This conundrum is a key finding from a recent survey of more than 240 Six Sigma practitioners across industries and around the globe. Sponsored by Leap Technologies, the survey was conducted anony-mously over the web through iSixSigma.com, the leading Six Sigma information portal.
The survey gauged perceptions of Six Sigma practitioners on two primary issues:
1. What causes Six Sigma projects to fail to produce desired results? 2. What would most help to improve Six Sigma project results?
We know these are issues keeping practitioners up at night because these same people are under increasingly heavy pressure to produce and sustain bottom-line results from their projects.
The “Catch 22” for Six Sigma PractitionersThe most often cited reason for Six Sigma project failure was “lack of sustained executive sponsorship and commitment.” It is clearly evident that there is no substitute for top leadership support to achieve sus-tained Six Sigma success. In close second ranking was “lack of buy-in, cooperation and ownership by frontline managers and employees for implementing and sustaining results on Six Sigma project solu-tions.” These top two barriers to success create a classic “Catch 22” for Six Sigma practitioners. On the one hand, executive commitment is critical to the funding and mandate Six Sigma practitioners need to challenge the status quo. On the other hand, sustaining executive support is nearly impossible without consistent delivery of results. Yet this payoff can’t be sustained without active support by those most impacted by Six Sigma solutions . . . frontline managers and employees! Six Sigma is, with its dedicated Belt infrastructure and standardized DMAIC methodology, a more sophisticated and effective approach than past quality improvement methods. But, if there is a chink to be found in Six Sigma’s armor, it is the issue of non-Belt participation and ownership. This problem, how-ever, rarely surfaces in the first 12 to 18 months of a Six Sigma Deployment. In fact, we’ve observed that, initially, many Six Sigma Deployment Leaders experience a false sense of security about results. Why? Because most of the projects taken on by newly trained Black and Green Belts rarely require high levels of frontline support and, for the most part, don’t challenge top management’s ingrained cultural biases. At the same time, it’s also not uncommon for organizations adopting Six Sigma to “hit the wall” once “low touch” projects are completed. Top management’s appetite for results has been whetted, but the foundational support in terms of skills, experience and commitment may not be there to tackle the proj-ects that present bigger change management challenges.
More Tools Are NeededAccording to the Six Sigma practitioners completing the survey, the path to better Six Sigma project results requires equipping practitioners with an expanded set of tools to both tackle more complex proj-ects and improve Belt productivity by getting more non-Belt involvement. This finding is not likely to be a revelation to many of the early pioneers who paved the way to the popularity of Six Sigma. Companies like Motorola, Allied Signal (now merged with Honeywell), and GE, along with other big players, such as DuPont and 3M (among others), have already taken steps to strengthen their Six Sigma Deployments by enhancing the skills of Belts and expanding the tool kit. At the same time, the survey results indicate there is more work to do in advancing Six Sigma into a robust and sustainable method for transformational change. The top priority appears to be the expansion of the Six Sigma practitioner’s tool kit to break free of the “Catch 22” syndrome. In fact, the integration of Lean principles by numerous Six Sigma users is a big step in the right direction. However, in addition to Lean tools there also appears to be a growing recognition that more tools are needed to deal with the change management aspects of Six Sigma. Ninety percent of the survey respondents rated the need for a structured tool set for engaging “non-Belts” in projects, particularly those with significant behavior change requirements. The preceding finding is linked to the second most important reason practitioners stated as the cause for Six Sigma projects falling short (i.e., lack of buy-in, cooperation, or ownership by frontline employees
Notes
Management of Quality
187Self-Learning
Material
OS_IMT_06.indd 187 6/18/2015 4:07:10 PM

and managers). The relationship between these two findings correlates with the anecdotal evidence from more experienced Six Sigma organizations about the keys to accelerating results and reducing project cycle times. As they move down the experience curve and tackle larger and more complex change proj-ects, the most successful Six Sigma organizations have expanded their tool sets and integrated other improvement disciplines such as Lean seamlessly into deployments.
The Keys to a Better Night’s SleepSix Sigma practitioners can break free of the “Catch 22” syndrome by designing their deployments to deliver consistent results and sustain consistent executive support. The keys are:
1. Expand the tool set early in deployment with methods to get more non-Belt participation and faster results. The key to avoiding confusion or overload is to integrate Lean, Innovation, and other improve-ment methods into the DMAIC framework.
2. Engage senior leaders to go beyond the rubber-stamping of project selections to actually designing the project plan with the Belts. The benefits are a more realistic appraisal of project requirements and deeper understanding of where and how to apply other tool sets to drive bigger and faster results.
3. Engage non-Belt managers and employees early on projects where there is existing motivation for change.
Taking actions such as these will provide a steadier stream of results, sustained executive support, and a better night’s sleep for Six Sigma practitioners!
About the AuthorBill Kowalski is a Senior Partner with Leap Technologies, the leading provider of Change Acceleration Tools for Six Sigma Deployment. For more articles and information on accelerating organization change, visit Leap Technologies on the Web at www.actionworkout.com.
Source: Bill Kowalski, “What Keeps Six Sigma Practitioners Up at Night?” Copyright © Leap Technologies, Inc., 2003. Used with permission.
Operations Strategy
Notes
188 Self-Learning Material
LEArNING OUTcOME 6.13
QUALITY TOOLS
There are a number of tools that an organization can use for problem solving and process improve-ment. This section describes eight of these tools. The tools aid in data collection and interpretation, and provide the basis for decision making.
The first seven tools are often referred to as the seven basic quality tools. Figure 6.2 provides a quick overview of the seven tools.
FlowchartsA flowchart is a visual representation of a process. As a problem-solv-ing tool, a flowchart can help investigators in identifying possible points in a process where problems occur. Figure 6.3 illustrates a flowchart for catalog telephone orders in which potential failure points are highlighted.
The diamond shapes in the flowchart represent decision points in the process, and the rectangu-lar shapes represent procedures. The arrows show the direction of “flow” of the steps in the process.
To construct a simple flowchart, begin by listing the steps in a process. Then classify each step as either a procedure or a decision (or check) point. Try to not make the flowchart too detailed or it may be overwhelming, but be careful not to omit any key steps.
Check SheetsA check sheet is a simple tool frequently used for problem identifica-tion. Check sheets provide a format that enables users to record and organize data in a way that facilitates collection and analysis. This for-mat might be one of simple checkmarks. Check sheets are designed on the basis of what the users are attempting to learn by collecting data.
Many different formats can be used for a check sheet, and there are many different types of sheets. One frequently used form of check sheet deals with type of defect, another with location of defects. These are illustrated in Figures 6.4 and 6.5.
Flowchart A diagram of the steps in a process.
Check sheet A tool for recording and organizing data to identify a problem.
OS_IMT_06.indd 188 6/18/2015 4:07:10 PM

Notes
Management of Quality
189Self-Learning
Material
DefectABC
1 2
Day
3 4
Check sheet
Flowchart
Scatter diagram
Variable B
Histogram
Frequency
Frequency
Control chart
Upper control limit
Lower control limit
Cause-and-effect diagram
Materials Equipment
People Methods
Problem
Pareto chart
Variable A
A B C D E
C B D A E
A tool for organizing and collecting data; a tally of problems or other events by category
A graph that shows the degree anddirection of relationship between twovariables
A chart that shows an empiricalfrequency distribution
A diagram that arranges categories fromhighest to lowest frequency of occurrence
A statistical chart of time-ordered values ofa sample statistic (e.g., sample means)
A diagram used to organize a search forthe cause(s) of a problem; also known asa fishbone diagram
A diagram of the steps in a process
Figure 6.2 The seven basic quality tools
Figure 6.4 shows tallies that denote the type of defect and the time of day each occurred. Problems with missing labels tend to occur early in the day and smeared print tends to occur late in the day, whereas off-center labels are found throughout the day. Identifying types of defects and when they occur can help in pinpointing causes of the defects.
Figure 6.5 makes it easy to see where defects on the product—in this case, a glove—are occur-ring. Defects seem to be occurring on the tips of the thumb and first finger, in the finger valleys
OS_IMT_06.indd 189 6/18/2015 4:07:10 PM
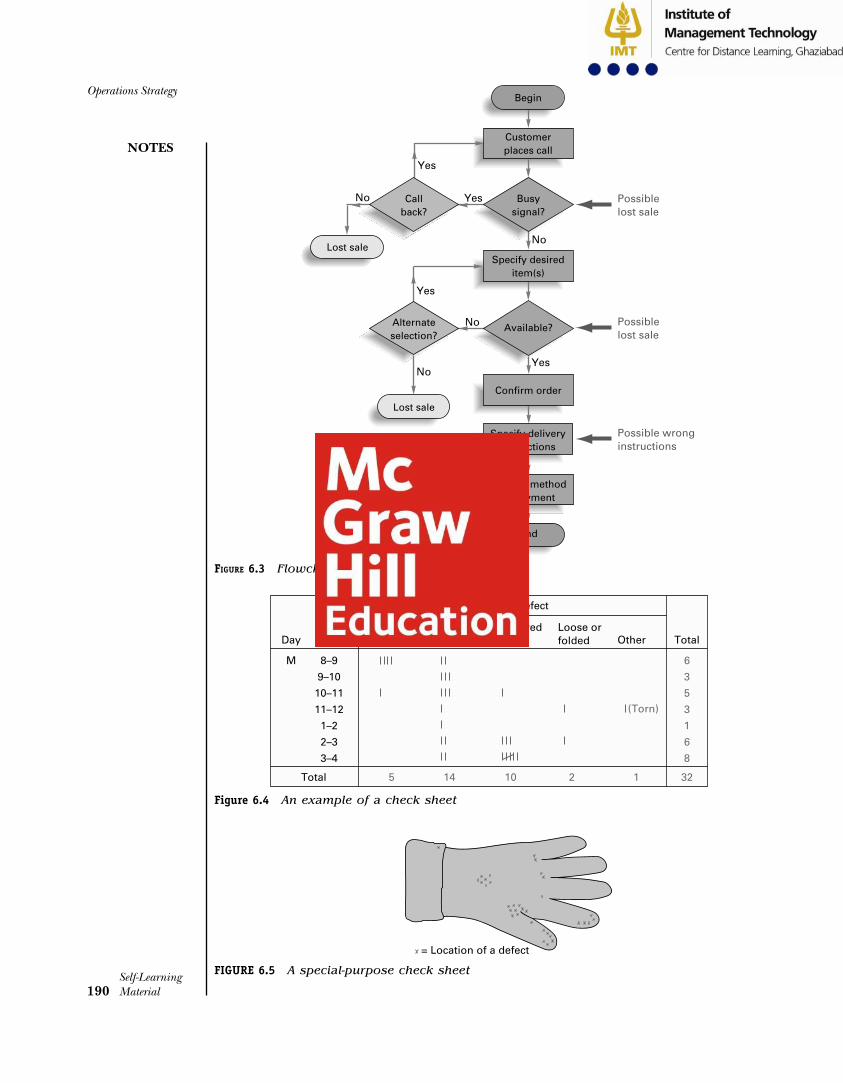
Operations Strategy
Notes
190 Self-Learning Material
Figure 6.3 Flowchart of catalog call
Available?
Customerplaces call
Specify desireditem(s)
Begin
End
Confirm order
Specify deliveryinstructions
Indicate methodof payment
Callback?
Lost sale
Alternateselection?
Lost sale
Yes
Yes
Yes
No
No
No
NoYes
Possiblelost sale
Possiblelost sale
Possible wronginstructions
Busysignal?
Figure 6.4 An example of a check sheet
Day TimeMissinglabel
Off-center
Smearedprint
Loose orfolded Other
M 8–9
9–10
10–11
11–12
1–2
2–3
3–4
Type of Defect
Total
Total
(Torn)
6
3
5
3
1
6
8
5 14 10 2 1 32
FIGURE 6.5 A special-purpose check sheet
= Location of a defect
OS_IMT_06.indd 190 6/18/2015 4:07:11 PM

Notes
Management of Quality
191Self-Learning
Material
(especially between the thumb and first finger), and in the center of the gloves. Again, this may help determine why the defects occur and lead to a solution.
HistogramsA histogram can be useful in getting a sense of the distribution of observed values. Among other things, one can see if the distribution is symmetrical, what the range of values is, and if there are any unusual values. Figure 6.6 illustrates a histogram. Note the two peaks. This suggests the possibility of two distributions with different centers. Possible causes might be two workers or two suppliers with different quality.
Histogram A chart of an empirical frequency distribution.
Pareto analysis Technique for classifying problem areas according to degree of importance, and focusing on the most important.
Figure 6.6 A histogram
Repair time (minutes)
Frequency
Figure 6.7 A Pareto diagram based on data in Figure 6.4
15
Loose OtherMissinglabel
Smearedprint
Off-center
44%
75%
91%97%100%
Nu
mb
er o
f d
efec
ts
5
10
Pareto Analysis
Pareto analysis is a technique for focusing attention on the most impor-tant problem areas. The Pareto concept, named after the 19th-century Italian economist Vilfredo Pareto, is that a relatively few factors gener-ally account for a large percentage of the total cases (e.g., complaints, defects, problems). The idea is to classify the cases according to degree of importance and focus on resolving the most important, leaving the less important. Often referred to as the 80–20 rule, the Pareto concept states that approximately 80 percent of the prob-lems come from 20 percent of the items. For instance, 80 percent of machine breakdowns come from 20 percent of the machines, and 80 percent of the product defects come from 20 percent of the causes of defects.
Often, it is useful to prepare a chart that shows the number of occurrences by category, ar-ranged in order of frequency. Figure 6.7 illustrates such a chart corresponding to the check sheet shown in Figure 6.4. The dominance of the problem with off-center labels becomes apparent.
OS_IMT_06.indd 191 6/18/2015 4:07:12 PM

Operations Strategy
Notes
192 Self-Learning Material
Presumably, the manager and employees would focus on trying to resolve this problem. Once they accomplished that, they could address the remaining defects in similar fashion; “smeared print” would be the next major category to be resolved, and so on. Additional check sheets would be used to collect data to verify that the defects in these categories have been eliminated or greatly reduced. Hence, in later Pareto diagrams, categories such as “off-center” may still appear but would be much less prominent.
Scatter DiagramsA scatter diagram can be useful in deciding if there is a correlation between the values of two variables. A correlation may point to a cause of a problem. Figure 6.8 shows an example of a scatter diagram. In this particular diagram, there is a positive (upward-sloping) relationship between the humidity and the number of errors per hour. High values of humidity correspond to high numbers of errors, and vice versa. On the other hand, a negative (downward-sloping) relationship would mean that when values of one variable are low, values of the other variable are high, and vice versa.
The higher the correlation between the two variables, the less scatter in the points; the points will tend to line up. Conversely, if there were little or no relationship be-tween two variables, the points would be completely scattered. In Figure 6.8, the correlation between humidity and errors seems strong because the points appear to scatter along an imaginary line.
Control ChartsA control chart can be used to monitor a process to see if the process output is random. It can help detect the presence of correctable causes of variation. Figure 6.9 illustrates a control chart. Control charts also can indicate when a problem occurred and give insight into what caused the problem.
Cause-and-effect diagram A diagram used to search for the cause(s) of a problem; also called fishbone diagram.
Scatter diagram A graph that shows the degree and direction of relationship between two variables.
Control chart A statisti-cal chart of time-ordered values of a sample statistic.
Figure 6.8 A scatter diagram
Number of errors per hour
Humidity
Figure 6.9 A control chart
Time
Upper control limit
Lower control limit
Cause-and-Effect DiagramsA cause-and-effect diagram offers a structured approach to the search for the possible cause(s) of a problem. It is also known as a fishbone diagram because of its shape, or an Ishikawa diagram, after the Japanese professor who developed the approach to aid workers overwhelmed by the number of possible sources of problems when problem solving. This tool helps to organize problem-solving efforts by identifying categories of factors that might be causing problems. Often this tool is used after brainstorming sessions to organize the ideas generated. Figure 6.10 illustrates one form of a cause-and-effect diagram.
OS_IMT_06.indd 192 6/18/2015 4:07:12 PM

Notes
Management of Quality
193Self-Learning
Material
Some errors are more likely causes than others, depending on the nature of the errors. If the cause is still not obvious at this point, additional investigation into the root cause may be neces-sary, involving a more in-depth analysis. Often, more detailed information can be obtained by asking who, what, where, when, why, and how questions about factors that appear to be the most likely sources of problems.
Run ChartsA run chart can be used to track the values of a variable over time. This can aid in identifying trends or other patterns that may be occurring. Figure 6.11 provides an example of a run chart showing a decreasing trend in accident frequency over time. Important advantages of run charts are ease of construction and ease of interpretation.
Figure 6.10 One format of a cause-and-effect diagram
Effect
cause
cause
causecause
cause
cause
causecause
causecause
cause
cause
causecause
People Equipment
Methods Materials
Run chart Tool for track-ing results over a period of time.
Figure 6.11 A run chart shows performance over time
2
Jan. Feb. Mar. Apr. May June July Aug. Sept. Oct. Nov.
1
Average number of accidents per week
Illustrations of the Use of Graphical Tools
This section presents some illustrations of the use of graphical tools in process or product im-provement. Figure 6.12 begins with a check sheet that can be used to develop a Pareto chart of the types of errors found. That leads to a more focused analysis of the most frequently occurring type of error using a cause-and-effect diagram. Additional cause-and-effect diagrams, such as errors by location, might also be used.
Figure 6.13 shows how Pareto charts measure the amount of improvement achieved in a before-and-after scenario of errors.
Figure 6.14 illustrates how control charts track two phases of improvement in a process that was initially out of control.
Methods for Generating Ideas
Some additional tools that are useful for problem solving and/or for process improvement are brainstorming, quality circles, and benchmarking.
OS_IMT_06.indd 193 6/18/2015 4:07:13 PM
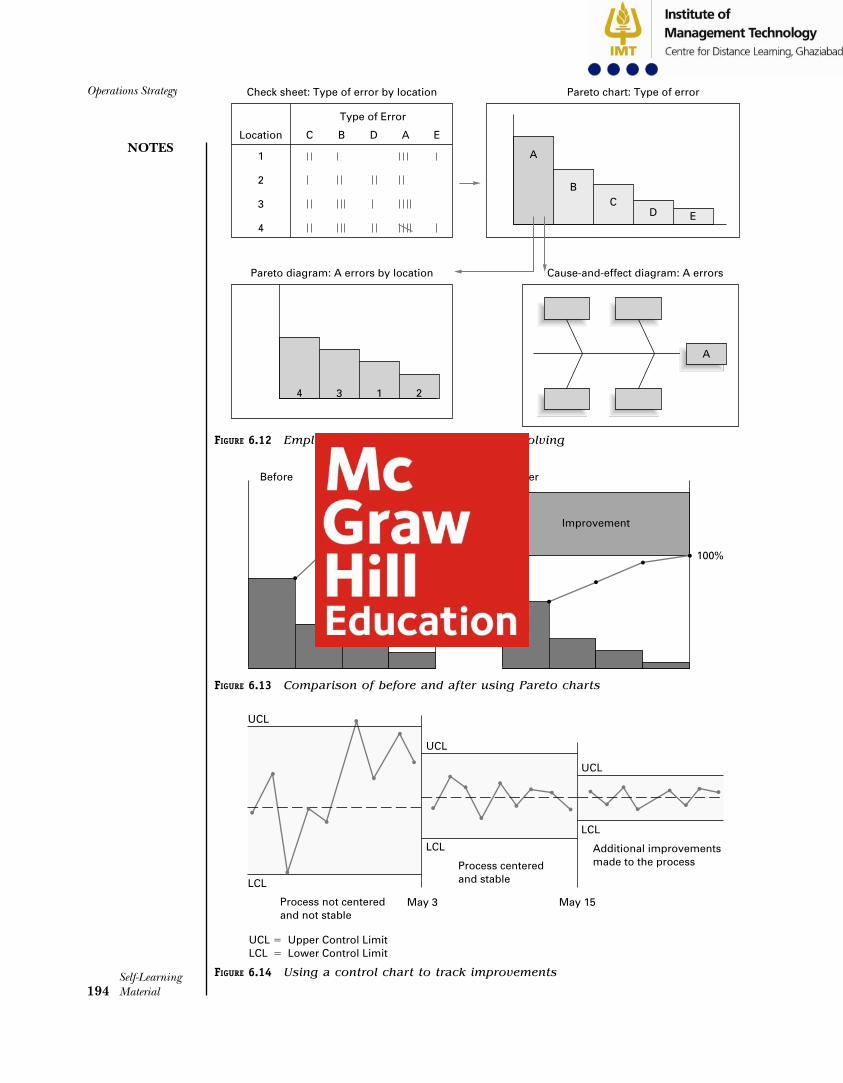
Operations Strategy
Notes
194 Self-Learning Material
Figure 6.12 Employing graphical tools in problem solving
Location C
1
2
3
4
Type of Error
B D A E
4 3 1 2
A
BC
D E
Check sheet: Type of error by location
Pareto diagram: A errors by location
Pareto chart: Type of error
Cause-and-effect diagram: A errors
A
Figure 6.13 Comparison of before and after using Pareto charts
100%Before
100%
After
Improvement
Figure 6.14 Using a control chart to track improvements
Additional improvementsmade to the process
UCL
LCL
UCL � Upper Control LimitLCL � Lower Control Limit
UCL
LCL
UCL
LCL
Process centeredand stable
Process not centeredand not stable
May 3 May 15
OS_IMT_06.indd 194 6/18/2015 4:07:13 PM

Notes
Management of Quality
195Self-Learning
Material
Brainstorming Tech-nique for generating a free flow of ideas in a group of people.
Quality circles Groups of workers who meet to discuss ways of improving products or processes.
Benchmarking Process of measuring perfor-mance against the best in the same or another industry.
Brainstorming. Brainstorming is a technique in which a group of peo-ple share thoughts and ideas on problems in a relaxed atmosphere that encourages unrestrained collective thinking. The goal is to generate a free flow of ideas on identifying problems, and finding causes, solutions, and ways to implement solutions. In successful brainstorming, criticism is absent, no single member is allowed to dominate sessions, and all ideas are welcomed. Struc-tured brainstorming is an approach to assure that everyone participates.
Quality Circles. One way companies have tapped employees for ideas concerning quality improvement is through quality circles. The circles comprise a number of workers who get together periodically to discuss ways of improving products and processes. Not only are quality circles a valuable source of worker input, they also can motivate workers, if han-dled properly, by demonstrating management interest in worker ideas. Quality circles are usually less structured and more informal than teams involved in continuous improvement, but in some organizations quality circles have evolved into continuous improvement teams. Perhaps a major distinction between quality circles and teams is the amount of authority given to the teams. Typi-cally, quality circles have had very little authority to implement any but minor changes; continu-ous improvement teams are sometimes given a great deal of authority. Consequently, continuous improvement teams have the added motivation generated by empowerment.
Benchmarking. Benchmarking is an approach that can inject new energy into improvement efforts. Summarized in Table 6.9, benchmarking is the pro-cess of measuring an organization’s performance on a key customer requirement against the best in the industry, or against the best in any industry. Its pur-pose is to establish a standard against which perfor-mance is judged, and to identify a model for learning how to improve. A benchmark demonstrates the degree to which customers of other organizations are satisfied. Once a benchmark has been identified, the goal is to meet or exceed that standard through improvements in appropriate processes.
The benchmarking process usually involves these steps: 1. Identify a critical process that needs improvement (e.g., order entry,
distribution, service after sale). 2. Identify an organization that excels in the process, preferably the best. 3. Contact the benchmark organization, visit it, and study the benchmark activity. 4. Analyze the data. 5. Improve the critical process at your own organization.
Selecting an industry leader provides insight into what competitors are doing; but competi-tors may be reluctant to share this information. Several organizations are responding to this dif-ficulty by conducting benchmarking studies and providing that information to other organizations without revealing the sources of the data.
Selecting organizations that are world lead-ers in different industries is another alternative. For example, the Xerox Corporation uses many benchmarks: For employee involvement, Procter & Gamble; for quality process, Florida Power and Light and Toyota; for high-volume produc-tion, Canon; for billing collection, American Express; for research and development, AT&T and Hewlett-Packard; for distribution, L.L. Bean and Hershey Foods; and for daily scheduling, Cummins Engine.
table 6.9 The benchmarking approach
1. What organizations do it the best?
2. How do they do it?
3. How do we do it now?
4. How can we change to match or exceed the best?
Hewlett-Packard, a world leader in research and development, created the TouchSmart PC. Joint research with universities, customers, and partners meets the scientific and business objectives of HP. This model is a benchmark for other companies.
OS_IMT_06.indd 195 6/18/2015 4:07:14 PM

Operations Strategy
Notes
196 Self-Learning Material
OPErATIONS STrATEGY
All customers are concerned with the quality of goods or services they receive. For this reason alone, business organizations have a vital, strategic interest in achieving and maintaining high quality standards. Moreover, there is a positive link between quality and productivity, giving an additional incentive for achieving high quality and being able to present that image to current and potential customers.
The best business organizations view quality as a never-ending journey. That is, they strive for continual improvement with the attitude that no matter how good quality is, it can always be improved, and there are benefits for doing so.
In order for total quality management to be successful, it is essential that a majority of those in an organization buy in to the idea. Otherwise, there is a risk that a significant portion of the benefits of the approach will not be realized. Therefore, it is important to give this sufficient atten-tion, and to confirm that concordance exists before plunging ahead. A key aspect of this is a top-down approach: Top management needs to be visibly involved and needs to be supportive, both financially and emotionally. Also important is education of managers and workers in the concepts, tools, and procedures of quality. Again, if education is incomplete, there is the risk that TQM will not produce the desired benefits.
And here’s a note of caution: Although customer retention rates can have a dramatic impact on profitability, customer satisfaction does not always guarantee customer loyalty. Consequently, organizations may need to develop a retention strategy to deal with this possibility.
It is not enough for an organization to incorporate quality into its operations; the entire supply chain has to be involved. Problems such as defects in purchased parts, long lead times, and late or missed deliveries of goods or services all negatively impact an organization’s ability to satisfy its customers. So it is essential to incorporate quality throughout the supply chain.
Benchmarking Corporate Web Sites of Fortune 500 CompaniesMore and more people are using the Internet. And when these people want information about a company’s products or services, they often go to the company’s Web site. In a study of the home pages of Fortune 500 companies, 13 factors were deemed critical to quality. Those factors, and the survey results, are shown below:
1. Use of meta tags (e.g., keywords used by search engines) Yes, 70%; no, 30% 2. Meaningful home page title Yes, 97%; no, 3% 3. Unique domain name Yes, 91%; no, 9% 4. Search engine site registration 97% (average) 5. Server reliability 99% (average) 6. Average speed of loading (seconds) 28k, 19.3; 56k, 10.9; T1, 2.6 sec. 7. Average number of bad links .40 8. Average number of spelling errors .16 9. Visibility of contact information Yes, 74%; no, 26% 10. Indication of last update date Yes, 17%; no, 83% 11. A privacy policy Yes, 53%; no, 47% 12. Presence of a search engine Yes, 59%; no, 41% 13. Translation to multiple languages Yes, 11%; no, 89%
The corporations are doing well on most factors, but they need improvement on the last five. The list is a handy reference other organizations can use to benchmark their existing home pages to see where improvements are needed or to develop effective home pages.
Question Give one reason for the importance of each factor.
Source: Based on Nabil Tamimi, Murli Rajan, and Rose Sebastianelli, “Benchmarking the Home Pages of ‘Fortune 500’ Companies.” Reprinted with permission from Quality Progress © 2000 American Society for Quality. No further distribution allowed without permission.
Cr
itiC
al P
er
sP
eC
tiv
e
OS_IMT_06.indd 196 6/18/2015 4:07:14 PM

Notes
Management of Quality
197Self-Learning
Material
Key Terms
Quality The ability of a product or service to consistently meet or exceed customer expectations.
Deming Prize Prize established by the Japanese and awarded annually to firms that distinguish them selves with quality management programs.
Convenience The availability and accessibility of the service.
Reliability The ability to perform a service dependably, consistently, and accurately.
Responsiveness The willingness of service providers to help customers in unusual situations and to deal with problems.
Time The speed with which service is delivered.
Assurance The knowledge exhibited by personnel who come into contact with a customer and their ability to convey trust and confidence.
Courtesy The way customers are treated by employees who come into contact with them.
Tangibles The physical appearance of facilities, equipment, personnel, and communication materials.
Consistency The ability to provide the same level of good quality repeatedly.
Expectations Meet (or exceed) customer expectations.
In Review
This chapter presents philosophies and tools that can be used to achieve high quality and continu-ally improve quality. Quality is the culmination of efforts of the entire organization and its supply chain. It begins with careful assessment of what the customers want, then translating this infor-mation into technical specifications to which goods or services must conform. The specifications guide product and service design, process design, production of goods and delivery of services, and service after the sale or delivery. The consequences of poor quality include loss of market share, liability claims, a decrease in productivity, and an increase in costs. Quality costs include costs related to prevention, appraisal, and failure. Determinants of quality are design, conformance to design, ease of use, and service after delivery. Modern quality management is directed at preventing mistakes rather than finding them after they occur and reducing process output variation. Currently, the business community shows wide-spread interest in improving quality and competitiveness. The chapter includes a description of the key contributors to quality management, and it out-lines the ISO 9000, ISO 14000, and ISO 24700 international quality standards. Three awards of distinction, the Baldrige Award, the European Quality Award, and the Deming Prize, are given annually to organizations that have shown great achievement in quality manage-ment. Total quality management is a never-ending pursuit of quality that involves everyone in an organization. The driving force is customer satisfaction; a key philosophy is continuous improve-ment. Training of managers and workers in quality concepts, tools, and procedures is an important aspect of the approach. Teams are an integral part of TQM. Two major aspects of the TQM approach are problem solving and process improvement. Six-sigma programs are a form of TQM. They emphasize the use of statistical and management sci-ence tools on selected projects to achieve business results.
OS_IMT_06.indd 197 6/18/2015 4:07:15 PM

Operations Strategy
Notes
198 Self-Learning Material
Mult ip le -Choice Quest ions
1. Quality refers to the ability of a product or service to consistently meet or exceed customer requirements or expectations.
(a) True (b) False (c) Both (d) None 2. Which company is the pioneer in applying statistical control charts for monitoring
production? (a) Nissan (b) Toyota (c) Sony (d) Bell Telephone Laboratories 3. Who is known as the father of statistical quality control? (a) E Deming (b) Walter Shewhart (c) J Juran (d) T Ohno 4. Who described quality management in terms of a trilogy consisting of quality planning,
quality control, and quality improvement? (a) E Deming (b) Walter Shewhart (c) J Juran (d) T Ohno 5. Who developed the concept of zero defects? (a) E Deming (b) Walter Shewhart (c) JJuran (d) Philip B Crosby 6. Who has developed the philosophy and methods of kaizen, a Japanese term for continuous
improvement? (a) Deming and Juran (b) Ohnoand Shingo (c) Ishikawa and Ohno (d) Shingo and Toyoda 7. Which is the instrument designed to obtain feedback on an organization’s ability to provide
quality service to customers for service quality? (a) SERVQUAL (b) OHNO TOOL (c) SERVQUEST (d) QUALSERV 8. What could be the consequences of poor quality? (a) Profitability (b) Brand gain (c) Loss of business (d) None 9. Which of the following approaches focuses on the economics of quality efforts? (a) Report quality (b) Appraisal costs (c) Return on investment (d) Return on quality 10. Which of following is not a quality award? (a) Deming Prize (b) Appraisal Prize (c) Baldrige Award (d) European Quality Award
Key to McQs
1. (a) 2. (d) 3. (b) 4. (c) 5. (d) 6. (b) 7. (a) 8. (c)
9. (d) 10. (b)
Concept Quest ions
1. List and briefly explain (a) The dimensions of service quality. (b) The determinants of quality. 2. Define the terms quality of design and quality of conformance. 3. What are some possible consequences of poor quality?
OS_IMT_06.indd 198 6/18/2015 4:07:15 PM

Notes
Management of Quality
199Self-Learning
Material
4. Many product reviews are available on the Internet. Two examples are reviews on electronics products such as DVD players and high-definition televisions. There are often both positive and negative reviews.
(a) Do such reviews (positive and negative) influence your purchasing decisions? Why or why not?
(b) Why do you suppose consumers take the time and effort to write such reviews? (c) There is often a feedback button asking if you found the review helpful. Do you usual-
lyrespond? Why or why not? 5. Describe the quality–ethics connection. 6. Select one of the quality gurus and briefly describe his major contributions to quality man-
agement.
OS_IMT_06.indd 199 6/18/2015 4:07:15 PM