notes - cmfri repositoryeprints.cmfri.org.in/1942/1/srinath_166-169.pdf · notes an algoriteim to e...
TRANSCRIPT
NOTES
AN ALGORITEIM T O E!YI'IMATE THE TERMINAL EXPLOITATION IN THE LENGTH COHORT ANALYSIS
ABSTRACT
An algorithm is developed to estimate the terminal rate of exploitation for use in the length cohort analysis. A computer program in BASICA is also presented to execute the algorithm.
THE IXNGIH cohort analysis (Jones 1984) is a derived form of age based cohort analysis of Pope (1972). This approach is basically same as the length converted catch curve where the age fmquency data is transformed to length frequency data via a growth function in length. The assumptions for the validity of length cohort analysis are almost the same as that of the age based analysis except that the growth function is the von Bertalanffy's Growth Formula (vBGF). The aim is to make use of the length structure of the catch to estimate the population structure under certain assumptions and for some known growth and natural mortality parameters. This would facilitate in estimating the stock size, recruitment, spawning stock, fishing mortality etc. which are essential for fish stock assessment.
where Loo, K are the parameters of vBGF and M is the instantaneous rate of natural mortality.
The calculations are started from the last length group in the length frequency data and use the length based catch equation
where F is the fishing mortality .rate in the length group (Ll , L2)
Z = F +M and A t is time taken to grow from L1 to L2 (time interval).
In the last length class corresponding to the catch in numbers larger than L1 (the lower
Assuming that the *Mh eqution in limit of the last length group) A I is considered length is vBGF, the basic equation in the length
coho* analysis (following the notations of large that it tends 00 and the Sparre and ~ e n e k a (1992) is given by above equation reduces to
N ( L , ) = [ N ( L 2 ) * H ( L 1 , L 2 ) + C (L, , 00) = N (L1) F/Z
c (L, , L,) 1 * H (L1 , L2) ... I from which we get
where N ( L , ) = number of fish that attain N (L,) = C (L,, =) Z/F *
length L1 using this and the equation I, the numbers in
N (L2) = number of fish that attain the sea are recumively computed. Once these
length L2 are available,:ihe computation of mortality rates, standing stock etc. become straightforward and
C (Ll , LZ) = number of fish caught in needs no elaboration and the procedure is given the length group ( L 1 , L2) and in Spam and Venema (1992).
-
NOTES 167
Usually for estimating the numben at sea (7) If the calculated numbers in sea are in the terminal length p u p , a value for negative or zero stop the calculations go to F/Z (terminal exploitation rate) is assumed. step (8) else increment FIZ go to step (4). According to Jones (1984) the choice of FIZ depends on the extent of exploitation of the (8) Check FIZ values at the larger length
stock under study. For moderate to heavily !YOUPS, if then is more Or less conm*ncey exploited a choice of F/Z 0.50 Stop the routine and print resu1% if not, repeat
convergence of mortality rates. In this section the routine in the neighbourhood of the FIZ
an algorithm is developed which cames out obtained in (7)
the length cohort analysis not from the terminal (9) Check again the FJZ values at the length group but from a chosen length group larger length groups, if there is no further and such that the (Fn) at the larger impmvement possible, stdp the calculations and length p u p s are more or less homogeneous. print the results.
In heavily exploited stocks and also in the short lived species, constrained by the selectivity of the gear, the catches of the length classes at the fully vulnerable length class or in its neighbourhood are likely to be more representative than those that are far away. The following algorithm is based on this consideration only.
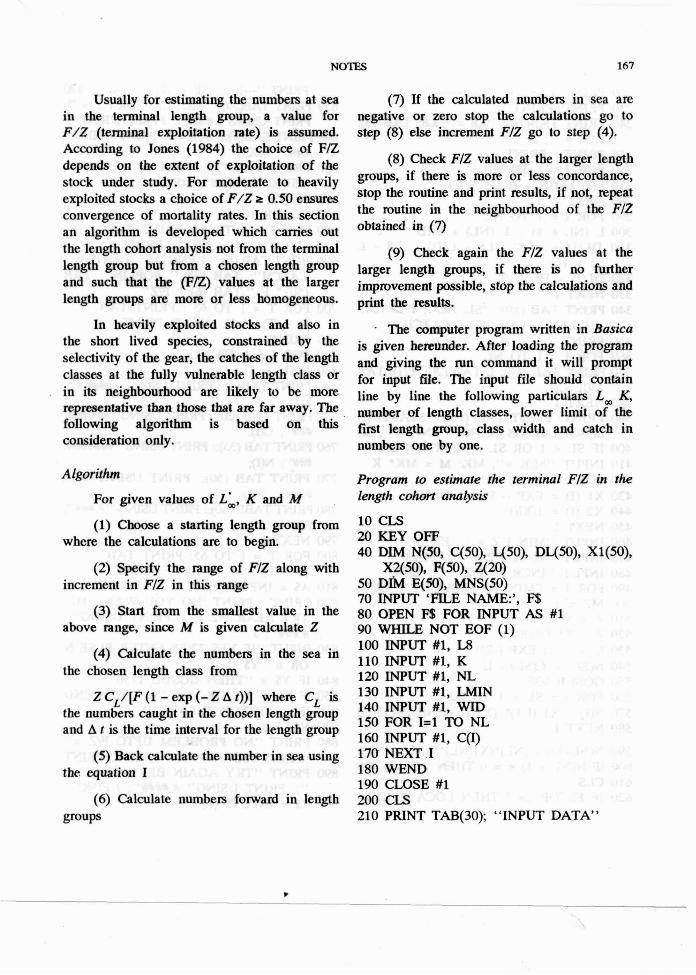
- The computer program written in Basica is given hereunder. After loading the program and giving the run command it will prompt for input file. The input file should contain line by line the following particulars Lm K, number of length classes, lower limit of the first length p u p , class width and catch in numbers one by one.
Algorithm Bogram to estimate the terminal FIZ in the For given values of L:, K and M length cohort analysis
(1) Choose a starting length group from lo
where the calculations are to begin. 20 KEY OFF 40 DIM N(50, C(50), L(50), Dq50), X1(50),
(2) Specify the range of FIZ along with X2(50), F(50), 2(20) increment in FIZ in this range 50 D M E(50), MNS(5O)
70 INPUT 'FILE NAME:', F$ (3) Start from the smallest value in the 80 OPEN F$ FOR INPUT AS #1
above range, since M is given calculate Z 90 WHILE NOT EOF (1) 100 INPUT #1, L8
(4) Calculate the numbers in the sea in 110 INPUT the chosen length class from 120 INPUT #I, NL
Z CL/[F (1 - exp (- Z A t))] where CL is 130 INPUT #1, LMIN
the numbers caught in the chosen length group 140 INPUT #I, WID
and A t is the time interval for the length group 150 FOR 1=1 TO NL 160 INPUT #1, a) , ,
(5) Back calculate the number in sea using 170 NEXT .I the equation I 180 WEND
190 CLOSE #1 (6) Calculate numbers forward in length 200 CLS
EF"'0 PS 210 PRINT TAB(30); "INPUT DATA"
168 NOTES
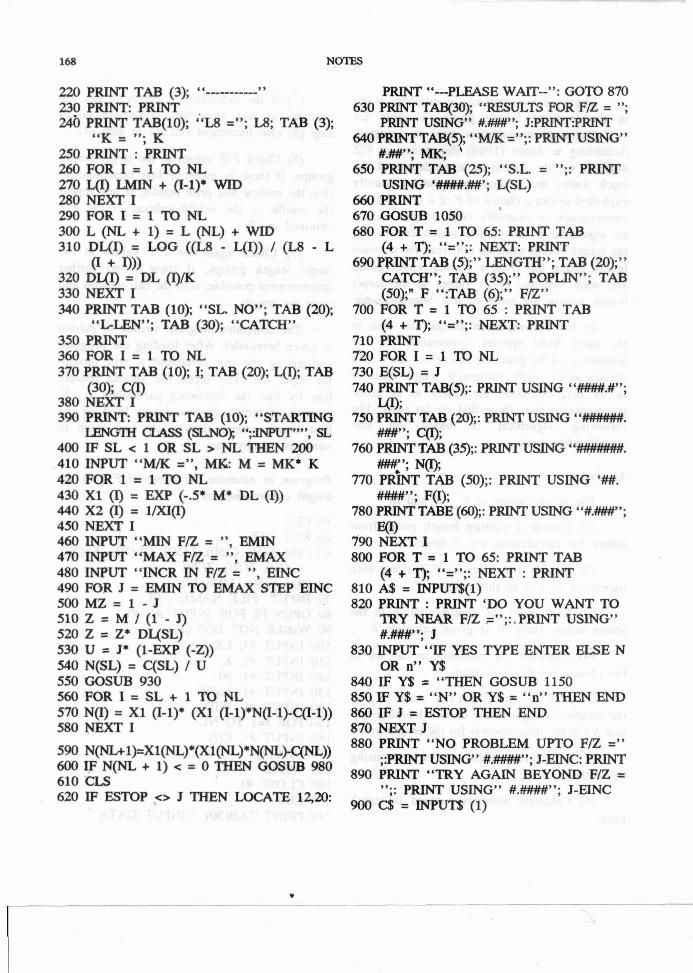
220 PRINT TAB (3); "--------- 9 9
230 PRINT: PRINT 24b PRINT TAB(10); "L.8 ="; L8; TAB (3);
"K = "; K 250 PRINT : PRINT 260 FOR I = 1 TO NL 270 yI) LMIN + (I-l)* WID 280 NEXT I 290 FOR I = 1 TO NL 300 L (NL + 1) = L (NL) + WID 310 DL(1) = LOG ((L8 - L(1)) I (L8 - L
Cr + 1))) 320 DL(1) = DL (I)/K 330 NEXT I 340 PRINT TAB (10); "SL. NO"; TAB (20);
"LLEN"; TAB (30); "CATCH" 350 PRINT 360 FOR I = 1 TO NL 370 PRINT TAB (10); I; TAB (20); YI); TAB
(30); C(I) 380 NEXT I 390 P m . PRINT TAB (10); "STARTING
LENGTH CLASS (=NO); ";:INPur"", SL 400 IF SL < 1 OR SL > NL THEN 200 410 INPUT "M/K =", ME M = MK* K 420 FOR 1 = 1 TO NL 430 X1 (I) = EXP (-.5* M* DL (I)) 440 X2 (I) = l/XI(I) 450 NEXT I 460 INPUT "MIN F E = ", EMIN 470 INPUT "MAX F E = ", EMAX 480 INPUT "INCR IN FIZ = ", EINC 490 FOR J = EMIN TO EMAX STEP EINC 5 0 0 M Z = 1 - J 510 Z = M / (1 - J) 520 Z = Z* DYSL) 530 U = J* (1-EXP (-Z)) 540 N(SL) = C(SL) I U 550 GOSUB 930 560 FOR I = SL + 1 TO NL 570 NO) = X1 (I-1)* (XI (I-l)*N(I-1)-C(I-1)) 580 NEXT I
590 N(NL+1)=X1(NL)*(X1(NL)*N(NL>C(NL)) 600 IF N(NL + 1) < = 0 THEN GOSUB 980 610 'CLS 620 IF ESTOP .<> J THEN LOCATE lZ,#):
PRINT "---PLEASE WAlT--": GOT0 870 630 PRINT TAB(30); "RESULTS FOR F/Z = ";
PRINT USING" #.###"; J:PRINT:PRTNT 640 PRINT TAB@; "MK =";: PRINT USING"
#.##"; MK, ' 650 PRINT TAB (25); "S.L. = ";: PRINT
USING '####.##'; YSL) 660 PRINT 670 GOSUB 1050 680 FOR T = 1 TO 65: PRINT TAB
(4 + T); "=";: NEXT: PRINT 690 PRINT TAB (5);" LENGTH? '; TAB (20);"
CATCH"; TAB (35);" POPLIN"; TAB (50);" F ":TAB (6);" FIZ"
700 FOR T = 1 TO 65 : PRINT TAB (4 + 7'); "=";: NEXT: PRINT
710 PRINT 720 FOR I = 1 TO NL 730 E(SL) = J 740 PRINT TAB@;: PRINT USING "####.#";
40; 750 PRINT TAB (20);: PRINT USING "####I##.
###"; cg; 760 PRINT TAB (35);: PRINT USING "#######.
q'; NO; 770 PRINT TAB (50);: PRINT USING '##.
####"; FO); 780 PRINT TABE (60);: PRINT USING "#.###";
EO 790 NEXT I 800 FOR T = 1 TO 65: PRINT TAB
(4 + T); "=";: NEXT : PRINT 810 A$ = INPUT$(l) 820 PRINT : PRINT 'DO YOU WANT TO
TRY NEAR F/Z =";: , PRINT USING #.W; J
830 INPUT "IF YES TYPE ENTER ELSE N OR n" Y$
840 IF Y$ = "THEN GOSUB 1150 850 IF Y$ = "N" OR Y$ = "n" THEN END 860 IF J = ESTOP THEN END 870 NEXT J 880 PRINT "NO PROBLEM UPTO F/Z ="
;:PRINT USING #.####"; J-EINC: PRINT 890 PRINT "TRY AGAIN BEYOND FIZ =
" ;: PRINT USING" #.###I#" ; J-EINC 900 C$ = INPUT$ (1)
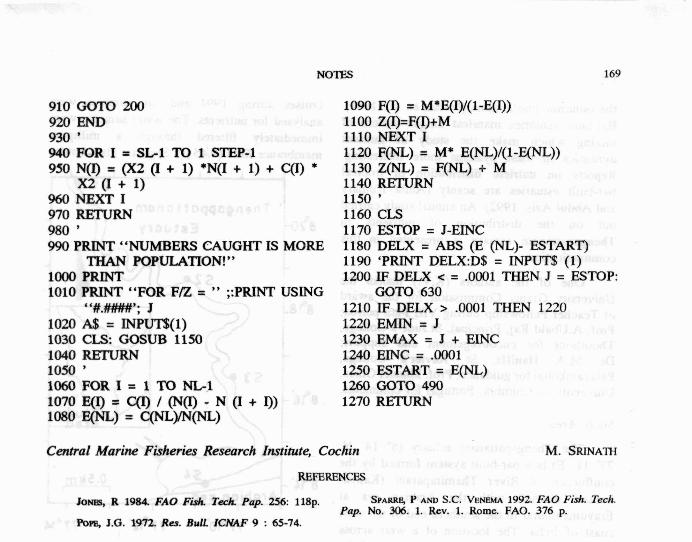
910 GOT0 200 920 END 930 ' 940 FOR I = SL1 'ID 1 STEP-1 950 N(I) = (X2 (I + 1) *N(I + 1) + C(I) *
X2 (I + 1) 960 NEXT I 970 RETURN 980 ' 990 PRINT "NUMBERS CAUGHT IS MORE
THAN POPULATION!" lo00 PRINT 1010 PRINT "FOR F E = " ;:PRINT USING
' '#.####'; J 1020 A$ = INPUT$(l) 1030 CLS: GOSUB 1150 1040 RETURN 1050 ' 1 0 6 0 F O R I = 1 T O N L - 1 1070 E(I) =: CO 1 (NO - N (I + I)) 1080 WNL) = C(NL)M(NL)
1090 F(1) = M*E(I)/(l -E(I)) 1 100 Z(I)=F(I)+M 1110 NEXT I 1120 F(NL) = M* E(NL)/(l-WNL)) 1130 Z(NL) = F(NL) + M 1140 RETURN 1150 ' 1160 CLS 1170 ESTOP = J-EINC 1180 DELX = ABS (E (NL)- ESTART) 1190 'PRINT DELX:D$ = INPUT$ (1) 1200 IF DELX < = .0001 THEN J = ESTOP:
GOTO 630 1210 IF DELX > .0001 THEN 1220 1220 EMIN = J 1230 EMAX = J + EINC 1240 EINC = .0001 1250 ESTART = E(NL) 1260 GOT0 490 1270 RETURN
Central Marine Fbheries Research Institute, Cochin
REFERENCES
Jam R 1984. FA0 Fish. Tech. Pap. 256: 118p. SPARRB, P AND S.C. VENEMA 1992. FA0 Fish. Tech. Pap. No. 306. 1. Rev. 1. Rome. FAO. 376 p.
Porn J.G. 1972. Ru. Bull. ICNAF 9 : 65-74.
DI!3TRIBUTION OF NUTRIENTS IN A BAR-BUILT ESTUARY, SOUTH' WEST COAST OF INDIA
Temporal variations of principal inorganic nutrients were monitored in Thengapattanam estuary, a bar-built system on bimonthly baais s t four selected stations (8' 14'N; 77" ll'E), during 1994. The estuary was characteriscd by the absena of tidal influence during the pre and postmonsoon seasons owing to the build up of sand bar at the mouth. Seasonal peipitation and salinity stratification apparently controlled the availability of major nutrients in the water column. Annual variations in nutrient concentrations were nitrate : 5.72-23.19 pg at N.1.-1; nitrate: 04.67 pg at N.1.-1; phosphate : 0.14-1.61 pg at P.1.-1 and silicate : 5.31-110.29 pg a% L L . ~ ' . N : P showed an annual variation between 9.21 and 41.73 with occurrence of optimum ratios (= 16) about the monsoon season.
R1E D I ~ B Z I T I O N and variability of principal elements in estuaries have great scope in plant nutrients (N, P & Si) in estuaries largely understanding the fishery potentiality of such determine the biomass and productivity of systems (Fisher et. al., 1988). Observations on phytoplankton. Detailed studies on the source, short term variations in these nutrients are sinks and turnover pattern of these inorganic found helpful in monitoring their turnover in