notes forming part of the financial statements · pdf fileprocurement of raw materials and...
TRANSCRIPT

Annual Report 2015-16 49
1.1 Basis of Accounting a) The financial statements have been prepared under the historical cost convention in accordance with the generally accepted
accounting principles in India, including the accounting standards specified under section 133 of the Companies Act 2013, read with Rule 7 of the Companies (Accounts) Rules, 2014.
b) The Company generally follows accrual system of accounting and recognizes significant items of income and expenditure on accrual basis.
c) All Assets and Liabilities have been classified as current or non-current as per the Company’s normal operating cycle and other criteria set out in the Schedule III to the Companies’ Act, 2013. Based on the nature of operations and time between the procurement of raw materials and their realization in cash and cash equivalents, the Company has ascertained its operating cycle as 12 months for the purpose of current and non-current classification of assets and liabilities.
1.2 Fixed Assets a) Fixed Assets are stated at their original cost (net of accumulated depreciation and amortization) of acquisition including all
related expenses of acquisition and installation.
b) Depreciation on tangible fixed assets is provided on straight line basis so as to charge the cost of the assets or the amount substituted for costs in case of revalued assets less its residual value over the useful life of the respective asset as prescribed under Part C of Schedule II to the Companies Act, 2013. Residual value has been considered as 5% of the cost of the respective assets.
c) Leasehold land is amortized, over the period of lease. Computer Software acquired is amortized over a period of five years on Straight Line Basis.
1.3 Inventories a) Inventories (other than scrap) are valued at lower of cost or net realizable value. The cost of inventories is computed on weighted average basis except trading goods the cost of which is calculated on first in
first out basis. Cost of inventory comprises of purchase price, cost of conversion and other directly attributable cost that have been incurred in bringing the inventories to their respective present location and condition.
b) Scrap is valued at net realisable value.
1.4 Investments Investments are either classified as current or long-term based on Management’s intention at the time of purchase. Long term
Investments are carried at cost. Provision for diminution is made to recognize a decline, other than temporary, in the value of non- current investments, script wise. Current Investments are valued at lower of cost or fair value, category wise. Cost of investments include acquisition cost such as brokerage, stamp duty etc.
1.5 Sales a) Sale of goods is recognized at the time of transfer of substantial risk and rewards of ownership to the buyer for a consideration.
b) Sales is inclusive of Excise Duty and net of Sales Tax and Trade Discount.
1.6 Employee benefits a) Short-term employee benefits are recognized as an expense at the undiscounted amount in the Statement of Profit and Loss
of the year in which the related service is rendered.
b) Post employment and other long term employee benefits are recognized as an expense in the Statement of Profit and Loss for the year in which the employee has rendered services. The expense is recognized at the present value of the amount payable determined as per actuarial valuations. Actuarial gains and losses in respect of long term employee benefits are recognized in the Statement of Profit and Loss.
1.7 Research & Development Revenue expenditure pertaining to research and development is charged to revenue in the year in which it is incurred. Capital
expenditure on research and development is shown as addition to Fixed Assets.
Notes forming part of the Financial Statements NOTE No. 1 SIGNIFICANT ACCOUNTING POLICIES FOR THE YEAR ENDED 31ST MARCH, 2016

50
1.8 Foreign Currency Transactions a) Transactions in Foreign Currency are initially recorded at the Exchange Rate at which the transactions are carried out.
b) Monetary items are translated at Exchange Rate prevailing at the year-end. Any income or expense on account of exchange difference either on settlement or on translation at the year-end is recognized
in the Statement of Profit and Loss.
c) Forward exchange contracts entered into for hedging purposes are accounted for separately from the underlying transactions. The premium or discount on forward exchange contract is amortized over the period of the respective contract.
1.9 Insurance Claims Insurance claims are recognized when the amount thereof can be reasonably ascertained and the claim is likely to be received.
1.10 Provisions, Contingent Liabilities and Contingent Assets Provisions are recognized in respect of obligations where, based on the evidence available, their existence at the Balance Sheet
date is considered probable as a result of a past event, and the Company has a present legal obligation that can be estimated reliably, and it is probable that an outflow of economic benefits will be required to settle the obligation. Provisions are measured by the best estimate of the outflow of economic benefits required to settle the obligation at the balance sheet date.
Contingent liabilities are shown by way of Notes on Account in respect of obligations where, based on the evidence available, their existence at the Balance Sheet date is considered not probable.
Provisions, contingent liabilities and contingent assets are reviewed at each balance sheet date.
Re-imbursement expected in respect of expenditure to settle a provision is recognized only when it is virtually certain that the re-imbursement will be received.
Contingent assets are neither recognized nor disclosed in the Accounts.
1.11 Taxes On Income Current tax is determined as the amount of tax payable in respect of taxable income for the year. Deferred tax is recognized, subject
to consideration of prudence in respect of deferred tax assets, on timing difference, being the difference between taxable income and accounting income that originate in one period and are capable of reversal in one or more subsequent periods. Deferred tax assets are reviewed as at each Balance Sheet date and written down or written up to reflect the amount that is reasonably/virtually certain to be realized.
The deferred tax for timing differences between the book and tax profit for the period is accounted for using the tax rates and laws that have been enacted or substantively enacted as of the balance sheet date.
1.12 Impairment Of Assets An asset is treated as impaired when the carrying cost of assets exceeds its recoverable value. An impairment loss is charged to
the Statement of Profit and Loss in the year in which an asset is identified as impaired. The impairment loss recognized in prior accounting period is reversed if there has been a change in the estimate of recoverable amount.
1.13 Cash flow statement Cash flows are reported using the indirect method, whereby profit/loss before tax is adjusted for the effects of transactions of a
non-cash nature, any deferrals or accruals of past or future operating cash receipts or payments and item of income or expenses associated with investing or financing flows. The cash flows from operating, investing and financing activities of the Company are segregated.
Notes forming part of the Financial Statements (contd.) NOTE No. 1 SIGNIFICANT ACCOUNTING POLICIES FOR THE YEAR ENDED 31ST MARCH, 2016 (CONTD.)

Annual Report 2015-16 51
Notes forming part of the Financial Statements (contd.)2 - Notes to Accounts (Amount in Rupees)
Particulars As at 31.03.2016 As at 31.03.2015
No. of Shares % of holding No. of Shares % of holdingNote No : 2.1 Share Capital
a. AuthorisedEquity shares of Rs. 10/- each 15,750,000 157,500,000 16,750,000 167,500,0009% non convertible, non cumulative redeemable Preference Shares of Rs. 100/- each 1,175,000 117,500,000 75,000 7,500,000
275,000,000 175,000,000b. Issued
Equity Shares of Rs.10/- each 11,595,350 115,953,500 11,595,350 115,953,5009% non convertible, non cumulative redeemable Preference Shares of Rs. 100/- each 500,000 50,000,000 - -
165,953,500 115,953,500 c. Subscribed and fully Paid-up
Equity shares of Rs. 10/- each 11,500,000 115,000,000 11,500,000 115,000,0009% non convertible, non cumulative redeemable Preference Shares of Rs. 100/- each 500,000 50,000,000 - -
165,000,000 115,000,000
d. The Company has only one class of equity shares having a par value of Rs. 10 per share. Each holder of equity shares is entitled to one vote per share. The holders of Equity Shares are entitled to receive dividend as declared from time to time. In the event of liquida-tion of the Company, the holders of equity shares will be entitled to receive remaining assets of the Company, after distribution of all preferential amounts. The distribution will be in proportion to the number of equity shares held by the shareholders.
e. 500,000 9% non convertible, non cumulative redeemable Preference Shares of Rs.100/- each have been issued at par during the year in lieu of extinguishment of amount due on account of principal debt of Rs. 50,000,000/-. The Preference shares shall be redeemable at par in one or more tranches as may be decided by the board of directors within 20 years from the date of allotment. The Preference shares shall not carry any voting right except in accordance with the provisions of Section 47(2) of the Companies Act, 2013.
f. Reconciliation of number and amount of equity & preference shares outstanding:
ParticularsAs at 31.03.2016 As at 31.03.2015
No. of Shares % of holding No. of Shares % of holdingi) Equity Shares
At the beginning of the year 11,500,000 115,000,000 11,500,000 115,000,000 Add: Equity shares issued during the Year - - - - At the end of the year 11,500,000 115,000,000 11,500,000 115,000,000
ii) Preference ShareAt the beginning of the year - - - -Add:Preference Shares issued during the Year 500,000 50,000,000 - - At the end of the year 500,000 50,000,000 - -
g. Shareholders holding more than 5% of the shares in the Company:
ParticularsAs at 31.03.2016 As at 31.03.2015
No. of Shares % of holding No. of Shares % of holdingi) Equity Shares
Khaitan Lefin Limited 3,583,373 31.15 3,583,373 31.15 Khaitan (India) Limited 1,708,018 14.85 1,708,018 14.85
ii) Preference SharesKhaitan Lefin Limited 500,000 100 - -

52
Notes forming part of the Financial Statements (contd.) (Amount in Rupees)
Particulars As at 31.03.2016 As at 31.03.2015Note No : 2.2 Reserves and Surplus(a ) Securities premium account
Balance as per last account 485,636,700 485,636,700 (b) Reserve against share warrants forfeited
Balance as per last account 2,620,000 2,620,000 (c) General reserve
Balance as per last account 550,000,000 550,000,000 (d) Surplus
Balance as per last account (707,343,234) (218,170,151) Add/(Less): Surplus/(Loss) as per Statement of Profit and Loss (946,119,253) (489,173,083)
Amount available for appropriation (1,653,462,487) (707,343,234) (Add)/Less : Appropriations : - - Balance at the end of the year (1,653,462,487) (707,343,234) (615,205,787) 330,913,466
Note : General reserve is a free reserve and can be utilised for any general purpose like for issue of bonus shares, payment of dividend, buy back of shares etc.
Particulars As at 31.03.2016 As at 31.03.2015Note No : 2.3 Long - term borrowingsFrom banksSecured - Rupee loans:Term loans
Allahabad Bank 587,283,228 611,012,972 IDBI Bank 32,384 587,315,612 294,767 611,307,739
Working Capital Term LoanIDBI Bank 65,781,355 68,600,000 Indian Bank 76,006,830 80,007,469 Allahabad Bank 51,441,242 54,146,442 State Bank Of Travancore(SBT) 65,168,942 68,599,815 State Bank Of Patiala (SBOP) 28,500,000 286,898,369 29,999,997 301,353,723
Funded Interest Term LoanState Bank Of Patiala (SBOP) 21,353,467 9,825,117 Indian Bank 53,985,468 23,205,020 IDBI Bank 47,605,789 20,580,094 Allahabad Bank 37,222,113 15,565,731 State Bank Of Travancore(SBT) 49,840,209 210,007,046 22,780,116 91,956,078
From entities other than banksSecured - Rupee loan:
Loan against keyman Insurance policy 90,478,080 63,441,000 Mahindra & Mahindra Finance Ltd. 879,219 91,357,299 - 63,441,000
1,175,578,326 1,068,058,540
(Amount in Rupees)

Annual Report 2015-16 53
Notes forming part of the Financial Statements (contd.)A) Nature of securities: 1) Term Loan a) Loan from Allahabad Bank is secured by an equitable mortgage of Immovable property owned by a third party subservient
charge on the current assets and fixed assets of the Company and personal guarantee of Chairman & Managing Director of the Company.
b) Vehicle loan from IDBI Bank and Axis Bank are/were secured by hypothecation of Vehicles.
2) Working Capital Term Loan and Funded Interest Term Loan from Banks are secured as follows :- a) First charge on entire current assets of the Company both present and future on pari passu basis amongst working capital
consortium Bankers. b) Collateral security- Pari passu first charge on the entire fixed assets of the Company, both present and future, excluding -
1) The property at Noida, 2) Land & Building at the lease hold land at Kolkata, 3) Lease hold land with building at Balanagar, Hyderabad, 4) Land at Kala AMB and 5) Land at Dehradun.
c) Personal Guarantee of Chairman & Managing Director of the Company.
B) Cash Credit facilities and Term Loans ( Other than Vehicle Loans) have been restructured by the leading Banks during the Current Year.
C) The term of repayment and other details for Term Loans are given below - (Amount in Rupees)
Sl. No Name of the banks/entities Interest Rate
p.a. %
Amount outstanding as at the Balance sheet date
Period of maturity w.r.t. Balance Sheet
date
No. of Install-ments outstand-ing but not due as on 31.03.16
Amount of installments
Current# Non Current
i) Axis Bank Ltd. *
10.25% - - - - - (10.25%) (85,855) - (5 Months) (5) (17,639)
10.25% - - - - - (10.25%) (118,012) - (7 Months) (7) (17,425)
ii) IDBI Bank Ltd.
10.25% 180,944 32,384 1Yrs 2 Months 14 16,192 (10.25%) (195,404) (163,288) (2 Yrs 2 Months) (26) (16,192)
10.50% 131,478 - 6 Months 6 22,590 (10.50%) (260,591) (131,479) (1 Yrs 6 Months) (18) (22,590)
iii) Life Insurance Corporation of India **9.00% - 90,478,080 5 Years - -
(9.00%) (-) (63,441,000) (6 Years) - -
iv) Allahabad Bank
2% (FY 15-16) 30,865,000 587,283,228 5 Years 4 Months 6 15,432,500 17.25% (FY 16-17
to 21-22) 4 23,148,750
4 30,865,000 4 55,557,000 2 43,211,000
(2% FY 14-15) (-) (611,012,972) (6 Years 4 Months) (6) (15,432,500)(2% FY 15-16) (4) (23,148,750)
(17.25% FY 16-17 to 21-22) (4) (30,865,000)
(4) (55,557,000) (2) (43,211,000)
v) IDBI Bank Ltd. (WCTL)
11.50% 3,500,000 65,781,355 5 Years 4 Months 6 1,750,000 4 2,573,000 4 3,430,000 4 6,174,000 1 4,801,000 1 4,591,000
(11.50%) (-) (68,600,000) (6 Years 4 Months) (6) (1,750,000) (4) (2,573,000) (4) (3,430,000) (4) (6,174,000) (1) (4,801,000) (1) (4,591,000)

54
Notes forming part of the Financial Statements (contd.)
Sl. No Name of the banks/entities Interest Rate
p.a. %
Amount outstanding as at the Balance sheet date
Period of maturity w.r.t. Balance Sheet
date
No. of Install-ments outstand-ing but not due as on 31.03.16
Amount of installments
Current# Non Current
vi) IDBI Bank Ltd. (FITL)
12.00% 6,780,000 47,605,789 3 Years 4 Months 2 3,390,000 4 4,068,000 4 6,780,000 2 8,814,000
(12.00%) (-) (20,580,094) (4 Years 4 Months) (2) (3,390,000) (4) (4,068,000) (4) (6,780,000) (2) (8,814,000)
vii) State Bank of Patiala (WCTL)
12.00% 1,500,000 28,500,000 5 Years 4 Months 6 750,000 4 1,125,000 4 1,500,000 4 2,700,000 2 2,100,000
(12.00%) (-) (29,999,997) (6 Years 4 Months) (6) (750,000) (4) (1,125,000) (4) (1,500,000) (4) (2,700,000) (2) (2,100,000)
viii) State Bank of Patiala (FITL-1)
11.50% 2,250,000 16,202,572 3 Years 4 Months 2 1,125,000 4 1,350,000 4 2,250,000 2 2,925,000
(11.50%) (-) (7,443,261) (4 Years 4 Months) (2) (1,125,000) (4) (1,350,000) (4) (2,250,000) (2) (2,925,000)
ix) State Bank of Patiala (FITL-2)
11.50% 720,000 5,150,895 3 Years 4 Months 2 360,000 4 432,000 4 720,000 2 936,000
(11.50%) (-) (2,381,856) (4 Years 4 Months) (2) (360,000) (4) (432,000) (4) (720,000) (2) (936,000)
x) Mahindra and Mahindra Fin.Ser.Ltd12.50% 184,124 879,219 4 Years 7 Months 55 25,600
(- ) (- ) (- ) (- ) (- )
xi) Indian Bank (WCTL)
12.00% 3,960,000 76,006,830 5 Years 4 Months 6 1,980,000 4 2,970,000 4 3,960,000 4 7,128,000 2 5,544,000
(12.00%) (-) (80,007,469) (6 Years 4 Months) (6) (1,980,000) (4) (2,970,000) (4) (3,960,000) (4) (7,128,000) (2) (5,544,000)
(Amount in Rupees)

Annual Report 2015-16 55
Notes forming part of the Financial Statements (contd.)
Sl. No Name of the banks/entities Interest Rate
p.a. %
Amount outstanding as at the Balance sheet date
Period of maturity w.r.t. Balance Sheet
date
No. of Install-ments outstand-ing but not due as on 31.03.16
Amount of installments
Current# Non Current
xii) Indian Bank (FITL-1)
11.50% 5,950,000 40,784,627 3 Years 4 Months 2 2,975,000 4 3,570,000 4 5,950,000 2 7,735,000
(11.50%) (-) (17,459,421) (4 Years 4 Months) (2) (2,975,000) (4) (3,570,000) (4) (5,950,000) (2) (7,735,000)
xiii) Indian Bank (FITL-2)
11.50% 1,890,000 13,200,841 3 Years 4 Months 2 945,000 4 1,134,000 4 1,890,000 2 2,457,000
(11.50%) (-) (5,745,599) (4 Years 4 Months) (2) (945,000) (4) (1,134,000) (4) (1,890,000) (2) (2,457,000)
xiv) Allahabad Bank (WCTL)
12.00% 2,680,000 51,441,242 5 Years 4 Months 6 1,340,000 4 2,010,000 4 2,680,000 4 4,824,000 2 3,752,000
(12.00%) (-) (54,146,442) (6 Years 4 Months) (6) (1,340,000) (4) (2,010,000) (4) (2,680,000) (4) (4,824,000) (2) (3,752,000)
xv) Allahabad Bank (FITL-1)
11.50% 3,650,000 28,383,433 3 Years 4 Months 2 1,825,000 4 2,190,000 4 3,650,000 2 4,745,000
(11.50%) (-) (11,789,637) (4 Years 4 Months) (2) (1,825,000) (4) (2,190,000) (4) (3,650,000) (2) (4,745,000)
xvi) Allahabad Bank (FITL-2)
11.50% 1,270,000 8,838,680 3 Years 4 Months 2 635,000 4 762,000 4 1,270,000 2 1,651,000
(11.50%) (-) (3,776,094) (4 Years 4 Months) (2) (635,000) (4) (762,000) (4) (1,270,000) (2) (1,651,000)
xvii) State Bank of Travancore (WCTL)
12.00% 3,430,000 65,168,942 5 Years 4 Months 6 1,715,000 4 2,573,000 4 3,430,000 4 6,174,000 2 4,801,000
(12.00%) (-) (68,599,815) (6 Years 4 Months) (6) (1,715,000) (4) (2,573,000) (4) (3,430,000)
(Amount in Rupees)

56
Notes forming part of the Financial Statements (contd.)
Sl. No Name of the banks/entities Interest Rate
p.a. %
Amount outstanding as at the Balance sheet date
Period of maturity w.r.t. Balance Sheet
date
No. of Install-ments outstand-ing but not due as on 31.03.16
Amount of installments
Current# Non Current
(4) (6,174,000) (2) (4,801,000)
xviii) State Bank of Travancore (FITL-1)
11.50% 5,100,000 37,770,626 3 Years 4 Months 2 2,550,000 4 3,090,000 4 5,150,000 2 6,720,000
(11.50%) (-) (17,255,760) (4 Years 4 Months) (2) (2,550,000) (4) (3,090,000) (4) (5,150,000) (2) (6,720,000)
xix) State Bank of Travancore (FITL-2)
11.50% 1,650,000 12,069,583 3 Years 4 Months 2 825,000 4 990,000 4 1,650,000 2 2,145,000
(11.50%) (-) (5,524,356) (4 Years 4 Months) (2) (825,000) (4) (990,000) (4) (1,650,000) (2) (2,145,000)
75,691,546 1,175,578,326 (659,862) (1,068,058,540)
Figures in bracket pertains to previous year $ As at the year end. # Represents current maturities of loan long term debts shown under other current liabilities (Note No. 2.6) * Amount of Installment includes interest. ** Bullet payment at the end of the maturity period.
(Amount in Rupees)Particulars As at 31.03.2016 As at 31.03.2015Note No : 2.4 Other long - term liabilitiesSecurity Deposit 1,101,920 722,343
(Amount in Rupees)
Particulars As at 31.03.2016 As at 31.03.2015Note No : 2.5 Short - term borrowingsOther loans and advancesFrom banks
Secured Cash Credit 1,652,794,515 1,648,935,707
UnsecuredBills Discounting 251,973,704 364,279,711
1,904,768,219 2,013,215,418 Unsecured From Non banking financial Institutions* 39,082,102 -
From others -Unsecured 13,500,000 74,585,885 1,957,350,321 2,087,801,303
Nature of securities:
Cash Credit from Banks are secured as follows :-
a) First charge on entire current assets of the Company, both present and future, on pari passu basis amongst working capital consortium Bankers.
(Amount in Rupees)

Annual Report 2015-16 57
Notes forming part of the Financial Statements (contd.) b) Collateral security- Pari passu first charge on the entire fixed assets of the Company, both present and future, excluding -
1) The property at Noida, 2) Land & Building at the lease hold land at Kolkata, 3) Lease hold land with building at Balanagar, Hyderabad, 4) Land at Kala AMB and 5) Land at Dehradun.
c) Personal Guarantee of Chairman & Managing Director of the Company. * Partly Secured against Land Situated at Dehradun having book value Rs. 18,267,250/-
(Amount in Rupees)
Particulars As at 31.03.2016 As at 31.03.2015Note No : 2.6 Other current liabilitiesCurrent maturities of long - term debt * 75,691,546 659,862 Interest accrued but not due on borrowings 170,630 555,438 Interest accrued and due on borrowings 88,995 14,624,104 Unpaid dividends ** 755,885 1,648,717 Other payables
Advance from customers 57,153,165 77,663,548 Security deposits 171,086,423 203,255,584 Statutory liabilities 151,528,143 111,894,768 Overdrawn bank balances as per books 473,296 1,732,815 Unpaid salaries and other payroll dues 32,477,631 24,038,880 Accrued expenses 111,415,121 74,805,093 Others 19,985,996 17,012,382
620,826,831 527,891,191
* Refer Note No. 2.3(A) & 2.3(C) for nature of securities and terms of repayment respectively. ** There is no amount due and outstanding to be credited to Investor Education & Protection Fund. (Amount in Rupees)
Particulars As at 31.03.2016 As at 31.03.2015Note No : 2.7 Short-term provisions Provision for employee benefits - Leave encashment 7,045,151 5,978,687 Provision for employee benefits - Gratuity 1,286,234 - Warranty 12,778,989 10,844,184
21,110,374 16,822,871

58
Note
No
: 2.8
FIX
ED A
SSET
S
(Am
ount
in R
upee
s)
Parti
cula
rsTa
ngib
le a
sset
sIn
tang
ible
ass
ets
Gra
nd to
tal
Lan
d
(Fre
e Ho
ld)
Build
ings
(F
ree
Hold
) P
lant
&
equ
ipm
ent
Fur
nitu
re &
F
ixtur
es
Vehi
cles
Offi
ce
Equ
ipm
ents
To
tal
Com
pute
r so
ftwar
e (A
cqui
red)
Gros
s bl
ock
Gros
s ca
rryin
g am
ount
as
at 0
1.04
.201
5 6
3,11
6,05
8 5
6,36
2,67
2 1
80,8
84,2
43
33,
823,
700
21,
393,
909
38,
373,
880
393
,954
,462
1
3,58
9,41
2 4
07,5
43,8
74
Addi
tions
dur
ing
the
perio
d -
204
,659
9
,941
,748
3
,012
,117
1
,586
,391
1
,576
,384
1
6,32
1,29
9 2
,697
,652
1
9,01
8,95
1
Inte
r hea
d ad
just
men
ts d
urin
g th
e pe
riod
- -
16,
630
- -
(16,
630)
- -
-
Disp
osal
s/de
duct
ions
dur
ing
the
perio
d -
422
,735
3
6,29
0,97
7 4
,045
,636
2
,505
,519
3
,861
,145
4
7,12
6,01
2 6
23,9
15
47,
749,
927
Gros
s ca
rryin
g am
ount
as
at 3
1.03
.201
6 6
3,11
6,05
8 5
6,14
4,59
6 1
54,5
51,6
44
32,
790,
181
20,
474,
781
36,
072,
489
363
,149
,749
1
5,66
3,14
9 3
78,8
12,8
98
Depr
ecia
tion
/am
ortis
atio
n
Open
ing
accu
mul
ated
dep
recia
tion
/am
ortis
atio
n -
33,
762,
127
89,
881,
061
20,
279,
211
13,
436,
168
31,
534,
135
188
,892
,702
7
,471
,200
1
96,3
63,9
02
Depr
ecia
tion
and
amor
tisat
ion
for t
he p
erio
d -
1,9
02,5
26
9,3
89,8
35
3,4
69,2
51
1,5
84,7
96
3,0
63,4
74
19,
409,
882
2,5
33,2
88
21,
943,
170
Dedu
ctio
ns/A
djus
tmen
ts d
urin
g th
e pe
riod
- 2
50,8
23
24,
675,
502
3,4
38,1
96
2,0
64,2
40
3,6
58,7
51
34,
087,
512
623
,914
3
4,71
1,42
6
Clos
ing
accu
mul
ated
dep
reci
atio
n /a
mor
tisat
ion
- 3
5,41
3,83
0 7
4,59
5,39
4 2
0,31
0,26
6 1
2,95
6,72
4 3
0,93
8,85
8 1
74,2
15,0
72
9,3
80,5
74
183
,595
,646
Net c
arry
ing
amou
nt
Net b
lock
as
at 3
1.03
.201
6 6
3,11
6,05
8 2
0,73
0,76
6 7
9,95
6,25
0 1
2,47
9,91
5 7
,518
,057
5
,133
,631
1
88,9
34,6
77
6,2
82,5
75
195
,217
,252
Prev
ious
Yea
r
Parti
cula
rsTa
ngib
le a
sset
sIn
tang
ible
ass
ets
Gra
nd to
tal
Lan
d
(Fre
e Ho
ld)
Build
ings
(F
ree
Hold
) P
lant
&
equ
ipm
ent
Fur
nitu
re &
F
ixtur
es
Vehi
cles
Offi
ce
Equ
ipm
ents
To
tal
Com
pute
r so
ftwar
e (A
cqui
red)
Gros
s bl
ock
Gros
s ca
rryin
g am
ount
as
at 0
1.04
.201
4 6
3,11
6,05
8 5
5,81
2,67
2 1
89,6
00,3
36
33,
797,
410
21,
502,
002
38,
277,
538
402
,106
,016
1
3,58
9,41
2 4
15,6
95,4
28
Addi
tions
dur
ing
the
perio
d -
550
,000
1
5,31
3,46
5 5
11,2
02
643
,404
1
,490
,356
1
8,50
8,42
7 -
18,
508,
427
Disp
osal
s/de
duct
ions
dur
ing
the
perio
d -
- 2
4,02
9,55
8 4
84,9
12
751
,497
1
,394
,014
2
6,65
9,98
1 -
26,
659,
981
Gros
s ca
rryin
g am
ount
as
at 3
1.03
.201
5 6
3,11
6,05
8 5
6,36
2,67
2 1
80,8
84,2
43
33,
823,
700
21,
393,
909
38,
373,
880
393
,954
,462
1
3,58
9,41
2 4
07,5
43,8
74
Depr
ecia
tion
/am
ortis
atio
n
Open
ing
accu
mul
ated
dep
recia
tion
/am
ortis
atio
n -
31,
786,
112
100
,107
,485
1
5,37
5,90
3 1
1,08
3,46
8 2
5,39
6,22
1 1
83,7
49,1
89
5,7
18,2
71
189
,467
,460
Depr
ecia
tion
and
amor
tisat
ion
for t
he p
erio
d -
1,9
76,0
15
10,
503,
409
5,1
85,9
83
2,9
68,8
11
7,2
01,8
61
27,
836,
079
1,7
52,9
29
29,
589,
008
Dedu
ctio
ns/A
djus
tmen
ts d
urin
g th
e pe
riod
- -
20,
729,
833
282
,675
6
16,1
11
1,0
63,9
47
22,
692,
566
- 2
2,69
2,56
6
Clos
ing
accu
mul
ated
dep
reci
atio
n /a
mor
tisat
ion
- 3
3,76
2,12
7 8
9,88
1,06
1 2
0,27
9,21
1 1
3,43
6,16
8 3
1,53
4,13
5 1
88,8
92,7
02
7,4
71,2
00
196
,363
,902
Net c
arry
ing
amou
nt
Net b
lock
as
at 3
1.03
.201
5 6
3,11
6,05
8 2
2,60
0,54
5 9
1,00
3,18
2 1
3,54
4,48
9 7
,957
,741
6
,839
,745
2
05,0
61,7
60
6,1
18,2
12
211
,179
,972
Note
s fo
rmin
g pa
rt o
f the
Fin
anci
al S
tate
men
ts (c
ontd
.)

Annual Report 2015-16 59
Notes forming part of the Financial Statements (contd.)(Amount in Rupees)
Particulars As at 31.03.2016 As at 31.03.2015
Note No : 2.9 Non-Current Investments Face Value No. of Shares Amount No. of Shares Amount
Other than trade Unquoted (At cost, fully paid up)
In equity shares of companies - Khaitan Lefin Limited 10.00 945,000 56,700,000 945,000 56,700,000 Khaitan Hotels Limited 10.00 57,000 3,420,000 75,000 4,500,000 The Oriental Mercantile Co. Limited 10.00 55,000 3,300,000 55,000 3,300,000
63,420,000 64,500,000
(Amount in Rupees)Particulars As at 31.03.2016 As at 31.03.2015Note No : 2.10 Deferred tax assets (Net)Deferred tax assets
Gratuity / Leave Encashment - 3,271,213 Provision for doubtful debts/claims - 15,435,654 Unabsorbed depreciation 11,513,882 -
11,513,882 18,706,867 Deferred tax liabilities
Depreciation 11,513,882 18,706,867 - -
(Amount in Rupees)Particulars As at 31.03.2016 As at 31.03.2015Note No : 2.11 Long - term loans and advances (Unsecured, considered good unless otherwise stated)Capital advances
Considered doubtful 9,150,940 9,150,940 Less : Provision for doubtful advances 9,150,940 - 9,150,940 -
Security deposits 18,603,762 17,170,221 Other loans and advances
Advance to suppliers and others Considered doubtful 38,854,044 23,749,760 Less : Provision for doubtful advances 38,854,044 23,749,760
- - Others-Against Rent 2,844,139 2,844,139
21,447,901 20,014,360
60
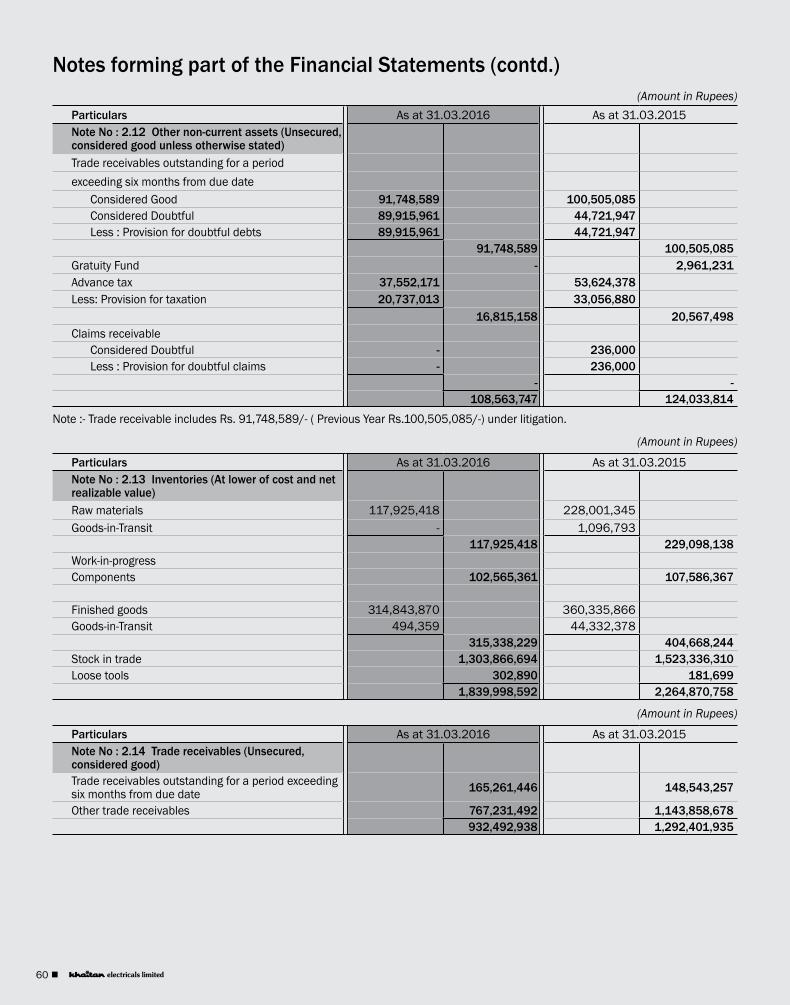
Notes forming part of the Financial Statements (contd.) (Amount in Rupees)
Particulars As at 31.03.2016 As at 31.03.2015Note No : 2.12 Other non-current assets (Unsecured, considered good unless otherwise stated)Trade receivables outstanding for a periodexceeding six months from due date
Considered Good 91,748,589 100,505,085 Considered Doubtful 89,915,961 44,721,947 Less : Provision for doubtful debts 89,915,961 44,721,947
91,748,589 100,505,085 Gratuity Fund - 2,961,231Advance tax 37,552,171 53,624,378 Less: Provision for taxation 20,737,013 33,056,880
16,815,158 20,567,498 Claims receivable
Considered Doubtful - 236,000 Less : Provision for doubtful claims - 236,000
- - 108,563,747 124,033,814
Note :- Trade receivable includes Rs. 91,748,589/- ( Previous Year Rs.100,505,085/-) under litigation.
(Amount in Rupees)
Particulars As at 31.03.2016 As at 31.03.2015Note No : 2.13 Inventories (At lower of cost and net realizable value) Raw materials 117,925,418 228,001,345 Goods-in-Transit - 1,096,793
117,925,418 229,098,138 Work-in-progress Components 102,565,361 107,586,367
Finished goods 314,843,870 360,335,866 Goods-in-Transit 494,359 44,332,378
315,338,229 404,668,244 Stock in trade 1,303,866,694 1,523,336,310 Loose tools 302,890 181,699
1,839,998,592 2,264,870,758
(Amount in Rupees)
Particulars As at 31.03.2016 As at 31.03.2015Note No : 2.14 Trade receivables (Unsecured, considered good) Trade receivables outstanding for a period exceeding six months from due date 165,261,446 148,543,257
Other trade receivables 767,231,492 1,143,858,678 932,492,938 1,292,401,935

Annual Report 2015-16 61
Notes forming part of the Financial Statements (contd.) (Amount in Rupees)
Particulars As at 31.03.2016 As at 31.03.2015Note No : 2.15 Cash and bank balancesCash and cash equivalents
Balances with banksIn current accounts 55,451,455 139,361,163 Remittance in transit 1,276,020 - Cash on hand 1,278,125 1,650,500
58,005,600 141,011,663 Other bank balances
Unpaid dividend accounts 755,885 1,648,717 Margin money (With banks against LC and bank guarantees)In Fixed deposits - Current portion Of Original Maturity period
up to 12 months 5,044,361 6,752,523
In Current Account 60,312,595 66,509,755 65,356,956 73,262,278
124,118,441 215,922,658
(Amount in Rupees)Particulars As at 31.03.2016 As at 31.03.2015Note No : 2.16 Short - term loans and advances(Unsecured, considered good)Security deposits 625,865 625,865 Other loans and advances
Loan to others 402,648,345 381,433,441 Advance to suppliers and others 349,824,110 378,556,485 Cenvat, Vat and other taxes/duties 81,079,925 63,636,414 Prepaid expenses 6,015,166 12,728,912
840,193,411 836,981,117 Note :- Advance to suppliers and others includes Rs. 112,536,621/- ( Previous Year Rs. 25,327,743/-) under litigation.
(Amount in Rupees)Particulars As at 31.03.2016 As at 31.03.2015Note No : 2.17 Other current assets(Unsecured, considered good)Interest accrued and due 196,920,023 146,818,706 Interest accrued but not due 218,438 2,126,117 Claims receivable 5,505,780 8,110,254 Other receivable 194,369 - Taxes and duties refundable 33,033 1,320,914 DEPB entitlement - 3,793,947
202,871,643 162,169,938
62
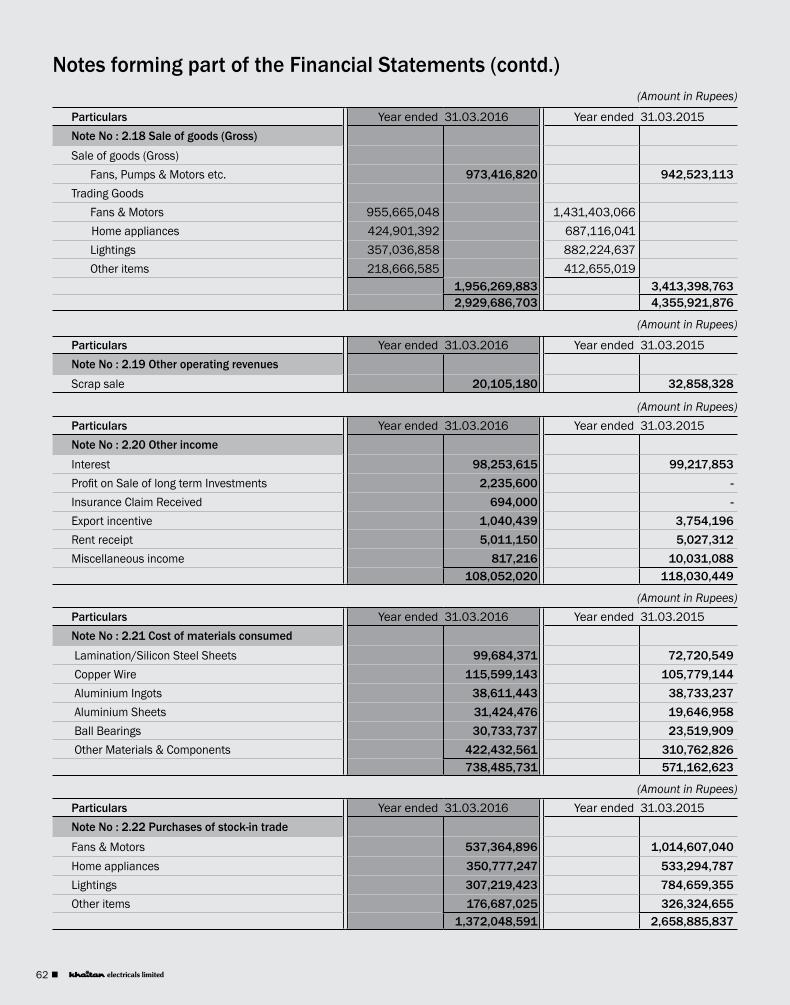
(Amount in Rupees)
Particulars Year ended 31.03.2016 Year ended 31.03.2015Note No : 2.18 Sale of goods (Gross)Sale of goods (Gross)
Fans, Pumps & Motors etc. 973,416,820 942,523,113 Trading Goods
Fans & Motors 955,665,048 1,431,403,066 Home appliances 424,901,392 687,116,041 Lightings 357,036,858 882,224,637 Other items 218,666,585 412,655,019
1,956,269,883 3,413,398,763 2,929,686,703 4,355,921,876
(Amount in Rupees)
Particulars Year ended 31.03.2016 Year ended 31.03.2015Note No : 2.19 Other operating revenuesScrap sale 20,105,180 32,858,328
(Amount in Rupees)Particulars Year ended 31.03.2016 Year ended 31.03.2015Note No : 2.20 Other incomeInterest 98,253,615 99,217,853 Profit on Sale of long term Investments 2,235,600 - Insurance Claim Received 694,000 - Export incentive 1,040,439 3,754,196 Rent receipt 5,011,150 5,027,312 Miscellaneous income 817,216 10,031,088
108,052,020 118,030,449
(Amount in Rupees)Particulars Year ended 31.03.2016 Year ended 31.03.2015Note No : 2.21 Cost of materials consumed Lamination/Silicon Steel Sheets 99,684,371 72,720,549 Copper Wire 115,599,143 105,779,144 Aluminium Ingots 38,611,443 38,733,237 Aluminium Sheets 31,424,476 19,646,958 Ball Bearings 30,733,737 23,519,909 Other Materials & Components 422,432,561 310,762,826
738,485,731 571,162,623
(Amount in Rupees)Particulars Year ended 31.03.2016 Year ended 31.03.2015Note No : 2.22 Purchases of stock-in trade
Fans & Motors 537,364,896 1,014,607,040 Home appliances 350,777,247 533,294,787 Lightings 307,219,423 784,659,355 Other items 176,687,025 326,324,655
1,372,048,591 2,658,885,837
Notes forming part of the Financial Statements (contd.)

Annual Report 2015-16 63
Notes forming part of the Financial Statements (contd.) (Amount in Rupees)
Particulars Year ended 31.03.2016 Year ended 31.03.2015Note No : 2.23 Changes in inventories of finished goods, work-in-progress and stock-in-tradeFinished goods
Opening stock 404,668,244 478,088,064 Less: Closing stock 314,843,870 404,668,244
89,824,374 73,419,820 Work-in-progressComponents
Opening stock 107,586,367 133,906,326 Less: Lost by fire 20,144,916 - Less: Closing stock 102,565,361 107,586,367
(15,123,910) 26,319,959 Stock in trade
Opening stock 1,523,336,310 1,523,180,464 Less: Closing stock 1,303,866,694 1,523,336,310
219,469,616 (155,846)Add/(Less) : Excise duty and cess on stock * 1,661,323 (2,047,183)
295,831,403 97,536,750
* The amount of excise duty and cess on stock represents differential excise duty and cess on opening and closing stock of finished goods.
(Amount in Rupees)Particulars Year ended 31.03.2016 Year ended 31.03.2015Note No : 2.24 Employee benefits expenseSalaries and wages 202,673,385 236,778,959 Contribution to provident and other funds 15,389,268 20,021,515 Staff welfare expense 6,615,259 7,407,339
224,677,912 264,207,813
(Amount in Rupees)Particulars Year ended 31.03.2016 Year ended 31.03.2015Note No : 2.25 Finance costsInterest expense 381,467,729 385,622,493 Other borrowing cost 32,276,079 31,632,958
413,743,808 417,255,451

64
Notes forming part of the Financial Statements (contd.) (Amount in Rupees)
Particulars Year ended 31.03.2016 Year ended 31.03.2015Note No : 2.26 Other expensesConsumption of stores and spare parts 5,074,817 4,071,644 Power and fuel 8,315,578 8,310,205 Fabrication charges 88,560,301 61,354,941 Royalty 30,993,839 40,739,002 Rent 35,095,945 33,856,490 Repairs
Buildings 1,522,510 1,166,014 Machineries 5,397,083 2,040,282 Others 1,534,513 2,016,435
8,454,106 5,222,731 Insurance 2,304,310 2,854,579 Rates and taxes (excluding taxes on income) 18,771,045 26,452,287 Payment to auditors
As auditor for statutory audit 560,000 560,000 For tax audit 132,000 132,000 For other services (Limited reviews &
certifications) 170,000 249,000
For reimbursement of expenses 35,930 26,014 897,930 967,014
Carriage outward 83,334,874 101,878,229 Commission 39,545,658 44,379,850 Exchange rate fluctuation - 2,027,814 Travelling & Conveyance 38,440,297 47,452,098 Advertisement & Publicity 56,302,745 47,169,664 Discount & Scheme Expenses 170,998,933 254,203,244 Sundry Balances Written off 13,252,189 18,203,457 After Sales Service Expenses 50,102,959 57,689,997 Provision for doubtful debts / advances 55,933,207 22,609,260 Loss on Sale/Discard of Fixed Assets 11,331,066 2,533,368 Miscellaneous Expenses 69,851,889 79,832,606 Prior period Expenses * - 209,184
787,561,688 862,017,663 * Include :
Interest Paid - 60,936 Professional Fees - 8,000 Discount/Schemes - 140,248
- 209,184
(Amount in Rupees)Particulars Year ended 31.03.2016 Year ended 31.03.2015Note No : 2.27 Extraordinary ItemsLoss due to Fire (Gross) 34,426,885 - Less: Insurance Claim Received (Adhoc) (8,494,738) -
25,932,147 -
Note: A fire accident accrued in the Hyderabad Factory on 10 May, 2015 resulting in the aforesaid loss.

Annual Report 2015-16 65
Notes forming part of the Financial Statements (contd.)
(Amount in Rupees)Particulars As at 31.03.2016 As at 31.03.2015Note No : 2.28 Contingent Liabilities not provided for in respect of :
a) Claims against the Company not acknowledged as debts :- i) Central Excise Duty/Service Tax under appeal Amount deposited against above
35,280,370(2,30,112)
35,280,370(2,30,112)
ii) Sales Tax/Entry Tax under appeal Amount deposited against above
113,585,916 (26,341,144)
144,692,213 (24,857,679)
iii) Income Tax Amount deposited against above
1,17,14,760(-)
-(-)
iv) Employees State Insurance Amount deposited against above
711,216(33,033)
711,216(33,033)
v) Extension Fee by Administrator of Haryana Urban Development Authority under appeal 7,103,310 7,103,310
vi) Letter of Credit under dispute 14,478,200 13,697,200
b) The Company has entered into a sub-lease Agreement on 19/10/1985 for Kolkata Factory premises with M/s P. C. Shyam & Co., the lessee, with the consent of Kolkata Port Trust (KPT), the lessor. The lease which expired in April, 1987 is yet to be renewed by the lessor. The amount of liability not provided in this respect, if any, is presently not ascertainable.
The amounts shown in (a) above represent the best possible estimates arrived at on the basis of available information. The uncertainties and timing of the cash flows are dependent on the outcome of the different legal processes which have been invoked by the Company or the claimants as the case may be and therefore cannot be estimated accurately. The Company does not expect any reimbursement in respect of above contingent liabilities.
In the opinion of the management, no provision is considered necessary for the disputes mentioned above on the grounds that there are fair chances of successful outcome of appeals.
2.29 Commitments: Capital contracts remaining to be executed and not provided is NIL (Previous year Rs. NIL) against which an advance of NIL (Previous year Rs. NIL) is paid.
2.30 Balances outstanding with certain Debtors and Creditors are subject to confirmation.2.31 Provisions, Contingent Liabilities and Contingent Assets as per AS-29 : a. Movement in provision for warranty claims : (Amount in Rupees)
Particulars 2015-16 2014-15Opening Balance 10,884,184 9,015,354Provided during the year 19,34,805 1,828,830Reversed during the year - -Closing Balance 12,778,989 10,844,184Timing of outflow/uncertainties Outflow on repairing/replacement of fans
b. The future cash outflow in respect of above provision is dependent upon fans sent by customers for replacement etc. The Company does not expect any reimbursement in respect of the above provisions.
2.32 The Company operates predominantly only in one business segment, viz, Electrical Goods, which is the Primary Segment. Therefore, Segment Reporting under AS-17 is not applicable.

66
Notes forming part of the Financial Statements (contd.)2.33 Related Party Disclosure (as identified by the Management) as per Accounting Standard 18 are given below: (i) Details of transactions with Related Parties: (Amount in Rupees)
Nature of Transactions Key Management Personnel (KMP)
Relatives of Key ManagementPersonnel (R)
Other related Parties (ORP) TOTAL
Receiving of Service (Inclusive of Remuneration)
3,837,311 (8,478,857)
366,000 (890,400)
-(-)
4,203,311 (9,369,257)
Rent Receipt -(-)
-(-)
622,500(331,920)
622,500(331,920)
Purchase of Goods -(-)
-(-)
15,605,360(24,671,863)
15,605,360(24,671,863)
Job Charges paid -(-)
-(-)
2,786,096(-)
2,786,096(-)
(ii) Names of related parties, description of relationship and outstanding as on 31st March, 2016: (Amount in Rupees)
Related Party Relationship Balance as at 31st March 2016
Balance as at 31st March 2015
A. Key Management Personnel & Relatives:
Sri Sunil K.Khaitan (KMP) Chairman & Managing Director (CMD) - -
Sri Sajjan Dabriwal (KMP) Dy. Managing Director (DMD) 410,190 Cr 174,590 CrSmt. Sarita Dabriwal (R) Wife of DMD, Sri Sajjan Dabriwal - -Kum. Vageesha Khaitan (R) Daughter of CMD, Sri Sunil K Khaitan - -Sri Sunay Khaitan (R) Son of CMD, Sri Sunil K Khaitan - -
B. S.Y.S. Investments & Realty Ltd. (O) Concern in which, DMD, Sri Sajjan Dabriwal, has significant influence 1,678,005 Cr 2,485,499 Cr
(iii) The Significant transactions during the year with related parties are as under: (Amount in Rupees)
Related Party Particulars 2015-16 2014-15a) Sri Sunil K Khaitan (KMP) (Remuneration) 4,862,628 5,008,250
b) Sri Sajjan Dabriwal (KMP) (Remuneration) 3,471,311 3,470,607
c) Smt. Sarita Dabriwal (R) (Remuneration) 366,000 366,000d) Sri Sunay Khaitan (R) (Remuneration) 300,100 -
e) Kum. Vageesha Khaitan (R) (Remuneration) 621,780 524,400
f) S.Y.S. Investments & Realty Ltd. (O)Rent Receipt 622,500 331,920Purchase of Goods 1,56,05,360 24,671,863Job Charges paid 27,86,096 -
(iv) Notes : a) Figures in the brackets pertain to previous year. b) The Company has neither written off nor written back any amount recoverable/payable from / to any related party during
the year. c) The amount due from related parties are good and hence no provision for doubtful debts in respect of dues from such re-
lated parties is required. d) The transactions with related parties have been entered at an amount which are not materially different from those on
normal commercial terms.
2.34 Disclosure under clause 32 of the listing agreement: There are no transactions (except related party transactions) which are required to be disclosed under clause 32 of the listing
agreement with the stock exchanges where the equity shares of the Company are listed.

Annual Report 2015-16 67
Notes forming part of the Financial Statements (contd.)2.35 Earnings Per Share – The numerator and denominator used to calculate Basic/Diluted Earnings per share: (Amount in Rupees)
Particulars 2015-2016 2014-2015i) Profit/(Loss) After Tax available for Shareholders (Amount used as the numerator (946,119,253) (489,173,083)ii) Basic/Weighted Average number of Equity Shares used as the denominator 11,500,000 11,500,000iii) Nominal Value of Equity Shares 10 10iv) Basic/Diluted Earnings per Share (82.27) (42.54)
2.36 As per Accounting Standard – 15 “Employee Benefits “, the disclosure of Employee Benefits as defined in the Accounting Standard are as follows:
Defined Contribution Plan: Employee benefits in the form of Provident Fund, Employee State Insurance Scheme and Labour Welfare Fund are considered
as defined contribution plan and the contributions are made in accordance with the relevant statute and are recognized as an expense when employees have rendered service entitling them to the contributions. The contribution to defined contribution plan, recognized as expense in the Statement of Profit and Loss for the year are as under:
(Amount in Rupees)
Defined Contribution Plan 2015-2016 2014-2015Employers’ Contribution to Provident Fund 8,889,259 11,011,957 Employers’ Contribution to Employee State Insurance Scheme 747,902 1,023,794Employers’ Contribution to Labour Welfare Fund 15,632 16,344
Defined Benefit Plan: Post employment and other long-term employee benefits in the form of gratuity and leave encashment are considered as defined
benefit obligation. The present value of obligation is determined based on actuarial valuation using projected unit credit method as at the Balance Sheet date. The amount of defined benefits recognized in the balance sheet represent the present value of the obligation as adjusted for unrecognized past service cost, and as reduced by the fair value of plan assets.
Any asset resulting from this calculation is limited to the discounted value of any economic benefits available in the form of refunds from the plan or reductions in future contributions to the plan. The amount recognized in the Statement of Profit and Loss for the year ended 31st March, 2016 in respect of Employees Benefit Schemes based on actuarial reports as on 31st March, 2016 is as follows:
(Amount in Rupees)
I. Components of Employer Expense: Gratuity(Funded)
LeaveEncashment (Funded)
2015-16 2014-15 2015-16 2014-151. Current Service Cost 1,969,688 2,435,363 1,837,828 2,595,5902 Interest Cost 1,315,601 1,359,542 936,483 888,8663 Expected Return on Plan Assets (1,458,108) (1,617,960) (371,987) (359,121)4. Actuarial (gain)/loss recognized in the year 3,851,054 (502,246) 202,412 1,838,102 5. Net expense recognized in Statement of Profit and Loss 5,678,235 1,674,699 2,604,736 4,963,437
(Amount in Rupees)
II. Change in Present Value of Defined Benefit Obligation:Gratuity(Funded)
LeaveEncashment (Funded)
2015-16 2014-15 2015-16 2014-15
1. Present Value of Defined Benefit Obligation at the Beginning of the year 16,445,011 25,974,994 11,706,044 12,039,590
2. Interest Cost 1,315,601 1,359,542 936,483 888,8663. Current Service Cost 1,969,688 2,435,363 1,837,828 2,595,5904. Benefits Paid (4,173,877) (12,822,642) (3,014,456) (5,656,104)5. Actuarial (Gain ) / Losses 3,851,054 (502,246) 202,412 1,838,102 6 Present Value of Obligation at the End of the year 19,407,477 16,445,011 11,668,311 11,706,044

68
(Amount in Rupees)
III. Change in Fair Value of Plan Assets during the year ended 31st March, 2016:
Gratuity(Funded)
LeaveEncashment (Funded)
2015-16 2014-15 2015-16 2014-151. Plan Assets at the Beginning of the year 18,404,250 28,566,104 4,307,488 6,592,179 2. Expected Return on Plan Assets 1,458,108 2,231,765 371,987 537,0743. Actual Company Contribution 2,432,762 1,431,015 2,958,141 4,254,208 4. Actual Benefits Paid (4,173,877) (12,822,642) (3,014,456) (5,656,104)5. Plan Assets at the End of the year 18,121,243 19,406,242 4,623,160 5,727,357
(Amount in Rupees)
IV. Net Asset/(Liability) recognized in the Balance Sheet as at 31st March, 2016:
Gratuity(Funded)
LeaveEncashment (Funded)
2015-16 2014-15 2015-16 2014-151. Present value of Defined Benefit Obligation 19,407,477 16,445,011 11,668,311 11,706,0442. Fair Value on Plan Assets 18,121,243 19,406,242 4,623,160 5,727,357 3. Funded Status (Surplus) / deficit) 12,86,234 (2,961,231) 70,45,151 5,978,687 4. Net (Asset) / Liability recognized in Balance Sheet 12,86,234 (2,961,231) 70,45,151 5,978,687
(Amount in Rupees)
V. Actuarial Assumptions Gratuity(Funded)
LeaveEncashment (Funded)
2015-16 2014-15 2015-16 2014-151. Discount Rate (per annum) 8% 8% 8% 8%2. Salary Increases 5% 5% 5% 5%3. Retirement/ Superannuation Age 58 58 58 58
VI. Major Category of Plan Assets as a % of the Total Plan Assets as at 31st March, 2016:
Gratuity(Funded)
LeaveEncashment (Funded)
2015-16 2014-15 2015-16 2014-151. Administered by Life Insurance Corporation of India 100% 100% 100% 100%
VII. Basis of estimates of rate of escalation in salary The estimates of rate of escalation in salary considered in actuarial valuation, taking into account inflation, seniority, promotion
and other relevant factors including supply and demand in the employment market. The above information is certified by the actuary.
The Gratuity Expenses & Leave Encashment have been recognized in “Salaries, Wages, Bonus, etc. ” under Note No. 2.24
(Amount in Rupees)
VIII. Relevant information relating to:Gratuity (Funded) Leave Encashment (Funded)
2013-14 2012-13 2011-12 2013-14 2012-13 2011-121. Present value of Obligation 25,974,994 26,324,082 26,767,229 12,039,590 13,302,503 13,486,1762. Fair Value of Plan Assets 28,566,104 31,155,743 30,212,605 65,92,179 8,451,950 8,796,6353. Surplus / (Deficit) in the Plan 25,91,110 4,831,661 3,445,376 (54,47,411) (4,850,553) (4,689,541)
IX. Other disclosures: The following disclosures as required by AS-15 could not be made as the relevant information is not available in the actuarial
valuation report. : (i) Expected Employer’s contribution for next year (ii) Experience adjustments of plan assets Gain/(Loss), and (iii) Experience adjustments of Obligation Gain/(Loss)

Annual Report 2015-16 69
Notes forming part of the Financial Statements (contd.)2.37 The Company has not received any memorandum (as required to be filed by the suppliers with the notified authority under the Micro,
Small & Medium Enterprises Development Act, 2006) claiming their status as on 31.03.2016 as micro and small enterprises. Consequently, the amount paid/payable to these parties as on 31.03.2016 is NIL (Previous Year Rs. NIL).
2.38 The Company’s net worth has eroded. However, the Management believes that the Company will be able to generate sufficient resources to be able to continue as a going concern. Accordingly, these financial statements have been prepared under the going concern assumption and that no adjustments are required to the carrying value of assets and liabilities.
2.39 The Company has charged depreciation in previous year based on the revised remaining life of the assets as per the requirement of Schedule II to the Companies Act, 2013 effective 1st April, 2014.
2.40 Details of Loans given, investments made and guarantee given covered under section 186 (4) of the Companies Act, 2013:
a. Details of Loans given: (Amount in Rupees)
Particulars Balance Outstanding as at 31st March, 2016
Balance Outstanding as at 31st March, 2015
1. Century Vision Pvt. Ltd. 11,671,130 11,671,1302. Beekey Steel Industries Ltd. 2,500,000 2,500,0003. Emami Frank Rose Ltd. 32,000,000 32,000,0004. The Oriental Mercantile Co. Ltd. 256,523,623 231,323,6235. Subham Fan Pvt. Ltd. 5,299,803 5,299,8036. Spring Field Projects Pvt. Ltd. 33,150,000 33,150,0007. Subham Enterprises Pvt. Ltd. 2,500,000 2,500,0008. Neo Carbon Limited 3,014,904 10,000,0009. Khaitan (India) Limited 42,603,413 42,603,41310. Khaitan Lamps Limited 10,385,472 10,385,47211. Chitra Estate & Credit Pvt Ltd 1,500,000 -12. Samta Impex Pvt Ltd 1,500,000 -
Total 402,648,345 381,433,441
The above loans are to be utilized for general corporate purpose by the recipients. b. Details of Investment made The relevant details are given in Note no. 2.9. c. Details of Guarantee Given The Company has not given any Guarantee.
2.41 Consumption of materials :
Particulars2015-16 2014-15
Rs. % Rs. %a. Raw Materials
Imported - - - -Indigenous 738,485,731 100 571,162,623 100
738,485,731 100 571,162,623 100
b. Consumable Stores & Tools Imported - - - -Indigenous 5,074,817 100 4,071,644 100
5,074,817 100 4,071,644 100

70
2.42 Value of Imports calculated on C.I.F. Basis : (Amount in Rupees)
Particulars 2015-2016 2014-2015Finished Goods - 89,251,497
2.43 Expenditure in Foreign Currency (Amount in Rupees)
Particulars 2015-2016 2014-2015Travelling Expenses 40,900 291,361
2.44 Earning in Foreign Exchange : (Amount in Rupees)
Particulars 2015-2016 2014-2015FOB Value of Exports 41,776,360 48,045,450
2.45 The previous year’s figures have been reworked, regrouped, rearranged and reclassified wherever necessary. Amounts and other disclosures for the preceding year are included as an integral part of the current year financial statements and are to be read in relation to the amounts and other disclosures relating to the current year.
Signatories to Notes on Financial Statement for the year ended 31st March, 2016:
Notes forming part of the Financial Statements (contd.)
For V.S. Rao & Co. Chartered Accountants F. R. No. 003157S
For G.P. Agrawal & Co. Chartered Accountants F. R. No. 302082E
Sunil K. Khaitan Chairman & Managing Director Din No. 00127698
Shiv Kumar Bajaj Director Din No. 02000612
Madan Gopal Todi DirectorDin No. 00112568
Ajay Kumar Kajaria Director Din No. 00302009
CA. V.G. Tarak Nath Partner Membership No. 023302
CA. Rakesh Kumar Singh Partner Membership No. 066421
Vinod Kumar Rungta Director Din No. 00087032
Sajjan Dabriwal Director Din No. 00215294
Anjana Sharma Director Din No. 07128630
Swapan Kumar Das Chief Financial Officer
Place: Kolkata Date: 28th May, 2016
Debika Chatterjee Company Secretary