notes to the accounts accounts - standard · pdf filenotes to the accounts accounts 93 1. ......
TRANSCRIPT

www.standardchartered.com
Fin
an
cia
l S
tate
men
ts a
nd
No
tes t
o t
he A
cco
un
tsNotes to the Accounts
93
1. Accounting Policies
Statement of compliance
The Group financial statements consolidate those of the
Company and its subsidiaries (together referred to as the
‘Group’), equity account the Group’s interest in associates and
proportionately consolidate interests in jointly controlled entities.
The parent company financial statements present information
about the Company as a separate entity and not about its group.
Both the parent company financial statements and the Group
financial statements have been prepared and approved by the
directors in accordance with International Financial Reporting
Standards (‘IFRS’) and International Financial Reporting
Interpretation Committee (‘IFRIC’) Interpretations as adopted
by the EU (together ‘adopted IFRS’). In publishing the parent
company financial statements together with the Group financial
statements, the Company has taken advantage of the exemption
in section 230 of the Companies Act 1985 not to present its
individual income statement and related notes that form a part
of these approved financial statements.
The Group has retrospectively adopted IFRIC 7 ‘Applying the
Restatement Approach under IAS 29 Financial Reporting in
Hyperinflationary Economies’, IFRIC 8 ‘Scope of IFRS 2’, IFRIC 9
‘Reassessment of Embedded Derivatives’ and IFRIC 10 ‘Interim
Financial Reporting and Impairment’, none of which had an
impact on the Group’s consolidated financial statements.
The Group has also adopted IFRS 7 ‘Financial Instruments:
Disclosures’ and the Amendment to IAS 1 ‘Presentation of
Financial Statements – Capital Disclosures’ and the disclosures
required are presented within the ‘Risk Review’ on pages 43 to
59 and ‘Capital’ on pages 60 to 61, except where indicated as
not audited, and the notes to the accounts.
The consolidated balance sheet at 31 December 2006 has
been restated as explained in note 51 on page 154 to reflect
the revised fair values of the assets and liabilities acquired on
the acquisitions of Union Bank and Hsinchu. Certain items in the
Group and Company cash flow statements for the year ended 31
December 2006 have been re-presented as explained in note 51.
Basis of preparation
The consolidated financial statements have been prepared under
the historical cost convention, as modified by the revaluation of
cash-settled share based payments, available-for-sale assets,
and financial assets and liabilities (including derivatives) at fair
value through profit or loss.
The preparation of financial statements in conformity with
adopted IFRS requires the use of certain critical accounting
estimates. It also requires management to exercise its judgement
in the process of applying the Group’s accounting policies.
The accounting policies set out below have been applied
consistently across the Group and to all periods presented
in these financial statements.
Consolidation
Subsidiaries Subsidiaries are all entities (including special purpose entities)
over which the Group has the power to directly or indirectly
govern the financial and operating policies, generally
accompanying a shareholding of more than one half of the voting
rights. Subsidiaries are fully consolidated from the date on which
the Group effectively obtains control. They are de-consolidated
from the date that control ceases.
The purchase method of accounting is used to account for
the acquisition of subsidiaries by the Group. The cost of an
acquisition is measured as the fair value of the assets given,
equity instruments issued and liabilities incurred or assumed
at the date of exchange, together with costs directly attributable
to the acquisition. Identifiable net assets and contingent liabilities
acquired are fair valued at the acquisition date, irrespective of
the extent of any minority interest. The excess of the cost of
acquisition over the fair value of the Group’s share of the
identifiable net assets and contingent liabilities acquired is
recorded as goodwill. If the cost of acquisition is less than the
fair value of the net assets and contingent liabilities of the
subsidiary acquired, the difference is recognised directly in the
income statement. Where the fair values of the identifiable net
assets and contingent liabilities acquired have been determined
provisionally or where contingent or deferred consideration
is payable, any adjustments arising from their subsequent
finalisation are made as of the date of acquisition and amounts
restated as appropriate.
Inter-company transactions, balances and unrealised gains
on transactions between Group companies are eliminated
in the Group accounts. Unrealised losses are also eliminated
unless the transaction provides evidence of impairment of the
asset transferred.
Associates Associates are all entities over which the Group has the ability
to significantly influence the financial and operating policies
and procedures, but not control, generally accompanying a
shareholding of between 20 per cent and 50 per cent of the
voting rights. Investments in associates are accounted for by the
equity method of accounting and are initially recognised at cost.
The Group’s investment in associates includes goodwill identified
on acquisition (net of any accumulated impairment loss).
The Group’s share of its associates’ post-acquisition profits or
losses is recognised in the income statement, and its share of
post-acquisition movements in reserves is recognised in reserves.
The cumulative post-acquisition movements are adjusted against
the carrying amount of the investment. When the Group’s share
of losses in an associate equals or exceeds its interest in the
associate, including any other unsecured receivables, the
Group does not recognise further losses, unless it has incurred
obligations or made payments on behalf of the associate.
Unrealised gains on transactions between the Group and its
associates are eliminated to the extent of the Group’s interest
in the associates. Unrealised losses are also eliminated unless
the transaction provides evidence of an impairment of the
asset transferred.
Joint ventures Interests in jointly controlled entities are recognised using
proportionate consolidation whereby the Group’s share of
the joint venture’s assets, liabilities, income and expenses
are combined line by line with similar items in the Group’s
financial statements.
Investment in subsidiaries, associates and joint ventures In the Company’s financial statements, investment in subsidiaries,
associates and joint ventures are held at cost less impairment and
dividends from pre-acquisition profits received, if any.
Standard Chartered Annual Report and Accounts 2007
Notes to the Accounts continued
94
1. Accounting Policies continued
Foreign currency translation
Both the parent company financial statements and the Group
financial statements are presented in US dollars, which is the
presentation currency of the Group and the functional and
presentation currency of the Company.
Transactions and balances Foreign currency transactions are translated into the functional
currency using the exchange rates prevailing at the dates of the
transactions. Foreign exchange gains and losses resulting from
the settlement of such transactions, and from the translation at
year-end exchange rates of monetary assets and liabilities
denominated in foreign currencies, are recognised in the income
statement. Non-monetary assets and liabilities are translated at
historical exchange rates if held at historical cost, or year-end
exchange rates if held at fair value, and the resulting foreign
exchange gains and losses are recognised in either the income
statement or shareholders’ equity depending on the treatment
of the gain or loss on the asset or liability.
Group companies The results and financial position of all the entities included in
the Group financial statements that have a functional currency
different from the presentation currency are accounted for as
follows:
• assets and liabilities for each balance sheet presented are
translated at the closing rate at the balance sheet date;
• income and expenses for each income statement are
translated at average exchange rates or at rates on the
date of the transaction where exchange rates fluctuate
significantly; and
• all resulting exchange differences arising since 1 January 2004
are recognised as a separate component of equity.
On consolidation, exchange differences arising from the
translation of the net investment in foreign entities, and of
borrowings and other currency instruments designated as hedges
of such investments, are taken to shareholders’ equity. When a
foreign operation is sold or capital repatriated they are recognised
in the income statement as part of the gain or loss on disposal.
Goodwill and fair value adjustments arising on the acquisition of
a foreign entity are treated as assets and liabilities of the foreign
entity and translated at the closing rate.
Intangible assets
Goodwill Goodwill represents the excess of the cost of an acquisition over
the fair value of the Group’s share of the identifiable net assets
and contingent liabilities of the acquired subsidiary or associate at
the date of acquisition. Goodwill on acquisitions of subsidiaries is
included in ‘Intangible assets’. Goodwill on acquisitions of
associates is included in ‘Investments in associates’. Goodwill is
assessed at each balance sheet date for impairment and carried
at cost less any accumulated impairment losses. Gains and
losses on the disposal of an entity include the carrying amount of
goodwill relating to the entity sold. Goodwill is allocated to cash-
generating units for the purpose of impairment testing.
Acquired intangibles At the date of acquisition of a subsidiary or associate, intangible
assets which are deemed separable and that arise from contractual
or other legal rights are capitalised and included within the net
identifiable assets acquired. These intangible assets are initially
measured at fair value, which reflects market expectations of the
probability that the future economic benefits embodied in the
asset will flow to the entity, and are amortised on the basis
of their expected useful lives (four to sixteen years). At each
balance sheet date, these assets are assessed for indicators
of impairment. In the event that an asset’s carrying amount is
determined to be greater than its recoverable amount, the asset
is written down immediately.
Computer software Acquired computer software licenses are capitalised on the
basis of the costs incurred to acquire and bring to use the
specific software. Costs associated with the development of
software are capitalised where it is probable that it will generate
future economic benefits in excess of its cost. Computer
software costs are amortised on the basis of expected useful
life (three to five years). Costs associated with maintaining
software are recognised as an expense as incurred. At each
balance sheet date, these assets are assessed for indicators
of impairment. In the event that an asset’s carrying amount is
determined to be greater than its recoverable amount, the asset
is written down immediately.
Property, plant and equipment
Land and buildings comprise mainly branches and offices. All
property, plant and equipment is stated at cost less accumulated
depreciation and impairment losses. Cost includes expenditure
that is directly attributable to the acquisition of the assets.
Subsequent costs are included in the asset’s carrying amount
or are recognised as a separate asset, as appropriate, only when
it is probable that future economic benefits associated with the
item will flow to the Group and the cost of the item can be
measured reliably. All other repairs and maintenance are charged
to the income statement during the financial period in which they
are incurred.
Land is not depreciated although it is subject to impairment
testing. Depreciation on other assets is calculated using the
straight-line method to allocate their cost to their residual values
over their estimated useful lives, as follows:
Buildings up to 50 years
Leasehold improvements life of lease, up to 50 years
Equipment and motor vehicles 3 to 15 years The assets’ residual values and useful lives are reviewed, and
adjusted if appropriate, at each balance sheet date. At each
balance sheet date, assets are also assessed for indicators of
impairment. In the event that an asset’s carrying amount is
determined to be greater than its recoverable amount, the
asset is written down immediately.
Gains and losses on disposals are included in the income statement.
Leases
Where a Group company is the lessee The leases entered into by the Group are primarily operating
leases. The total payments made under operating leases are
charged to the income statement on a straight-line basis over
the period of the lease.
When an operating lease is terminated before the lease period
has expired, any payment required to be made to the lessor by
way of penalty is recognised as an expense in the period in which
termination takes place.
www.standardchartered.com
Fin
an
cia
l S
tate
men
ts a
nd
No
tes t
o t
he A
cco
un
ts
95
1. Accounting Policies continued
Leases continued
Where the group is a lessee under finance leases, the leased
assets are capitalised and included in ‘Property, plant and
equipment’ with a corresponding liability to the lessor recognised
in ‘Other liabilities’. Finance charges payable are recognised over
the period of the lease based on the interest rate implicit in the
lease to give a constant periodic rate of return.
Where a Group company is the lessor When assets are held subject to a finance lease, the present
value of the lease payments is recognised as a receivable. The
difference between the gross receivable and the present value
of the receivable is recognised as unearned finance income.
Lease income is recognised over the term of the lease using
the net investment method (before tax), which reflects a
constant periodic rate of return ignoring tax cash flows.
Assets leased to customers under operating leases are included
within ‘Property, plant and equipment’ and depreciated over their
useful lives. Rental income on these leased assets is recognised
in the income statement on a straight-line basis unless another
systematic basis is more representative.
Cash and cash equivalents
For the purposes of the cash flow statement, cash and cash
equivalents comprise balances with less than three months’
maturity from the date of acquisition, including: cash and
balances at central banks (unless restricted), treasury bills and
other eligible bills, loans and advances to banks, and short-term
government securities.
Provisions
Provisions for restructuring costs and legal claims are recognised
when: the Group has a present legal or constructive obligation as
a result of past events; it is more likely than not that an outflow of
resources will be required to settle the obligation and the amount
can be reliably estimated.
Employee benefits
Pension obligations The Group operates a number of pension and other post-
retirement benefit plans around the world, including defined
contribution plans and defined benefit plans.
For defined contribution plans, the Group pays contributions to
publicly or privately administered pension plans on a mandatory,
contractual or voluntary basis, and such amounts are charged
to operating expenses. The Group has no further payment
obligations once the contributions have been paid.
For defined benefit plans, the liability recognised in the balance
sheet is the present value of the defined benefit obligation at
the balance sheet date less the fair value of plan assets. The
defined benefit obligation is calculated annually by independent
actuaries using the projected unit method. The present value
of the defined benefit obligation is determined by discounting
the estimated future cash outflows using an interest rate equal
to the yield on high-quality corporate bonds that are denominated
in the currency in which the benefits will be paid, and that have
a term to maturity approximating to the term of the related
pension liability.
Actuarial gains and losses that arise are recognised in
shareholders’ equity and presented in the statement of
recognised income and expense in the period they arise.
Past service costs are recognised immediately to the extent
that benefits are vested and are otherwise recognised over
the average period until benefits are vested on a straight-line
basis. Current service costs and any past service costs,
together with the unwinding of the discount on plan liabilities,
offset by the expected return on plan assets, are charged to
operating expenses.
Share-based compensation The Group operates equity-settled and cash-settled share-based
compensation plans. The fair value of the employee services
received in exchange for the grant of the options is recognised
as an expense.
For equity-settled awards, the total amount to be expensed over
the vesting period is determined by reference to the fair value of
the options granted, excluding the impact of any non-market
vesting conditions (for example, profitability and growth targets).
The fair value of equity instruments granted is based on market
prices, if available, at the date of grant. In the absence of market
prices, the fair value of the instruments is estimated using an
appropriate valuation technique, such as a binomial option pricing
model. Non-market vesting conditions are included in
assumptions about the number of options that are expected to
vest. At each balance sheet date, the Group revises its estimates
of the number of options that are expected to vest. It recognises
the impact of the revision of original estimates, if any, in the
income statement, and a corresponding adjustment to equity
over the remaining vesting period. For forfeitures prior to vesting
attributable to factors other than failure to satisfy market-based
performance conditions, the cumulative charge incurred is
credited to the income statement.
The proceeds received net of any directly attributable transaction
costs are credited to share capital (nominal value) and share
premium when the options are exercised.
Cash-settled awards are revalued at each balance sheet date and
a liability recognised on the balance sheet for all unpaid amounts,
with any changes in fair value charged or credited to staff costs in
the income statement.
Taxation
Deferred tax is provided in full, using the liability method, on
temporary differences arising between the tax bases of assets
and liabilities and their carrying amounts in the consolidated
financial statements. Deferred income tax is determined using tax
rates (and laws) that have been enacted or substantially enacted
as at the balance sheet date and that are expected to apply when
the related deferred income tax asset is realised or the deferred
income tax liability is settled.
Deferred tax assets are recognised where it is probable that
future taxable profit will be available against which the temporary
differences can be utilised.
Income tax payable on profits, based on the applicable tax law
in each jurisdiction, is recognised as an expense in the period in
which profits arise. The tax effects of income tax losses available
for carry forward are recognised as an asset when it is probable
that future taxable profits will be available against which these
losses can be utilised.
Current and deferred tax relating to items which are charged or
credited directly to equity, is credited or charged directly to equity
and is subsequently recognised in the income statement together
with the current or deferred gain or loss.

Standard Chartered Annual Report and Accounts 2007
Notes to the Accounts continued
96
1. Accounting Policies continued
Borrowings
Borrowings are recognised initially at fair value, being their
issue proceeds (fair value of consideration received) net of
directly attributable transaction costs incurred. Borrowings
are subsequently stated at amortised cost, with any difference
between proceeds net of directly attributable transaction
costs and the redemption value recognised in the income
statement over the period of the borrowings using the
effective interest method.
Preference shares which carry a mandatory coupon that
represents a market rate of interest at the issue date, or which are
redeemable on a specific date or at the option of the shareholder,
are classified as financial liabilities and are presented in other
borrowed funds. The dividends on these preference shares are
recognised in the income statement as interest expense on an
amortised cost basis using the effective interest method.
If the Group purchases its own debt, it is removed from the
balance sheet, and the difference between the carrying amount of
the liability and the consideration paid is included in other income.
Share capital
Incremental costs directly attributable to the issue of new shares
or options, or to the acquisition of a business, are shown in equity
as a deduction, net of tax, from the proceeds.
Dividends on ordinary shares are recognised in equity in the
period in which they are declared.
Where the Company or other members of the consolidated
Group purchases the Company’s equity share capital, the
consideration paid is deducted from the total shareholders’ equity
of the Group (but not of the Company) as treasury shares until
they are cancelled. Where such shares are subsequently sold or
reissued, any consideration received is included in shareholders’
equity of the Group (but not of the Company).
Fiduciary activities
The Group commonly acts as trustee and in other fiduciary
capacities that result in the holding or placing of assets on
behalf of individuals, trusts, retirement benefit plans and
other institutions. The assets and income arising thereon
are excluded from these financial statements, as they are
not assets of the Group.
Financial assets and liabilities (excluding derivatives)
The Group classifies its financial assets in the following
categories: financial assets held at fair value through profit or loss;
loans and receivables; held-to-maturity investments and available-
for-sale financial assets. Financial liabilities are classified as either
held at fair value through profit or loss, or at amortised cost.
Management determines the classification of its financial assets
and liabilities at initial recognition.
(a) Financial assets and liabilities held at fair value through profit or loss
This category has two sub-categories: financial assets and
liabilities held for trading, and those designated at fair value
through profit or loss at inception. A financial asset or liability
is classified as trading if acquired principally for the purpose
of selling in the short term. Derivatives are also categorised
as trading unless they are designated as hedges.
Financial assets and liabilities may be designated at fair value
through profit or loss when:
• the designation eliminates or significantly reduces a
measurement or recognition inconsistency that would
otherwise arise from measuring assets or liabilities on
a different basis; or
• a group of financial assets and/or liabilities is managed and
its performance evaluated on a fair value basis; or
• the assets or liabilities include embedded derivatives and
such derivatives are required to be recognised separately.
(b) Loans and receivables Loans and receivables are non-derivative financial assets
with fixed or determinable payments that are not quoted
in an active market.
(c) Held-to-maturity Held-to-maturity assets are non-derivative financial assets
with fixed or determinable payments and fixed maturities that
the Group’s management has the positive intention and ability to
hold to maturity. Were the Group to sell other than an insignificant
amount of held-to-maturity assets, the entire category would be
tainted and reclassified as available-for-sale.
(d) Available-for-sale Available-for-sale assets are those non-derivative financial assets
intended to be held for an indefinite period of time, which may be
sold in response to liquidity requirements or changes in interest
rates, exchange rates or equity prices.
Initial recognition Purchases and sales of financial assets and liabilities held at fair
value through profit or loss, financial assets held-to-maturity and
available-for-sale are initially recognised on trade-date (the date
on which the Group commits to purchase or sell the asset).
Loans are recognised when cash is advanced to the borrowers.
Financial assets and financial liabilities are initially recognised at
fair value plus, for those financial assets and liabilities not carried
at fair value through profit and loss, directly attributable
transaction costs. In those cases where the initially recognised
fair value is based on a valuation model that uses inputs which
are not observable in the market, the difference between the
transaction price and the valuation model is not recognised
immediately in the income statement. The difference is amortised
to the income statement until the inputs become observable,
or the transaction matures or is terminated.
Subsequent measurement Available-for-sale financial assets and financial assets and
liabilities held at fair value through profit or loss are subsequently
carried at fair value. Loans and receivables and held-to-maturity
investments are carried at amortised cost using the effective
interest method.
The fair values of quoted financial assets or financial liabilities in
active markets are based on current prices. If the market for a
financial asset or financial liability is not active, and for unlisted
securities, the Group establishes fair value by using valuation
techniques. These include the use of recent arm’s length
transactions, discounted cash flow analysis, option pricing
models and other valuation techniques commonly used by
market participants.
Renegotiated loans Loans whose original terms have been modified are considered
renegotiated loans. If the renegotiation occurs before a customer
is either past due or impaired and the revised terms are
consistent with those readily available in the market, the account
will not be considered past due. If the renegotiations are on terms
that are not consistent with those readily available on the market,
this provides objective evidence of impairment and the loan is
assessed accordingly. If the account was past due or impaired
prior to the renegotiation, the loan will remain past due until the
customer complies with the revised terms for 12 months.
www.standardchartered.com
Fin
an
cia
l S
tate
men
ts a
nd
No
tes t
o t
he A
cco
un
ts
97
1. Accounting Policies continued
Financial assets and liabilities (excluding derivatives)
continued
Derecognition Financial assets are derecognised when the rights to receive
cash flows from the financial assets have expired or where the
Group has transferred substantially all risks and rewards of
ownership. If substantially all the risks and rewards have been
neither retained nor transferred and the Group has retained
control, the assets continue to be recognised to the extent
of the Group’s continuing involvement. Financial liabilities are
derecognised when they are extinguished.
Income recognition For available-for-sale assets and financial assets and liabilities
held at amortised cost, interest income and interest expense
is recognised in the income statement using the effective
interest method.
Gains and losses arising from changes in the fair value of financial
instruments at fair value through profit or loss are included in the
income statement in the period in which they arise. Contractual
interest income and expense on financial instruments designated
at fair value through profit or loss is recognised within net interest
income. For trading financial instruments, interest income and
expense is recognised within net interest income using the
effective interest method.
Gains and losses arising from changes in the fair value of
available-for-sale financial assets, other than foreign exchange
gains and losses from monetary items, are recognised directly
in equity, until the financial asset is derecognised or impaired at
which time the cumulative gain or loss previously recognised in
equity is recognised in profit or loss.
Dividends on equity instruments are recognised in the income
statement within ‘Other income’ when the Group’s right to receive
payment is established.
Impairment of financial assets
Assets carried at amortised cost The Group assesses at each balance sheet date whether there
is objective evidence that a financial asset or group of financial
assets is impaired. A financial asset or a group of financial assets
is impaired and impairment losses are incurred if, and only if,
there is objective evidence of impairment as a result of one or
more events that occurred after the initial recognition of the asset
(a ‘loss event’), and that loss event (or events) has an impact on
the estimated future cash flows of the financial asset or group
of financial assets that can be reliably estimated.
The following factors are considered in assessing objective
evidence of impairment:
• whether the customer is more than 90 days past due;
• a customer files for bankruptcy protection (or the local
equivalent) where this would avoid or delay repayment of its
obligation;
• the Group files to have the customer declared bankrupt or files
a similar order in respect of a credit obligation;
• the Group consents to a restructuring of the obligation,
resulting in a diminished financial obligation, demonstrated by
a material forgiveness of debt or postponement of scheduled
payments;
• the Group sells a credit obligation at a material credit-related
economic loss; or
• there is observable data indicating that there is a measurable
decrease in the estimated future cash flows of a group of
financial assets, although the decrease cannot yet be identified
with specific individual financial assets.
The Group first assesses whether objective evidence of
impairment exists individually for financial assets that are
individually significant, and individually or collectively for
financial assets that are not individually significant.
If the Group determines that no objective evidence of impairment
exists for an individually assessed financial asset, whether
significant or not, it includes the asset in a group of financial
assets with similar credit risk characteristics and collectively
assesses them for impairment. Assets that are individually
assessed for impairment and for which an impairment loss is
or continues to be recognised, are not included in a collective
assessment of impairment.
If there is objective evidence that an impairment loss on a loan
and receivable or a held-to-maturity asset has been incurred, the
amount of the loss is measured as the difference between the
asset’s carrying amount and the present value of estimated future
cash flows (excluding future credit losses that have not been
incurred), discounted at the asset’s original effective interest rate.
The carrying amount of the asset is reduced through the use of
an allowance account and the amount of the loss is recognised in
the income statement. If a loan and receivable or held-to-maturity
asset has a variable interest rate, the discount rate for measuring
any impairment loss is the current effective interest rate
determined under the contract. As a practical expedient, the
Group may measure impairment on the basis of an instrument’s
fair value using an observable market price.
The calculation of the present value of the estimated future cash
flows of a collateralised financial asset reflects the cash flows
that may result from foreclosure, less costs for obtaining and
selling the collateral, whether or not foreclosure is probable. For
the purposes of a collective evaluation of impairment, financial
assets are grouped on the basis of similar credit risk
characteristics (i.e. on the basis of the Group’s grading process
which considers asset type, industry, geographic location,
collateral type, past-due status and other relevant factors). These
characteristics are relevant to the estimation of future cash flows
for groups of such assets being indicative of the debtors’ ability
to pay all amounts due according to the contractual terms of the
assets being evaluated.
Future cash flows in a group of financial assets that are
collectively evaluated for impairment are estimated on the
basis of the historical loss experience for assets with credit risk
characteristics similar to those in the group. Historical loss
experience is adjusted on the basis of current observable data
to reflect the effects of current conditions that did not affect the
period on which the historical loss experience is based, and to
remove the effects of conditions in the historical period that do
not exist currently.
To the extent a loan is irrecoverable, it is written off against the
related provision for loan impairment. Such loans are written off
after all the necessary procedures have been completed and the
amount of the loss has been determined. Subsequent recoveries
of amounts previously written off decrease the amount of the
provision for loan impairment in the income statement. If, in a
subsequent period, the amount of the impairment loss decreases
and the decrease can be related objectively to an event occurring
after the impairment was recognised (such as an improvement in
the debtor’s credit rating), the previously recognised impairment
loss is reversed by adjusting the allowance account. The amount
of the reversal is recognised in the income statement.
Standard Chartered Annual Report and Accounts 2007
Notes to the Accounts continued
98
1. Accounting Policies continued
Impairment of financial assets continued
Available-for-sale assets A significant or prolonged decline in the fair value of a security
below its cost is considered, amongst other indicators of
impairment, in determining whether an asset is impaired. If
any such evidence exists for available-for-sale financial assets,
the cumulative loss (measured as the difference between the
acquisition cost and the current fair value, less any impairment
loss on that financial asset previously recognised in the income
statement) is removed from equity and recognised in the income
statement. If, in a subsequent period, the fair value of a debt
instrument classified as available-for-sale increases and the
increase can be objectively related to an event occurring after the
impairment loss was recognised, the impairment loss is reversed
through the income statement. Impairment losses recognised in
the income statement on equity instruments are not reversed
through the income statement.
Derivative financial instruments and hedge accounting
Derivative contracts are initially recognised at fair value on the
date on which a derivative contract is entered into and are
subsequently remeasured at their fair value. Fair values may be
obtained from quoted market prices in active markets, recent
market transactions, and valuation techniques, including
discounted cash flow models and option pricing models, as
appropriate. Where the initially recognised fair value of a derivative
contract is based on a valuation model that uses inputs which are
not observable in the market, it follows the same initial recognition
accounting policy as for other financial assets and liabilities. All
derivatives are carried as assets when fair value is positive and
as liabilities when fair value is negative.
Certain derivatives embedded in other financial instruments,
such as the conversion option in a convertible bond, are treated
as separate derivatives when their economic characteristics and
risks are not closely related to those of the host contract and the
host contract is not carried at fair value through profit or loss.
These embedded derivatives are measured at fair value with
changes in fair value recognised in the income statement.
The method of recognising the resulting fair value gain or
loss depends on whether the derivative is designated as a
hedging instrument, and if so, the nature of the item being
hedged. The Group designates certain derivatives as either:
(1) hedges of the fair value of recognised assets or liabilities or
firm commitments (fair value hedge); or, (2) hedges of highly
probable future cash flows attributable to a recognised asset
or liability, or a forecasted transaction (cash flow hedge). Hedge
accounting is used for derivatives designated in this way provided
certain criteria are met.
The Group documents, at the inception of the transaction, the
relationship between hedging instruments and hedged items, as
well as its risk management objective and strategy for undertaking
various hedge transactions. The Group also documents its
assessment, both at hedge inception and on an ongoing basis,
of whether the derivatives that are used in hedging transactions
are highly effective in offsetting changes in fair values or cash
flows of hedged items.
(a) Fair value hedge Changes in the fair value of derivatives that are designated and
qualify as fair value hedges are recorded in the income statement,
together with any changes in the fair value of the hedged asset
or liability that are attributable to the hedged risk. If the hedge
no longer meets the criteria for hedge accounting, the adjustment
to the carrying amount of a hedged item for which the effective
interest method is used is amortised to profit or loss over the
period to maturity.
(b) Cash flow hedge The effective portion of changes in the fair value of derivatives
that are designated and qualify as cash flow hedges is recognised
in equity. The gain or loss relating to the ineffective portion is
recognised immediately in the income statement.
Amounts accumulated in equity are recycled to the income
statement in the periods in which the hedged item affects profit
or loss.
When a hedging instrument expires or is sold, or when a hedge
no longer meets the criteria for hedge accounting, any cumulative
gain or loss existing in equity at that time remains in equity and is
recognised when the forecast transaction is ultimately recognised
in the income statement. When a forecast transaction is no longer
expected to occur, the cumulative gain or loss that was reported
in equity is immediately transferred to the income statement.
(c) Net investment hedge Hedges of net investments in foreign operations are accounted
for similarly to cash flow hedges. Any gain or loss on the hedging
instrument relating to the effective portion of the hedge is recognised
in the translation reserve; the gain or loss relating to the ineffective
portion is recognised immediately in the income statement. Gains
and losses accumulated in equity are included in the income
statement when the foreign operation is disposed of.
Derivatives that do not qualify for hedge accounting Changes in the fair value of any derivative instrument that does
not qualify for hedge accounting are recognised immediately in
the income statement.
Offsetting financial instruments
Financial assets and liabilities are offset and the net amount
reported in the balance sheet when there is a legally enforceable
right to offset the recognised amounts and there is an intention
to settle on a net basis, or to realise the asset and settle the
liability simultaneously.
Sale and repurchase agreements
Securities sold subject to repurchase agreements (‘repos’)
remain on the balance sheet; the counterparty liability is included
in amounts due to other banks, deposits from banks, other
deposits or deposits due to customers, as appropriate. Securities
purchased under agreements to resell (‘reverse repos’) are
recorded as loans and advances to other banks or customers,
as appropriate. The difference between sale and repurchase price
is treated as interest and accrued over the life of the agreements
using the effective interest method.
Securities lent to counterparties are also retained in the financial
statements. Securities borrowed are not recognised in the
financial statements, unless these are sold to third parties, in
which case the purchase and sale are recorded with the gain
or loss included in trading income.

www.standardchartered.com
Fin
an
cia
l S
tate
men
ts a
nd
No
tes t
o t
he A
cco
un
ts
99
1. Accounting Policies continued
Interest income and expense
Interest income and expense is recognised in the income
statement using the effective interest method.
The effective interest method is a method of calculating the
amortised cost of a financial asset or a financial liability and of
allocating the interest income or interest expense over the
relevant period. The effective interest rate is the rate that
discounts estimated future cash payments or receipts through
the expected life of the financial instrument or, when appropriate,
a shorter period, to the net carrying amount of the financial asset
or financial liability. When calculating the effective interest rate, the
Group estimates cash flows considering all contractual terms of
the financial instrument (for example, prepayment options) but
does not consider future credit losses. The calculation includes all
fees and points paid or received between parties to the contract
that are an integral part of the effective interest rate, transaction
costs and all other premiums or discounts.
Where the estimates of cash flows have been revised, the
carrying amount of the financial asset or liability is adjusted
to reflect the actual and revised cash flows. The adjustment
is recognised as interest income or expense in the period in
which the revision is made.
Once a financial asset or a group of similar financial assets has
been written down as a result of an impairment loss, interest
income is recognised using the rate of interest used to discount
the future cash flows for the purpose of measuring the
impairment loss.
Fees and commissions
Fees and commissions are generally recognised on an accrual
basis when the service has been provided. Loan syndication
fees are recognised as revenue when the syndication has been
completed and the Group retained no part of the loan package
for itself, or retained a part at the same effective interest rate for
the other participants. Portfolio and other management advisory
and service fees are recognised based on the applicable service
contracts, usually on a time-apportionate basis.
Hyperinflation
Where the Group has operations in countries that experience
hyperinflation, the financial statements are restated for changes
in general purchasing power of the local currency.

Standard Chartered Annual Report and Accounts 2007
Notes to the Accounts continued
100
2. Segmental Information
The Group is organised on a worldwide basis into two main business segments: Wholesale Banking and Consumer Banking. The types
of products and services within these segments are set out in the Financial Review. The Group’s secondary reporting format comprises
geographic segments, classified by the location of the customer.
By Class of Business 2007 2006
Consumer Banking $million
WholesaleBanking$million
Corporateitems notallocated
$million Total
$million
Consumer Banking$million
Wholesale Banking $million
Corporate items not allocated
$million Total
$million
Internal income (77) 77 – – (75) 75 – –
Net interest income 4,194 2,071 – 6,265 3,545 1,783 – 5,328
Other income 1,689 3,095 18 4,802 1,214 2,065 13 3,292
Operating income 5,806 5,243 18 11,067 4,684 3,923 13 8,620
Operating expenses (3,393) (2,814) (8) (6,215) (2,641) (2,151) (4) (4,796)
Operating profit before impairment
losses and taxation 2,413 2,429 10 4,852 2,043 1,772 9 3,824
Impairment (losses)/releases on loans
and advances and other credit risk
provisions (736) (25) – (761) (721) 92 – (629)
Other impairment – (57) – (57) – (15) – (15)
Profit/(loss) from associates – – 1 1 – – (2) (2)
Profit before taxation 1,677 2,347 11 4,035 1,322 1,849 7 3,178
Total assets employed** 90,238 238,408 559* 329,205 86,902 178,688 512* 266,102
Total liabilities employed** 120,213 187,355 185* 307,753 107,165 141,474 68* 248,707
Total risk weighted assets and
contingents** 63,516 108,317 – 171,833 60,380 93,053 – 153,433
Other segment items:
Capital expenditure 418 208 – 626 209 150 – 359
Depreciation 136 46 – 182 100 35 – 135
Amortisation of intangible assets 68 95 – 163 52 81 – 133
* As required by IAS 14, tax balances are not allocated.
** Amounts have been restated as explained in note 51 on page 154. In addition, certain assets have been reallocated between Consumer Banking and Wholesale
Banking to present on a consistent basis.

www.standardchartered.com
Fin
an
cia
l S
tate
men
ts a
nd
No
tes t
o t
he A
cco
un
ts
101
2. Segmental Information continued
By Geographic Segment
The Group manages its business segments on a global basis. The operations are based in nine main geographic areas. The UK is the
home country of the parent.
2007
Asia Pacific
Hong Kong
$million Singapore
$million Malaysia$million
Korea$million
OtherAsia
Pacific$million
India$million
Middle East & Other
S Asia $million
Africa $million
Americas#
UK &Europe$million
Total$million
Internal income (81) 119 11 (58) 16 23 (15) 20 (35) –
Net interest income 1,288 182 225 1,289 1,118 608 873 444 238 6,265
Fees and commissions income, net 539 233 83 227 466 353 436 194 130 2,661
Net trading income 180 80 63 (72) 330 145 100 121 314 1,261
Other operating income 142 278 77 178 171 179 34 16 (195) 880
Operating income 2,068 892 459 1,564 2,101 1,308 1,428 795 452 11,067
Operating expenses (825) (430) (185) (1,146) (1,213) (528) (694) (468) (726) (6,215)
Operating profit/(loss) before
impairment losses and taxation 1,243 462 274 418 888 780 734 327 (274) 4,852
Impairment (losses)/releases on loans
and advances and other credit risk
provisions (50) (16) (38) (94) (318) (90) (143) (27) 15 (761)
Other impairment – – – – – – – (2) (55) (57)
Profit/(loss) from associates – – – – 2 – – – (1) 1
Profit/(loss) before taxation 1,193 446 236 324 572 690 591 298 (315) 4,035
Loans and advances to customers
– average 23,712 14,897 9,518 41,962 23,545 7,611 10,679 2,437 17,059 151,420
Net interest margins (%) 2.3 1.0 1.8 2.1 2.8 4.3 4.1 5.6 0.2 2.5
Loans and advances to customers
– period end 23,364 17,172 10,027 40,229 26,049 7,656 12,646 3,330 16,509 156,982
Loans and advances to banks
– period end 15,156 2,531 928 1,504 4,866 552 1,406 371 10,365 37,679
Total assets employed* 61,348 39,362 14,614 67,246 55,890 23,209 28,617 11,132 85,890 387,308
Total risk weighted assets and
contingents 25,330 15,008 5,324 37,167 26,024 12,377 16,104 3,927 37,524 178,785
Capital expenditure 39 131 9 53 116 138 88 45 7 626
* Total assets employed includes intra-group items of $58,662 million and excludes deferred tax assets of $559 million.
# Americas, UK & Europe was previously Americas, UK & Group Head Office. The business captured within this segment has not been changed, the title has been
revised to more appropriately describe the segment.
Standard Chartered Annual Report and Accounts 2007
Notes to the Accounts continued
102
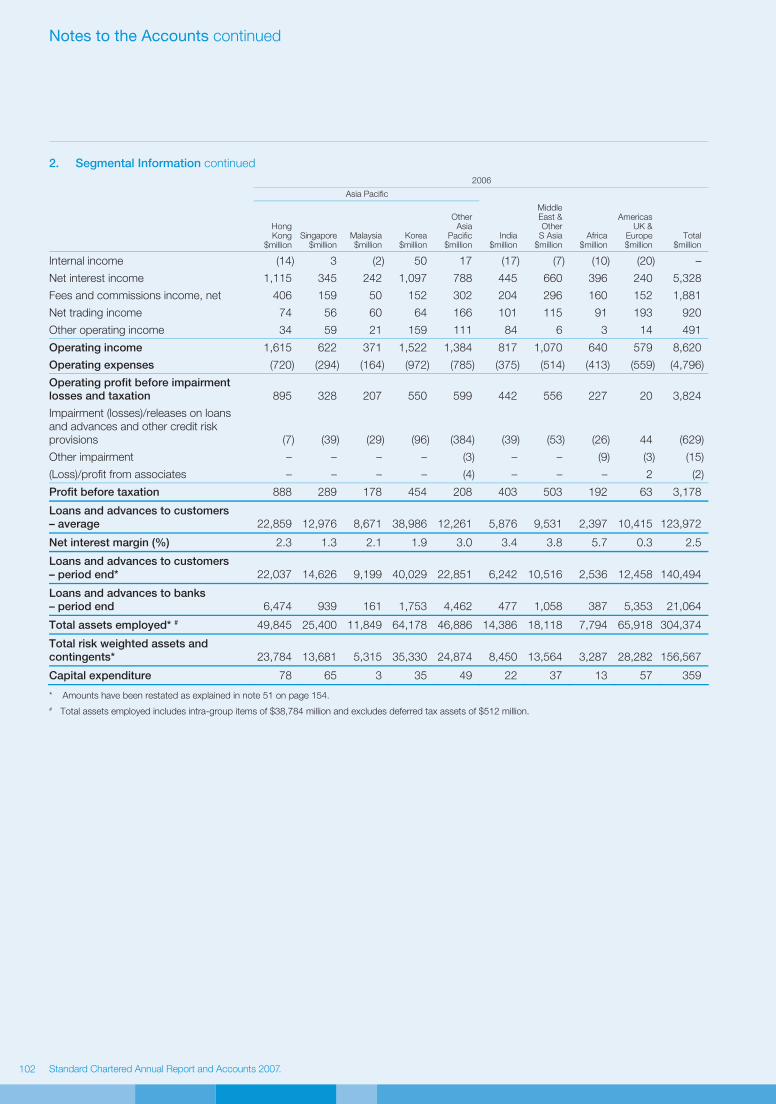
2. Segmental Information continued
2006
Asia Pacific
Hong Kong
$million Singapore
$million Malaysia$million
Korea$million
OtherAsia
Pacific$million
India$million
Middle East & Other
S Asia $million
Africa $million
Americas UK &
Europe$million
Total$million
Internal income (14) 3 (2) 50 17 (17) (7) (10) (20) –
Net interest income 1,115 345 242 1,097 788 445 660 396 240 5,328
Fees and commissions income, net 406 159 50 152 302 204 296 160 152 1,881
Net trading income 74 56 60 64 166 101 115 91 193 920
Other operating income 34 59 21 159 111 84 6 3 14 491
Operating income 1,615 622 371 1,522 1,384 817 1,070 640 579 8,620
Operating expenses (720) (294) (164) (972) (785) (375) (514) (413) (559) (4,796)
Operating profit before impairment
losses and taxation 895 328 207 550 599 442 556 227 20 3,824
Impairment (losses)/releases on loans
and advances and other credit risk
provisions (7) (39) (29) (96) (384) (39) (53) (26) 44 (629)
Other impairment – – – – (3) – – (9) (3) (15)
(Loss)/profit from associates – – – – (4) – – – 2 (2)
Profit before taxation 888 289 178 454 208 403 503 192 63 3,178
Loans and advances to customers
– average 22,859 12,976 8,671 38,986 12,261 5,876 9,531 2,397 10,415 123,972
Net interest margin (%) 2.3 1.3 2.1 1.9 3.0 3.4 3.8 5.7 0.3 2.5
Loans and advances to customers
– period end* 22,037 14,626 9,199 40,029 22,851 6,242 10,516 2,536 12,458 140,494
Loans and advances to banks
– period end 6,474 939 161 1,753 4,462 477 1,058 387 5,353 21,064
Total assets employed* # 49,845 25,400 11,849 64,178 46,886 14,386 18,118 7,794 65,918 304,374
Total risk weighted assets and
contingents* 23,784 13,681 5,315 35,330 24,874 8,450 13,564 3,287 28,282 156,567
Capital expenditure 78 65 3 35 49 22 37 13 57 359
* Amounts have been restated as explained in note 51 on page 154.
# Total assets employed includes intra-group items of $38,784 million and excludes deferred tax assets of $512 million.
www.standardchartered.com
Fin
an
cia
l S
tate
men
ts a
nd
No
tes t
o t
he A
cco
un
ts
103
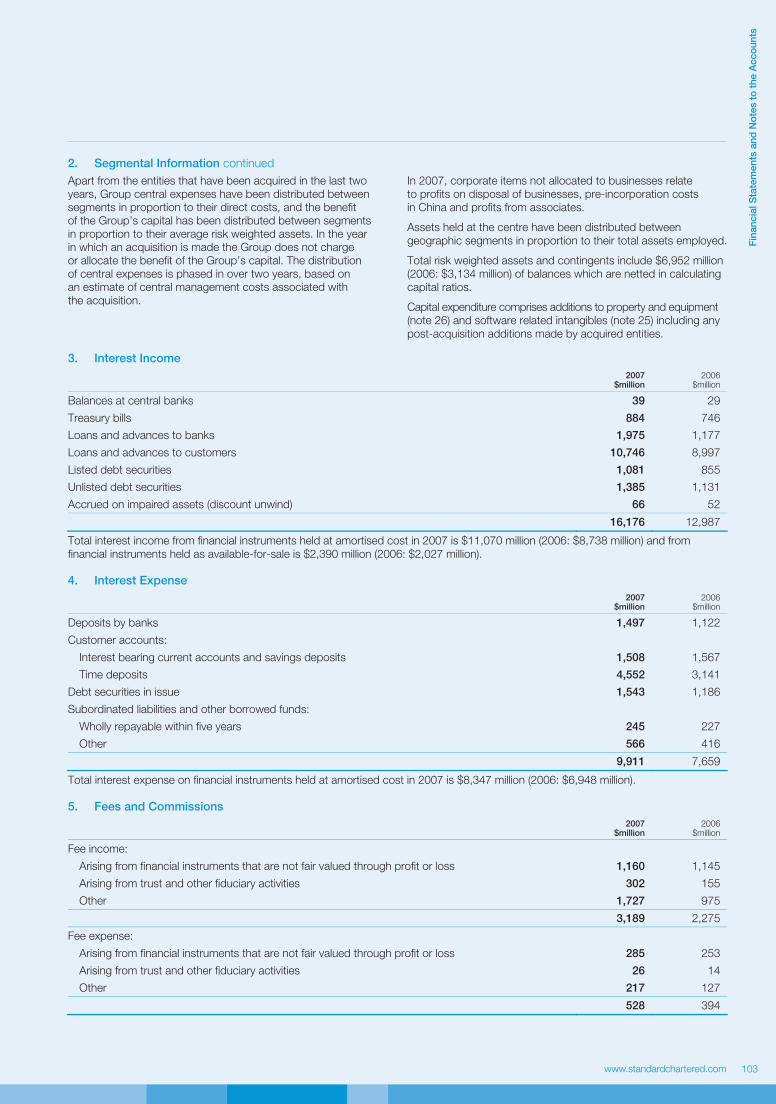
2. Segmental Information continued
Apart from the entities that have been acquired in the last two
years, Group central expenses have been distributed between
segments in proportion to their direct costs, and the benefit
of the Group’s capital has been distributed between segments
in proportion to their average risk weighted assets. In the year
in which an acquisition is made the Group does not charge
or allocate the benefit of the Group’s capital. The distribution
of central expenses is phased in over two years, based on
an estimate of central management costs associated with
the acquisition.
In 2007, corporate items not allocated to businesses relate
to profits on disposal of businesses, pre-incorporation costs
in China and profits from associates.
Assets held at the centre have been distributed between
geographic segments in proportion to their total assets employed.
Total risk weighted assets and contingents include $6,952 million
(2006: $3,134 million) of balances which are netted in calculating
capital ratios.
Capital expenditure comprises additions to property and equipment
(note 26) and software related intangibles (note 25) including any
post-acquisition additions made by acquired entities.
3. Interest Income
2007 $million
2006$million
Balances at central banks 39 29
Treasury bills 884 746
Loans and advances to banks 1,975 1,177
Loans and advances to customers 10,746 8,997
Listed debt securities 1,081 855
Unlisted debt securities 1,385 1,131
Accrued on impaired assets (discount unwind) 66 52
16,176 12,987
Total interest income from financial instruments held at amortised cost in 2007 is $11,070 million (2006: $8,738 million) and from
financial instruments held as available-for-sale is $2,390 million (2006: $2,027 million).
4. Interest Expense
2007 $million
2006$million
Deposits by banks 1,497 1,122
Customer accounts:
Interest bearing current accounts and savings deposits 1,508 1,567
Time deposits 4,552 3,141
Debt securities in issue 1,543 1,186
Subordinated liabilities and other borrowed funds:
Wholly repayable within five years 245 227
Other 566 416
9,911 7,659
Total interest expense on financial instruments held at amortised cost in 2007 is $8,347 million (2006: $6,948 million).
5. Fees and Commissions
2007 $million
2006$million
Fee income:
Arising from financial instruments that are not fair valued through profit or loss 1,160 1,145
Arising from trust and other fiduciary activities 302 155
Other 1,727 975
3,189 2,275
Fee expense:
Arising from financial instruments that are not fair valued through profit or loss 285 253
Arising from trust and other fiduciary activities 26 14
Other 217 127
528 394

Standard Chartered Annual Report and Accounts 2007
Notes to the Accounts continued
104
6. Net Trading Income
2007 $million
2006$million
Gains less losses on instruments held for trading:
Foreign currency 862 645
Trading securities 102 109
Interest rate derivatives 257 151
Credit and other derivatives 39 40
Gains less losses from fair value hedged items and hedging instruments (3) 14
Gains less losses on instruments designated at fair value:
Financial assets designated at fair value through profit or loss 44 –
Financial liabilities designated at fair value through profit or loss (37) (37)
Derivatives managed with financial instruments designated at fair value through profit or loss (3) (2)
1,261 920
7. Other Operating Income
2007 $million
2006$million
Other operating income includes:
Gains less losses on available-for-sale financial assets:
On disposal 339 185
Writedowns on asset backed securities (87) –
Gains less losses on disposal of loan and receivable financial assets 3 5
Dividend income 279 77
Gains arising on assets fair valued at acquisition 98 106
Recognition of profit on Visa shares 107 –
Income on repatriation of branch capital 109 –
Gain on effective part disposal of Pakistan branches – 17
Profit on part disposal of merchant acquiring business 15 –
Net profit on sale of businesses 3 –
8. Operating Expenses
2007 $million
2006$million
Staff costs:
Wages and salaries 2,970 2,278
Social security costs 67 74
Other pension costs (note 36) 213 166
Other staff costs 699 395
3,949 2,913
Premises and equipment expenses:
Rental of premises 259 215
Other premises and equipment costs 307 208
Rental of computers and equipment 26 21
592 444
General administrative expenses 1,329 1,171
Wages and salaries include share based payments – see note 41.
The Group employed 69,612 staff at 31 December 2007 (2006: 59,205).
The Company employed nil staff at 31 December 2007 (2006: nil) and it incurred costs of $7 million (2006: $2 million).
Directors’ emoluments
Details of directors’ pay and benefits and interests in shares are disclosed in the directors’ remuneration report on pages 73 to 85.
Transactions with directors, officers and other related parties are disclosed in the related parties note 52 on page 155.

www.standardchartered.com
Fin
an
cia
l S
tate
men
ts a
nd
No
tes t
o t
he A
cco
un
ts
105
8. Operating Expenses continued
Auditor’s remuneration
Auditor’s remuneration in relation to the Group statutory audit amounts to $4.4 million (2006: $3.3 million). The following fees were
payable by the Group to their principal auditor, KPMG Audit Plc and its associates (together ‘KPMG’):
2007 $million
2006$million
Audit fees for the Group statutory audit:
Fees relating to the current year 3.8 3.3
Fees relating to prior year 0.6 –
Fees payable to KPMG for other services provided to the Group:
Audit of Standard Chartered PLC subsidiaries, pursuant to legislation 9.7 7.6
Other services pursuant to legislation 3.0 1.6
Tax services 0.4 1.0
Services relating to information technology 0.1 0.1
Services relating to corporate finance transactions 0.8 1.4
All other services 0.3 0.2
Total fees payable 18.7 15.2
The following is a description of the type of services included within the categories listed above:
• Audit fees are in respect of fees payable to KPMG Audit Plc for the statutory audit of the consolidated financial statements of the
Group and the separate financial statements of Standard Chartered PLC. It excludes amounts payable for the audit of Standard
Chartered PLC’s subsidiaries and amounts payable to KPMG Audit Plc’s associates. These amounts have been included in ‘Fees
payable to KPMG for other services provided to the Group’.
• Other services pursuant to legislation include services for assurance and other services that are in relation to statutory and regulatory
filings, including comfort letters and interim reviews.
• Tax services include tax compliance services and tax advisory services.
• Services relating to information technology include advice on IT security and business continuity, and performing agreed upon IT
testing procedures.
• Services related to corporate finance transactions include fees payable to KPMG for transaction related work irrespective of whether
the Group is vendor or purchaser, such as acquisition due diligence and long-form reports.
• All other services include other assurance and advisory services such as translation services, ad-hoc accounting advice and review
of financial models.
Expenses incurred during the provision of services and which have been reimbursed by the Group are included within auditor’s
remuneration.
In addition to the above, KPMG estimate they have been paid fees of $0.3 million (2006: $0.2 million) by parties other than the Group
but where the Group are connected with the contracting party and therefore may be involved in appointing KPMG. These fees arise
from services such as the audit of the Group’s pension schemes.
Fees payable to KPMG for non-audit services for Standard Chartered PLC are not disclosed because such fees are disclosed on
a consolidated basis for the Group.
9. Depreciation and Amortisation
2007 $million
2006$million
Premises 78 57
Equipment 104 78
Intangibles:
Software 86 81
Acquired on business combinations 77 52
345 268
10. Other Impairment
2007
$million 2006
$million
Intangible assets 17 –
Impairment losses on available-for-sale financial assets 40 15
57 15
Impairment of intangible assets consists of the write-off of a customer relationship asset relating to Whistlejacket. Impairment losses on
available-for-sale financial assets includes $35 million (2006: $nil million) impairment on asset backed securities.
Standard Chartered Annual Report and Accounts 2007
Notes to the Accounts continued
106
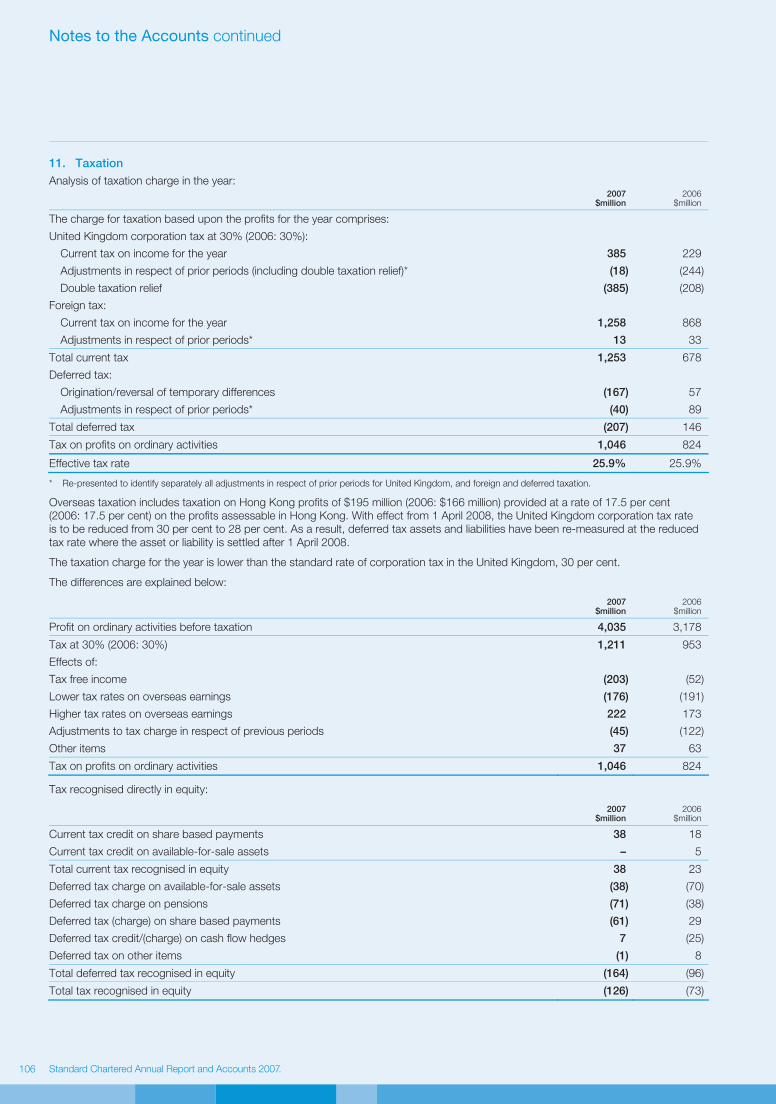
11. Taxation
Analysis of taxation charge in the year:
2007 $million
2006$million
The charge for taxation based upon the profits for the year comprises:
United Kingdom corporation tax at 30% (2006: 30%):
Current tax on income for the year 385 229
Adjustments in respect of prior periods (including double taxation relief)* (18) (244)
Double taxation relief (385) (208)
Foreign tax:
Current tax on income for the year 1,258 868
Adjustments in respect of prior periods* 13 33
Total current tax 1,253 678
Deferred tax:
Origination/reversal of temporary differences (167) 57
Adjustments in respect of prior periods* (40) 89
Total deferred tax (207) 146
Tax on profits on ordinary activities 1,046 824
Effective tax rate 25.9% 25.9%
* Re-presented to identify separately all adjustments in respect of prior periods for United Kingdom, and foreign and deferred taxation.
Overseas taxation includes taxation on Hong Kong profits of $195 million (2006: $166 million) provided at a rate of 17.5 per cent
(2006: 17.5 per cent) on the profits assessable in Hong Kong. With effect from 1 April 2008, the United Kingdom corporation tax rate
is to be reduced from 30 per cent to 28 per cent. As a result, deferred tax assets and liabilities have been re-measured at the reduced
tax rate where the asset or liability is settled after 1 April 2008.
The taxation charge for the year is lower than the standard rate of corporation tax in the United Kingdom, 30 per cent.
The differences are explained below:
2007 $million
2006$million
Profit on ordinary activities before taxation 4,035 3,178
Tax at 30% (2006: 30%) 1,211 953
Effects of:
Tax free income (203) (52)
Lower tax rates on overseas earnings (176) (191)
Higher tax rates on overseas earnings 222 173
Adjustments to tax charge in respect of previous periods (45) (122)
Other items 37 63
Tax on profits on ordinary activities 1,046 824
Tax recognised directly in equity:
2007 $million
2006$million
Current tax credit on share based payments 38 18
Current tax credit on available-for-sale assets – 5
Total current tax recognised in equity 38 23
Deferred tax charge on available-for-sale assets (38) (70)
Deferred tax charge on pensions (71) (38)
Deferred tax (charge) on share based payments (61) 29
Deferred tax credit/(charge) on cash flow hedges 7 (25)
Deferred tax on other items (1) 8
Total deferred tax recognised in equity (164) (96)
Total tax recognised in equity (126) (73)
www.standardchartered.com
Fin
an
cia
l S
tate
men
ts a
nd
No
tes t
o t
he A
cco
un
ts
107
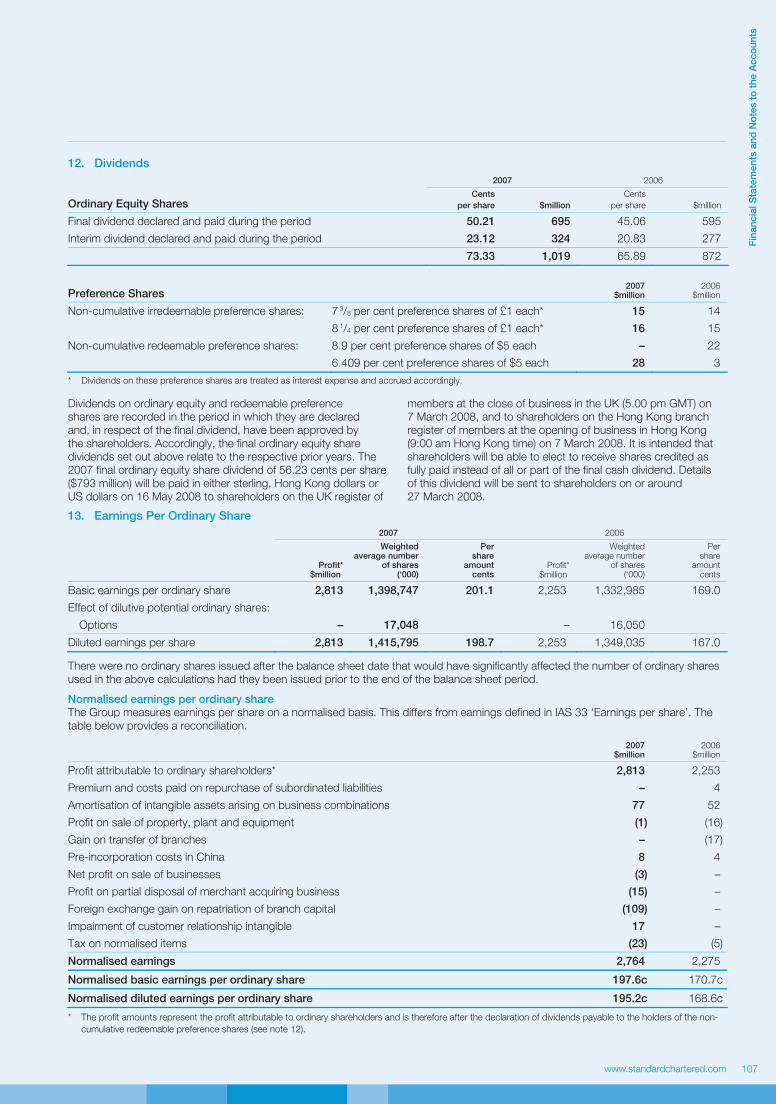
12. Dividends
2007 2006
Ordinary Equity Shares Cents
per share
$million
Cents
per share $million
Final dividend declared and paid during the period 50.21 695 45.06 595
Interim dividend declared and paid during the period 23.12 324 20.83 277
73.33 1,019 65.89 872
Preference Shares 2007
$million 2006
$million
Non-cumulative irredeemable preference shares: 7 3/8 per cent preference shares of £1 each* 15 14
8 1/4 per cent preference shares of £1 each* 16 15
Non-cumulative redeemable preference shares: 8.9 per cent preference shares of $5 each – 22
6.409 per cent preference shares of $5 each 28 3
* Dividends on these preference shares are treated as interest expense and accrued accordingly.
Dividends on ordinary equity and redeemable preference
shares are recorded in the period in which they are declared
and, in respect of the final dividend, have been approved by
the shareholders. Accordingly, the final ordinary equity share
dividends set out above relate to the respective prior years. The
2007 final ordinary equity share dividend of 56.23 cents per share
($793 million) will be paid in either sterling, Hong Kong dollars or
US dollars on 16 May 2008 to shareholders on the UK register of
members at the close of business in the UK (5.00 pm GMT) on
7 March 2008, and to shareholders on the Hong Kong branch
register of members at the opening of business in Hong Kong
(9:00 am Hong Kong time) on 7 March 2008. It is intended that
shareholders will be able to elect to receive shares credited as
fully paid instead of all or part of the final cash dividend. Details
of this dividend will be sent to shareholders on or around
27 March 2008.
13. Earnings Per Ordinary Share
2007 2006
Profit*$million
Weighted average number
of shares(‘000)
Pershare
amountcents
Profit* $million
Weighted average number
of shares (‘000)
Pershare
amountcents
Basic earnings per ordinary share 2,813 1,398,747 201.1 2,253 1,332,985 169.0
Effect of dilutive potential ordinary shares:
Options – 17,048 – 16,050
Diluted earnings per share 2,813 1,415,795 198.7 2,253 1,349,035 167.0
There were no ordinary shares issued after the balance sheet date that would have significantly affected the number of ordinary shares
used in the above calculations had they been issued prior to the end of the balance sheet period.
Normalised earnings per ordinary share
The Group measures earnings per share on a normalised basis. This differs from earnings defined in IAS 33 ‘Earnings per share’. The
table below provides a reconciliation.
2007 $million
2006$million
Profit attributable to ordinary shareholders* 2,813 2,253
Premium and costs paid on repurchase of subordinated liabilities – 4
Amortisation of intangible assets arising on business combinations 77 52
Profit on sale of property, plant and equipment (1) (16)
Gain on transfer of branches – (17)
Pre-incorporation costs in China 8 4
Net profit on sale of businesses (3) –
Profit on partial disposal of merchant acquiring business (15) –
Foreign exchange gain on repatriation of branch capital (109) –
Impairment of customer relationship intangible 17 –
Tax on normalised items (23) (5)
Normalised earnings 2,764 2,275
Normalised basic earnings per ordinary share 197.6c 170.7c
Normalised diluted earnings per ordinary share 195.2c 168.6c
* The profit amounts represent the profit attributable to ordinary shareholders and is therefore after the declaration of dividends payable to the holders of the non-
cumulative redeemable preference shares (see note 12).
Standard Chartered Annual Report and Accounts 2007
Notes to the Accounts continued
108
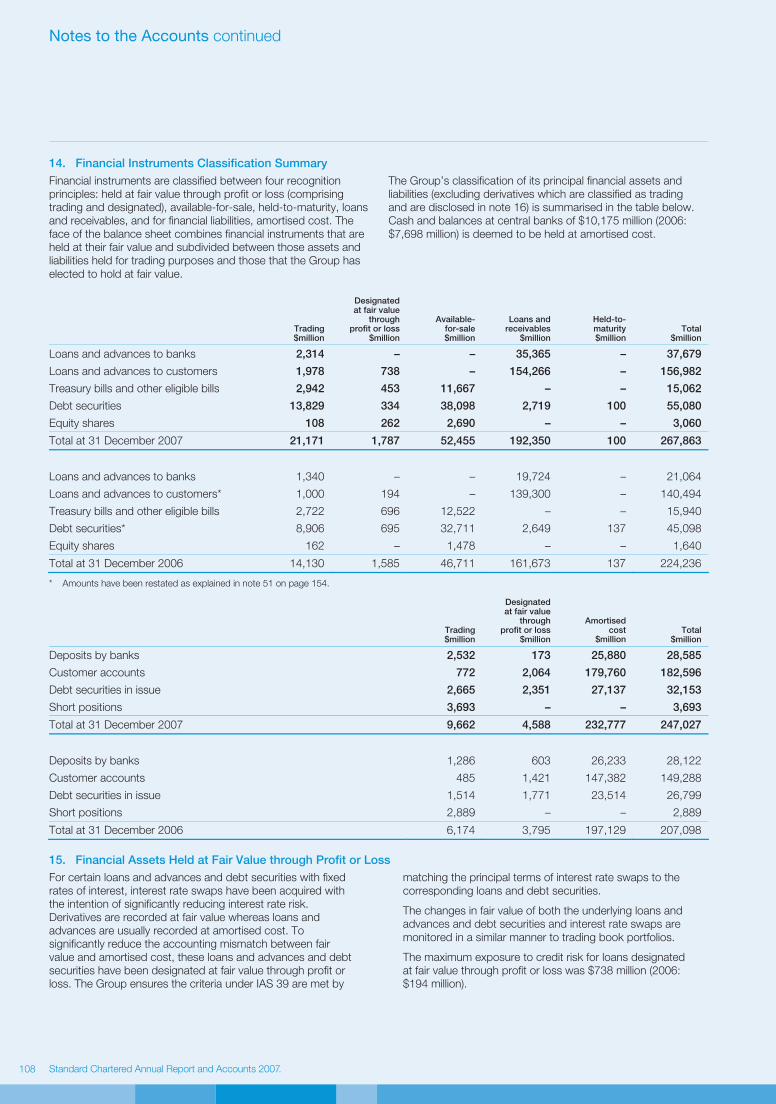
14. Financial Instruments Classification Summary
Financial instruments are classified between four recognition
principles: held at fair value through profit or loss (comprising
trading and designated), available-for-sale, held-to-maturity, loans
and receivables, and for financial liabilities, amortised cost. The
face of the balance sheet combines financial instruments that are
held at their fair value and subdivided between those assets and
liabilities held for trading purposes and those that the Group has
elected to hold at fair value.
The Group’s classification of its principal financial assets and
liabilities (excluding derivatives which are classified as trading
and are disclosed in note 16) is summarised in the table below.
Cash and balances at central banks of $10,175 million (2006:
$7,698 million) is deemed to be held at amortised cost.
Trading$million
Designated at fair value
through profit or loss
$million
Available-for-sale$million
Loans and receivables
$million
Held-to- maturity $million
Total$million
Loans and advances to banks 2,314 – – 35,365 – 37,679
Loans and advances to customers 1,978 738 – 154,266 – 156,982
Treasury bills and other eligible bills 2,942 453 11,667 – – 15,062
Debt securities 13,829 334 38,098 2,719 100 55,080
Equity shares 108 262 2,690 – – 3,060
Total at 31 December 2007 21,171 1,787 52,455 192,350 100 267,863
Loans and advances to banks 1,340 – – 19,724 – 21,064
Loans and advances to customers* 1,000 194 – 139,300 – 140,494
Treasury bills and other eligible bills 2,722 696 12,522 – – 15,940
Debt securities* 8,906 695 32,711 2,649 137 45,098
Equity shares 162 – 1,478 – – 1,640
Total at 31 December 2006 14,130 1,585 46,711 161,673 137 224,236
* Amounts have been restated as explained in note 51 on page 154.
Trading$million
Designated at fair value
through profit or loss
$million
Amortised cost
$million Total
$million
Deposits by banks 2,532 173 25,880 28,585
Customer accounts 772 2,064 179,760 182,596
Debt securities in issue 2,665 2,351 27,137 32,153
Short positions 3,693 – – 3,693
Total at 31 December 2007 9,662 4,588 232,777 247,027
Deposits by banks 1,286 603 26,233 28,122
Customer accounts 485 1,421 147,382 149,288
Debt securities in issue 1,514 1,771 23,514 26,799
Short positions 2,889 – – 2,889
Total at 31 December 2006 6,174 3,795 197,129 207,098
15. Financial Assets Held at Fair Value through Profit or Loss
For certain loans and advances and debt securities with fixed
rates of interest, interest rate swaps have been acquired with
the intention of significantly reducing interest rate risk.
Derivatives are recorded at fair value whereas loans and
advances are usually recorded at amortised cost. To
significantly reduce the accounting mismatch between fair
value and amortised cost, these loans and advances and debt
securities have been designated at fair value through profit or
loss. The Group ensures the criteria under IAS 39 are met by
matching the principal terms of interest rate swaps to the
corresponding loans and debt securities.
The changes in fair value of both the underlying loans and
advances and debt securities and interest rate swaps are
monitored in a similar manner to trading book portfolios.
The maximum exposure to credit risk for loans designated
at fair value through profit or loss was $738 million (2006:
$194 million).
www.standardchartered.com
Fin
an
cia
l S
tate
men
ts a
nd
No
tes t
o t
he A
cco
un
ts
109
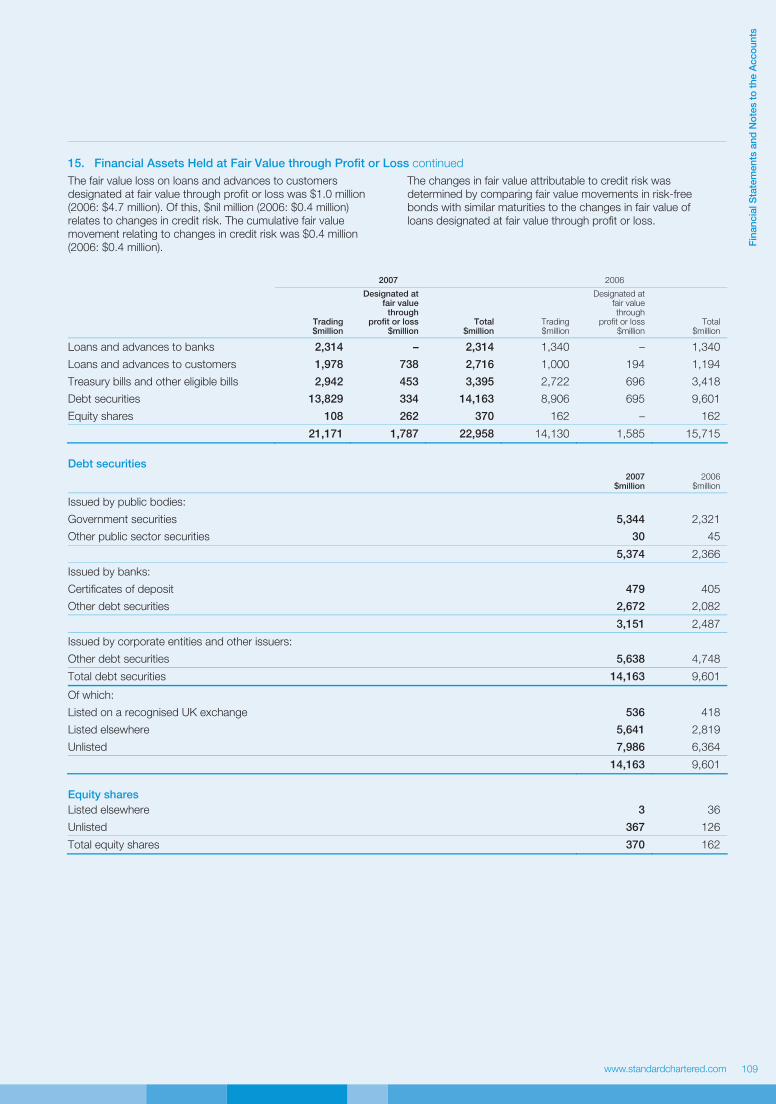
15. Financial Assets Held at Fair Value through Profit or Loss continued
The fair value loss on loans and advances to customers
designated at fair value through profit or loss was $1.0 million
(2006: $4.7 million). Of this, $nil million (2006: $0.4 million)
relates to changes in credit risk. The cumulative fair value
movement relating to changes in credit risk was $0.4 million
(2006: $0.4 million).
The changes in fair value attributable to credit risk was
determined by comparing fair value movements in risk-free
bonds with similar maturities to the changes in fair value of
loans designated at fair value through profit or loss.
2007 2006
Trading$million
Designated at fair value
through profit or loss
$million Total
$million Trading $million
Designated at fair value through
profit or loss $million
Total$million
Loans and advances to banks 2,314 – 2,314 1,340 – 1,340
Loans and advances to customers 1,978 738 2,716 1,000 194 1,194
Treasury bills and other eligible bills 2,942 453 3,395 2,722 696 3,418
Debt securities 13,829 334 14,163 8,906 695 9,601
Equity shares 108 262 370 162 – 162
21,171 1,787 22,958 14,130 1,585 15,715
Debt securities
2007 $million
2006$million
Issued by public bodies:
Government securities 5,344 2,321
Other public sector securities 30 45
5,374 2,366
Issued by banks:
Certificates of deposit 479 405
Other debt securities 2,672 2,082
3,151 2,487
Issued by corporate entities and other issuers:
Other debt securities 5,638 4,748
Total debt securities 14,163 9,601
Of which:
Listed on a recognised UK exchange 536 418
Listed elsewhere 5,641 2,819
Unlisted 7,986 6,364
14,163 9,601
Equity shares
Listed elsewhere 3 36
Unlisted 367 126
Total equity shares 370 162

Standard Chartered Annual Report and Accounts 2007
Notes to the Accounts continued
110
15. Financial Assets Held at Fair Value through Profit or Loss continued
For certain loans and advances designated at fair value
through profit or loss, the difference arising between the fair
value at initial recognition and the amount that would have
arisen had the valuation techniques used for subsequent
measurement been used at initial recognition is amortised to
the income statement until the inputs become observable or
the transaction matures or is terminated. The table below sets
out a reconciliation of amounts deferred:
2007 $million
2006$million
At 1 January 2 –
Additional amount deferred 10 2
Recognised in income (3) –
At 31 December 9 2
Changing one or more of the assumptions to reasonably possible alternatives would not significantly change the fair value.
16. Derivative Financial Instruments
Derivatives are financial instruments that derive their value in
response to changes in interest rates, financial instrument prices,
commodity prices, foreign exchange rates, credit risk and indices.
The types of derivatives used by the Group are set out below.
All derivatives are classified as trading and recognised and
subsequently measured at fair value, with all revaluation gains
recognised in profit and loss (except where cash flow hedging
has been achieved, in which case the effective portion of changes
in fair value go through reserves).
These tables analyse the notional principal amounts and the
positive and negative fair values of the Group’s derivative
financial instruments. Notional principal amounts are the amount
of principal underlying the contract at the reporting date.
The Group limits its exposure to credit losses in the event of
default by entering into master netting agreements with certain
market counterparties. As required by IAS 32, exposures are
not presented net in these accounts as in the ordinary course
of business they are not intended to be settled net. Details of
the amounts available for offset can be found in note 49, under
maximum exposure to credit risk.
The Derivatives and Hedging sections of the Risk Review on
pages 57 and 58 explains the Group’s risk management of
derivative contracts.
2007 2006
Total derivatives
Notionalprincipalamounts$million
Assets$million
Liabilities$million
Notional principal amounts $million
Assets $million
Liabilities$million
Foreign exchange derivative contracts:
Forward foreign exchange contracts 775,663 7,376 7,852 434,569 3,805 4,165
Currency swaps and options 512,833 8,955 8,516 295,845 4,698 4,793
1,288,496 16,331 16,368 730,414 8,503 8,958
Interest rate derivative contracts:
Swaps 979,727 8,473 8,365 653,283 4,353 4,348
Forward rate agreements and options 166,563 556 745 94,244 138 195
Exchange traded futures and options 322,520 336 282 260,182 42 47
1,468,810 9,365 9,392 1,007,709 4,533 4,590
Credit derivative contracts 21,035 165 160 22,195 49 70
Equity and stock index options 1,057 58 106 699 18 44
Commodity derivative contracts 16,971 285 244 2,469 51 41
Total derivatives 2,796,369 26,204 26,270 1,763,486 13,154 13,703
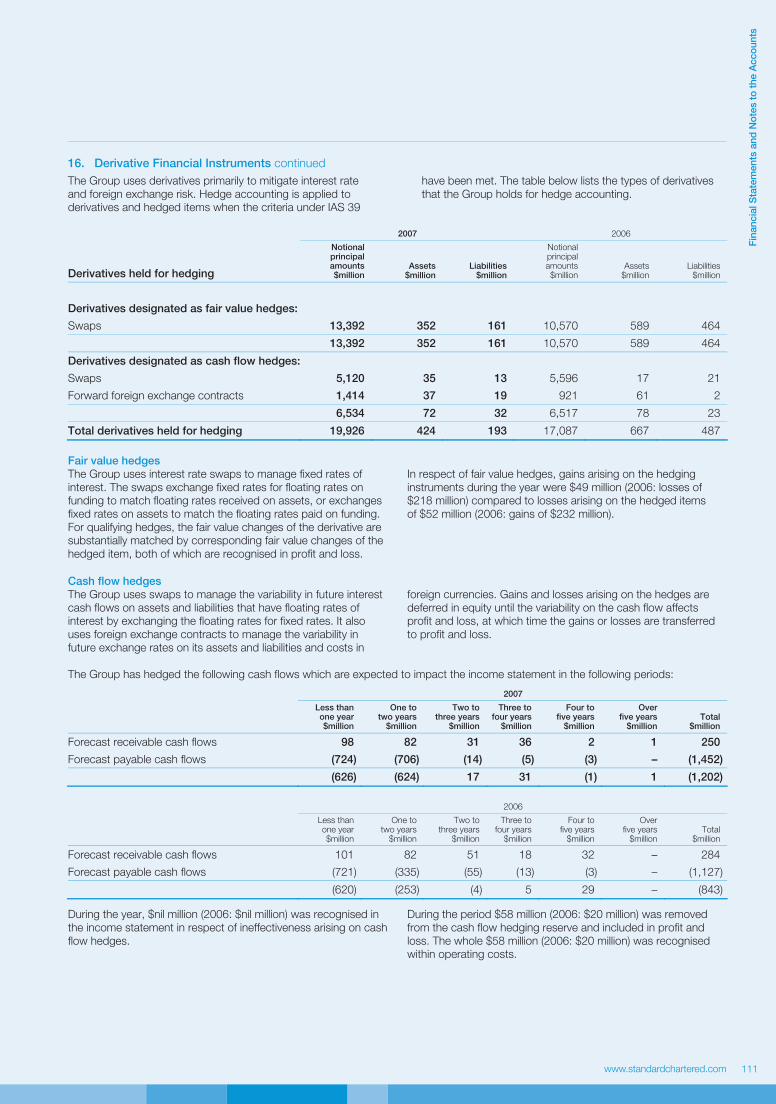
www.standardchartered.com
Fin
an
cia
l S
tate
men
ts a
nd
No
tes t
o t
he A
cco
un
ts
111
16. Derivative Financial Instruments continued
The Group uses derivatives primarily to mitigate interest rate
and foreign exchange risk. Hedge accounting is applied to
derivatives and hedged items when the criteria under IAS 39
have been met. The table below lists the types of derivatives
that the Group holds for hedge accounting.
2007 2006
Derivatives held for hedging
Notionalprincipalamounts$million
Assets$million
Liabilities$million
Notional principal amounts $million
Assets$million
Liabilities$million
Derivatives designated as fair value hedges:
Swaps 13,392 352 161 10,570 589 464
13,392 352 161 10,570 589 464
Derivatives designated as cash flow hedges:
Swaps 5,120 35 13 5,596 17 21
Forward foreign exchange contracts 1,414 37 19 921 61 2
6,534 72 32 6,517 78 23
Total derivatives held for hedging 19,926 424 193 17,087 667 487
Fair value hedges
The Group uses interest rate swaps to manage fixed rates of
interest. The swaps exchange fixed rates for floating rates on
funding to match floating rates received on assets, or exchanges
fixed rates on assets to match the floating rates paid on funding.
For qualifying hedges, the fair value changes of the derivative are
substantially matched by corresponding fair value changes of the
hedged item, both of which are recognised in profit and loss.
In respect of fair value hedges, gains arising on the hedging
instruments during the year were $49 million (2006: losses of
$218 million) compared to losses arising on the hedged items
of $52 million (2006: gains of $232 million).
Cash flow hedges
The Group uses swaps to manage the variability in future interest
cash flows on assets and liabilities that have floating rates of
interest by exchanging the floating rates for fixed rates. It also
uses foreign exchange contracts to manage the variability in
future exchange rates on its assets and liabilities and costs in
foreign currencies. Gains and losses arising on the hedges are
deferred in equity until the variability on the cash flow affects
profit and loss, at which time the gains or losses are transferred
to profit and loss.
The Group has hedged the following cash flows which are expected to impact the income statement in the following periods:
2007
Less than one year$million
One to two years
$million
Two to three years
$million
Three to four years
$million
Four to five years
$million
Over five years
$million Total
$million
Forecast receivable cash flows 98 82 31 36 2 1 250
Forecast payable cash flows (724) (706) (14) (5) (3) – (1,452)
(626) (624) 17 31 (1) 1 (1,202)
2006
Less than one year$million
One to two years
$million
Two to three years
$million
Three to four years
$million
Four to five years
$million
Over five years
$million Total
$million
Forecast receivable cash flows 101 82 51 18 32 – 284
Forecast payable cash flows (721) (335) (55) (13) (3) – (1,127)
(620) (253) (4) 5 29 – (843) During the year, $nil million (2006: $nil million) was recognised in
the income statement in respect of ineffectiveness arising on cash
flow hedges.
During the period $58 million (2006: $20 million) was removed
from the cash flow hedging reserve and included in profit and
loss. The whole $58 million (2006: $20 million) was recognised
within operating costs.
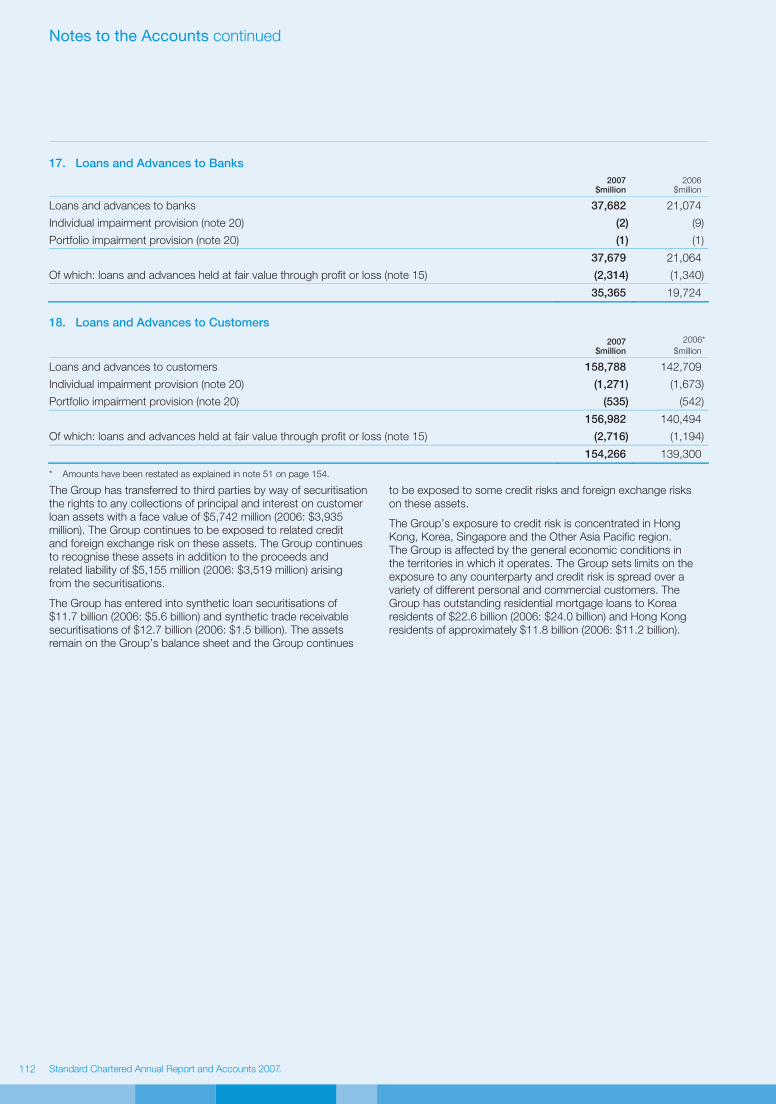
Standard Chartered Annual Report and Accounts 2007
Notes to the Accounts continued
112
17. Loans and Advances to Banks
2007 $million
2006$million
Loans and advances to banks 37,682 21,074
Individual impairment provision (note 20) (2) (9)
Portfolio impairment provision (note 20) (1) (1)
37,679 21,064
Of which: loans and advances held at fair value through profit or loss (note 15) (2,314) (1,340)
35,365 19,724
18. Loans and Advances to Customers
2007 $million
2006*
$million
Loans and advances to customers 158,788 142,709
Individual impairment provision (note 20) (1,271) (1,673)
Portfolio impairment provision (note 20) (535) (542)
156,982 140,494
Of which: loans and advances held at fair value through profit or loss (note 15) (2,716) (1,194)
154,266 139,300
* Amounts have been restated as explained in note 51 on page 154.
The Group has transferred to third parties by way of securitisation
the rights to any collections of principal and interest on customer
loan assets with a face value of $5,742 million (2006: $3,935
million). The Group continues to be exposed to related credit
and foreign exchange risk on these assets. The Group continues
to recognise these assets in addition to the proceeds and
related liability of $5,155 million (2006: $3,519 million) arising
from the securitisations.
The Group has entered into synthetic loan securitisations of
$11.7 billion (2006: $5.6 billion) and synthetic trade receivable
securitisations of $12.7 billion (2006: $1.5 billion). The assets
remain on the Group’s balance sheet and the Group continues
to be exposed to some credit risks and foreign exchange risks
on these assets.
The Group’s exposure to credit risk is concentrated in Hong
Kong, Korea, Singapore and the Other Asia Pacific region.
The Group is affected by the general economic conditions in
the territories in which it operates. The Group sets limits on the
exposure to any counterparty and credit risk is spread over a
variety of different personal and commercial customers. The
Group has outstanding residential mortgage loans to Korea
residents of $22.6 billion (2006: $24.0 billion) and Hong Kong
residents of approximately $11.8 billion (2006: $11.2 billion).

www.standardchartered.com
Fin
an
cia
l S
tate
men
ts a
nd
No
tes t
o t
he A
cco
un
ts
113
19. Assets Leased to Customers
Finance leases and instalment credit 2007
$million 2006
$million
Finance leases 506 639
Instalment credit agreements 1,127 1,019
1,633 1,658
The above assets are included within loans and advances to customers.
The cost of assets acquired during the year for leasing to customers under finance leases and instalment credit agreements amounted
to $140 million (2006: $720 million).
2007 $million
2006$million
Minimum lease receivables under finance leases falling due:
Within one year 61 88
Later than one year and less than five years 511 496
After five years 12 157
584 741
Interest income relating to future periods (78) (102)
Present value of finance lease receivables 506 639 Operating lease assets Assets leased to customers under operating leases consist of commercial aircraft which are included within property, plant and
equipment in note 26. At 31 December 2007 these assets had a net book value of $200 million (2006: $nil million).
2007 $million
2006$million
Minimum lease receivables under operating leases falling due:
Within one year 10 –
Later than one year and less than five years 21 –
After five years 5 –
36 –

Standard Chartered Annual Report and Accounts 2007Standard Chartered Annual Report and Accounts 2007
Notes to the Accounts continued
114
20. Impairment Provisions on Loans and Advances
2007 $million
2006*
$million
At 1 January 2,225 1,754
Exchange translation differences 28 74
Acquisitions – 743
Amounts written off (1,183) (962)
Recoveries of acquisition fair values (98) (106)
Recoveries of amounts previously written off 139 128
Discount unwind (66) (52)
Other 10 12
New provisions 1,352 1,131
Recoveries/provisions no longer required (598) (497)
Net charge against profit** 754 634
Provisions held at 31 December# 1,809 2,225
* Amounts have been restated as explained in note 51 on page 154.
** The net charge of $754 million (2006: $634 million) comprises $769 million (2006: $604 million) individual impairment charge and $(15) million (2006: $30 million)
portfolio impairment (release)/charge. It excludes provision releases of $3 million (2006: $11 million) for credit commitments (note 35) and impairment charges of
$10 million (2006: $6 million) relating to debt securities designated as loans and receivables (note 22).
# The provision of $1,809 million held at 31 December 2007 (2006: $2,225 million) comprises $1,273 million (2006: $1,682 million) individual impairment provision
and $536 million (2006: $543 million) portfolio impairment provision.
The following table shows impairment provisions by each principal category of borrowers’ business or industry:
2007 $million
2006*
$million
Loans to individuals
Mortgages 99 132
Other 200 226
Small and medium enterprises 356 494
Consumer Banking 655 852
Agriculture, forestry and fishing 33 23
Construction 10 4
Commerce 152 169
Electricity, gas and water 25 6
Financing, insurance and business services 27 20
Mining and quarrying 12 36
Manufacturing 290 507
Commercial real estate 23 12
Transport, storage and communication 22 31
Other 22 13
Wholesale Banking 616 821
Individual impairment provision against loans and advances to customers (note 18) 1,271 1,673
Individual impairment provision against loans and advances to banks (note 17) 2 9
Portfolio impairment provision (note 17, 18) 536 543
Total impairment provisions on loans and advances 1,809 2,225
* Amounts have been restated as explained in note 51 on page 154.
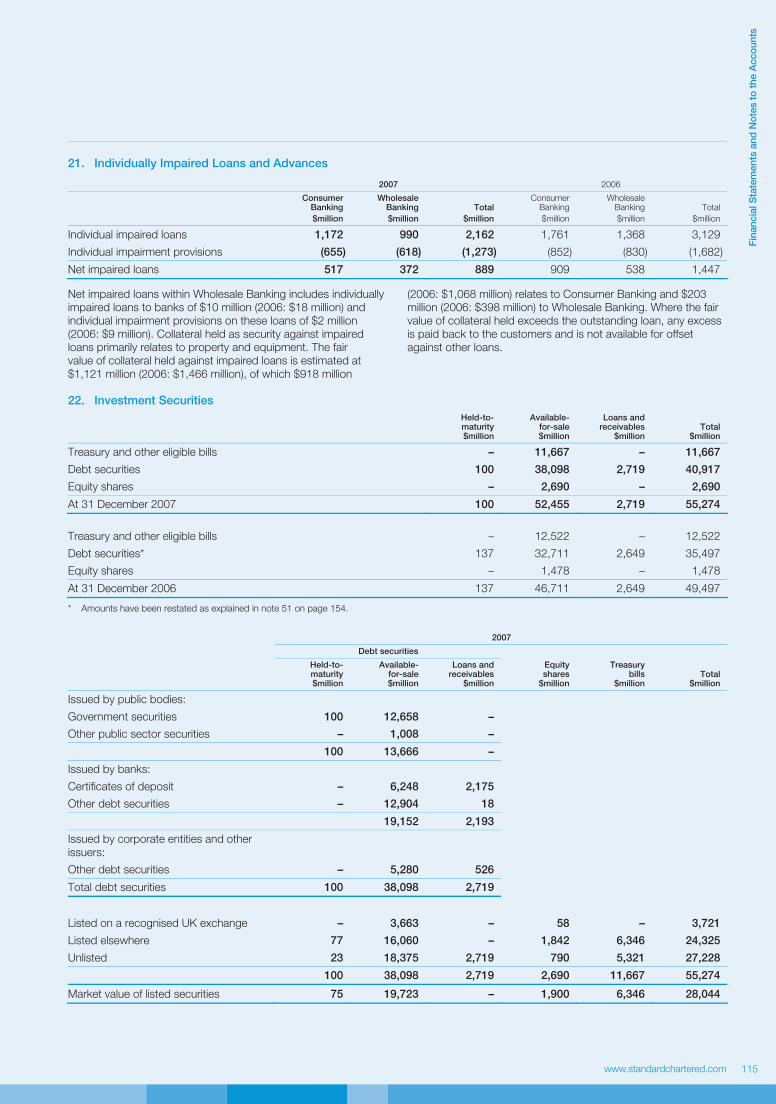
www.standardchartered.com
Fin
an
cia
l S
tate
men
ts a
nd
No
tes t
o t
he A
cco
un
ts
115
21. Individually Impaired Loans and Advances
2007 2006
Consumer Banking
$million
Wholesale Banking
$million
Total
$million
Consumer Banking
$million
Wholesale Banking
$million
Total
$million
Individual impaired loans 1,172 990 2,162 1,761 1,368 3,129
Individual impairment provisions (655) (618) (1,273) (852) (830) (1,682)
Net impaired loans 517 372 889 909 538 1,447 Net impaired loans within Wholesale Banking includes individually
impaired loans to banks of $10 million (2006: $18 million) and
individual impairment provisions on these loans of $2 million
(2006: $9 million). Collateral held as security against impaired
loans primarily relates to property and equipment. The fair
value of collateral held against impaired loans is estimated at
$1,121 million (2006: $1,466 million), of which $918 million
(2006: $1,068 million) relates to Consumer Banking and $203
million (2006: $398 million) to Wholesale Banking. Where the fair
value of collateral held exceeds the outstanding loan, any excess
is paid back to the customers and is not available for offset
against other loans.
22. Investment Securities
Held-to-maturity$million
Available- for-sale $million
Loans and receivables
$million Total
$million
Treasury and other eligible bills – 11,667 – 11,667
Debt securities 100 38,098 2,719 40,917
Equity shares – 2,690 – 2,690
At 31 December 2007 100 52,455 2,719 55,274
Treasury and other eligible bills – 12,522 – 12,522
Debt securities* 137 32,711 2,649 35,497
Equity shares – 1,478 – 1,478
At 31 December 2006 137 46,711 2,649 49,497
* Amounts have been restated as explained in note 51 on page 154.
2007
Debt securities
Held-to-maturity$million
Available-for-sale$million
Loans and receivables
$million
Equity shares
$million
Treasury bills
$million Total
$million
Issued by public bodies:
Government securities 100 12,658 –
Other public sector securities – 1,008 –
100 13,666 –
Issued by banks:
Certificates of deposit – 6,248 2,175
Other debt securities – 12,904 18
19,152 2,193
Issued by corporate entities and other
issuers:
Other debt securities – 5,280 526
Total debt securities 100 38,098 2,719
Listed on a recognised UK exchange – 3,663 – 58 – 3,721
Listed elsewhere 77 16,060 – 1,842 6,346 24,325
Unlisted 23 18,375 2,719 790 5,321 27,228
100 38,098 2,719 2,690 11,667 55,274
Market value of listed securities 75 19,723 – 1,900 6,346 28,044

Standard Chartered Annual Report and Accounts 2007Standard Chartered Annual Report and Accounts 2007
Notes to the Accounts continued
116
22. Investment Securities continued
2006
Debt securities
Held-to-maturity$million
Available-for-sale*$million
Loans and receivables
$million
Equity shares
$million
Treasury bills
$million Total
$million
Issued by public bodies:
Government securities 137 10,379 –
Other public sector securities – 1,403 –
137 11,782 –
Issued by banks:
Certificates of deposit – 8,433 2,280
Other debt securities – 9,505 178
– 17,938 2,458
Issued by corporate entities and
other issuers:
Other debt securities – 2,991 191
Total debt securities 137 32,711 2,649
Listed on a recognised UK exchange – 6,679 – 38 – 6,717
Listed elsewhere 113 10,183 132 795 7,027 18,250
Unlisted 24 15,849 2,517 645 5,495 24,530
137 32,711 2,649 1,478 12,522 49,497
Market value of listed securities 109 16,862 130 833 7,027 24,961
* Amounts have been restated as explained in note 51 on page 154.
Equity shares largely comprise investments in corporates.
The change in the carrying amount of investment securities comprised:
2007 2006
Debt securities
$million
Equityshares
$million
Treasury bills
$million Total
$million
Debt securities*
$million
Equity shares
$million
Treasury bills
$million Total
$million
At 1 January 35,497 1,478 12,522 49,497 26,710 954 10,199 37,863
Exchange translation differences 846 20 171 1,037 949 9 528 1,486
Acquisitions – – – – 1,155 21 842 2,018
Additions 53,574 1,248 23,470 78,292 47,411 328 23,376 71,115
Maturities and disposals (48,850) (970) (24,637) (74,457) (40,909) (337) (22,650) (63,896)
Provisions (45) (3) (2) (50) (6) (4) (16) (26)
Changes in fair value (including the effect
of fair value hedging) (205) 920 (19) 696 142 510 28 680
Amortisation of discounts and premiums 100 (3) 162 259 45 (3) 215 257
At 31 December 40,917 2,690 11,667 55,274 35,497 1,478 12,522 49,497
* Amounts have been restated as explained in note 51 on page 154.
Treasury bills and other eligible bills include $492 million
(2006: $393 million) of bills sold subject to sale and
repurchase transactions. Debt securities include $1,958
million (2006: $896 million) of securities sold subject to sale
and repurchase transactions.
At 31 December 2007, unamortised premiums on debt securities
held for investment purposes amounted to $46 million (2006:
$39 million) and unamortised discounts amounted to $186 million
(2006: $112 million).
Income from listed equity shares amounted to $9 million (2006:
$4 million) and income from unlisted equity shares amounted to
$270 million (2006: $73 million).
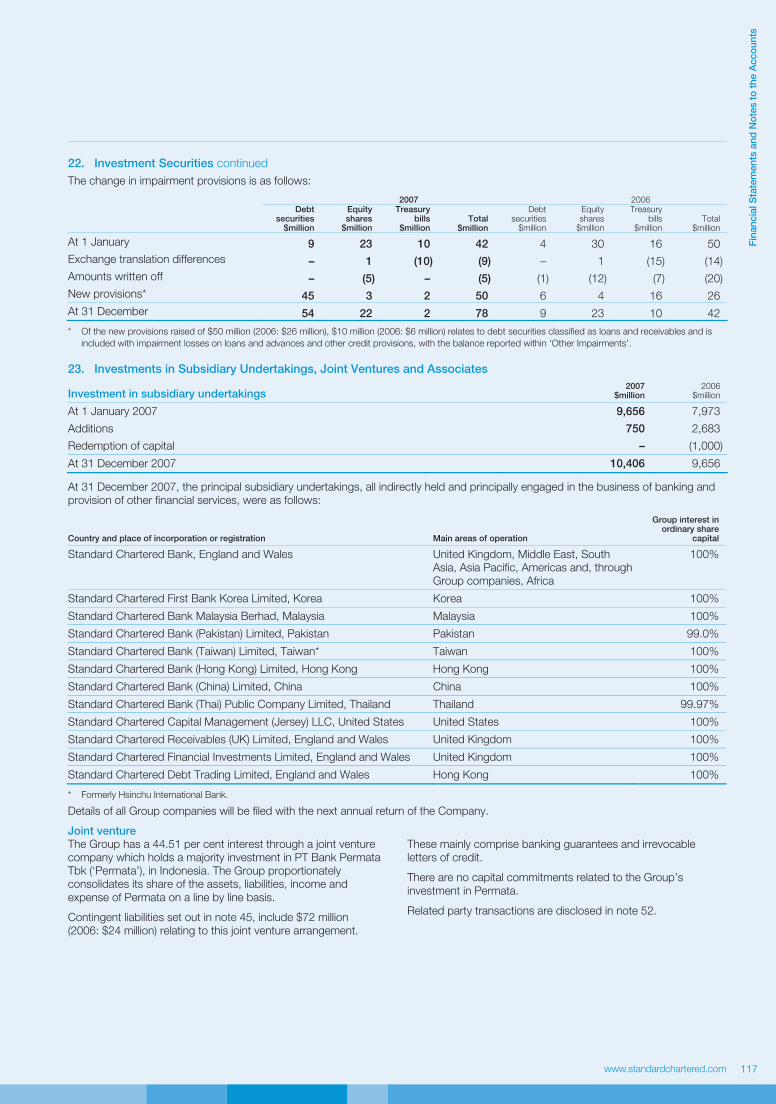
www.standardchartered.com
Fin
an
cia
l S
tate
men
ts a
nd
No
tes t
o t
he A
cco
un
ts
117
22. Investment Securities continued
The change in impairment provisions is as follows:
2007 2006
Debt securities
$million
Equity shares
$million
Treasury bills
$million Total
$million
Debt securities
$million
Equity shares
$million
Treasury bills
$million Total
$million
At 1 January 9 23 10 42 4 30 16 50
Exchange translation differences – 1 (10) (9) – 1 (15) (14)
Amounts written off – (5) – (5) (1) (12) (7) (20)
New provisions* 45 3 2 50 6 4 16 26
At 31 December 54 22 2 78 9 23 10 42
* Of the new provisions raised of $50 million (2006: $26 million), $10 million (2006: $6 million) relates to debt securities classified as loans and receivables and is
included with impairment losses on loans and advances and other credit provisions, with the balance reported within ‘Other Impairments’.
23. Investments in Subsidiary Undertakings, Joint Ventures and Associates
Investment in subsidiary undertakings 2007
$million 2006
$million
At 1 January 2007 9,656 7,973
Additions 750 2,683
Redemption of capital – (1,000)
At 31 December 2007 10,406 9,656
At 31 December 2007, the principal subsidiary undertakings, all indirectly held and principally engaged in the business of banking and
provision of other financial services, were as follows:
Country and place of incorporation or registration Main areas of operation
Group interest in ordinary share
capital
Standard Chartered Bank, England and Wales United Kingdom, Middle East, South
Asia, Asia Pacific, Americas and, through
Group companies, Africa
100%
Standard Chartered First Bank Korea Limited, Korea Korea 100%
Standard Chartered Bank Malaysia Berhad, Malaysia Malaysia 100%
Standard Chartered Bank (Pakistan) Limited, Pakistan Pakistan 99.0%
Standard Chartered Bank (Taiwan) Limited, Taiwan* Taiwan 100%
Standard Chartered Bank (Hong Kong) Limited, Hong Kong Hong Kong 100%
Standard Chartered Bank (China) Limited, China China 100%
Standard Chartered Bank (Thai) Public Company Limited, Thailand Thailand 99.97%
Standard Chartered Capital Management (Jersey) LLC, United States United States 100%
Standard Chartered Receivables (UK) Limited, England and Wales United Kingdom 100%
Standard Chartered Financial Investments Limited, England and Wales United Kingdom 100%
Standard Chartered Debt Trading Limited, England and Wales Hong Kong 100%
* Formerly Hsinchu International Bank.
Details of all Group companies will be filed with the next annual return of the Company.
Joint venture
The Group has a 44.51 per cent interest through a joint venture
company which holds a majority investment in PT Bank Permata
Tbk (‘Permata’), in Indonesia. The Group proportionately
consolidates its share of the assets, liabilities, income and
expense of Permata on a line by line basis.
Contingent liabilities set out in note 45, include $72 million
(2006: $24 million) relating to this joint venture arrangement.
These mainly comprise banking guarantees and irrevocable
letters of credit.
There are no capital commitments related to the Group’s
investment in Permata.
Related party transactions are disclosed in note 52.

Standard Chartered Annual Report and Accounts 2007Standard Chartered Annual Report and Accounts 2007
Notes to the Accounts continued
118
23. Investments in Subsidiary Undertakings, Joint Ventures and Associates continued
The following amounts have been included in the consolidated accounts of the Group:
2007 $million
2006$million
Current assets 663 549
Long-term assets 1,332 1,472
Total assets 1,995 2,021
Current liabilities (1,484) (1,580)
Long-term liabilities (140) (81)
Total liabilities (1,624) (1,661)
371 360
Income 161 100
Expenses (111) (73)
Impairment (17) (17)
Operating profit 33 10
Tax 2 (2)
Share of post tax result from joint venture 35 8
Long-term assets are primarily loans to customers and current liabilities are primarily customer deposits based on contractual maturities.
Interests in associates
2007 $million
2006$million
At 1 January 218 128
Additions 51 90
At 31 December 269 218
Profit/(loss) for the year 1 (2)
Total assets 944 355
Total liabilities (774) (216)
170 139
The Group’s principal associates are:
Associate Main areas of operation
Group interest in ordinary
share capital
China Bohai Bank China 19.9%
Fleming Family & Partners Asia 20.0%
First Africa Holdings Africa 25.0%
MCashback Limited UK 30.0%
Merchant Solutions Limited Hong Kong 44.0% The Group’s investment in China Bohai Bank is less than 20
per cent but is considered to be an associate because of the
significant influence the Group is able to exercise over the
company’s management, financial and operating policies.
On 9 February 2007, the Group acquired a 30 per cent interest
in MCashback Limited, for $36 million. In October 2007, the
Group obtained a 44 per cent interest in Merchant Solutions
Limited. The reporting dates of these associates are within three
months of the Group’s reporting date.

www.standardchartered.com
Fin
an
cia
l S
tate
men
ts a
nd
No
tes t
o t
he A
cco
un
ts
119
24. Business Combinations
2007 acquisitions
On 5 October 2007, the Group acquired 100 per cent of the
share capital of Pembroke Group Limited, an aircraft leasing,
financing and management company. On 3 December 2007,
the Group acquired 100 per cent of the share capital of Harrison
Lovegrove & Co Limited, an oil and gas advisory boutique
company. On 5 December 2007, the Group acquired 80 per
cent of A Brain Limited, a Korean fund administration company.
None of these acquisitions were individually material.
The acquired businesses contributed operating income of
$7 million and loss before tax of $2 million to the Group from
the date of their acquisition to 31 December 2007.
If the acquisition had occurred on 1 January 2007, the operating
income of the Group would have been approximately $11,132
million and profit before taxation would have been approximately
$4,043 million.
During 2007, the Group acquired the remaining minority interest
of Hsinchu for a consideration of $43 million and generated
additional goodwill of $34 million.
$million
Details of net assets acquired and goodwill are as follows:
Purchase consideration:
– cash paid 151
– loan notes issued 5
– deferred consideration 65
– direct costs relating to the acquisitions 3
Total purchase consideration 224
Fair value of net assets acquired 187
Goodwill 37 Deferred consideration is payable between 6 months and 36 months after the date of acquisition.
Goodwill arising on these acquisitions is attributable to the synergies expected to arise and to the value of the workforce in place which
is not recognised separately.
The assets and liabilities arising from the acquisitions are as follows:
Fair value $million
Acquiree’scarryingamount$million
Cash and balances at central banks* 66 66
Loans and advances to customers 2 2
Intangibles other than goodwill 63 –
Property, plant and equipment 189 152
Deferred tax assets 4 4
Other assets 28 28
Total assets 352 252
Other liabilities 162 162
Total liabilities 162 162
Minority interest 3 –
Net assets acquired 187 90
Purchase consideration settled in cash 151
Cash and cash equivalents in subsidiaries acquired (66)
Cash outflow on acquisition 85
* Cash and balances at central banks include amounts subject to regulatory restrictions.
The fair value amounts contain some provisional balances which will be finalised within 12 months of the acquisition date.
The intangible assets acquired as part of the acquisitions can be analysed as follows:
$million
Brand names 6
Customer relationships 55
Capitalised software 2
Total 63
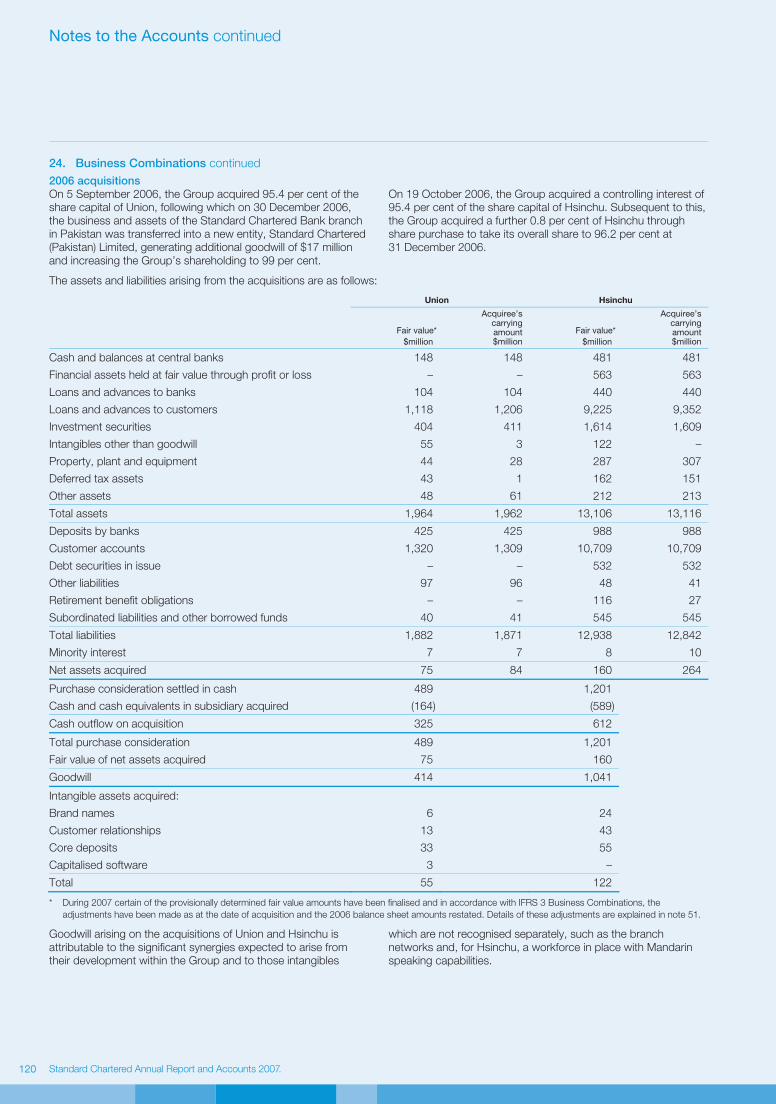
Standard Chartered Annual Report and Accounts 2007Standard Chartered Annual Report and Accounts 2007
Notes to the Accounts continued
120
24. Business Combinations continued
2006 acquisitions
On 5 September 2006, the Group acquired 95.4 per cent of the
share capital of Union, following which on 30 December 2006,
the business and assets of the Standard Chartered Bank branch
in Pakistan was transferred into a new entity, Standard Chartered
(Pakistan) Limited, generating additional goodwill of $17 million
and increasing the Group’s shareholding to 99 per cent.
On 19 October 2006, the Group acquired a controlling interest of
95.4 per cent of the share capital of Hsinchu. Subsequent to this,
the Group acquired a further 0.8 per cent of Hsinchu through
share purchase to take its overall share to 96.2 per cent at
31 December 2006.
The assets and liabilities arising from the acquisitions are as follows:
Union Hsinchu
Fair value*
$million
Acquiree’scarryingamount$million
Fair value* $million
Acquiree’scarryingamount$million
Cash and balances at central banks 148 148 481 481
Financial assets held at fair value through profit or loss – – 563 563
Loans and advances to banks 104 104 440 440
Loans and advances to customers 1,118 1,206 9,225 9,352
Investment securities 404 411 1,614 1,609
Intangibles other than goodwill 55 3 122 –
Property, plant and equipment 44 28 287 307
Deferred tax assets 43 1 162 151
Other assets 48 61 212 213
Total assets 1,964 1,962 13,106 13,116
Deposits by banks 425 425 988 988
Customer accounts 1,320 1,309 10,709 10,709
Debt securities in issue – – 532 532
Other liabilities 97 96 48 41
Retirement benefit obligations – – 116 27
Subordinated liabilities and other borrowed funds 40 41 545 545
Total liabilities 1,882 1,871 12,938 12,842
Minority interest 7 7 8 10
Net assets acquired 75 84 160 264
Purchase consideration settled in cash 489 1,201
Cash and cash equivalents in subsidiary acquired (164) (589)
Cash outflow on acquisition 325 612
Total purchase consideration 489 1,201
Fair value of net assets acquired 75 160
Goodwill 414 1,041
Intangible assets acquired:
Brand names 6 24
Customer relationships 13 43
Core deposits 33 55
Capitalised software 3 –
Total 55 122
* During 2007 certain of the provisionally determined fair value amounts have been finalised and in accordance with IFRS 3 Business Combinations, the
adjustments have been made as at the date of acquisition and the 2006 balance sheet amounts restated. Details of these adjustments are explained in note 51.
Goodwill arising on the acquisitions of Union and Hsinchu is
attributable to the significant synergies expected to arise from
their development within the Group and to those intangibles
which are not recognised separately, such as the branch
networks and, for Hsinchu, a workforce in place with Mandarin
speaking capabilities.

www.standardchartered.com
Fin
an
cia
l S
tate
men
ts a
nd
No
tes t
o t
he A
cco
un
ts
121
25. Goodwill and Intangible Assets
2007 2006*
Goodwill$million
Acquiredintangibles
$million Software
$million
Total$million
Goodwill$million
Acquired intangibles
$million Software
$million
Total$million
Cost
At 1 January 6,192 439 458 7,089 4,451 218 462 5,131
Exchange translation differences 42 (4) 18 56 212 18 19 249
Acquisitions 71 63 – 134 1,529 179 9 1,717
Additions – – 155 155 – 25 89 114
Disposals – – (4) (4) – – (18) (18)
Amounts written off – (21) (83) (104) – – (99) (99)
Other movements – – (11) (11) – (1) (4) (5)
At 31 December 6,305 477 533 7,315 6,192 439 458 7,089
Provision for amortisation
At 1 January 514 88 240 842 514 32 264 810
Exchange translation differences – (1) 7 6 – 4 8 12
Amortisation for the period – 77 86 163 – 52 81 133
Disposals – – – – – – (17) (17)
Amounts written off – (4) (72) (76) – – (96) (96)
At 31 December 514 160 261 935 514 88 240 842
Net book value 5,791 317 272 6,380 5,678 351 218 6,247
* Amounts have been restated as explained in note 51 on page 154.
At 1 January 2006, the net book value was: goodwill, $3,937 million; acquired intangibles, $186 million; and software, $198 million.
At 31 December 2007, accumulated goodwill impairment losses incurred from 1 January 2005 amounted to $69 million (2006: $69 million).
2007$million
2006$million
Acquired intangibles comprise:
Core deposits 108 148
Customer relationships 103 90
Brand names 102 109
Licences 4 4
Net book value 317 351
Acquired intangibles primarily comprise those recognised as part
of the acquisitions of SC First Bank (‘SCFB’), Permata, Union
Bank, Hsinchu, Pembroke and Harrison Lovegrove. The acquired
intangibles are amortised over periods from four years to a
maximum of 16 years in the case of the customer relationships
intangible acquired in SCFB.
Significant items of goodwill arising on acquisitions have been allocated to the following cash generating units for the purposes of
impairment testing:
Acquisition Cash Generating Unit
Goodwill
$million
SCFB Korean business 1,904
Union Pakistan business 431
Hsinchu Taiwan business 1,100
Manhattan Card Business Credit card and personal loan – Asia, India & MESA 896
Grindlays (India) India business 423
Grindlays (MESA) MESA business 368
Standard Chartered Bank (Thai) Thailand business 307
Permata Group’s share of Permata 163
Other 199
5,791

Standard Chartered Annual Report and Accounts 2007Standard Chartered Annual Report and Accounts 2007
Notes to the Accounts continued
122
25. Goodwill and Intangible Assets continued
All recoverable amounts were measured based on value in use.
The key assumptions and approach to determining value in use
calculations, as set out below, are solely estimates for the
purposes of assessing impairment on acquired goodwill. The
calculation for each unit uses cash flow projections based on
budgets and forecasts approved by management covering one
year, except for Permata (five years). These are then extrapolated
for periods of up to a further 19 years using steady long-term
forecast GDP growth rates and a terminal value determined
based on long-term earning multiples. Where these rates are
different from available market data on long-term rates, that fact
is stated below. The cash flows are discounted using a pre-tax
discount rate which reflects current market rates appropriate to
the cash generating unit. Management believes that any
reasonable possible change in the key assumptions on which
the recoverable amounts have been based would not cause
the carrying amounts to exceed their recoverable amount.
SCFB SCFB was acquired in April 2005 with initial goodwill recognised
of $1,738 million. The business comprises Consumer and
Wholesale Banking operations in Korea.
In assessing impairment of goodwill, the Group assumed that
growth would increase at a steady rate of 4.2 per cent in line with
the long-term forecast GDP growth of Korea. A pre-tax discount
rate of 16.4 per cent was used.
Union Union was acquired in September 2006 with initial goodwill
recognised of $414 million. Additional goodwill of $17 million
arose as a result of a share swap. The business comprises
Consumer and Wholesale Banking operations in Pakistan.
In assessing impairment of goodwill, the Group assumed that
growth would increase at a steady rate of 7.4 per cent in line
with the long-term forecast GDP growth of Pakistan. A pre-tax
discount rate of 26.1 per cent was used.
Hsinchu Hsinchu was acquired in October 2006 with initial goodwill
recognised of $1,041 million and a further $34 million in 2007.
The business comprises Consumer and Wholesale Banking
operations in Taiwan.
In assessing impairment of goodwill, the Group assumed that
growth would increase at a steady rate of 4.5 per cent in line with
the long-term forecast GDP growth of Taiwan. A pre-tax discount
rate of 14.9 per cent was used.
Manhattan Card Business Manhattan Card Business was acquired in 2000 with initial
goodwill recognised of $1,061 million. This was amortised to
$892 million under UK GAAP until 31 December 2003. The
business comprises a credit card business and a personal loans
business across Asia, India and MESA.
In assessing impairment of goodwill, the Group assumed that
growth would increase at a steady rate of 3.8 per cent in line
with the long-term forecast global GDP growth. A pre-tax
discount rate of 13.0 per cent was used.
Grindlays (India) Grindlays (India) was acquired in 2000 with initial goodwill
recognised of $446 million. This was amortised to $366 million
under UK GAAP until 31 December 2003. It comprises Consumer
and Wholesale Banking operations in India.
In assessing impairment of goodwill, the Group assumed that
growth would increase at a steady rate of 7.1 per cent in line
with the long-term forecast GDP growth of India. A pre-tax
discount rate of 26.5 per cent was used.
Grindlays (MESA) Grindlays (MESA) was acquired in 2000 with initial goodwill
recognised of $446 million. This was amortised to $366 million
under UK GAAP until 31 December 2003. It comprises Consumer
and Wholesale Banking operations in MESA.
In assessing impairment of goodwill, the Group assumed that
growth would increase at a steady rate of 3.8 per cent in line with
the long term forecast GDP growth of MESA. A pre-tax discount
rate of 15.8 per cent was used.
Standard Chartered Bank (Thai) 75 per cent of Standard Chartered Bank (Thai) was acquired in
1999 with initial goodwill recognised of $222 million. This was
amortised to $204 million under UK GAAP until 31 December
2003. In 2005 the Group acquired the remaining 25 per cent,
increasing goodwill to $272 million. The business comprises
Consumer and Wholesale Banking operations in Thailand.
In assessing impairment of goodwill, the Group assumed that
growth would increase at a steady rate of 5.6 per cent in line
with the long term forecast GDP growth of Thailand. A pre-tax
discount rate of 19.5 per cent was used.
Permata 31.55 per cent of Permata was acquired in 2004 with initial
goodwill recognised of $115 million. A further 12.96 per cent
was acquired in September 2006 with goodwill of $57 million.
This business comprises Consumer and Wholesale Banking
operations in Indonesia.
In assessing impairment of goodwill, the Group assumed that
growth would increase at a steady rate of 5.4 per cent in line
with the long-term forecast GDP growth of Indonesia. A pre-tax
discount rate of 25.9 per cent was used.
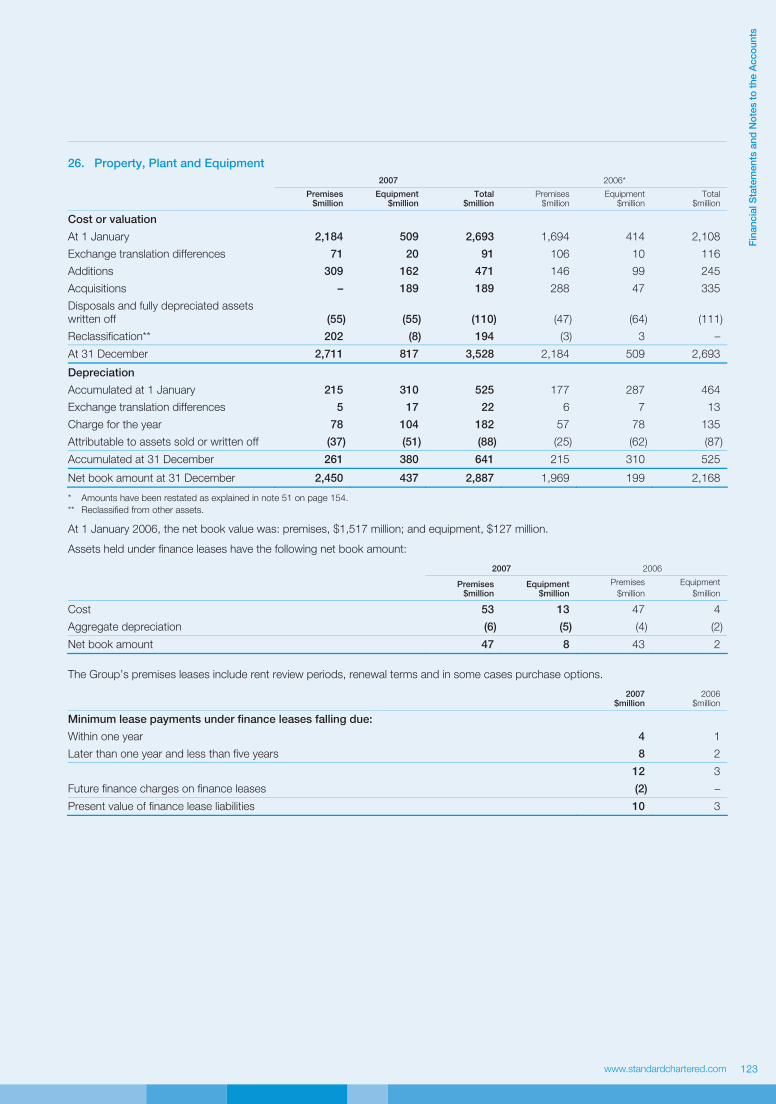
www.standardchartered.com
Fin
an
cia
l S
tate
men
ts a
nd
No
tes t
o t
he A
cco
un
ts
123
26. Property, Plant and Equipment
2007 2006*
Premises
$million Equipment
$million Total
$million Premises
$million Equipment
$million Total
$million
Cost or valuation
At 1 January 2,184 509 2,693 1,694 414 2,108
Exchange translation differences 71 20 91 106 10 116
Additions 309 162 471 146 99 245
Acquisitions – 189 189 288 47 335
Disposals and fully depreciated assets
written off (55) (55) (110) (47) (64) (111)
Reclassification** 202 (8) 194 (3) 3 –
At 31 December 2,711 817 3,528 2,184 509 2,693
Depreciation
Accumulated at 1 January 215 310 525 177 287 464
Exchange translation differences 5 17 22 6 7 13
Charge for the year 78 104 182 57 78 135
Attributable to assets sold or written off (37) (51) (88) (25) (62) (87)
Accumulated at 31 December 261 380 641 215 310 525
Net book amount at 31 December 2,450 437 2,887 1,969 199 2,168
* Amounts have been restated as explained in note 51 on page 154.
** Reclassified from other assets.
At 1 January 2006, the net book value was: premises, $1,517 million; and equipment, $127 million.
Assets held under finance leases have the following net book amount:
2007 2006
Premises$million
Equipment $million
Premises
$million
Equipment
$million
Cost 53 13 47 4
Aggregate depreciation (6) (5) (4) (2)
Net book amount 47 8 43 2
The Group’s premises leases include rent review periods, renewal terms and in some cases purchase options.
2007 $million
2006$million
Minimum lease payments under finance leases falling due:
Within one year 4 1
Later than one year and less than five years 8 2
12 3
Future finance charges on finance leases (2) –
Present value of finance lease liabilities 10 3

Standard Chartered Annual Report and Accounts 2007Standard Chartered Annual Report and Accounts 2007
Notes to the Accounts continued
124
27. Deferred Tax
The following are the major deferred tax liabilities and assets recognised by the Group and movements thereon during the reporting
period:
At 1 January
2007 $million
Exchange & other
adjustments$million
Acquisitions/disposals*
$million
Charge/ (credit)
to profit $million
Charge/ (credit)
to equity $million
At 31 December
2007 $million
Deferred taxation comprises:
Accelerated tax depreciation (10) (9) (3) (34) – (56)
Impairment provisions on loans
and advances (175) (67) – (35) 2 (275)
Tax losses carried forward (53) 1 (1) 1 – (52)
Available-for-sale assets 36 5 – – 38 79
Premises revaluation 17 – – 1 (1) 17
Cash flow hedges 24 3 – – (7) 20
Unrelieved foreign tax (76) – – 19 – (57)
Retirement benefit obligations (174) 60 – 2 71 (41)
Share based payments (131) – – (18) 61 (88)
Other temporary differences 30 7 – (143) – (106)
(512) – (4) (207) 164 (559)
At 1 January
2006$million
Exchange & other
adjustments$million
Acquisitions/disposals*
$million
Charge/ (credit)
to profit $million
Charge/ (credit)
to equity $million
At*31 December
2006 $million
Deferred taxation comprises:
Accelerated tax depreciation (34) 30 (10) 4 – (10)
Impairment provisions on loans
and advances (185) (27) (123) 160 – (175)
Tax losses carried forward (7) – (22) (24) – (53)
Available-for-sale assets (32) (2) – – 70 36
Premises revaluation 12 – – 5 – 17
Cash flow hedges (1) – – – 25 24
Unrelieved foreign tax – – – (76) – (76)
Retirement benefit obligations (160) (12) (32) (8) 38 (174)
Share based payments (101) – – (1) (29) (131)
Other temporary differences 10 (40) (18) 86 (8) 30
(498) (51) (205) 146 96 (512)
Deferred taxation comprises assets and liabilities as follows: 2007 2006*
Total$million
Asset$million
Liability$million
Total $million
Asset $million
Liability$million
Deferred taxation comprises:
Accelerated tax depreciation (56) (79) 23 (10) (42) 32
Impairment provisions on loans and
advances (275) (273) (2) (175) (238) 63
Tax losses carried forward (52) (52) – (53) (53) –
Available-for-sale assets 79 77 2 36 15 21
Premises revaluation 17 15 2 17 16 1
Cash flow hedges 20 19 1 24 23 1
Unrelieved foreign tax (57) (57) – (76) (76) –
Retirement benefit obligations (41) (41) – (174) (165) (9)
Share based payments (88) (88) – (131) (131) –
Other temporary differences (106) (108) 2 30 37 (7)
(559) (587) 28 (512) (614) 102
* Amounts have been restated as explained in note 51 on page 154.
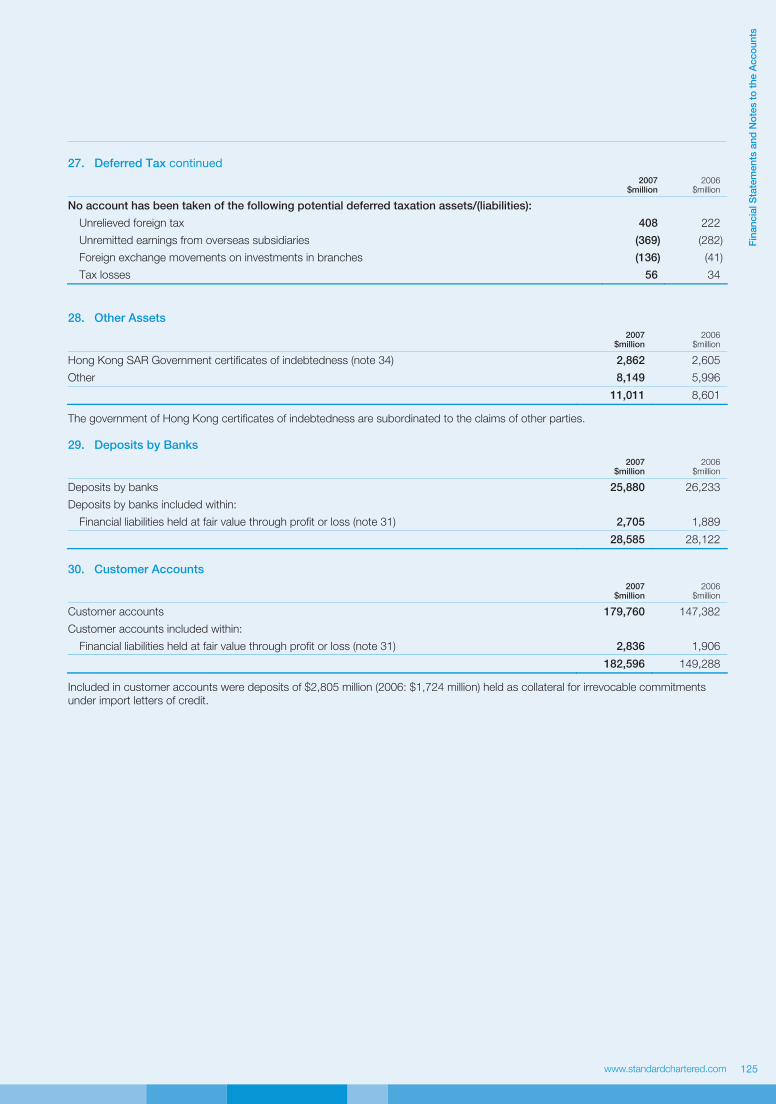
www.standardchartered.com
Fin
an
cia
l S
tate
men
ts a
nd
No
tes t
o t
he A
cco
un
ts
125
27. Deferred Tax continued
2007$million
2006$million
No account has been taken of the following potential deferred taxation assets/(liabilities):
Unrelieved foreign tax 408 222
Unremitted earnings from overseas subsidiaries (369) (282)
Foreign exchange movements on investments in branches (136) (41)
Tax losses 56 34
28. Other Assets
2007 $million
2006$million
Hong Kong SAR Government certificates of indebtedness (note 34) 2,862 2,605
Other 8,149 5,996
11,011 8,601
The government of Hong Kong certificates of indebtedness are subordinated to the claims of other parties.
29. Deposits by Banks
2007 $million
2006$million
Deposits by banks 25,880 26,233
Deposits by banks included within:
Financial liabilities held at fair value through profit or loss (note 31) 2,705 1,889
28,585 28,122
30. Customer Accounts
2007 $million
2006$million
Customer accounts 179,760 147,382
Customer accounts included within:
Financial liabilities held at fair value through profit or loss (note 31) 2,836 1,906
182,596 149,288
Included in customer accounts were deposits of $2,805 million (2006: $1,724 million) held as collateral for irrevocable commitments
under import letters of credit.
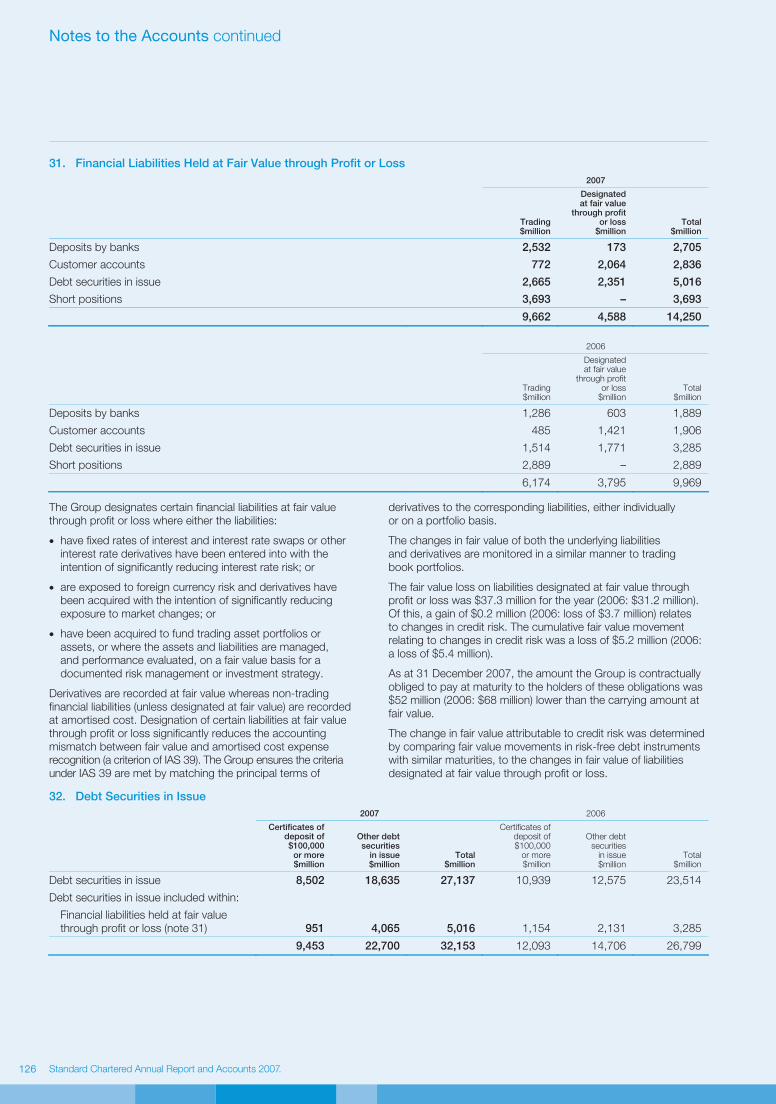
Standard Chartered Annual Report and Accounts 2007Standard Chartered Annual Report and Accounts 2007
Notes to the Accounts continued
126
31. Financial Liabilities Held at Fair Value through Profit or Loss
2007
Trading$million
Designated at fair value
through profit or loss
$million Total
$million
Deposits by banks 2,532 173 2,705
Customer accounts 772 2,064 2,836
Debt securities in issue 2,665 2,351 5,016
Short positions 3,693 – 3,693
9,662 4,588 14,250
2006
Trading$million
Designated at fair value
through profit or loss
$million Total
$million
Deposits by banks 1,286 603 1,889
Customer accounts 485 1,421 1,906
Debt securities in issue 1,514 1,771 3,285
Short positions 2,889 – 2,889
6,174 3,795 9,969 The Group designates certain financial liabilities at fair value
through profit or loss where either the liabilities:
• have fixed rates of interest and interest rate swaps or other
interest rate derivatives have been entered into with the
intention of significantly reducing interest rate risk; or
• are exposed to foreign currency risk and derivatives have
been acquired with the intention of significantly reducing
exposure to market changes; or
• have been acquired to fund trading asset portfolios or
assets, or where the assets and liabilities are managed,
and performance evaluated, on a fair value basis for a
documented risk management or investment strategy.
Derivatives are recorded at fair value whereas non-trading
financial liabilities (unless designated at fair value) are recorded
at amortised cost. Designation of certain liabilities at fair value
through profit or loss significantly reduces the accounting
mismatch between fair value and amortised cost expense
recognition (a criterion of IAS 39). The Group ensures the criteria
under IAS 39 are met by matching the principal terms of
derivatives to the corresponding liabilities, either individually
or on a portfolio basis.
The changes in fair value of both the underlying liabilities
and derivatives are monitored in a similar manner to trading
book portfolios.
The fair value loss on liabilities designated at fair value through
profit or loss was $37.3 million for the year (2006: $31.2 million).
Of this, a gain of $0.2 million (2006: loss of $3.7 million) relates
to changes in credit risk. The cumulative fair value movement
relating to changes in credit risk was a loss of $5.2 million (2006:
a loss of $5.4 million).
As at 31 December 2007, the amount the Group is contractually
obliged to pay at maturity to the holders of these obligations was
$52 million (2006: $68 million) lower than the carrying amount at
fair value.
The change in fair value attributable to credit risk was determined
by comparing fair value movements in risk-free debt instruments
with similar maturities, to the changes in fair value of liabilities
designated at fair value through profit or loss.
32. Debt Securities in Issue
2007 2006
Certificates of deposit of $100,000
or more$million
Other debt securities
in issue$million
Total$million
Certificates of deposit of $100,000
or more$million
Other debt securities
in issue $million
Total$million
Debt securities in issue 8,502 18,635 27,137 10,939 12,575 23,514
Debt securities in issue included within:
Financial liabilities held at fair value
through profit or loss (note 31) 951 4,065 5,016 1,154 2,131 3,285
9,453 22,700 32,153 12,093 14,706 26,799

www.standardchartered.com
Fin
an
cia
l S
tate
men
ts a
nd
No
tes t
o t
he A
cco
un
ts
127
33. Structure of Deposits
The following tables set out the structure of the Group’s deposits by principal geographic areas as at 31 December 2007 and
31 December 2006:
2007
Asia Pacific
Hong Kong
$million Singapore
$million Malaysia$million
Korea$million
OtherAsia
Pacific$million
India$million
Middle East & Other
S Asia $million
Africa $million
Americas UK &
Europe$million
Total$million
Non-interest bearing current and
demand accounts 3,838 2,310 639 91 1,818 2,569 2,915 1,768 1,189 17,137
Interest bearing current accounts
and savings deposits 22,971 8,062 2,598 13,287 18,658 1,843 5,600 2,784 7,730 83,533
Time deposits 21,734 10,892 6,608 12,172 19,529 4,757 6,929 1,380 20,912 104,913
Other deposits 32 20 208 1,223 815 317 593 452 1,938 5,598
Total 48,575 21,284 10,053 26,773 40,820 9,486 16,037 6,384 31,769 211,181
Deposits by banks 1,128 1,548 883 6,964 5,464 585 2,039 568 9,406 28,585
Customer accounts 47,447 19,736 9,170 19,809 35,356 8,901 13,998 5,816 22,363 182,596
48,575 21,284 10,053 26,773 40,820 9,486 16,037 6,384 31,769 211,181
Debt securities in issue 545 2,065 792 19,701 2,830 1,556 22 141 4,501 32,153
Total 49,120 23,349 10,845 46,474 43,650 11,042 16,059 6,525 36,270 243,334
2006
Asia Pacific
Hong Kong
$million Singapore
$million Malaysia$million
Korea$million
OtherAsia
Pacific$million
India$million
Middle East & Other S Asia
$million Africa
$million
Americas UK &
Europe$million
Total$million
Non-interest bearing current and
demand accounts 3,320 1,722 1,435 163 2,123 2,082 3,654 1,649 894 17,042
Interest bearing current accounts
and savings deposits 16,904 4,821 1,002 15,274 16,545 1,456 2,985 1,585 5,529 66,101
Time deposits 18,961 9,754 5,211 16,682 12,293 4,073 6,901 1,575 13,574 89,024
Other deposits 14 7 750 1,756 1,507 241 568 140 260 5,243
Total 39,199 16,304 8,398 33,875 32,468 7,852 14,108 4,949 20,257 177,410
Deposits by banks 734 1,276 597 9,297 5,869 871 1,968 323 7,187 28,122
Customer accounts 38,465 15,028 7,801 24,578 26,599 6,981 12,140 4,626 13,070 149,288
39,199 16,304 8,398 33,875 32,468 7,852 14,108 4,949 20,257 177,410
Debt securities in issue 627 1,087 992 17,561 1,597 932 12 171 3,820 26,799
Total 39,826 17,391 9,390 51,436 34,065 8,784 14,120 5,120 24,077 204,209

Standard Chartered Annual Report and Accounts 2007Standard Chartered Annual Report and Accounts 2007
Notes to the Accounts continued
128
34. Other Liabilities
2007 $million
2006*
$million
Notes in circulation 2,862 2,605
Cash-settled share based payments 73 50
Other liabilities 11,807 8,676
14,742 11,331
* Amounts have been restated as explained in note 51 on page 154.
Hong Kong currency notes in circulation of $2,862 million (2006: $2,605 million) are secured by the government of Hong Kong
certificates of indebtedness of the same amount included in other assets (note 28). The Company’s liability for cash-settled share
based payments as at 31 December 2007 is $73 million (2006: $50 million).
35. Provisions for Liabilities and Charges
Provision for credit
commitments$million
Other provisions
$million Total
$million
At 1 January 2007 28 17 45
Exchange translation differences – 1 1
(Release)/charge against profit (3) 27 24
Provisions utilised (3) (27) (30)
Other (4) 2 (2)
At 31 December 2007 18 20 38
Provision for credit commitments comprises those undrawn contractually committed facilities where there is doubt as to the borrowers’
ability to meet their repayment obligations.
36. Retirement Benefit Obligations
Retirement benefit obligations comprise:
2007 $million
2006*
$million
Defined benefit schemes obligation 313 541
Defined contribution schemes obligation 9 12
Net book amount 322 553
* Amounts have been restated as explained in note 51 on page 154.
2007 $million
2006*
$million
At 1 January 553 476
Exchange translation differences 7 48
Acquisitions 1 118
Charge against profit (net of finance income) 213 166
Change in net liability (452) (255)
At 31 December 322 553
* Amounts have been restated as explained in note 51 on page 154.
Retirement benefit charge comprises:
2007 $million
2006$million
Defined benefit schemes 110 96
Defined contribution schemes 103 70
Charge against profit (note 8) 213 166
The 2007 charge is presented net and includes a finance charge of $11 million (2006: $6 million).

www.standardchartered.com
Fin
an
cia
l S
tate
men
ts a
nd
No
tes t
o t
he A
cco
un
ts
129
36. Retirement Benefit Obligations continued
UK Fund
The financial position of the Group’s principal retirement benefit
scheme, the Standard Chartered Pension Fund (the ‘Fund’)
(a defined benefit scheme), is assessed in the light of the advice
of an independent qualified actuary. The most recent actuarial
assessment of the Fund for the purpose of funding was performed
as at 31 December 2005 by M. Slack, Fellow of the Institute
of Actuaries, of Lane, Clark and Peacock Actuaries, using
the projected unit method. The assumptions having the most
significant effect on the outcome of this valuation were:
Return from gilts 3.95 per cent per annum
Return from return seeking assets 5.70 per cent per annum
General increase in salaries 4.40 per cent per annum
Rate of price inflation 2.90 per cent per annum
Increase in pensions:
In deferment (where applicable) 2.90 per cent per annum
In payment* (pre April 1997 service) 2.70 per cent per annum
In payment (post April 1997 service) 2.20 - 2.90 per cent per annum
* Applies to discretionary increases and some guaranteed increases.
Applying these assumptions, at the valuation date the market
value of the assets of the Fund ($1,772 million) was sufficient to
cover 99.5 per cent of the benefits that had accrued to members.
Additional contributions of $8.4 million were paid during 2007.
Additional contributions of $5.6 million are payable in 2008 and
$1.8 million in each of 2009 and 2010.
Contributions paid to the Fund during 2007 were $24 million
(2006: $19 million) and regular contributions were set at 32.5
per cent of pensionable salary for all members. With effect
from 1 July 1998 the Fund was closed to new entrants and
new employees have subsequently been offered membership
of a defined contribution scheme. Due to the closure of the
Fund to new entrants, the current service cost will increase
as a percentage of pensionable pay as the members
approach retirement.
Pension costs for the purpose of these accounts were assessed
using the projected unit method, and the assumptions set out
below were based on market data at the date of calculation.
Overseas Schemes
The principal overseas defined benefit arrangements operated
by the Group are in Hong Kong, India, Jersey, Korea, Taiwan
and the United States.
The disclosures required under IAS 19 have been calculated
by qualified independent actuaries based on the most recent
full actuarial valuations updated, where necessary, to
31 December 2007.
Separate figures are disclosed for the UK Fund, Overseas
Funded Defined Benefit, Post-retirement Medical and Other
Unfunded Schemes.
The financial assumptions used at 31 December 2007 were:
Funded Defined Benefit Schemes
UK Fund** Overseas Scheme*
2007%
2006 %
2007 %
2006%
Price inflation 3.20 3.00 1.50 - 4.50 1.50 - 4.50
Salary increases 4.70 4.50 3.50 - 6.00 3.25 - 5.50
Pension increases 3.10 2.90 0.00 - 3.10 0.00 - 2.90
Discount rate 5.90 5.20 2.50 - 8.00 2.25 - 8.00
Post-retirement medical trend rate N/A N/A N/A N/A
* The range of assumptions shown is for the main funded defined benefit overseas schemes in Hong Kong, India, Jersey, Korea, Taiwan and the United States.
These comprise over 90 per cent of the total liabilities of funded overseas schemes.
** The assumption for life expectancy for the UK fund assumes that a male member currently aged 60 will live for 27 years (2006: 26 years) and a female member
30 years (2006: 29 years) and a male member currently aged 40 will live for 28 years (2006: 27 years) and a female member 31 years (2006: 30 years) after their
60th birthday.

Standard Chartered Annual Report and Accounts 2007Standard Chartered Annual Report and Accounts 2007
Notes to the Accounts continued
130 130
36. Retirement Benefit Obligations continued
Unfunded Schemes
Post-retirement Medical* Other
2007
% 2006
% 2007
% 2006
%
Price inflation 2.70 2.70 1.50 - 7.00 2.50 - 7.00
Salary increases 4.00 4.00 3.50 - 9.00 4.00 - 9.00
Pension increases N/A N/A 0.00 - 3.10 0.00 - 2.90
Discount rate 6.00 6.00 2.75 - 10.00 3.00 - 10.50
Post-retirement medical rate* 8% in 2007 reducing by
1% per annum to
5% in 2010
9% in 2006 reducing by
1% per annum to
5% in 2010
N/A N/A
* The Post-retirement Medical plan is in the United States.
The assets and liabilities of the schemes, attributable to defined benefit members, at 31 December 2007 were:
Funded Defined Benefit Schemes Unfunded Schemes
UK Fund Overseas Schemes Post-retirement Medical Other
At 31 December 2007
Expected return on assets %
Value$million
Expected return on assets %
Value$million
Expected return on assets %
Value $million
Expected return on assets %
Value$million
Equities 8.50 628 8.30 - 13.00 224 N/A N/A N/A N/A
Bonds 4.80 1,188 4.25 - 10.00 186 N/A N/A N/A N/A
Property N/A – 5.90 - 11.00 3 N/A N/A N/A N/A
Others 4.80 97 2.50 - 8.00 162 N/A N/A N/A N/A
Total market value of assets 1,913 575 N/A N/A
Present value of the schemes’ liabilities (1,931) (602) (11) (257)
Net pension liability (18) (27) (11) (257)
Funded Defined Benefit Schemes Unfunded Schemes
UK Fund Overseas Schemes Post-retirement Medical Other*
At 31 December 2006
Expected return on assets %
Value$million
Expected return on assets %
Value$million
Expected return on assets %
Value $million
Expected return on assets %
Value$million
Equities 7.50 570 8.00 - 14.00 210 N/A N/A N/A N/A
Bonds 4.50 1,144 4.25 - 8.00 155 N/A N/A N/A N/A
Property N/A – 7.00 - 12.00 3 N/A N/A N/A N/A
Others 4.50 108 2.50 - 5.10 149 N/A N/A N/A N/A
Total market value of assets 1,822 517 N/A N/A
Present value of the schemes’ liabilities* (1,982) (542) (9) (347)
Net pension liability (160) (25) (9) (347)
* Amounts have been restated as explained in note 51 on page 154.
Funded Defined Benefit Schemes Unfunded Schemes
UK Fund Overseas Schemes Post-retirement Medical Other
At 31 December 2005 Value
$million Value
$million Value
$million Value
$million
Total market value of assets 1,550 380 N/A N/A
Present value of the schemes’ liabilities (1,785) (403) (11) (196)
Net pension liability (235) (23) (11) (196)
At 31 December 2004
Total market value of assets 1,596 317 N/A N/A
Present value of the schemes’ liabilities (1,679) (338) (11) (45)
Net pension liability (83) (21) (11) (45)
The range of assumptions shown is for the main Overseas Schemes in Hong Kong, India, Jersey, Korea, Taiwan and the United States.
The expected return on plan assets is set by reference to historical returns in each of the main asset classes, current market indicators
such as long term bond yields and the expected long term strategic asset allocation of each plan.

www.standardchartered.com
Fin
an
cia
l S
tate
men
ts a
nd
No
tes t
o t
he A
cco
un
ts
131
36. Retirement Benefit Obligations continued
The pension cost for defined benefit schemes was:
Funded Defined Benefit Schemes Unfunded Schemes
Year ending 31 December 2007 UK Fund$million
Overseas Schemes
$million
Post- retirement
Medical $million
Other $million
Total$million
Current service cost 18 52 – 25 95
Past service cost 1 4 – 2 7
Gain on settlements and curtailments – – – (3) (3)
Expected return on pension scheme assets (100) (32) – – (132)
Interest on pension scheme liabilities 100 24 1 18 143
Total charge to profit before deduction of tax 19 48 1 42 110
Gain on assets in excess of expected return* (28) (2) – – (30)
Experience (gain)/loss on liabilities (113) 12 2 (108) (207)
Total (gain)/loss recognised directly in Statement of
Recognised Income and Expense before tax (141) 10 2 (108) (237)
Deferred taxation 44 – – 27 71
Total (gain)/loss after tax (97) 10 2 (81) (166)
* The actual return on the UK fund assets was $128 million and on overseas scheme assets was $34 million.
The total cumulative amount recognised directly in the Statement of Recognised Income and Expense before tax to date is a gain
of $186 million (2006: loss of $51 million).
Funded Defined Benefit Schemes Unfunded Schemes
Year ending 31 December 2006 UK Fund
$million
Overseas Schemes
$million
Post- retirement
Medical $million
Other $million
Total$million
Current service cost 21 42 – 17 80
Past service cost 9 1 – (1) 9
Loss on settlements and curtailments 1 – – – 1
Expected return on pension scheme assets (93) (23) – – (116)
Interest on pension scheme liabilities 92 19 1 10 122
Total charge to profit before deduction of tax 30 39 1 26 96
Gain on assets in excess of expected return* (23) (27) – – (50)
Experience (gain)/loss on liabilities (90) 20 (2) 18 (54)
Total (gain)/loss recognised directly in Statement of
Recognised Income and Expense before tax (113) (7) (2) 18 (104)
Deferred taxation 34 3 – 1 38
Total (gain)/loss after tax (79) (4) (2) 19 (66)
* The actual return on the UK fund assets was $116 million and on overseas scheme assets was $50 million.
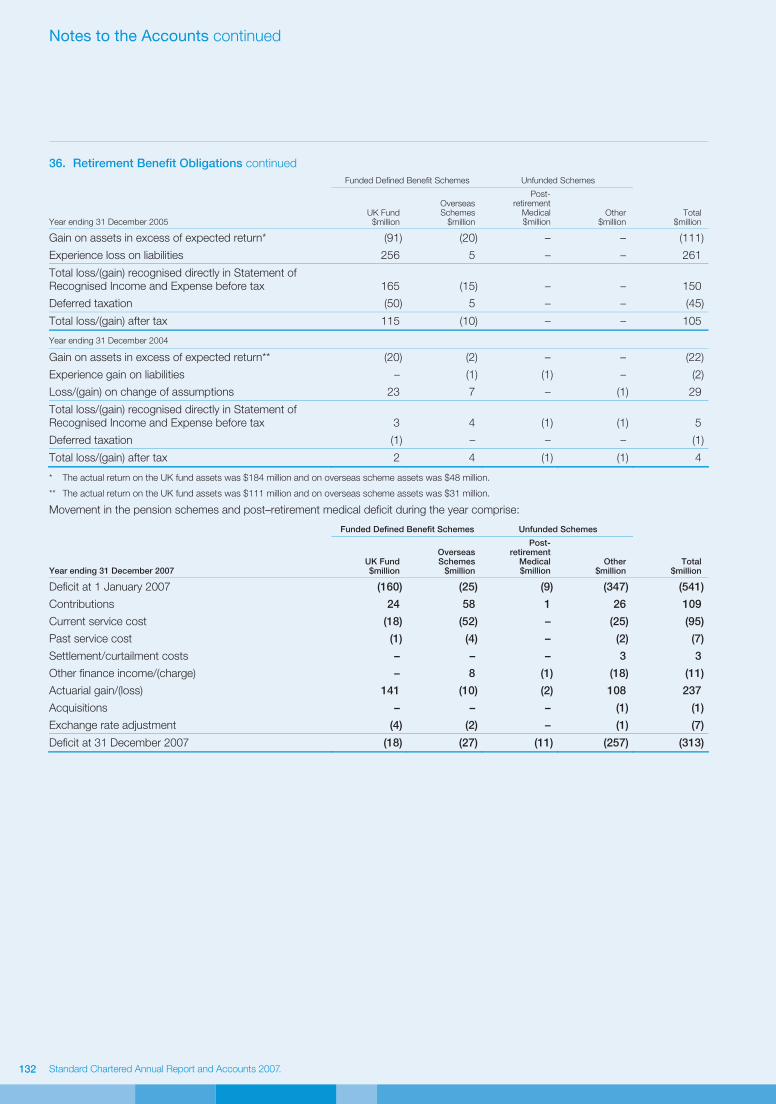
Standard Chartered Annual Report and Accounts 2007Standard Chartered Annual Report and Accounts 2007
Notes to the Accounts continued
132 132
36. Retirement Benefit Obligations continued
Funded Defined Benefit Schemes Unfunded Schemes
Year ending 31 December 2005 UK Fund
$million
Overseas Schemes
$million
Post- retirement
Medical$million
Other $million
Total$million
Gain on assets in excess of expected return* (91) (20) – – (111)
Experience loss on liabilities 256 5 – – 261
Total loss/(gain) recognised directly in Statement of
Recognised Income and Expense before tax 165 (15) – – 150
Deferred taxation (50) 5 – – (45)
Total loss/(gain) after tax 115 (10) – – 105
Year ending 31 December 2004
Gain on assets in excess of expected return** (20) (2) – – (22)
Experience gain on liabilities – (1) (1) – (2)
Loss/(gain) on change of assumptions 23 7 – (1) 29
Total loss/(gain) recognised directly in Statement of
Recognised Income and Expense before tax 3 4 (1) (1) 5
Deferred taxation (1) – – – (1)
Total loss/(gain) after tax 2 4 (1) (1) 4
* The actual return on the UK fund assets was $184 million and on overseas scheme assets was $48 million.
** The actual return on the UK fund assets was $111 million and on overseas scheme assets was $31 million.
Movement in the pension schemes and post–retirement medical deficit during the year comprise:
Funded Defined Benefit Schemes Unfunded Schemes
Year ending 31 December 2007 UK Fund$million
Overseas Schemes
$million
Post- retirement
Medical$million
Other $million
Total$million
Deficit at 1 January 2007 (160) (25) (9) (347) (541)
Contributions 24 58 1 26 109
Current service cost (18) (52) – (25) (95)
Past service cost (1) (4) – (2) (7)
Settlement/curtailment costs – – – 3 3
Other finance income/(charge) – 8 (1) (18) (11)
Actuarial gain/(loss) 141 (10) (2) 108 237
Acquisitions – – – (1) (1)
Exchange rate adjustment (4) (2) – (1) (7)
Deficit at 31 December 2007 (18) (27) (11) (257) (313)

www.standardchartered.com
Fin
an
cia
l S
tate
men
ts a
nd
No
tes t
o t
he A
cco
un
ts
133
36. Retirement Benefit Obligations continued
Funded Defined Benefit Schemes Unfunded Schemes
Year ending 31 December 2006 UK Fund
$million
Overseas Schemes
$million
Post- retirement
Medical $million
Other*
$million
Total*
$million
Deficit at 1 January 2006 (235) (23) (11) (196) (465)
Contributions 19 51 1 11 82
Current service cost (21) (42) – (17) (80)
Past service cost (9) (1) – 1 (9)
Settlement/curtailment costs (1) – – – (1)
Other finance income/(charge) 1 4 (1) (10) (6)
Actuarial gain/(loss) 113 7 2 (18) 104
Acquisitions – (25) – (93) (118)
Exchange rate adjustment (27) (3) – (18) (48)
Reclassifications – 7 – (7) –
Deficit at 31 December 2006 (160) (25) (9) (347) (541)
* Amounts have been restated as explained in note 51 on page 154.
Movement in the pension schemes and post–retirement medical gross assets and obligations during the year comprise:
Year ending 31 December 2007
Assets
$million Obligations
$million Total
$million
Deficit at 1 January 2007 2,339 (2,880) (541)
Contributions 109 – 109
Current service cost – (95) (95)
Past service cost – (7) (7)
Settlement/curtailment costs – 3 3
Interest cost – (143) (143)
Expected return on scheme assets 132 – 132
Benefits paid out (146) 146 –
Actuarial gain 30 207 237
Acquisitions – (1) (1)
Exchange rate adjustment 24 (31) (7)
Deficit at 31 December 2007 2,488 (2,801) (313)
Year ending 31 December 2006
Assets
$million
Obligations*
$million
Total*
$million
Deficit at 1 January 2006 1,930 (2,395) (465)
Contributions 82 – 82
Current service cost – (80) (80)
Past service cost – (9) (9)
Settlement/curtailment costs – (1) (1)
Interest cost – (122) (122)
Expected return on scheme assets 116 – 116
Benefits paid out (119) 119 –
Actuarial gain 50 54 104
Acquisitions 48 (166) (118)
Exchange rate adjustment 232 (280) (48)
Deficit at 31 December 2006 2,339 (2,880) (541)
* Amounts have been restated as explained in note 51 on page 154.
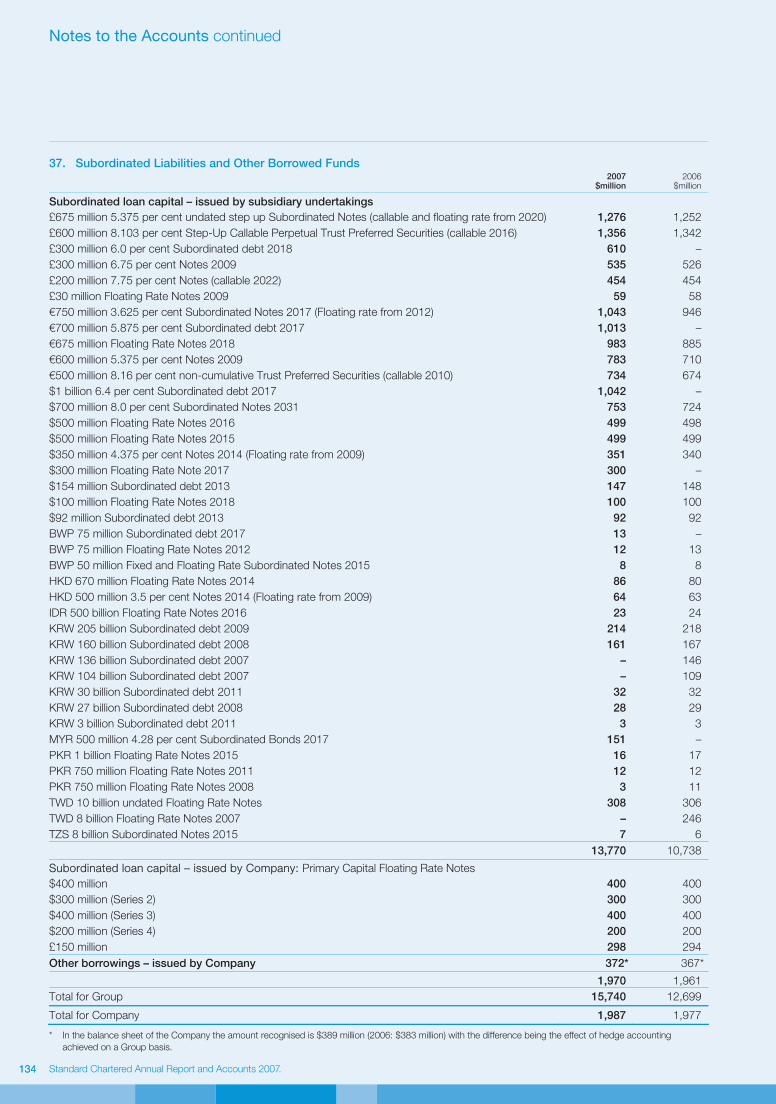
Standard Chartered Annual Report and Accounts 2007Standard Chartered Annual Report and Accounts 2007
Notes to the Accounts continued
134 134
37. Subordinated Liabilities and Other Borrowed Funds
2007
$million 2006
$million
Subordinated loan capital – issued by subsidiary undertakings
£675 million 5.375 per cent undated step up Subordinated Notes (callable and floating rate from 2020) 1,276 1,252
£600 million 8.103 per cent Step-Up Callable Perpetual Trust Preferred Securities (callable 2016) 1,356 1,342
£300 million 6.0 per cent Subordinated debt 2018 610 –
£300 million 6.75 per cent Notes 2009 535 526
£200 million 7.75 per cent Notes (callable 2022) 454 454
£30 million Floating Rate Notes 2009 59 58
€750 million 3.625 per cent Subordinated Notes 2017 (Floating rate from 2012) 1,043 946
€700 million 5.875 per cent Subordinated debt 2017 1,013 –
€675 million Floating Rate Notes 2018 983 885
€600 million 5.375 per cent Notes 2009 783 710
€500 million 8.16 per cent non-cumulative Trust Preferred Securities (callable 2010) 734 674
$1 billion 6.4 per cent Subordinated debt 2017 1,042 –
$700 million 8.0 per cent Subordinated Notes 2031 753 724
$500 million Floating Rate Notes 2016 499 498
$500 million Floating Rate Notes 2015 499 499
$350 million 4.375 per cent Notes 2014 (Floating rate from 2009) 351 340
$300 million Floating Rate Note 2017 300 –
$154 million Subordinated debt 2013 147 148
$100 million Floating Rate Notes 2018 100 100
$92 million Subordinated debt 2013 92 92
BWP 75 million Subordinated debt 2017 13 –
BWP 75 million Floating Rate Notes 2012 12 13
BWP 50 million Fixed and Floating Rate Subordinated Notes 2015 8 8
HKD 670 million Floating Rate Notes 2014 86 80
HKD 500 million 3.5 per cent Notes 2014 (Floating rate from 2009) 64 63
IDR 500 billion Floating Rate Notes 2016 23 24
KRW 205 billion Subordinated debt 2009 214 218
KRW 160 billion Subordinated debt 2008 161 167
KRW 136 billion Subordinated debt 2007 – 146
KRW 104 billion Subordinated debt 2007 – 109
KRW 30 billion Subordinated debt 2011 32 32
KRW 27 billion Subordinated debt 2008 28 29
KRW 3 billion Subordinated debt 2011 3 3
MYR 500 million 4.28 per cent Subordinated Bonds 2017 151 –
PKR 1 billion Floating Rate Notes 2015 16 17
PKR 750 million Floating Rate Notes 2011 12 12
PKR 750 million Floating Rate Notes 2008 3 11
TWD 10 billion undated Floating Rate Notes 308 306
TWD 8 billion Floating Rate Notes 2007 – 246
TZS 8 billion Subordinated Notes 2015 7 6
13,770 10,738
Subordinated loan capital – issued by Company: Primary Capital Floating Rate Notes
$400 million 400 400
$300 million (Series 2) 300 300
$400 million (Series 3) 400 400
$200 million (Series 4) 200 200
£150 million 298 294
Other borrowings – issued by Company 372* 367*
1,970 1,961
Total for Group 15,740 12,699
Total for Company 1,987 1,977
* In the balance sheet of the Company the amount recognised is $389 million (2006: $383 million) with the difference being the effect of hedge accounting
achieved on a Group basis.

www.standardchartered.com
Fin
an
cia
l S
tate
men
ts a
nd
No
tes t
o t
he A
cco
un
ts
135
37. Subordinated Liabilities and Other Borrowed Funds continued
All subordinated liabilities described above are unsecured,
unguaranteed and subordinated to the claims of other creditors
including without limitation, customer deposits and deposits by
banks. The Group has the right to settle these debt instruments
in certain circumstances as set out in the contractual agreements.
Of the total subordinated liabilities and other borrowings, $10,166
million is at fixed interest rates (2006: $5,118 million).
On 12 April 2007, Standard Chartered Bank (Hong Kong) Limited
issued Lower Tier 2 capital in the form of $300 million Floating Rate
Notes, which have a maturity of 10 years, with an issuer’s call option
after five years.
On 26 April 2007, the Group issued £300 million Lower Tier 2
Step-Up Dated Subordinated notes, which have a maturity of
11 years, with an issuer’s call option after six years.
On 26 September 2007, the Group issued $1,000 million Lower
Tier 2 Notes with a coupon of 6.4 per cent maturing September
2017, and €700 million Lower Tier 2 Notes with a coupon of
5.875 per cent, maturing September 2017.
On 15 November 2007 Standard Chartered Bank Malaysia Berhad
issued MYR500 million Lower Tier 2 Subordinated Unsecured
Floating Rate Notes due 2017, with an issuer’s call option after
five years.
On 27 November 2007, Standard Chartered Bank Botswana Limited
issued BWP75 million Subordinated Unsecured Floating Rate Notes
due 2017, with an issuer’s call option after five years.
38. Share Capital
The authorised share capital of the Company at 31 December 2007
was $5,269 million (2006: $5,113 million) made up of 2,632 million
ordinary shares of $0.50 each, 500 million non-cumulative
irredeemable preference shares of £1 each, 300 million non-
cumulative redeemable preference shares of $5 each and one
million non-cumulative redeemable preference share of €1,000 each.
The available profits of the Company are distributed to the holders
of the issued preference shares in priority to payments made to
holders of the ordinary shares and in priority to, or pari passu
with, any payments to the holders of any other class of shares in
issue. On a winding up, the assets of the Company are applied to
the holders of the preference shares in priority to any payment to
the ordinary shareholders and in priority to, or pari passu with, the
holders of any other shares in issue, for an amount equal to any
dividends accrued and/or payable and the nominal value of the
shares together with any premium as determined by the Board.
The redeemable preference shares are redeemable at the paid
up amount (which includes premium) at the option of the
Company in accordance with the terms of the shares. The
holders of the preference shares are not entitled to attend or vote
at any general meeting except where any relevant dividend due is
not paid in full or where a resolution is proposed varying the rights
of the preference shares.
As at 31 December 2007, 15,000 $5 non-cumulative redeemable
preference shares were in issue. The irredeemable preference
shares of £1 each are classified as other borrowed funds as
required by IAS 32.
Group and Company
Number ofordinary shares
(millions)
Ordinary share capital
$million
Preference share capital
$million Total
$million
At 1 January 2006 1,316 658 2 660
Capitalised on scrip dividend 15 7 – 7
Shares repurchased – – (2) (2)
Shares issued 53 27 – 27
At 31 December 2006 1,384 692 – 692
Capitalised on scrip dividend 16 8 – 8
Shares issued 10 5 – 5
At 31 December 2007 1,410 705 – 705 On 12 January 2006, the Company issued 3,401,290 new
ordinary shares at an average price of 1301 pence per share
representing approximately 0.3 per cent of the Company’s
existing issued ordinary share capital. The middle market price
on 12 January 2006 was 1323 pence. The issue of ordinary
shares was used to acquire 20 per cent of Fleming Family &
Partners Limited.
On 2 October 2006, the Company repurchased the remaining
328,388 8.9 per cent non-cumulative preference shares. The
preference shares were repurchased at a premium of $326 million
and were cancelled.
On 4 October 2006, the Company issued 48,500,000 ordinary
shares of $0.50 each at a placing price of 1375 pence per share
representing approximately 3.7 per cent of the Company’s
existing issued ordinary share capital. The middle market price on
4 October 2006 was 1363 pence. The proceeds of the issue of
ordinary shares was used to acquire Hsinchu. The placing used
a cash box structure involving a Jersey subsidiary (‘JerseyCo’)
which was 89 per cent owned by the Company prior to the
transaction. In return for an issue of shares by the Company
to the placees, the net proceeds of the placing were paid to
JerseyCo. Pursuant to the issue of those shares, the Company
acquired the remaining share capital of JerseyCo, being all of
its redeemable preference shares and the 11 per cent of the
ordinary shares it did not own. Under this structure merger relief
applies under Section 131 of the Companies Act 1985 which
provides relief from the requirements under Section 130 of the
Companies Act 1985 to create a share premium account.
JerseyCo then redeemed its redeemable shares in exchange
for the placing proceeds.
On 8 December 2006, the Company issued 7,500 non-
cumulative redeemable preference shares of $5 each at a placing
price of $100,000 each. The shares are redeemable at the option
of the Company in accordance with the terms of the shares at
their paid up amount (which includes premium) and have
discretionary dividend payments and are accordingly classified as
equity as required by IAS 32. The shares were issued to fund the
continuing business of the Group.

Standard Chartered Annual Report and Accounts 2007Standard Chartered Annual Report and Accounts 2007
Notes to the Accounts continued
136
38. Share Capital continued
On 10 May 2007, the Company issued 12,765,274 new ordinary
shares instead of the 2006 final dividend. On 10 October 2007,
the Company issued 3,163,466 new ordinary shares instead of
the 2007 interim dividend.
On 25 May 2007, the Company issued 7,500 non-cumulative
redeemable preference shares of $5 each at a placing price of
$100,000 each. The shares are redeemable at the option of the
Company in accordance with the terms of the shares at the paid
up amount (which includes premium) and have discretionary
dividend payments and are accordingly classified as equity
as required by IAS 32. The shares were issued to fund the
continuing business of the Group.
During the year, 9,012,891 ordinary shares were issued under
the Company’s employee share plans at prices between nil and
1064 pence.
The holding of Standard Chartered PLC shares for the
beneficiaries of the Group’s share based award schemes
is set out in note 39.
39. Reserves
Group
Share premium account* $million
Capitalreserve$million
Capital redemption
reserve$million
Mergerreserve$million
Available- for-sale reserve$million
Cash flow hedge
reserve$million
Translation reserve $million
Retainedearnings$million
Total $million
At 1 January 2006 3,034 5 11 1,944 23 (20) 6 6,219 11,222
Recognised income and expense – – – – 387 71 672 2,354 3,484
Capitalised on scrip dividend (7) – – – – – – – (7)
Shares issued, net of expenses 838 – – 1,205 – – – – 2,043
Shares repurchased* – – 2 – – – – (328) (326)
Net own shares adjustment – – – – – – – 149 149
Share option expense and related
taxation – – – – – – – 115 115
Dividends, net of scrip – – – – – – – (519) (519)
At 31 December 2006 3,865 5 13 3,149 410 51 678 7,990 16,161
Recognised income and expense – – – – 340 6 303 3,010 3,659
Capitalised on scrip dividend (8) – – – – – – – (8)
Shares issued, net of expenses 856 – – – – – – – 856
Net own shares adjustment – – – – – – – 24 24
Share option expense and related
taxation – – – – – – – 55 55
Dividends, net of scrip – – – – – – – (601) (601)
At 31 December 2007 4,713 5 13 3,149 750 57 981 10,478 20,146
* The premium paid on the 8.9 per cent non-cumulative preference shares redeemed in 2006 has been reclassified as a deduction from retained earnings rather
than a deduction from the share premium account. Subsequently it has been deemed not appropriate to apply the relief given in section 160(2) of the Companies
Act 1985 that allows a premium payable on redemption to be paid out of the proceeds of a fresh issue of shares made for the purpose of the redemption. This is
because the fresh issue of shares contemplated for the redemption was not complete at the date of the redemption.
Transaction costs relating to share issues deducted from
reserves account total $5 million (2006: $20 million).
The cumulative amount of goodwill on the acquisition of
subsidiary and associated undertakings written off against
Group reserves since 1973 is $27 million (2006: $27 million).
Capital reserves represent the exchange difference on
redenomination of share capital and share premium from
sterling to US dollars in 2001.
Capital redemption reserve represents the nominal value of
the repurchase of preference shares redeemed.
The merger reserve represents the premium arising on the
shares issued to assist in the funding of certain of the Group’s
acquisitions. The issues were made using a financing structure
which required the Company to create a merger reserve under
section 131 of the Companies Act 1985.
Available-for-sale reserve is the fair value movement of financial
assets classified as available-for-sale. Gains and losses are
deferred to this reserve until such time as the underlying asset
is sold or matures.
Cash flow hedge reserve is the fair value movement of derivatives
that meet the criteria of a cash flow hedge. Gains and losses are
deferred to this reserve until such time as the underlying hedged
item affects profit and loss.
Translation reserve represents the cumulative foreign exchange
gains and losses on translation of the net investment of the Group
in foreign operations. Since 1 January 2004, gains and losses are
deferred to this reserve until such time as the underlying foreign
operation is disposed. Gains and losses arising from derivatives
used as hedges of net investments are netted against the foreign
exchange gains and losses on translation of the net investment of
the foreign operations.
Retained earnings are the carried forward recognised income and
expenses of the Group plus current period recognised income
and expenses less dividend distribution, treasury shares and
share option expenses.
A substantial part of the Group’s reserves are held in overseas
subsidiary undertakings and branches, principally to support local
operations or to comply with local regulations. The maintenance
of local regulatory capital ratios could potentially restrict the
amount of reserves which can be remitted. In addition, if these
overseas reserves were to be remitted, further unprovided
taxation liabilities might arise.
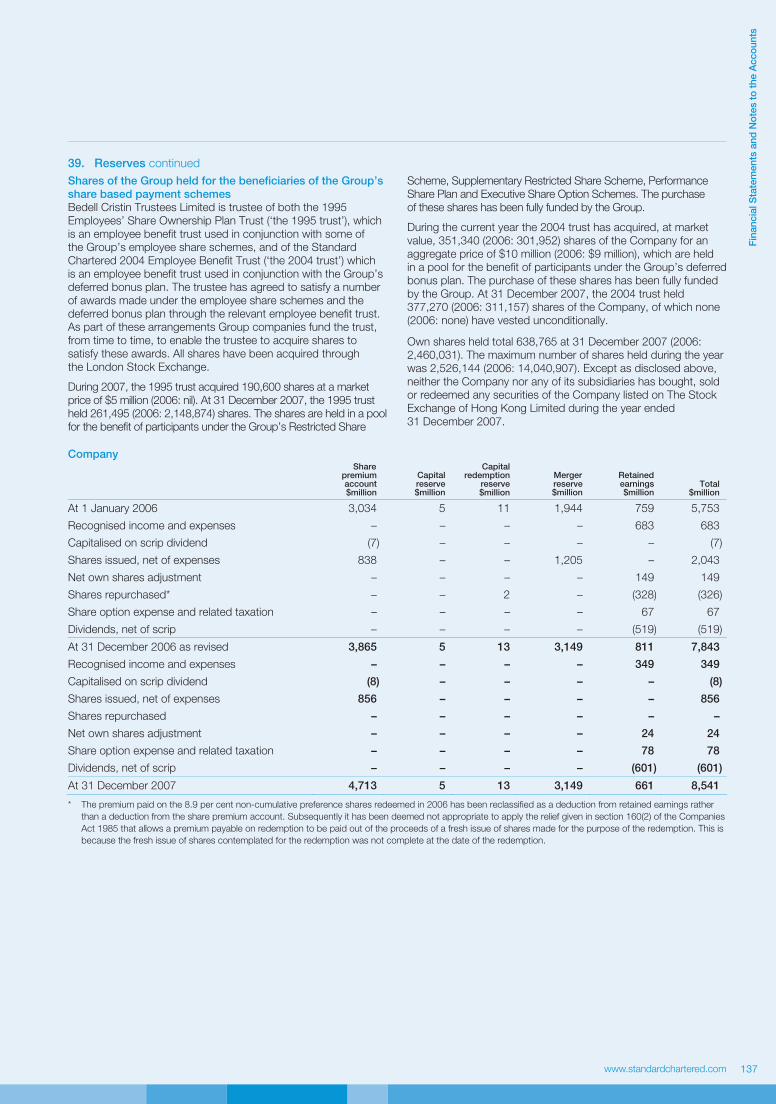
www.standardchartered.com
Fin
an
cia
l S
tate
men
ts a
nd
No
tes t
o t
he A
cco
un
ts
137
39. Reserves continued
Shares of the Group held for the beneficiaries of the Group’s
share based payment schemes
Bedell Cristin Trustees Limited is trustee of both the 1995
Employees’ Share Ownership Plan Trust (‘the 1995 trust’), which
is an employee benefit trust used in conjunction with some of
the Group’s employee share schemes, and of the Standard
Chartered 2004 Employee Benefit Trust (‘the 2004 trust’) which
is an employee benefit trust used in conjunction with the Group’s
deferred bonus plan. The trustee has agreed to satisfy a number
of awards made under the employee share schemes and the
deferred bonus plan through the relevant employee benefit trust.
As part of these arrangements Group companies fund the trust,
from time to time, to enable the trustee to acquire shares to
satisfy these awards. All shares have been acquired through
the London Stock Exchange.
During 2007, the 1995 trust acquired 190,600 shares at a market
price of $5 million (2006: nil). At 31 December 2007, the 1995 trust
held 261,495 (2006: 2,148,874) shares. The shares are held in a pool
for the benefit of participants under the Group’s Restricted Share
Scheme, Supplementary Restricted Share Scheme, Performance
Share Plan and Executive Share Option Schemes. The purchase
of these shares has been fully funded by the Group.
During the current year the 2004 trust has acquired, at market
value, 351,340 (2006: 301,952) shares of the Company for an
aggregate price of $10 million (2006: $9 million), which are held
in a pool for the benefit of participants under the Group’s deferred
bonus plan. The purchase of these shares has been fully funded
by the Group. At 31 December 2007, the 2004 trust held
377,270 (2006: 311,157) shares of the Company, of which none
(2006: none) have vested unconditionally.
Own shares held total 638,765 at 31 December 2007 (2006:
2,460,031). The maximum number of shares held during the year
was 2,526,144 (2006: 14,040,907). Except as disclosed above,
neither the Company nor any of its subsidiaries has bought, sold
or redeemed any securities of the Company listed on The Stock
Exchange of Hong Kong Limited during the year ended
31 December 2007.
Company
Share premium account$million
Capitalreserve$million
Capital redemption
reserve$million
Merger reserve $million
Retained earnings$million
Total $million
At 1 January 2006 3,034 5 11 1,944 759 5,753
Recognised income and expenses – – – – 683 683
Capitalised on scrip dividend (7) – – – – (7)
Shares issued, net of expenses 838 – – 1,205 – 2,043
Net own shares adjustment – – – – 149 149
Shares repurchased* – – 2 – (328) (326)
Share option expense and related taxation – – – – 67 67
Dividends, net of scrip – – – – (519) (519)
At 31 December 2006 as revised 3,865 5 13 3,149 811 7,843
Recognised income and expenses – – – – 349 349
Capitalised on scrip dividend (8) – – – – (8)
Shares issued, net of expenses 856 – – – – 856
Shares repurchased – – – – – –
Net own shares adjustment – – – – 24 24
Share option expense and related taxation – – – – 78 78
Dividends, net of scrip – – – – (601) (601)
At 31 December 2007 4,713 5 13 3,149 661 8,541
* The premium paid on the 8.9 per cent non-cumulative preference shares redeemed in 2006 has been reclassified as a deduction from retained earnings rather
than a deduction from the share premium account. Subsequently it has been deemed not appropriate to apply the relief given in section 160(2) of the Companies
Act 1985 that allows a premium payable on redemption to be paid out of the proceeds of a fresh issue of shares made for the purpose of the redemption. This is
because the fresh issue of shares contemplated for the redemption was not complete at the date of the redemption.

Standard Chartered Annual Report and Accounts 2007Standard Chartered Annual Report and Accounts 2007
Notes to the Accounts continued
138
40. Minority Interests
$300m 7.267% Hybrid Tier 1 Securities
$million
Other minority*
interests $million
Total$million
At 1 January 2006 336 115 451
Arising on acquisitions* – 15 15
Income/expenses in equity attributable to minority interests – 35 35
Other profits attributable to minority interests 19 57 76
Recognised income and expense 19 92 111
Distributions (22) (33) (55)
Other increases – 20 20
At 31 December 2006 333 209 542
Arising on acquisition – 3 3
Income/expenses in equity attributable to minority interests – 48 48
Other profits attributable to minority interests 19 129 148
Recognised income and expense 19 177 196
Distributions (22) (98) (120)
Reductions – (20) (20)
At 31 December 2007 330 271 601
* Amounts have been restated as explained in note 51 on page 154.
41. Share Based Payments The Group operates a number of share based payment schemes
for its directors and employees.
The total charge for the year relating to employee share based
payment plans was $117 million (2006: $96 million) of which
$78 million (2006: $67 million) relates to equity-settled awards,
and $39 million (2006: $29 million) relates to cash-settled awards.
After deferred tax, the total charge to the income statement was
$99 million (2006: $93 million).
1994 Executive Share Option Scheme (closed)
No awards have been made under this scheme since August 1999
as the scheme was replaced by the 2000 Executive Share Option
Scheme. Executive share options to purchase ordinary shares in
the Company are exercisable after the third, but before the tenth
anniversary of the date of grant. The exercise price is the share
price at the date of grant and options can only be exercised if EPS
increases by at least 15 per cent over three consecutive years.
2000 Executive Share Option Scheme
The 2000 scheme is designed to be internationally competitive and
focus executive directors and their senior management teams on
delivering long-term performance. An EPS performance criterion
must be met before options can be exercised.
Executive share options to purchase ordinary shares in the
Company are exercisable after the third, but before the tenth,
anniversary of the date of grant. The exercise price per share
is the share price at the date of grant and options can only be
exercised if a performance condition is satisfied.
2001 Performance Share Plan
The Performance Share Plan is designed to be an intrinsic part
of total remuneration for the Group’s executive directors and for
a small number of the Group’s most senior executives. It is an
internationally competitive long-term incentive plan that focuses
executives on meeting and exceeding the long-term performance
targets of the Group. The performance criteria which need to be
met are set out in the Directors’ Remuneration Report on pages
75 to 76. Awards of nil price options to acquire shares are granted
to the executives and will normally be exercisable between three
and ten years after the date of grant if the individual is still
employed by the Group. There is provision for earlier exercise
in certain limited circumstances.
1997/2006 Restricted Share Scheme
The Group operates a discretionary Restricted Share Scheme
(‘RSS’) for high performing and high potential staff at any level of the
organisation whom the Group wishes to motivate and retain. Except
upon appointment when an executive director may be granted an
award of restricted shares, the RSS is not applicable to executive
directors, as it has no performance conditions attached to it. 50 per
cent of the award vests two years after the date of grant and the
balance after three years. The awards can be exercised within seven
years of the grant date. The value of shares awarded in any year to
any individual may not exceed two times their base salary.
2006 Supplementary Restricted Share Scheme
In addition, the Group operates a Supplementary Restricted Share
Scheme which can be used to defer part of an employee’s annual
bonus in shares. The plan is principally used for employees in the
global markets area and is similar to the RSS outlined above except
for three important factors: executive directors are specifically
prohibited from the plan; no new shares can be issued to satisfy
awards; and there is no individual annual limit.
2004 Deferred Bonus Plan
Under the 2004 Deferred Bonus Plan, shares are conditionally
awarded instead of all or part of the executive directors’ and certain
senior executives’ annual cash bonus. Further details are contained
in the Directors’ Remuneration Report on pages 75 and 82.
All Employee Sharesave Schemes
No awards have been made under the 1994 UK Sharesave and
1996 International Sharesave schemes since 2003, as these were
replaced by the 2004 UK and International Sharesave schemes.
Under these Sharesave schemes, employees have the choice of
opening a three-year or five-year savings contract. Within a period
of six months after the third or fifth anniversary, as appropriate,
employees may purchase ordinary shares in the Company. The
price at which they may purchase shares is at a discount of up to
20 per cent on the share price at the date of invitation. There are
no performance conditions attached to options granted under all
the employee sharesave schemes.
In some countries in which the Group operates, it is not possible
to operate Sharesave schemes, typically because of securities law,
regulatory or other similar restrictions. In these countries the Group
offers an equivalent cash-based scheme to its employees.

www.standardchartered.com
Fin
an
cia
l S
tate
men
ts a
nd
No
tes t
o t
he A
cco
un
ts
139
41. Share Based Payments continued
1994 Executive Share Option Scheme (‘1994 ESOS’)
Awards made under this scheme are not subject to the valuation criteria of IFRS 2, as all awards are granted prior to 7 November 2002,
and are all vested as at that date.
A reconciliation of option movements over the year to 31 December 2007 and 2006 is shown below: 2007 2006
No. of shares
Weighted average
exercise price No. of shares
Weighted average
exercise price
Outstanding at 1 January 359,207 £8.18 1,114,542 £7.64
Lapsed (18,250) £8.09 (4,830) £7.29
Exercised (330,151) £8.26 (750,505) £7.39
Outstanding at 31 December 10,806 £6.20 359,207 £8.18
Exercisable at 31 December 10,806 £6.20 359,207 £8.18
2007 2006
Range of exercise price for options outstanding
Weighted average
exercise price
Weighted average
remaining contractual life
Weightedaverage
exercise price
Weightedaverage
remainingcontractual life
£6.20 £6.20 0.7 years – –
£6.20/£8.88 – – £8.18 1.1 years
The intrinsic value of vested 1994 ESOS cash-settled awards as at 31 December 2007 was $nil million (2006: $0.3 million).
The weighted average share price at the time the options were exercised during 2007 was £15.34 (2006: £14.20).
2000 Executive Share Option Scheme (‘2000 ESOS’)
No share awards were granted during 2007 or 2006.
A reconciliation of option movements over the year to 31 December 2007 and 2006 is shown below:
2007 2006
No. of shares
Weighted average
exercise price No. of shares
Weighted average
exercise price
Outstanding at 1 January 14,974,196 £8.37 23,634,660 £8.08
Lapsed (282,650) £9.04 (204,514) £9.77
Exercised (6,116,337) £8.47 (8,455,950) £7.52
Outstanding at 31 December 8,575,209 £8.28 14,974,196 £8.37
Exercisable at 31 December 7,931,565 £8.16 8,758,519 £7.63
2007 2006
Range of exercise price for options outstanding
Weighted average
exercise price
Weighted average
remaining contractual life
Weightedaverage
exercise price
Weightedaverage
remainingcontractual life
£6.905/£10.395 £8.28 5.2 years £8.37 6.2 years
The intrinsic value of vested 2000 ESOS cash-settled awards as at 31 December 2007 was $9 million (2006: $6 million).
The weighted average share price at the time the options were exercised during 2007 was £14.36 (2006: £14.63).

Standard Chartered Annual Report and Accounts 2007Standard Chartered Annual Report and Accounts 2007
Notes to the Accounts continued
140
41. Share Based Payments continued
2001 Performance Share Plan (‘2001 PSP’)
Valuation For awards, the fair value is based on the market value less an adjustment to take into account the expected dividends over the
vesting period.
2007 2006
Grant date 17 September 12 March 12 September 11 May 14 March
Share price at grant date £14.69 £14.51 £13.17 £14.60 £14.35
Vesting period (years) 3 3 3 3 3
Expected dividends (yield) (%) 2.9 2.8 3.2 3.0 3.0
Fair value (EPS) (£) 6.74 6.68 6.00 6.67 6.56
Fair value (TSR) (£) 2.92 2.89 2.60 2.89 2.84 The expected dividend yield is based on the historical dividend
yield over the last three years or the three years prior to grant. The
EPS and TSR fair value relates to the performance criteria to be
satisfied as explained in the Directors’ Remuneration Report. The
TSR fair value is derived by discounting 50 per cent of the award
which is subject to the TSR condition by the loss of expected
dividends over the performance period, and the likelihood of
meeting the TSR condition which is calculated by the area under
the TSR vesting schedule curve. The EPS fair value is derived by
discounting 50 per cent of the award by the loss of expected
dividends over the performance period and is adjusted for actual
performance as appropriate.
A reconciliation of option movements over the year to 31 December 2007 and 2006 is shown below:
2007 2006
No. of shares
Weighted average
exercise price No. of shares
Weighted average
exercise price
Outstanding at 1 January 4,976,599 – 3,919,726 –
Granted 2,487,273 – 2,125,493 –
Lapsed (490,718) – (101,878) –
Exercised (1,087,557) – (966,742) –
Outstanding at 31 December 5,885,597 – 4,976,599 –
Exercisable at 31 December 279,028 – 405,798 –
2007 2006
Range of exercise price for options outstanding
Weighted average
exercise price
Weighted average
remaining contractual life
Weighted average
exercise price
Weightedaverage
remainingcontractual life
n/a – 8.3 years – 8.3 years
The intrinsic value of vested 2001 cash-settled awards as at 31 December 2007 was $1 million (2006: $nil million).
The weighted average share price at the time the options were exercised during 2007 was £14.98 (2006: £14.69).
1997/2006 Restricted Share Scheme (‘1997/2006 RSS’)
Valuation For awards, the fair value is based on the market value less an adjustment to take into account the expected dividends over the
vesting period.
2007 2006
Grant date 17 September 12 March 12 September 11 May 14 March
Share price at grant date £14.69 £14.51 £13.17 £14.60 £14.35
Vesting period (years) 2/3 2/3 2/3 2/3 2/3
Expected dividends (yield) (%) 2.9 2.8 3.2 3.0 3.0
Fair value (£) 13.49 13.36 12.00 13.34 13.12
The expected dividend yield is based on the historical dividend yield over the last three years or the three years prior to grant.

www.standardchartered.com
Fin
an
cia
l S
tate
men
ts a
nd
No
tes t
o t
he A
cco
un
ts
141
41. Share Based Payments continued
A reconciliation of option movements over the year to 31 December 2007 and 2006 is shown below:
2007 2006
No. of shares
Weighted average
exercise price No. of shares
Weighted average
exercise price
Outstanding at 1 January 6,298,386 – 6,410,044 –
Granted 2,546,148 – 1,691,508 –
Lapsed (689,603) – (312,453) –
Exercised (1,879,033) – (1,490,713) –
Outstanding at 31 December 6,275,898 – 6,298,386 –
Exercisable at 31 December 1,597,255 – 1,330,250 –
The weighted average share price at the time the options were exercised during 2007 was £15.42 (2006: £14.35).
2007 2006
Range of exercise price for options outstanding
Weighted average
exercise price
Weighted average
remaining contractual life
Weightedaverage
exercise price
Weightedaverage
remainingcontractual life
n/a – 4.3 years – 4.9 years
The intrinsic value of vested 1997/2006 RSS cash-settled awards as at 31 December 2007 was $9 million (2006: $5 million).
2006 Supplementary Restricted Share Scheme (‘2006 SRSS’)
Valuation The first awards under this scheme were made on 12 March 2007.
For awards, the fair value is based on the market value less an adjustment to take into account the expected dividends over the
vesting period.
2007
Grant date 17 September 12 March
Share price at grant date £14.69 £14.51
Vesting period (years) 2/3 2/3
Expected dividends (yield) (%) 2.9 2.8
Fair value (£) 13.49 13.36
The expected dividend yield is based on the historical dividend yield over the last three years or the three years prior to grant.
A reconciliation of option movements over the year to 31 December 2007 is shown below:
2007
No. of shares
Weighted average
exercise price
Outstanding at 1 January – –
Granted 187,602 –
Lapsed – –
Exercised – –
Outstanding at 31 December 187,602 –
Exercisable at 31 December – –
2007
Range of exercise price for options outstanding
Weighted average
exercise price
Weighted average
remainingcontractual life
n/a – 6.5 years
There are no vested 2006 SRSS cash-settled awards as at 31 December 2007.
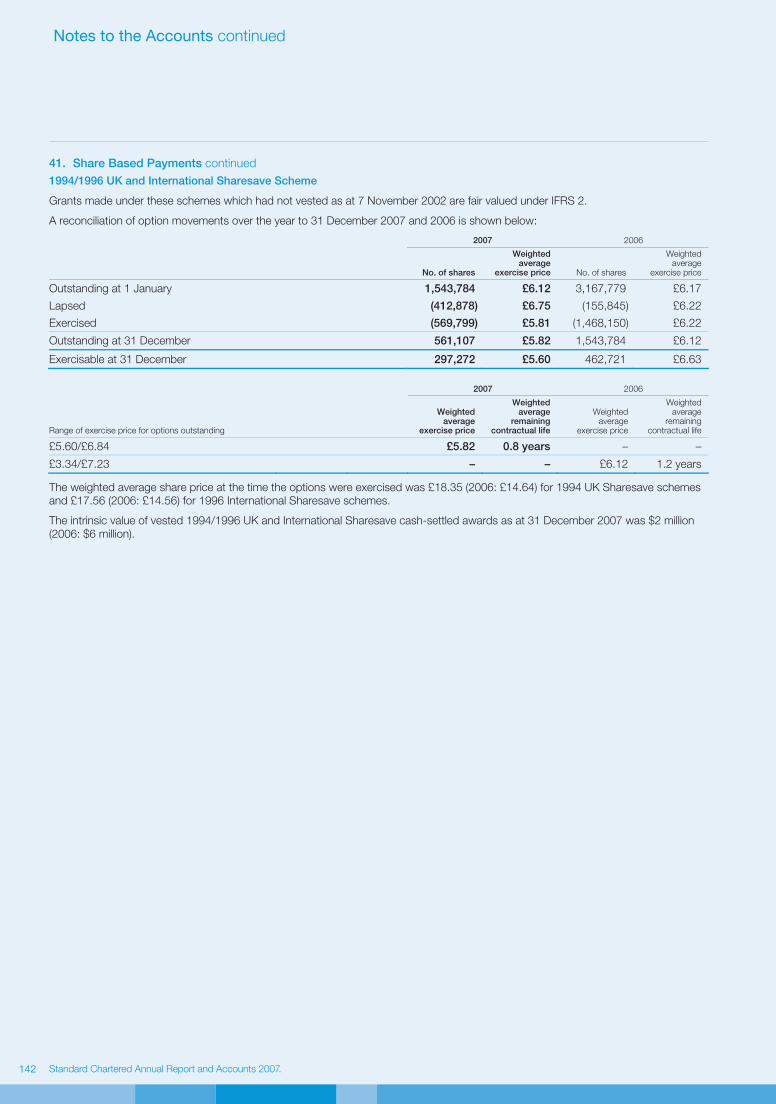
Standard Chartered Annual Report and Accounts 2007Standard Chartered Annual Report and Accounts 2007
Notes to the Accounts continued
142
41. Share Based Payments continued
1994/1996 UK and International Sharesave Scheme
Grants made under these schemes which had not vested as at 7 November 2002 are fair valued under IFRS 2.
A reconciliation of option movements over the year to 31 December 2007 and 2006 is shown below:
2007 2006
No. of shares
Weighted average
exercise price No. of shares
Weighted average
exercise price
Outstanding at 1 January 1,543,784 £6.12 3,167,779 £6.17
Lapsed (412,878) £6.75 (155,845) £6.22
Exercised (569,799) £5.81 (1,468,150) £6.22
Outstanding at 31 December 561,107 £5.82 1,543,784 £6.12
Exercisable at 31 December 297,272 £5.60 462,721 £6.63
2007 2006
Range of exercise price for options outstanding
Weighted average
exercise price
Weighted average
remainingcontractual life
Weighted average
exercise price
Weightedaverage
remainingcontractual life
£5.60/£6.84 £5.82 0.8 years – –
£3.34/£7.23 – – £6.12 1.2 years
The weighted average share price at the time the options were exercised was £18.35 (2006: £14.64) for 1994 UK Sharesave schemes
and £17.56 (2006: £14.56) for 1996 International Sharesave schemes.
The intrinsic value of vested 1994/1996 UK and International Sharesave cash-settled awards as at 31 December 2007 was $2 million
(2006: $6 million).
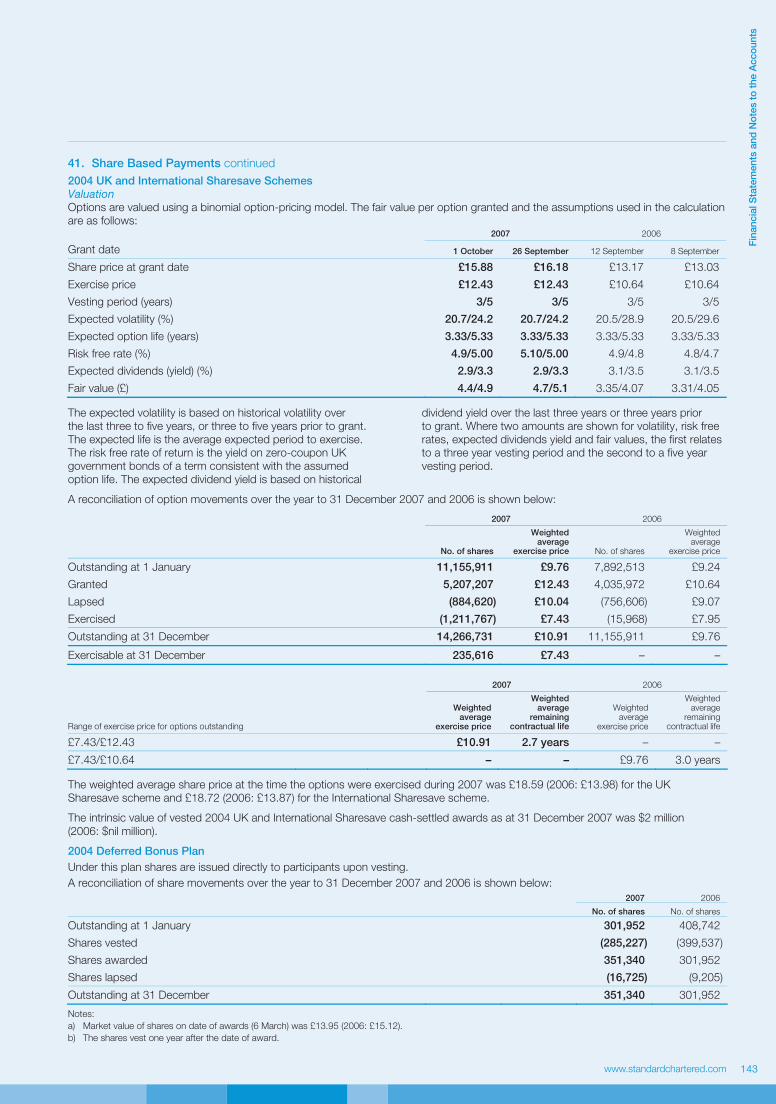
www.standardchartered.com
Fin
an
cia
l S
tate
men
ts a
nd
No
tes t
o t
he A
cco
un
ts
143
41. Share Based Payments continued
2004 UK and International Sharesave Schemes
Valuation Options are valued using a binomial option-pricing model. The fair value per option granted and the assumptions used in the calculation
are as follows: 2007 2006
Grant date 1 October 26 September 12 September 8 September
Share price at grant date £15.88 £16.18 £13.17 £13.03
Exercise price £12.43 £12.43 £10.64 £10.64
Vesting period (years) 3/5 3/5 3/5 3/5
Expected volatility (%) 20.7/24.2 20.7/24.2 20.5/28.9 20.5/29.6
Expected option life (years) 3.33/5.33 3.33/5.33 3.33/5.33 3.33/5.33
Risk free rate (%) 4.9/5.00 5.10/5.00 4.9/4.8 4.8/4.7
Expected dividends (yield) (%) 2.9/3.3 2.9/3.3 3.1/3.5 3.1/3.5
Fair value (£) 4.4/4.9 4.7/5.1 3.35/4.07 3.31/4.05 The expected volatility is based on historical volatility over
the last three to five years, or three to five years prior to grant.
The expected life is the average expected period to exercise.
The risk free rate of return is the yield on zero-coupon UK
government bonds of a term consistent with the assumed
option life. The expected dividend yield is based on historical
dividend yield over the last three years or three years prior
to grant. Where two amounts are shown for volatility, risk free
rates, expected dividends yield and fair values, the first relates
to a three year vesting period and the second to a five year
vesting period.
A reconciliation of option movements over the year to 31 December 2007 and 2006 is shown below:
2007 2006
No. of shares
Weighted average
exercise price No. of shares
Weighted average
exercise price
Outstanding at 1 January 11,155,911 £9.76 7,892,513 £9.24
Granted 5,207,207 £12.43 4,035,972 £10.64
Lapsed (884,620) £10.04 (756,606) £9.07
Exercised (1,211,767) £7.43 (15,968) £7.95
Outstanding at 31 December 14,266,731 £10.91 11,155,911 £9.76
Exercisable at 31 December 235,616 £7.43 – –
2007 2006
Range of exercise price for options outstanding
Weighted average
exercise price
Weighted average
remaining contractual life
Weightedaverage
exercise price
Weightedaverage
remainingcontractual life
£7.43/£12.43 £10.91 2.7 years – –
£7.43/£10.64 – – £9.76 3.0 years The weighted average share price at the time the options were exercised during 2007 was £18.59 (2006: £13.98) for the UK
Sharesave scheme and £18.72 (2006: £13.87) for the International Sharesave scheme.
The intrinsic value of vested 2004 UK and International Sharesave cash-settled awards as at 31 December 2007 was $2 million
(2006: $nil million).
2004 Deferred Bonus Plan
Under this plan shares are issued directly to participants upon vesting.
A reconciliation of share movements over the year to 31 December 2007 and 2006 is shown below: 2007 2006
No. of shares No. of shares
Outstanding at 1 January 301,952 408,742
Shares vested (285,227) (399,537)
Shares awarded 351,340 301,952
Shares lapsed (16,725) (9,205)
Outstanding at 31 December 351,340 301,952
Notes:
a) Market value of shares on date of awards (6 March) was £13.95 (2006: £15.12).
b) The shares vest one year after the date of award.

Standard Chartered Annual Report and Accounts 2007Standard Chartered Annual Report and Accounts 2007
Notes to the Accounts continued
144
42. Cash and Cash Equivalents
For the purposes of the cash flow statement, cash and cash equivalents comprise the following balances with less than three months
maturity from the date of acquisition. Restricted balances comprise minimum balances required to be held at central banks. Group Company
2007
$million 2006
$million 2007
$million 2006
$million
Cash and balances at central banks 10,175 7,698 – –
Less restricted balances (4,846) (3,958) – –
Treasury bills and other eligible bills 6,203 6,233 – –
Loans and advances to banks 32,464 16,084 – –
Trading securities 11,342 12,104 – –
Amounts owed by and due to subsidiary undertakings – – 930 2,028
Total 55,338 38,161 930 2,028
43. Capital Commitments
Capital expenditure approved by the directors but not provided for in these accounts amounted to:
2007
$million 2006
$million
Contracted 29 19
44. Operating Lease Commitments
2007 2006
Premises
$million Equipment
$million
Premises
$million
Equipment
$million
Commitments under non-cancellable operating leases expiring:
Within one year 179 3 156 3
Later than one year and less than five years 434 2 358 4
After five years 491 1 529 –
1,104 6 1,043 7
During the year $159 million (2006: $155 million) was recognised as an expense in the income statement in respect of operating leases.
The Group leases various premises and equipment under non-cancellable operating lease agreements. The leases have various terms,
escalation clauses and renewal rights.
The total future minimum sublease payments expected to be received under non-cancellable subleases at 31 December 2007 is
$17 million (2006: $17 million).
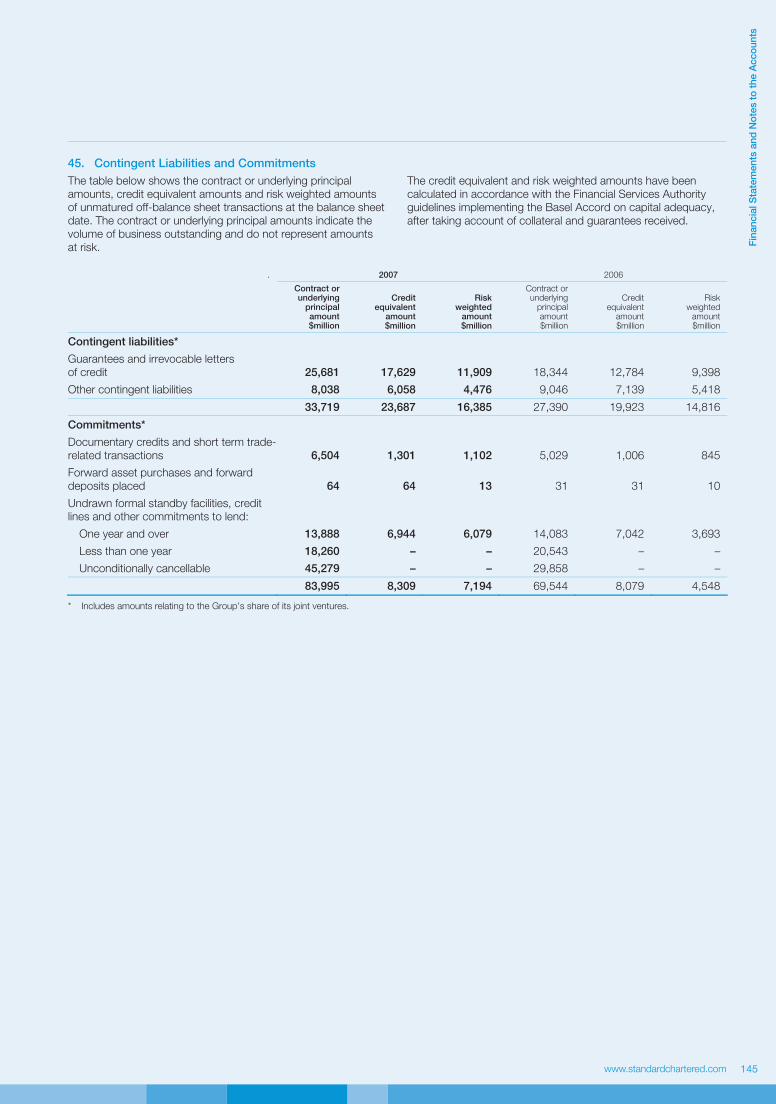
www.standardchartered.com
Fin
an
cia
l S
tate
men
ts a
nd
No
tes t
o t
he A
cco
un
ts
145
45. Contingent Liabilities and Commitments
The table below shows the contract or underlying principal
amounts, credit equivalent amounts and risk weighted amounts
of unmatured off-balance sheet transactions at the balance sheet
date. The contract or underlying principal amounts indicate the
volume of business outstanding and do not represent amounts
at risk.
The credit equivalent and risk weighted amounts have been
calculated in accordance with the Financial Services Authority
guidelines implementing the Basel Accord on capital adequacy,
after taking account of collateral and guarantees received.
. 2007 2006
Contract orunderlying
principalamount$million
Creditequivalent
amount$million
Riskweighted
amount$million
Contract or underlying
principal amount $million
Credit equivalent
amount $million
Riskweighted
amount$million
Contingent liabilities*
Guarantees and irrevocable letters
of credit 25,681 17,629 11,909 18,344 12,784 9,398
Other contingent liabilities 8,038 6,058 4,476 9,046 7,139 5,418
33,719 23,687 16,385 27,390 19,923 14,816
Commitments*
Documentary credits and short term trade-
related transactions 6,504 1,301 1,102 5,029 1,006 845
Forward asset purchases and forward
deposits placed 64 64 13 31 31 10
Undrawn formal standby facilities, credit
lines and other commitments to lend:
One year and over 13,888 6,944 6,079 14,083 7,042 3,693
Less than one year 18,260 – – 20,543 – –
Unconditionally cancellable 45,279 – – 29,858 – –
83,995 8,309 7,194 69,544 8,079 4,548
* Includes amounts relating to the Group’s share of its joint ventures.
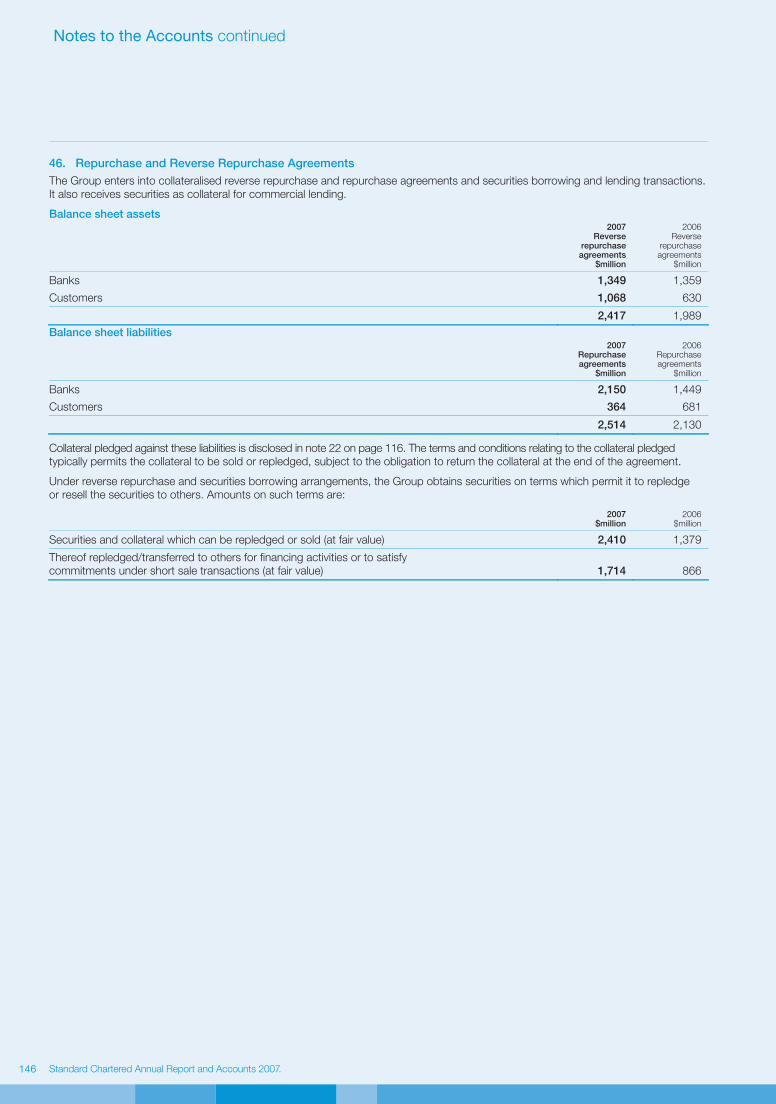
Standard Chartered Annual Report and Accounts 2007Standard Chartered Annual Report and Accounts 2007
Notes to the Accounts continued
146
46. Repurchase and Reverse Repurchase Agreements
The Group enters into collateralised reverse repurchase and repurchase agreements and securities borrowing and lending transactions.
It also receives securities as collateral for commercial lending.
Balance sheet assets
2007 Reverse
repurchase agreements
$million
2006Reverse
repurchase agreements
$million
Banks 1,349 1,359
Customers 1,068 630
2,417 1,989
Balance sheet liabilities
2007 Repurchase agreements
$million
2006Repurchase agreements
$million
Banks 2,150 1,449
Customers 364 681
2,514 2,130
Collateral pledged against these liabilities is disclosed in note 22 on page 116. The terms and conditions relating to the collateral pledged
typically permits the collateral to be sold or repledged, subject to the obligation to return the collateral at the end of the agreement.
Under reverse repurchase and securities borrowing arrangements, the Group obtains securities on terms which permit it to repledge
or resell the securities to others. Amounts on such terms are:
2007
$million 2006
$million
Securities and collateral which can be repledged or sold (at fair value) 2,410 1,379
Thereof repledged/transferred to others for financing activities or to satisfy
commitments under short sale transactions (at fair value) 1,714 866
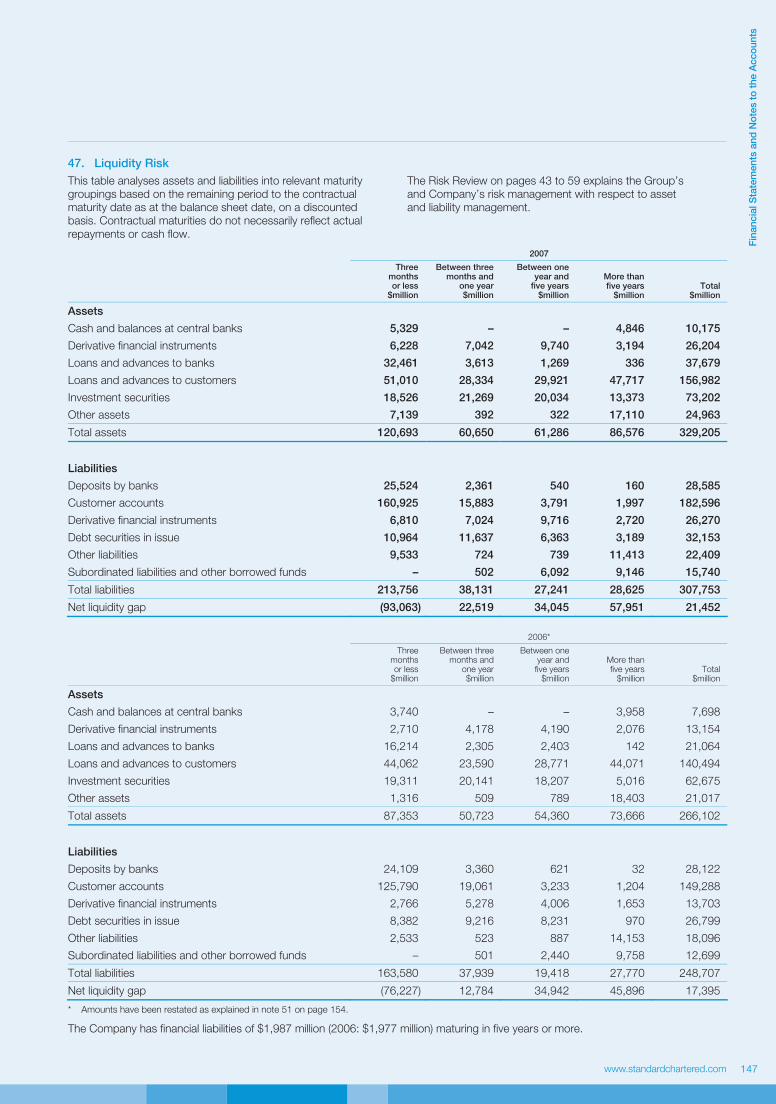
www.standardchartered.com
Fin
an
cia
l S
tate
men
ts a
nd
No
tes t
o t
he A
cco
un
ts
147
47. Liquidity Risk
This table analyses assets and liabilities into relevant maturity
groupings based on the remaining period to the contractual
maturity date as at the balance sheet date, on a discounted
basis. Contractual maturities do not necessarily reflect actual
repayments or cash flow.
The Risk Review on pages 43 to 59 explains the Group’s
and Company’s risk management with respect to asset
and liability management.
2007
Threemonthsor less
$million
Between threemonths and
one year$million
Between one year and
five years $million
More than five years
$million Total
$million
Assets
Cash and balances at central banks 5,329 – – 4,846 10,175
Derivative financial instruments 6,228 7,042 9,740 3,194 26,204
Loans and advances to banks 32,461 3,613 1,269 336 37,679
Loans and advances to customers 51,010 28,334 29,921 47,717 156,982
Investment securities 18,526 21,269 20,034 13,373 73,202
Other assets 7,139 392 322 17,110 24,963
Total assets 120,693 60,650 61,286 86,576 329,205
Liabilities
Deposits by banks 25,524 2,361 540 160 28,585
Customer accounts 160,925 15,883 3,791 1,997 182,596
Derivative financial instruments 6,810 7,024 9,716 2,720 26,270
Debt securities in issue 10,964 11,637 6,363 3,189 32,153
Other liabilities 9,533 724 739 11,413 22,409
Subordinated liabilities and other borrowed funds – 502 6,092 9,146 15,740
Total liabilities 213,756 38,131 27,241 28,625 307,753
Net liquidity gap (93,063) 22,519 34,045 57,951 21,452
2006*
Threemonthsor less
$million
Between threemonths and
one year$million
Between one year and five years
$million
More than five years
$million Total
$million
Assets
Cash and balances at central banks 3,740 – – 3,958 7,698
Derivative financial instruments 2,710 4,178 4,190 2,076 13,154
Loans and advances to banks 16,214 2,305 2,403 142 21,064
Loans and advances to customers 44,062 23,590 28,771 44,071 140,494
Investment securities 19,311 20,141 18,207 5,016 62,675
Other assets 1,316 509 789 18,403 21,017
Total assets 87,353 50,723 54,360 73,666 266,102
Liabilities
Deposits by banks 24,109 3,360 621 32 28,122
Customer accounts 125,790 19,061 3,233 1,204 149,288
Derivative financial instruments 2,766 5,278 4,006 1,653 13,703
Debt securities in issue 8,382 9,216 8,231 970 26,799
Other liabilities 2,533 523 887 14,153 18,096
Subordinated liabilities and other borrowed funds – 501 2,440 9,758 12,699
Total liabilities 163,580 37,939 19,418 27,770 248,707
Net liquidity gap (76,227) 12,784 34,942 45,896 17,395
* Amounts have been restated as explained in note 51 on page 154.
The Company has financial liabilities of $1,987 million (2006: $1,977 million) maturing in five years or more.
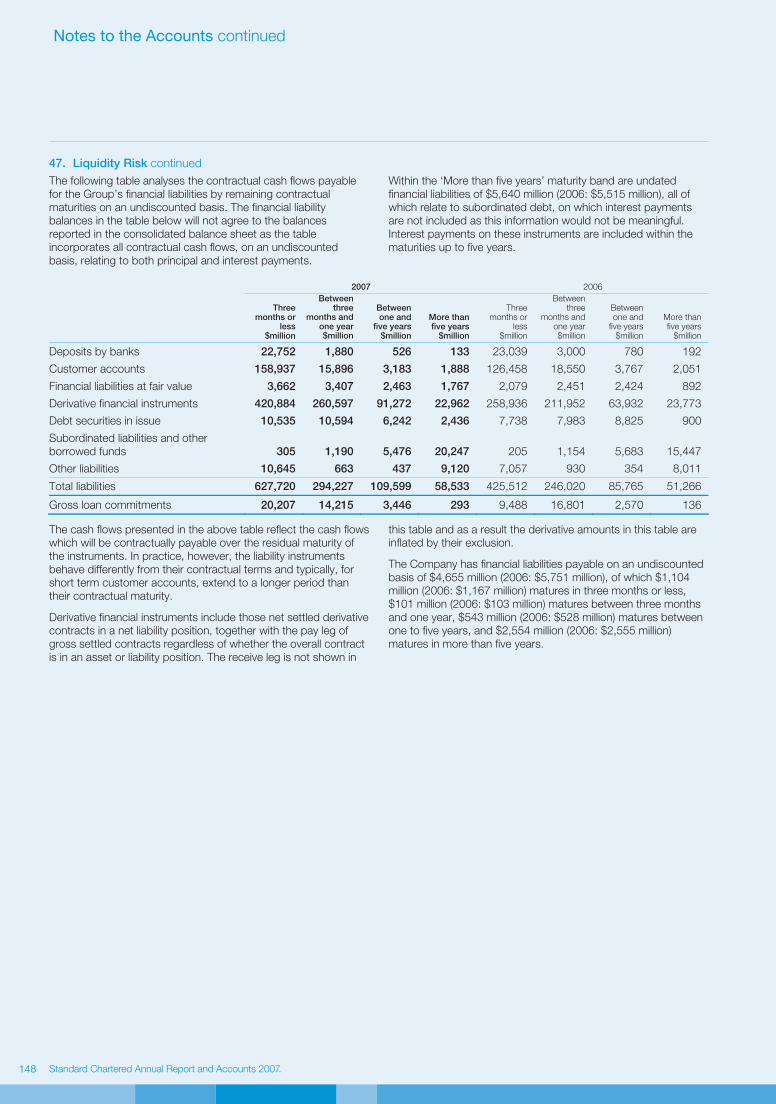
Standard Chartered Annual Report and Accounts 2007Standard Chartered Annual Report and Accounts 2007
Notes to the Accounts continued
148
47. Liquidity Risk continued
The following table analyses the contractual cash flows payable
for the Group’s financial liabilities by remaining contractual
maturities on an undiscounted basis. The financial liability
balances in the table below will not agree to the balances
reported in the consolidated balance sheet as the table
incorporates all contractual cash flows, on an undiscounted
basis, relating to both principal and interest payments.
Within the ‘More than five years’ maturity band are undated
financial liabilities of $5,640 million (2006: $5,515 million), all of
which relate to subordinated debt, on which interest payments
are not included as this information would not be meaningful.
Interest payments on these instruments are included within the
maturities up to five years.
2007 2006
Three months or
less $million
Betweenthree
months and one year $million
Between one and
five years$million
More than five years
$million
Three months or
less $million
Between three
months and one year $million
Between one and five years
$million
More than five years
$million
Deposits by banks 22,752 1,880 526 133 23,039 3,000 780 192
Customer accounts 158,937 15,896 3,183 1,888 126,458 18,550 3,767 2,051
Financial liabilities at fair value 3,662 3,407 2,463 1,767 2,079 2,451 2,424 892
Derivative financial instruments 420,884 260,597 91,272 22,962 258,936 211,952 63,932 23,773
Debt securities in issue 10,535 10,594 6,242 2,436 7,738 7,983 8,825 900
Subordinated liabilities and other
borrowed funds 305 1,190 5,476 20,247 205 1,154 5,683 15,447
Other liabilities 10,645 663 437 9,120 7,057 930 354 8,011
Total liabilities 627,720 294,227 109,599 58,533 425,512 246,020 85,765 51,266
Gross loan commitments 20,207 14,215 3,446 293 9,488 16,801 2,570 136 The cash flows presented in the above table reflect the cash flows
which will be contractually payable over the residual maturity of
the instruments. In practice, however, the liability instruments
behave differently from their contractual terms and typically, for
short term customer accounts, extend to a longer period than
their contractual maturity.
Derivative financial instruments include those net settled derivative
contracts in a net liability position, together with the pay leg of
gross settled contracts regardless of whether the overall contract
is in an asset or liability position. The receive leg is not shown in
this table and as a result the derivative amounts in this table are
inflated by their exclusion.
The Company has financial liabilities payable on an undiscounted
basis of $4,655 million (2006: $5,751 million), of which $1,104
million (2006: $1,167 million) matures in three months or less,
$101 million (2006: $103 million) matures between three months
and one year, $543 million (2006: $528 million) matures between
one to five years, and $2,554 million (2006: $2,555 million)
matures in more than five years.

www.standardchartered.com
Fin
an
cia
l S
tate
men
ts a
nd
No
tes t
o t
he A
cco
un
ts
149
48. Currency Risk
Foreign exchange risk is managed and measured as set out in
the Market risk section of the Risk Review on pages 56 to 57.
Foreign exchange risk arising within the non-trading portfolio,
excluding structural positions, is minimised by match funding
assets and liabilities in the same foreign currency.
Structural foreign exchange risks arise from net investments
in currencies other than US dollars. The Group has made net
investments in Group undertakings in a number of currencies.
The subsequent foreign exchange exposures are managed on
an individual basis, and are assessed regularly for significant
foreign exchange rate expectations. The positions are treated as
long-term embedded exposures, and are not treated as trading
positions, so hedges are considered in certain limited cases.
The table below sets out the principal structural foreign exchange
exposures of the Group at 31 December 2007 and 2006:
2007
$million 2006
$million
Korean won 5,607 5,225
Hong Kong dollar 5,090 4,743
Indian rupee 2,258 1,682
Taiwanese dollar 1,833 1,397
Thai baht 958 824
UAE dirham 808 655
Singapore dollar 734 1,129
Chinese yuan 727 549
Pakistani rupee 705 668
Malaysian ringgit 674 696
Indonesian rupiah 475 475
Other 1,965 1,518
21,834 19,561 An analysis has been performed on these exposures to assess
the impact of a one per cent fall in the US dollar exchange rates
adjusted to incorporate the impacts of correlations. The impact of
these on the positions above would be an increase of $91 million
(2006: $60 million). Changes in the valuations of these positions
are taken to reserves.
The Company’s assets and liabilities are predominantly in
US dollars. It has assets of $687 million (2006: $732 million)
and liabilities of $724 million (2006: $738 million) other than
US dollars.
49. Credit Risk
Maximum exposure to credit risk The table on page 150 presents the Group’s maximum
exposure to credit risk of the Group’s balance sheet and
off-balance sheet financial instruments at 31 December 2007,
before taking into account any collateral held or other credit
enhancements. For on-balance sheet instruments, the
maximum exposure to credit risk is the carrying amount
reported on the balance sheet. For off-balance sheet
instruments, the maximum exposure to credit risk represents
the contractual nominal amounts.
The Group’s maximum exposure to credit risk has increased
by $59 billion compared to 2006, primarily due to increased
lending to banks, up $16.6 billion, reflecting the Group’s
strong liquidity and $16.5 billion increase in Wholesale lending
portfolios. Derivative instruments increased by $13.0 billion as
a result of increased volumes in the foreign exchange and
rates business.
Collateral is held to mitigate the credit risk exposures primarily
in respect of loans and advances, and consisting of residential,
commercial and industrial properties, securities and other assets
such as plant and machinery. Further details of the credit risk
mitigation undertaken by the Group is contained within the Risk
Review on page 46.
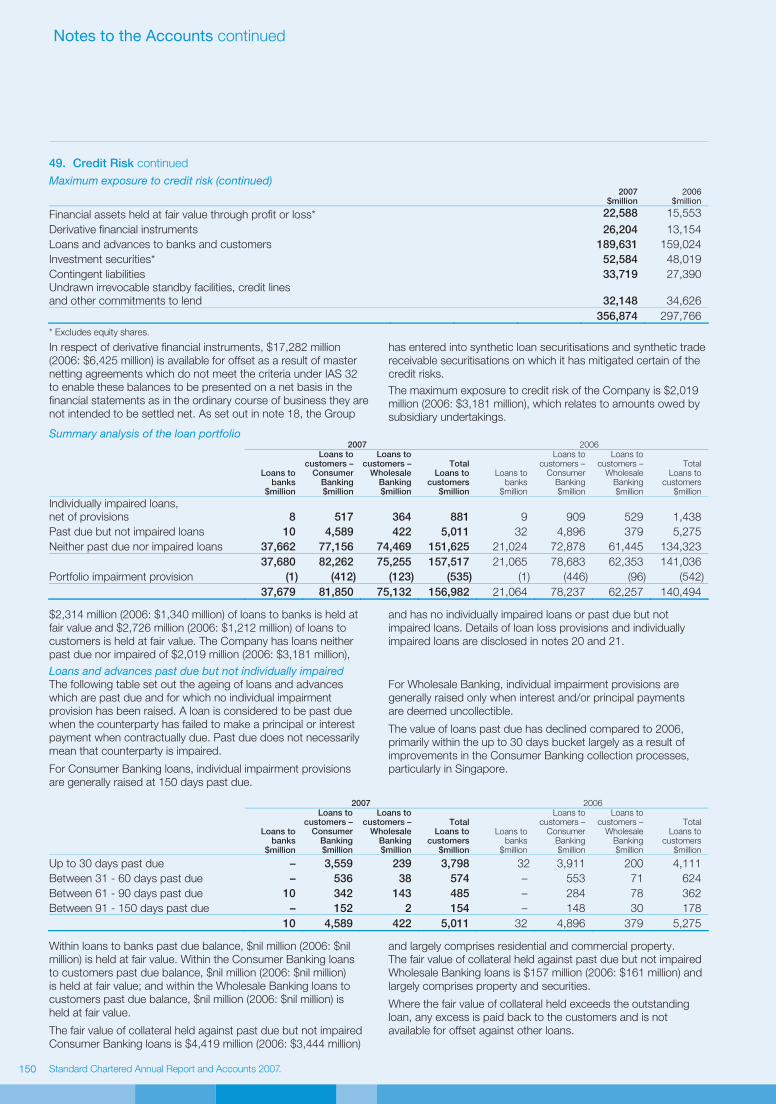
Standard Chartered Annual Report and Accounts 2007Standard Chartered Annual Report and Accounts 2007
Notes to the Accounts continued
150
49. Credit Risk continued
Maximum exposure to credit risk (continued)
2007 $million
2006 $million
Financial assets held at fair value through profit or loss* 22,588 15,553
Derivative financial instruments 26,204 13,154
Loans and advances to banks and customers 189,631 159,024
Investment securities* 52,584 48,019
Contingent liabilities 33,719 27,390
Undrawn irrevocable standby facilities, credit lines
and other commitments to lend 32,148 34,626
356,874 297,766
* Excludes equity shares.
In respect of derivative financial instruments, $17,282 million
(2006: $6,425 million) is available for offset as a result of master
netting agreements which do not meet the criteria under IAS 32
to enable these balances to be presented on a net basis in the
financial statements as in the ordinary course of business they are
not intended to be settled net. As set out in note 18, the Group
has entered into synthetic loan securitisations and synthetic trade
receivable securitisations on which it has mitigated certain of the
credit risks.
The maximum exposure to credit risk of the Company is $2,019
million (2006: $3,181 million), which relates to amounts owed by
subsidiary undertakings.
Summary analysis of the loan portfolio 2007 2006
Loans to banks
$million
Loans to customers –
ConsumerBanking $million
Loans to customers –
WholesaleBanking $million
Total Loans to
customers $million
Loans to banks
$million
Loans to customers –
Consumer Banking $million
Loans to customers –
Wholesale Banking $million
Total Loans to
customers $million
Individually impaired loans,
net of provisions 8 517 364 881 9 909 529 1,438
Past due but not impaired loans 10 4,589 422 5,011 32 4,896 379 5,275
Neither past due nor impaired loans 37,662 77,156 74,469 151,625 21,024 72,878 61,445 134,323
37,680 82,262 75,255 157,517 21,065 78,683 62,353 141,036
Portfolio impairment provision (1) (412) (123) (535) (1) (446) (96) (542)
37,679 81,850 75,132 156,982 21,064 78,237 62,257 140,494 $2,314 million (2006: $1,340 million) of loans to banks is held at
fair value and $2,726 million (2006: $1,212 million) of loans to
customers is held at fair value. The Company has loans neither
past due nor impaired of $2,019 million (2006: $3,181 million),
and has no individually impaired loans or past due but not
impaired loans. Details of loan loss provisions and individually
impaired loans are disclosed in notes 20 and 21.
Loans and advances past due but not individually impaired The following table set out the ageing of loans and advances
which are past due and for which no individual impairment
provision has been raised. A loan is considered to be past due
when the counterparty has failed to make a principal or interest
payment when contractually due. Past due does not necessarily
mean that counterparty is impaired.
For Consumer Banking loans, individual impairment provisions
are generally raised at 150 days past due.
For Wholesale Banking, individual impairment provisions are
generally raised only when interest and/or principal payments
are deemed uncollectible.
The value of loans past due has declined compared to 2006,
primarily within the up to 30 days bucket largely as a result of
improvements in the Consumer Banking collection processes,
particularly in Singapore.
2007 2006
Loans to banks
$million
Loans to customers –
ConsumerBanking $million
Loans to customers –
WholesaleBanking $million
Total Loans to
customers $million
Loans to banks
$million
Loans to customers –
Consumer Banking $million
Loans to customers –
Wholesale Banking $million
Total Loans to
customers $million
Up to 30 days past due – 3,559 239 3,798 32 3,911 200 4,111
Between 31 - 60 days past due – 536 38 574 – 553 71 624
Between 61 - 90 days past due 10 342 143 485 – 284 78 362
Between 91 - 150 days past due – 152 2 154 – 148 30 178
10 4,589 422 5,011 32 4,896 379 5,275 Within loans to banks past due balance, $nil million (2006: $nil
million) is held at fair value. Within the Consumer Banking loans
to customers past due balance, $nil million (2006: $nil million)
is held at fair value; and within the Wholesale Banking loans to
customers past due balance, $nil million (2006: $nil million) is
held at fair value.
The fair value of collateral held against past due but not impaired
Consumer Banking loans is $4,419 million (2006: $3,444 million)
and largely comprises residential and commercial property.
The fair value of collateral held against past due but not impaired
Wholesale Banking loans is $157 million (2006: $161 million) and
largely comprises property and securities.
Where the fair value of collateral held exceeds the outstanding
loan, any excess is paid back to the customers and is not
available for offset against other loans.

www.standardchartered.com
Fin
an
cia
l S
tate
men
ts a
nd
No
tes t
o t
he A
cco
un
ts
151
49. Credit Risk continued
Loans and advances neither past due nor impairedThe following table set out an analysis of loans and advances
by internal credit grading which are not past due and for which
no individual impairment provision has been raised. The credit
gradings set out in the table below are based on a probability
of default measure as set out on pages 46 and 47 of the Risk
Review. The banding reflects management’s segmentation of the
credit risk grades.
The increase in loans to banks compared to 2006 is as a result
of the placement of excess liquidity with high quality bank
counterparties, resulting in an improvement in the proportion lent
to counterparties within credit grades 1 to 5. Within loans to
customers, the proportion of the loan book falling within credit
grades 1 to 5 has increased from 44 to 46 per cent, which is
largely as a result of an increase in the proportion of high quality
lending in the Wholesale Banking portfolio. Within Consumer
Banking, the proportion of lending within grades 6 to 8 has
decreased, and grades 9 to 11 has increased, as changes in
methodology led to the re-grading of certain portfolios, largely
shifting them from grade 8 to grade 9. The proportion of grade
12 loans was maintained at one per cent of the loans to
customer portfolio.
2007 2006
Loans to banks
$million
Loans to customers –
ConsumerBanking $million
Loans to customers –
WholesaleBanking $million
Total Loans to
customers $million
Loans to banks
$million
Loans to customers –
Consumer Banking $million
Loans to customers –
WholesaleBanking $million
Total Loans to
customers $million
Grades 1 - 5 34,074 32,824 36,999 69,823 17,748 31,428 27,752 59,180
Grades 6 - 8 3,231 19,339 27,020 46,359 2,790 21,806 22,902 44,708
Grades 9 - 11 349 23,810 10,233 34,043 479 18,340 10,323 28,663
Grade 12 8 1,183 217 1,400 7 1,304 468 1,772
37,662 77,156 74,469 151,625 21,024 72,878 61,445 134,323 With Loans to banks, $2,314 million (2006: $1,340 million) is held
at fair value, of which $1,686 million (2006: $909 million) is within
Grades 1 - 5; and $629 million (2006: $431 million) within
Grades 6 - 8. Within Loans to customers – Consumer – $nil
million (2006: $nil million) is held at fair value. Within Loans to
customers – Wholesale - $2,726 million (2006: $1,212 million) is
held at fair value, of which $1,789 million (2006: $1,032 million) is
within Grades 1 - 5; $784 million (2006: $134 million) within
Grades 6 - 8; and $153 million (2006: $46 million) in Grades 9 - 11.
Renegotiated loans Loans renegotiated which would otherwise be past due or
impaired, continue to be accounted for as non-performing until
a minimum number of payments have been received under the
new terms, after which they are considered to be performing
loans. Loans which are renegotiated to include concessions that
the Group would not ordinarily make will usually be impaired and
therefore excluded from this disclosure.
Of the Group’s total loans and advances to banks which
are neither past due nor impaired, loans which have been
renegotiated (either during the year or in previous years) is
$nil million (2006: $5 million).
Within the Group’s total loans and advances to customers
which are neither past due nor impaired, loans which have
been renegotiated (either during the year or in previous years)
total $1,014 million (2006: $917 million), of which $341 million
(2006: $150 million) relates to Wholesale Banking customers
and $1,015 million (2006: $767 million) to Consumer
Banking customers.
Collateral and other credit enhancements possessed or called upon During the year, the Group obtained assets by taking possession
of collateral or calling upon other credit enhancements (such as
guarantees) as detailed in the table below. Repossessed
properties are sold in an orderly fashion. Where the proceeds are
in excess of the outstanding loan balance they are returned to the
borrower. Certain of the equity securities acquired continue to be
held by the Group for investment purposes and are classified as
available-for-sale, and the related loan derecognised.
2007 2006
ConsumerBanking $million
WholesaleBanking $million
Total $million
Consumer Banking $million
WholesaleBanking $million
Total $million
Property 135 69 204 140 9 149
Debt securities and equity shares – – – 9 – 9
Guarantees 35 5 40 13 3 16
Other 9 58 67 86 1 87
179 132 311 248 13 261

Standard Chartered Annual Report and Accounts 2007Standard Chartered Annual Report and Accounts 2007
Notes to the Accounts continued
152
49. Credit Risk continued
Debt securities, equity shares and treasury bills Debt securities, equity shares and treasury bills can be analysed as follows:
2007 2006
Debt securities
$million
Equityshares
$million
Treasurybills
$million
Total
$million
Debtsecurities
$million
Equity shares
$million
Treasury bills
$million
Total
$million
Impaired securities 71 30 17 118 18 34 30 82
Impairment provisions (54) (22) (2) (78) (9) (23) (10) (42)
Net impaired securities 17 8 15 40 9 11 20 40
Securities neither past due nor impaired 55,063 3,052 15,047 73,162 45,089 1,629 15,920 62,638
55,080 3,060 15,062 73,202 45,098 1,640 15,940 62,678
$3,395 million (2006: $3,418 million) of treasury bills and
$14,163 million (2006: $9,601 million) of debt securities
are held at fair value.
Movements in provisions on impaired securities are disclosed
in note 22. The impaired debt securities largely include the
Group’s holdings of ABS CDOs, on which a $35 million
impairment charge and other writedowns of $87 million were
taken in 2007. Further details of these writedowns are set out
on page 54 of the Risk Review.
Collateral is held against impaired securities and primarily consists
of properties. The undiscounted fair value of collateral held
relating to impaired securities is estimated at $24 million (2006:
$21 million).
The Company has no debt securities, equity shares or treasury
bills other than investments in subsidiary undertakings.
Where the fair value of collateral held exceeds the outstanding
securities obligations, any excess is paid back to the customers
and is not available for offset against other securities obligations. Securities neither past due nor impaired The following table analyses debt securities and treasury bills
which are neither past due or impaired by external credit rating.
The standard credit ratings used by the Group are those used by
Standard & Poors or their equivalent. Debt securities held which
have a short-term rating are reported against the long-term rating
of the issuer. For securities which are unrated, the Group applies
an internal credit rating as described under Loans and Advances.
2007 2006
Debt
securities
$million
Treasury bills
$million
Total
$million
Debt
securities
$million
Treasury bills
$million
Total
$million
AAA 12,364 570 12,934 6,685 644 7,329
AA- to AA+ 16,426 3,216 19,642 14,992 3,125 18,117
A- to A+ 14,358 7,788 22,146 13,517 9,986 23,503
BBB- to BBB+ 6,341 1,822 8,163 4,834 852 5,686
Lower than BBB- 2,586 1,357 3,943 3,225 1,072 4,297
Unrated 2,988 294 3,282 1,836 241 2,077
55,063 15,047 70,110 45,089 15,920 61,009 Unrated securities primarily relate to corporate investments. Using
internal credit ratings, $2,606 million (2006: $1,353 million) of
these securities are considered to be investment grade and $676
million (2006: $724 million) sub-investment grade.
The increase in AAA debt securities compared to 2006 has
largely been driven by the asset backed securities acquired from
Whistlejacket following the ‘vertical’ slice transactions. Further
details of these transactions are set out in note 52 and within
the Risk Review on page 54.

www.standardchartered.com
Fin
an
cia
l S
tate
men
ts a
nd
No
tes t
o t
he A
cco
un
ts
153
50. Fair Value of Financial Assets and Liabilities
The following table summarises the carrying amounts and fair values of those financial assets and liabilities not presented on the
Group’s balance sheet at fair value.
2007 2006
Book amount
$million
Fair value
$million
Book amount*
$million
Fair value*
$million
Assets
Cash and balances at central banks 10,175 10,175 7,698 7,698
Loans and advances to banks 35,365 35,316 19,724 19,727
Loans and advances to customers 154,266 153,828 139,300 139,654
Investment securities 2,819 2,779 2,786 2,754
Liabilities
Deposits by banks 25,880 25,844 26,233 26,184
Customer accounts 179,760 179,694 147,382 147,492
Debt securities in issue 27,137 27,072 23,514 23,518
Subordinated liabilities and other borrowed funds 15,740 15,029 **12,699 12,877
* Amounts have been restated as explained in note 51 on page 154.
** The book amount includes adjustments as a result of fair value hedging relationships.
The following sets out the Group’s basis of establishing fair
values of the financial instruments shown above and those
financial assets classified as available-for-sale and financial
assets and liabilities held at fair value through profit and loss
as disclosed within notes 14, 15, 17, 18, 22 and 31. The Group’s
basis for establishing the fair value of financial assets and
liabilities held at fair value through profit or loss and of
derivatives is set out in note 1.
Cash and balances at central banks
The fair value of cash and balances at central banks is their
carrying amounts.
Loans and advances to banks
The fair value of floating rate placements and overnight
deposits is their carrying amounts. The estimated fair value
of fixed interest bearing deposits is based on discounted cash
flows using the prevailing money-market rates for debts with a
similar credit risk and remaining maturity.
Loans and advances to customers
Loans and advances are net of provisions for impairment.
The estimated fair value of loans and advances represents
the discounted amount of future cash flows expected to be
received, including assumptions relating to prepayment rates.
Expected cash flows are discounted at current market rates
to determine fair value. The Group’s loan portfolio is well
diversified by geography and industry and is in markets that
have had little contagion from the turmoil brought about by the
sub-prime mortgage crisis in the United States. Approximately
half of the portfolio reprices within one month, and over 80 per
cent reprices within 12 months. The fair value of loans and
advances to customers is therefore close to the book amount.
Investment securities
Investment securities with observable market prices,
including debt and equity securities, are fair valued using
that information. Debt securities that do not have observable
market data are fair valued by either discounting cash flows
using the prevailing market rates for debts with a similar credit
risk and remaining maturity or using quoted market prices for
securities with similar credit, maturity and yield characteristics.
Deposits and borrowings
The estimated fair value of deposits with no stated maturity
is the amount repayable on demand. The estimated fair value
of fixed interest bearing deposits and other borrowings without
quoted market prices is based on discounting cash flows
using the prevailing market rates for debts with a similar credit
risk and remaining maturity.
Debt securities in issue, subordinated liabilities and other
borrowed funds
The aggregate fair values are calculated based on quoted
market prices. For those notes where quoted market prices
are not available, a discounted cash flow model is used based
on a current market related yield curve appropriate for the
remaining term to maturity.
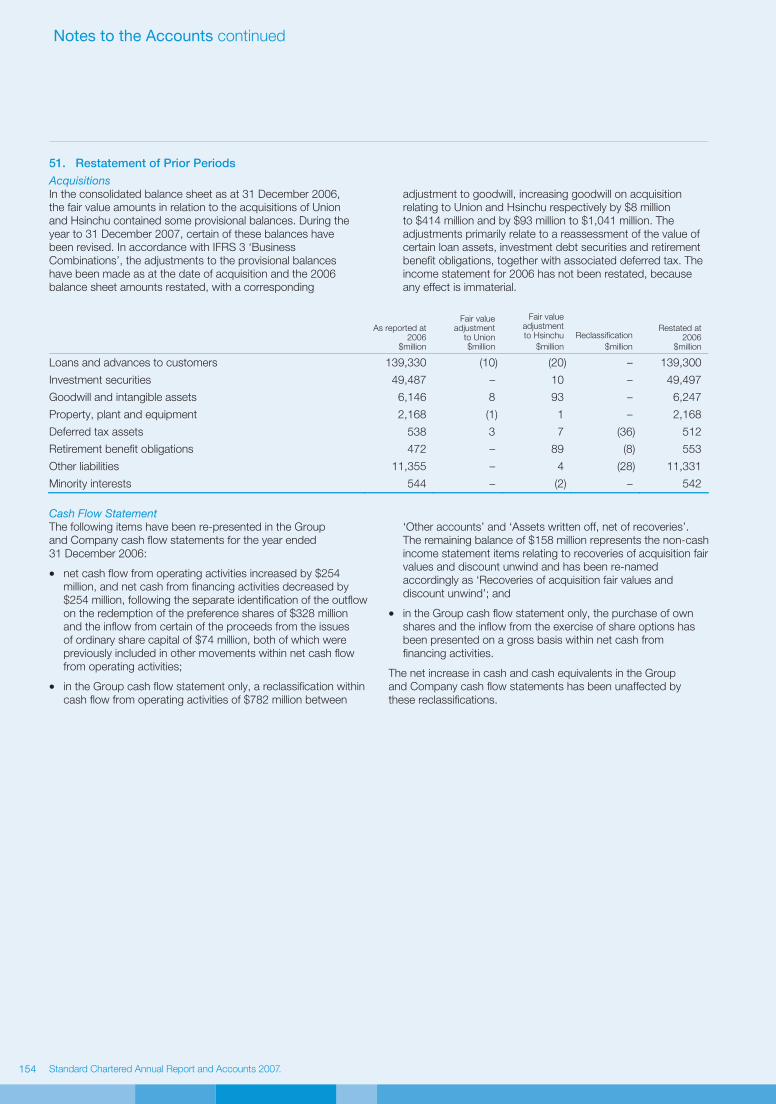
Standard Chartered Annual Report and Accounts 2007Standard Chartered Annual Report and Accounts 2007
Notes to the Accounts continued
154
51. Restatement of Prior Periods
Acquisitions In the consolidated balance sheet as at 31 December 2006,
the fair value amounts in relation to the acquisitions of Union
and Hsinchu contained some provisional balances. During the
year to 31 December 2007, certain of these balances have
been revised. In accordance with IFRS 3 ‘Business
Combinations’, the adjustments to the provisional balances
have been made as at the date of acquisition and the 2006
balance sheet amounts restated, with a corresponding
adjustment to goodwill, increasing goodwill on acquisition
relating to Union and Hsinchu respectively by $8 million
to $414 million and by $93 million to $1,041 million. The
adjustments primarily relate to a reassessment of the value of
certain loan assets, investment debt securities and retirement
benefit obligations, together with associated deferred tax. The
income statement for 2006 has not been restated, because
any effect is immaterial.
As reported at2006
$million
Fair value adjustment
to Union$million
Fair value adjustment to Hsinchu
$million
Reclassification
$million
Restated at2006
$million
Loans and advances to customers 139,330 (10) (20) – 139,300
Investment securities 49,487 – 10 – 49,497
Goodwill and intangible assets 6,146 8 93 – 6,247
Property, plant and equipment 2,168 (1) 1 – 2,168
Deferred tax assets 538 3 7 (36) 512
Retirement benefit obligations 472 – 89 (8) 553
Other liabilities 11,355 – 4 (28) 11,331
Minority interests 544 – (2) – 542
Cash Flow Statement The following items have been re-presented in the Group
and Company cash flow statements for the year ended
31 December 2006:
• net cash flow from operating activities increased by $254
million, and net cash from financing activities decreased by
$254 million, following the separate identification of the outflow
on the redemption of the preference shares of $328 million
and the inflow from certain of the proceeds from the issues
of ordinary share capital of $74 million, both of which were
previously included in other movements within net cash flow
from operating activities;
• in the Group cash flow statement only, a reclassification within
cash flow from operating activities of $782 million between
‘Other accounts’ and ‘Assets written off, net of recoveries’.
The remaining balance of $158 million represents the non-cash
income statement items relating to recoveries of acquisition fair
values and discount unwind and has been re-named
accordingly as ‘Recoveries of acquisition fair values and
discount unwind’; and
• in the Group cash flow statement only, the purchase of own
shares and the inflow from the exercise of share options has
been presented on a gross basis within net cash from
financing activities.
The net increase in cash and cash equivalents in the Group
and Company cash flow statements has been unaffected by
these reclassifications.
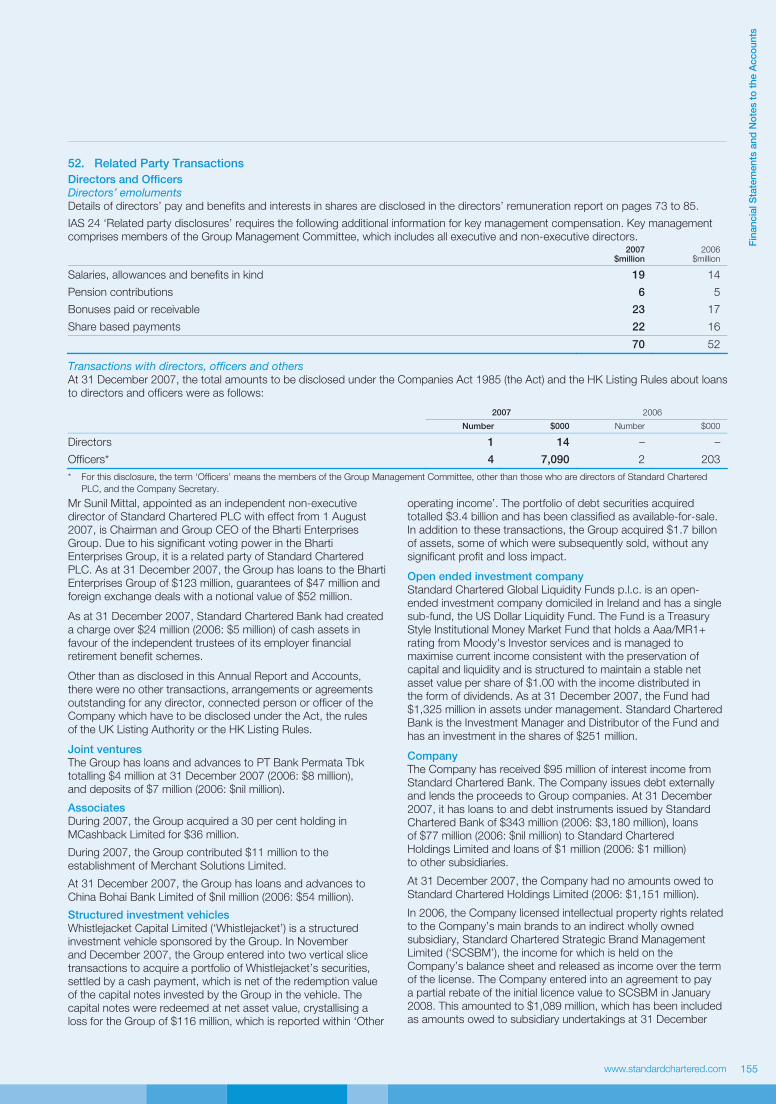
www.standardchartered.com
Fin
an
cia
l S
tate
men
ts a
nd
No
tes t
o t
he A
cco
un
ts
155
52. Related Party Transactions
Directors and Officers
Directors’ emoluments Details of directors’ pay and benefits and interests in shares are disclosed in the directors’ remuneration report on pages 73 to 85.
IAS 24 ‘Related party disclosures’ requires the following additional information for key management compensation. Key management
comprises members of the Group Management Committee, which includes all executive and non-executive directors.
2007
$million 2006
$million
Salaries, allowances and benefits in kind 19 14
Pension contributions 6 5
Bonuses paid or receivable 23 17
Share based payments 22 16
70 52 Transactions with directors, officers and others At 31 December 2007, the total amounts to be disclosed under the Companies Act 1985 (the Act) and the HK Listing Rules about loans
to directors and officers were as follows:
2007 2006
Number $000 Number $000
Directors 1 14 – –
Officers* 4 7,090 2 203
* For this disclosure, the term ‘Officers’ means the members of the Group Management Committee, other than those who are directors of Standard Chartered
PLC, and the Company Secretary.
Mr Sunil Mittal, appointed as an independent non-executive
director of Standard Chartered PLC with effect from 1 August
2007, is Chairman and Group CEO of the Bharti Enterprises
Group. Due to his significant voting power in the Bharti
Enterprises Group, it is a related party of Standard Chartered
PLC. As at 31 December 2007, the Group has loans to the Bharti
Enterprises Group of $123 million, guarantees of $47 million and
foreign exchange deals with a notional value of $52 million.
As at 31 December 2007, Standard Chartered Bank had created
a charge over $24 million (2006: $5 million) of cash assets in
favour of the independent trustees of its employer financial
retirement benefit schemes.
Other than as disclosed in this Annual Report and Accounts,
there were no other transactions, arrangements or agreements
outstanding for any director, connected person or officer of the
Company which have to be disclosed under the Act, the rules
of the UK Listing Authority or the HK Listing Rules.
Joint ventures
The Group has loans and advances to PT Bank Permata Tbk
totalling $4 million at 31 December 2007 (2006: $8 million),
and deposits of $7 million (2006: $nil million).
Associates
During 2007, the Group acquired a 30 per cent holding in
MCashback Limited for $36 million.
During 2007, the Group contributed $11 million to the
establishment of Merchant Solutions Limited.
At 31 December 2007, the Group has loans and advances to
China Bohai Bank Limited of $nil million (2006: $54 million).
Structured investment vehicles
Whistlejacket Capital Limited (‘Whistlejacket’) is a structured
investment vehicle sponsored by the Group. In November
and December 2007, the Group entered into two vertical slice
transactions to acquire a portfolio of Whistlejacket’s securities,
settled by a cash payment, which is net of the redemption value
of the capital notes invested by the Group in the vehicle. The
capital notes were redeemed at net asset value, crystallising a
loss for the Group of $116 million, which is reported within ‘Other
operating income’. The portfolio of debt securities acquired
totalled $3.4 billion and has been classified as available-for-sale.
In addition to these transactions, the Group acquired $1.7 billon
of assets, some of which were subsequently sold, without any
significant profit and loss impact.
Open ended investment company
Standard Chartered Global Liquidity Funds p.l.c. is an open-
ended investment company domiciled in Ireland and has a single
sub-fund, the US Dollar Liquidity Fund. The Fund is a Treasury
Style Institutional Money Market Fund that holds a Aaa/MR1+
rating from Moody's Investor services and is managed to
maximise current income consistent with the preservation of
capital and liquidity and is structured to maintain a stable net
asset value per share of $1.00 with the income distributed in
the form of dividends. As at 31 December 2007, the Fund had
$1,325 million in assets under management. Standard Chartered
Bank is the Investment Manager and Distributor of the Fund and
has an investment in the shares of $251 million.
Company
The Company has received $95 million of interest income from
Standard Chartered Bank. The Company issues debt externally
and lends the proceeds to Group companies. At 31 December
2007, it has loans to and debt instruments issued by Standard
Chartered Bank of $343 million (2006: $3,180 million), loans
of $77 million (2006: $nil million) to Standard Chartered
Holdings Limited and loans of $1 million (2006: $1 million)
to other subsidiaries.
At 31 December 2007, the Company had no amounts owed to
Standard Chartered Holdings Limited (2006: $1,151 million).
In 2006, the Company licensed intellectual property rights related
to the Company’s main brands to an indirect wholly owned
subsidiary, Standard Chartered Strategic Brand Management
Limited (‘SCSBM’), the income for which is held on the
Company’s balance sheet and released as income over the term
of the license. The Company entered into an agreement to pay
a partial rebate of the initial licence value to SCSBM in January
2008. This amounted to $1,089 million, which has been included
as amounts owed to subsidiary undertakings at 31 December
Standard Chartered Annual Report and Accounts 2007Standard Chartered Annual Report and Accounts 2007
Notes to the Accounts continued
156
52. Related Party Transactions continued
2007. As a consequence, in the year ended 31 December 2007,
the Company has written back $192 million of income recognised
in prior years. At the year end $311 million (2006: $1,362 million)
has been included as deferred income in the Company balance
sheet in relation to this license.
The Company has an agreement with Standard Chartered
Bank that in the event of the Bank defaulting on its debt coupon
interest payments, where the terms of such debt requires it, the
Company shall issue shares as settlement for non-payment of the
coupon interest.
53. Post Balance Sheet Events Group The Group announced, on 18 September 2007, the acquisition
of American Express Bank Limited (‘AEB’), from American
Express Company for a total cash consideration equal to the
net asset value of AEB at completion plus $300 million. The
transaction will complete on 29 February 2008.
On 11 January 2008, the Group completed the acquisition of a
49 per cent stake in UTI Securities Limited, an equity brokerage
firm in India.
On 11 January 2008, the Group announced the acquisition of a
Korean mutual savings bank, Yeahreum Mutual Savings Bank
which was completed on 25 February 2008.
On 31 January 2008, the Group announced that it intended to
provide liquidity to Whistlejacket subject to certain pre-conditions,
one of which was that enforcement proceedings had not
commenced. On 11 February 2008, Whistlejacket advised that
it had breached its capital note Net Asset Value (‘NAV’) trigger
of 50 per cent. The breach of the trigger was an enforcement
event, which required the security trustee, BNY Corporate
Trustee Service, to appoint a receiver to manage Whistlejacket.
As a result, the proposal announced on 31 January 2008 lapsed.
However, the Group continued to discuss with the receiver
alternative arrangements to provide liquidity. Subsequently on
20 February 2008, the Group announced that it had withdrawn
the conditional proposals made to the receiver as a result of a
number of factors, including the pace of continuing deterioration
in the market for certain assets classes and the impracticality of
completing any proposal within the confines of the receivership
as it has evolved.
54. Significant Accounting Estimates and Judgements
In determining the carrying amounts of certain assets and
liabilities, the Group makes assumptions of the effects of
uncertain future events on those assets and liabilities at the
balance sheet date. The Group’s estimates and assumptions are
based on historical experience and expectation of future events
and are reviewed periodically. This disclosure excludes
uncertainty over future events and judgements in respect of
measuring financial instruments. Further information about key
assumptions concerning the future, and other key sources of
estimation uncertainty, are set out in the notes.
Loan loss provisioning
The Group’s loan loss provisions are established to recognise
incurred impairment losses either on specific loan assets or within
a portfolio of loans and receivables.
Impairment losses for specific loan assets are assessed either on
an individual or on a portfolio basis. Individual impairment losses
are determined as the difference between the carrying value and
the present value of estimated future cash flows, discounted at
the loans’ original effective interest rate. Impairment losses
determined on a portfolio basis are assessed based on the
probability of default inherent within the portfolio of impaired
loans or receivables.
Estimating the amount and timing of future recoveries involves
significant judgement, and considers the level of arrears as well
as the assessment of matters such as future economic conditions
and the value of collateral, for which there may not be a readily
accessible market.
Loan losses that have been incurred but have not been
separately identified at the balance sheet date are determined
on a portfolio basis, which takes into account past loss
experience as a result of uncertainties arising from the economic
environment, and defaults based on portfolio trends. Actual
losses identified could differ significantly from the impairment
provisions reported as a result of uncertainties arising from the
economic environment.
Fair value of financial instruments
Fair value is the amount for which an asset could be exchanged,
or a liability settled, between knowledgeable, willing parties in an
arm’s length transaction.
All financial instruments are initially recognised at fair value, which
is normally the transaction price. In certain circumstances, the
initial fair value may be based on a valuation technique which
may lead to the recognition of profits or losses at the time of initial
recognition. However, these profits or losses can only be
recognised when the valuation technique used is based solely
on observable market inputs.
Subsequent to initial recognition, some of the Group’s financial
instruments are carried at fair value, with changes in fair value
either reported within the income statement or within equity until
the instrument is sold or becomes impaired. Details of the type
and classification of the Group’s financial instruments are set out
in notes 14 and 16 to the accounts and the accounting policy set
out in note 1 to the accounts. In addition to these instruments,
the carrying value of a financial instrument carried at amortised
cost that is the hedged item in a qualifying fair value hedge
relationship is adjusted by the fair value gain or loss attributable
to the hedged risk.
The fair values of quoted financial instruments in active markets
are based on current prices. If the market for a financial
instrument is not active, and for unlisted securities, the Group
establishes fair value by using valuation techniques. These include
the use of recent arm’s length transactions, discounted cash flow
analysis, option pricing models and other valuation techniques
commonly used by market participants.
www.standardchartered.com
Fin
an
cia
l S
tate
men
ts a
nd
No
tes t
o t
he A
cco
un
ts
157
54. Significant Accounting Estimates and Judgements continued
Where representative prices are unreliable because of illiquid
markets, the determination of fair value may require estimation
of certain parameters, which are calibrated against industry
standards and observable market data, or the use of valuation
models that are based on observable market data.
The fair value for the majority of the Group’s financial instruments
is based on observable market prices or derived from observable
market parameters. The most significant element of Group assets
in which observable prices are not available relates to certain
instruments held within the Asset Backed Securities portfolio. At
31 December 2007, assets with a market value of $1.5 billion
were held in respect of which there was no observable market
data. For these instruments, changing one or more of the
assumptions used to reasonably possible alternatives would
not significantly change their fair value.
Equity investments that do not have an observable market price
are fair valued by applying various valuation techniques, such as
earnings multiples, net assets multiples, discounted cash flows,
and industry valuation benchmarks. These techniques are
generally applied prior to any initial public offering, after which an
observable market price becomes available. Disposal of such
investments are generally by market trades or private sales.
Goodwill impairment
An annual assessment is made, as set out in note 25, as to
whether the current carrying value of goodwill is impaired.
Detailed calculations are performed based on discounting
expected pre-tax cash flows of the relevant cash generating
units and discounting these at an appropriate discount rate,
the determination of which requires the exercise of judgement.
Acquired intangible assets
Acquired intangible assets are those that derive their value
from contractual customer relationships or that can be
separated and sold, and are amortised over their estimated
useful lives. They comprise customer relationships, core deposits,
brands and acquired licences. The valuation and estimated useful
lives of customer relationships, core deposits and brands is
dependent on a number of assumptions and judgements, such
as expected cash flows, customer attrition, royalty rates and
applicable costs, variations in which could produce different
values and/or useful lives.
For example, if the royalty rates were increased by one per cent
per annum (or decreased by one per cent per annum) the value
of the brand names acquired in the acquisitions in 2007 would
increase by approximately $3 million (or decrease by $3 million).
Likewise, if the attrition rates were increased by four per cent per
annum (or decreased by four per cent per annum) the value of the
customer relationships acquired in the acquisitions in 2007 would
decrease by approximately $10 million (or increase by
approximately $10 million).
Acquired licences are valued at their purchase price and
amortised over the period of the licence.
Pensions
Actuarial assumptions are made in valuing future defined benefit
pension obligations as set out in note 36 and are updated
periodically. The principal assumptions relate to the rate of
inflation and the discount rate. The assumed rate of inflation
affects the rate at which salaries grow and therefore the size of
the pensions that employees receive on retirement. The discount
rate is equal to the yield on high-quality corporate bonds which
have a term to maturity approximating that of the related liability,
and is potentially subject to significant variation. As a result, there
is uncertainty that these assumptions will continue in the future.
For example, if the discount rate for the UK fund increased by
25 basis points, the liability would reduce by approximately
$66 million, and vice versa. Whilst changes in other assumptions
would have an impact, the effect would not be as significant.
Taxes
Determining income tax provisions involves judgement on the tax
treatment of certain transactions. Deferred tax is recognised on
tax losses not yet used and on temporary differences where it is
probable that there will be taxable revenue against which these
can be offset. Management has made judgements as to the
probability of tax losses being available for offset at a later date.
Provisions for liabilities and charges
The Group receives legal claims against it in the normal course
of business. Management has made judgements as to the
likelihood of any claim succeeding in making provisions. The
time of concluding legal claims is uncertain, as is the amount of
possible outflow of economic benefits. Timing and cost ultimately
depends on the due process in respective legal jurisdictions.
Share based payments
Equity-settled share awards are recognised as an expense based
on their fair value at date of grant. The fair value of equity-settled
share options is estimated through the use of option valuation
models – which require inputs such as the risk-free interest rate,
expected dividends, expected volatility and the expected option
life – and is expensed over the vesting period. Some of the inputs
used, such as the expected option life, are not market observable
and are based on estimates derived from available data, such as
employee exercise behaviour. The models utilised, such as the
binomial option pricing model, are intended to value options
traded in active markets. The share options issued by the
Group, however, have a number of features that make them
incomparable to such traded options. Using different input
estimates or models could produce different option values,
which would result in the recognition of a higher or lower
expense. For example, if the volatility assumption was increased
by five per cent (or decreased by five per cent), the fair values for
options granted under the Sharesave schemes in 2007 would
increase by approximately £0.28 for 3 year grants, and by £0.39
for 5 year grants (or decrease by approximately £0.20 for 3 year
grants, and by £0.32 for 5 year grants).
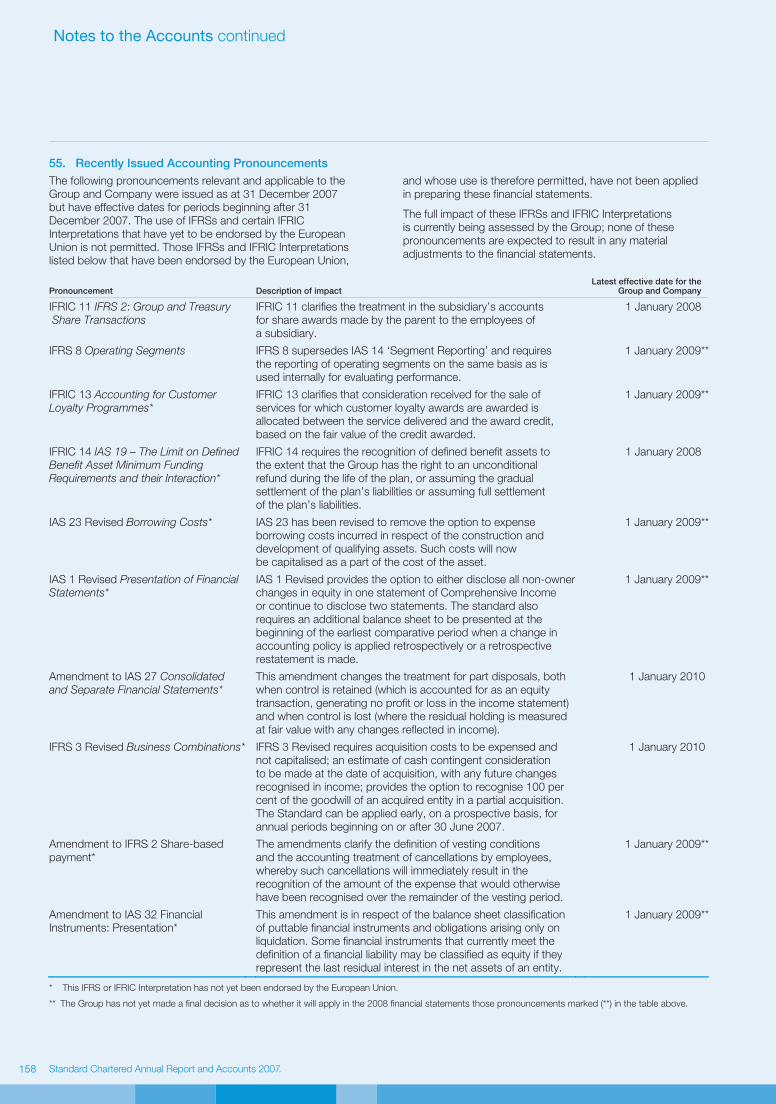
Standard Chartered Annual Report and Accounts 2007Standard Chartered Annual Report and Accounts 2007
Notes to the Accounts continued
158
55. Recently Issued Accounting Pronouncements
The following pronouncements relevant and applicable to the
Group and Company were issued as at 31 December 2007
but have effective dates for periods beginning after 31
December 2007. The use of IFRSs and certain IFRIC
Interpretations that have yet to be endorsed by the European
Union is not permitted. Those IFRSs and IFRIC Interpretations
listed below that have been endorsed by the European Union,
and whose use is therefore permitted, have not been applied
in preparing these financial statements.
The full impact of these IFRSs and IFRIC Interpretations
is currently being assessed by the Group; none of these
pronouncements are expected to result in any material
adjustments to the financial statements.
Pronouncement
Description of impact Latest effective date for the
Group and Company
IFRIC 11 IFRS 2: Group and Treasury Share Transactions
IFRIC 11 clarifies the treatment in the subsidiary’s accounts
for share awards made by the parent to the employees of
a subsidiary.
1 January 2008
IFRS 8 Operating Segments IFRS 8 supersedes IAS 14 ‘Segment Reporting’ and requires
the reporting of operating segments on the same basis as is
used internally for evaluating performance.
1 January 2009**
IFRIC 13 Accounting for Customer Loyalty Programmes*
IFRIC 13 clarifies that consideration received for the sale of
services for which customer loyalty awards are awarded is
allocated between the service delivered and the award credit,
based on the fair value of the credit awarded.
1 January 2009**
IFRIC 14 IAS 19 – The Limit on Defined Benefit Asset Minimum Funding Requirements and their Interaction*
IFRIC 14 requires the recognition of defined benefit assets to
the extent that the Group has the right to an unconditional
refund during the life of the plan, or assuming the gradual
settlement of the plan’s liabilities or assuming full settlement
of the plan’s liabilities.
1 January 2008
IAS 23 Revised Borrowing Costs* IAS 23 has been revised to remove the option to expense
borrowing costs incurred in respect of the construction and
development of qualifying assets. Such costs will now
be capitalised as a part of the cost of the asset.
1 January 2009**
IAS 1 Revised Presentation of Financial Statements*
IAS 1 Revised provides the option to either disclose all non-owner
changes in equity in one statement of Comprehensive Income
or continue to disclose two statements. The standard also
requires an additional balance sheet to be presented at the
beginning of the earliest comparative period when a change in
accounting policy is applied retrospectively or a retrospective
restatement is made.
1 January 2009**
Amendment to IAS 27 Consolidated and Separate Financial Statements*
This amendment changes the treatment for part disposals, both
when control is retained (which is accounted for as an equity
transaction, generating no profit or loss in the income statement)
and when control is lost (where the residual holding is measured
at fair value with any changes reflected in income).
1 January 2010
IFRS 3 Revised Business Combinations* IFRS 3 Revised requires acquisition costs to be expensed and
not capitalised; an estimate of cash contingent consideration
to be made at the date of acquisition, with any future changes
recognised in income; provides the option to recognise 100 per
cent of the goodwill of an acquired entity in a partial acquisition.
The Standard can be applied early, on a prospective basis, for
annual periods beginning on or after 30 June 2007.
1 January 2010
Amendment to IFRS 2 Share-based
payment*
The amendments clarify the definition of vesting conditions
and the accounting treatment of cancellations by employees,
whereby such cancellations will immediately result in the
recognition of the amount of the expense that would otherwise
have been recognised over the remainder of the vesting period.
1 January 2009**
Amendment to IAS 32 Financial
Instruments: Presentation*
This amendment is in respect of the balance sheet classification
of puttable financial instruments and obligations arising only on
liquidation. Some financial instruments that currently meet the
definition of a financial liability may be classified as equity if they
represent the last residual interest in the net assets of an entity.
1 January 2009**
* This IFRS or IFRIC Interpretation has not yet been endorsed by the European Union.
** The Group has not yet made a final decision as to whether it will apply in the 2008 financial statements those pronouncements marked (**) in the table above.
www.standardchartered.com
Fin
an
cia
l S
tate
men
ts a
nd
No
tes t
o t
he A
cco
un
ts
159
56. UK and Hong Kong Accounting Requirements
As required by the HK Listing Rules, an explanation of the
differences in accounting practices between EU endorsed
IFRS and Hong Kong Financial Reporting Standards is
summarised below.
There would be no significant differences had these accounts
been prepared in accordance with Hong Kong Financial
Reporting Standards. As set out in note 55, EU endorsed
IFRS may differ from IFRSs published by the International
Accounting Standards Board if a standard has not been
endorsed by the European Union.