notes to the financial statements 30 june 2011
TRANSCRIPT

AnnuAl RepoRt 2011

ABout tHIS RepoRt
This report provides an accurate and detailed review of the company’s financial and non-financial performance in the 2010–11 financial year against our strategy, objectives and targets detailed in our Statement of Corporate Intent (SCI).
Our strategy, which we report against, is categorised into six key areas:
• Right people
• Right markets
• Right fuels
• Right plant
• Right organisation
• Right locations.
For each of the reporting sections, we have summarised our performance against both SCI and divisional indicators.
This report does not include our objectives for 2011–12.
Following the outcome of the Shareholder Review of Queensland Government Owned Corporation Generators (Genco Review), announced on 25 November 2010, the Queensland Government owned generating sector has been restructured from three Queensland Government owned generating companies (Stanwell
Corporation Limited, Tarong Energy Corporation Limited and CS Energy Limited) to two (Stanwell and CS Energy), with effect from 1 July 2011.
As this affects Stanwell’s business moving forward, the objectives of the restructured company will be a priority for the new Board and Executive Leadership Team.
This report also provides information on other important business processes, such as our approach to corporate governance and risk management.
We are responsibly managing our business to deliver value to our shareholders and, ultimately, to the people of Queensland. Our stakeholders include, but are not limited to, shareholders, employees, contractors, customers, local communities, suppliers, business partners, special interest groups and relevant authorities.
To assist in reading our Annual Report, we have included a glossary of terms and an index at the back of the report. Electronic versions of this and previous years’ annual reports are available online at www.stanwell.com
Stanwell Power Station in Central Queensland
i STanwell annual RepoRT 2011

ABout tHIS RepoRt _________________________________________________________________________________________ i
HIgHlIgHtS ______________________________________________________________________________________________________ 2
FInAncIAl HIgHlIgHtS ____________________________________________________________________________________ 2
WHo We ARe _____________________________________________________________________________________________________ 3
StRAtegIc dIRectIon ______________________________________________________________________________________ 5
YeAR In RevIeW ________________________________________________________________________________________________ 5
peRFoRmAnce oveRvIeW 2010–11 ___________________________________________________________________ 7
YeAR AHeAd 2011–12 _______________________________________________________________________________________ 10
cHAIRmAn’S StAtement _______________________________________________________________________________ 11
meSSAge FRom IncomIng cHAIRmAn __________________________________________________________ 12
ActIng cHIeF executIve oFFIceR’S RevIeW __________________________________________________ 13
BoARd oF dIRectoRS _____________________________________________________________________________________ 15
executIve mAnAgement teAm ___________________________________________________________________ 16
SocIAl peRFoRmAnce ___________________________________________________________________________________ 19
Health and safety _____________________________________________________________________________________________ 19
Employee relations __________________________________________________________________________________________ 21
Community relations _________________________________________________________________________________________ 24
BuSIneSS peRFoRmAnce_______________________________________________________________________________ 27
Operations _____________________________________________________________________________________________________ 27
Market trading _________________________________________________________________________________________________ 31
Project development ________________________________________________________________________________________ 33
envIRonmentAl peRFoRmAnce ___________________________________________________________________ 35
economIc peRFoRmAnce______________________________________________________________________________ 38
coRpoRAte goveRnAnce ______________________________________________________________________________ 40
FInAncIAl ReSultS ________________________________________________________________________________________ 48
gloSSARY _____________________________________________________________________________________________________ 127
ABBRevIAtIonS ___________________________________________________________________________________________ 128
Index ____________________________________________________________________________________________________________ 129
STanwell annual RepoRT 2011 1
Pictured on front cover: Mechanical engineer Scott Coxon outside Stanwell Power Station in Central Queensland
contentS

2 STanwell annual RepoRT 2011
HIgHlIgHtS
• Positive progress towards Zero Harm with a 19.9% reduction in our All Injury Frequency Rate (Health and safety page 19).
• A reduction in Lost Time Injuries from nine last year to two this year (Health and safety page 19).
• No Level 4 or Level 5 environmental incidents. This is the fifth year that this outcome has been achieved (Environmental performance page 35).
• Completed the sale of the Mineral Development Licence 162 coal resource, delivering a profit after tax of $189.7 million (Project development page 33).
• Finalised a Rail Transport Agreement with QR National Coal, providing long-term certainty for the delivery of coal from Central Queensland to Stanwell Power Station (Project development page 33).
• Completed a number of transactions aimed at securing gas supply for future power generation (Project development page 33).
• Undertook a major overhaul of Stanwell Power Station’s Unit 4, which included a low pressure turbine upgrade and generator rewind, delivering a 2.38% improvement in efficiency (Operations page 27).
• Installed low NOx burners on Stanwell Power Station’s Unit 4. This follows the installation of low NOx burners on Unit 3 in 2009. The station has two units, producing 40% less NOx emissions than before (Environmental performance page 35).
• Completed the sale of two wind assets—the Emu Downs Wind Farm and the Badgingarra Wind Development Project, both in Western Australia, completing the divestment of our wind portfolio (Operations page 27).
FInAncIAl HIgHlIgHtS
IndIcAtoRActuAl AnnuAl
cHAnge (%) 2010–11 2009–10 2008–09 2007–08 2006–07
Total revenue ($’000) (15.1) 562,619 662,995 670,367 540,949 515,357
Operating (loss)/profit before income tax equivalent ($’000)
(112.0) (24,579) 205,527 265,903 167,621 222,926
Operating (loss)/profit after income tax equivalent ($’000)
(108.0) (11,992) 149,462 195,605 135,590 155,762
Dividends declared ($’000) (100.0) – 116,700 148,944 92,105 122,301
Total assets ($’000) 5.0 1,814,749 1,981,966 1,930,734 1,916,386 2,626,402
Total liabilities ($’000) (7.5) 1,204,328 1,302,045 973,779 1,183,414 2,291,046
Total shareholders’ equity ($’000) (10.2) 610,421 679,921 956,955 732,972 335,356
Return on total assets* (%) (99.1) 0.0 11.7 14.5 7.5 10.7
Return on total equity** (%) (110.2) (1.9) 18.3 23.1 25.4 22.9
Earnings per share (cents) (108.0) (1.3) 16.2 21.7 13.8 15.9 *Earnings before interest and tax/average total assets
** Operating profit after tax/average total equity.

STanwell annual RepoRT 2011 3
WHo We ARe
we are a Queensland Government owned Corporation, with an energy portfolio comprising gas and coal resources, and thermal and hydro power generation facilities across Queensland.
We have the capacity to trade more than 30% of Queensland’s electricity requirements. Our plant portfolio includes:
• Stanwell Power Station, Central Queensland – 1,434 MW
• Kareeya Hydro, Far North Queensland – 86.4 MW
• Barron Gorge Hydro, Far North Queensland – 60 MW
• Mackay Gas Turbine, North Queensland – 34 MW
• Koombooloomba Hydro, Far North Queensland – 7.3 MW
• Wivenhoe Small Hydro, South East Queensland – 4.3 MW.
In addition to our own generating plant, Stanwell trades the output of Gladstone Power Station (1,680 MW) in the National Electricity Market (NEM).
coRe BuSIneSS
Stanwell bids its available generating capacity into the NEM, a wholesale market for the supply and purchase of electricity managed by the Australian Energy Market Operator (AEMO).
Within the NEM, electricity generators compete for the right to generate electricity into a central pool by submitting competitive price bids to supply nominated quantities of generation in certain timeslots throughout the day. Stanwell sells the electricity from our power stations into this market pool and is paid according to the spot price.
We also make financial transactions in the electricity derivative market to manage the price risk that Stanwell is exposed to in the NEM. These transactions are made with counterparties, which are generally electricity retailers.
ouR cuStomeRS
As an electricity wholesaler, Stanwell has a limited number of wholesale customers (referred to as counterparties).
ouR SHAReHoldeRS
Stanwell was formed on 1 July 1997 under the Government Owned Corporations Act 1993 (Qld) and registered under the Corporations Act 2001 (Cth). All shares are held by the State of Queensland.
HIgHlY SkIlled WoRkFoRce
Stanwell’s highly skilled, experienced and dedicated people are crucial to achieving our business goals and objectives. We employ 371 people directly, and approximately 250 contractors, across a range of professional, technical, trade, and administrative roles, and we value their extensive skills and experience.
Stanwell is committed to providing opportunities for professional development and leadership training (Employee relations page 21).
commItment to HeAltH And SAFetY
The health and safety of our people is our number one priority. Stanwell’s safety vision, “we will manage health and safety risks with a goal that no one gets hurt”, is being embedded in Stanwell’s safety culture through the Safety Improvement Project (SIP) (Health and safety page 19).
commItment to tHe envIRonment
Stanwell’s business strategy is focused on creating options to reduce our carbon intensity from a mixture of coal, gas and renewable energy resources.
Stanwell’s commitment to upgrade its existing plant to improve environmental performance and ongoing research into clean, renewable forms of energy are integral to our future business viability.
With three of our hydro facilities located in the most northern parts of Australia, our management systems recognise the differing sensitivities of the ecosystems which surround our power stations.
ReSponSIBIlItY to ouR communItIeS
Stanwell prides itself on being an active participant in the communities in which we operate, supporting community-driven development including education, environment, and health and safety. Our sponsorship program provides opportunities for financial support and community engagement on both a regional and Queensland-wide level. The diverse nature of our operations enables us to deliver a range of socio-economic benefits, including direct local employment and training, and the procurement of local goods and services.
4 STanwell annual RepoRT 2011
A neW eRA
In November 2010, the Queensland Government announced plans to restructure the three Queensland Government owned generating companies (Stanwell, Tarong Energy Corporation Limited and CS Energy Limited) into two (Stanwell and CS Energy Limited), effective 1 July 2011.
As part of the restructure, from 1 July 2011, Stanwell’s existing assets were combined with the Tarong, Tarong North, Mica Creek and Swanbank power stations, and the trading of the output of the Collinsville Power Station. The trading of the output of the Gladstone Power Station was divested to CS Energy Limited from 1 July 2011.
On 20 June 2011, the shareholding Ministers announced the following appointments to the Stanwell Board with effect from 1 July 2011:
• Graham Carpenter, Chairman, 1 July 2011 to 30 September 2014
• Kym Collins, Director, 1 July 2011 to 30 September 2014
• Graeme Crow SC, Director, 1 October 2008 to 30 September 2013
• Ann Fitzpatrick, Director, 1 July 2011 to 30 September 2014
• Russell Kempnich, Director, 1 July 2011 to 30 September 2013
• Julie Leaver, Director, 1 October 2009 to 30 September 2013
• Stephen Rochester, Director, 1 July 2011 to 30 September 2014
• Rodney Welford, Director, 1 July 2011 to 30 September 2013.
The newly appointed Board convened on 1 July 2011. At that meeting, the Board established two Board committees, and confirmed the members and chairs of those committees as follows:
Audit and Risk committee
• Julie Leaver, Chair
• Graham Carpenter, Member
• Stephen Rochester, Member
• Rodney Welford, Member
people and Safety committee
• Russell Kempnich, Chair
• Graham Carpenter, Member
• Kym Collins, Member
• Graeme Crow SC, Member
• Ann Fitzpatrick, Member.
On 1 July 2011, the Stanwell Board confirmed Helen Gluer’s appointment as Chief Executive Officer (CEO) of the restructured Stanwell entity. The Board also confirmed that the Executive Leadership Team reporting to the CEO, with effect from 1 July 2011, was as follows:
• Jackie Barber, Executive General Manager Marketing and Trading
• Wayne Collins, Chief Operating Officer
• Jenny Gregg, Executive General Manager Human Resources and Stakeholder Engagement
• Michael O’Rourke, Executive General Manger Governance and Corporate Strategy
• Richard Van Breda, Chief Financial Officer
• John Williamson, Executive General Manager Integration.

STanwell annual RepoRT 2011 5
RIgHt people
We recorded two Lost Time Injuries and a 19.9% reduction in our All Injury Frequency Rate (Health and safety page 19)—a substantial improvement on the previous year.
Behavioural-based safety tools were introduced as part of the Safety Improvement Project, along with a substantial investment in safety leadership across the business (Health and safety page 19).
In 2010, seven employees completed Stanwell’s Leadership Development Program, which encourages the leadership and management capabilities of participants. Another seven enrolled in the program in 2011 (Employee relations page 21).
A range of initiatives was offered to all employees to improve their health, wellbeing and fitness. These initiatives included flu vaccinations, health assessments, first aid courses, cancer screenings, and ergonomic assessments (Employee relations page 21).
RIgHt mARketS
We developed robust commercial relationships and enhanced our reputation as a dependable, professional and market-focused trading team, evidenced by the completion of significant new structured contract arrangements with important customers (Market trading page 31).
A new Deal Capture and Settlements System was developed and implemented, enabling us to more effectively and comprehensively measure and manage our financial risks (Market trading page 31).
RIgHt FuelS
We completed a pre-feasibility study into a carbon capture and storage project, which would use integrated gasification combined cycle technology (Project development page 33).
The feasibility study into a proposed hydro power station on the Burdekin Falls Dam in North Queensland made substantial progress (Project development page 33).
The completion of a new Rail Transport Agreement provides long-term certainty for the delivery of coal to Stanwell Power Station (Project development page 33).
Completion of a transaction with Tri-Star has secured access to gas for future gas-fired power projects (Project development page 33).
RIgHt plAnt
An upgrade of the low pressure turbine and a generator rewind on Stanwell Power Station’s Unit 4 delivered a 2.38% improvement in efficiency (Operations page 27).
The installation of low NOx burners on Stanwell Power Station’s Unit 4 has lowered Nitrous Oxide emissions (Operations page 27).
Reliability of the hydro fleet was enhanced with the completion of a stator core rebuild and generator rewind on Unit 1 at Barron Gorge Hydro (Operations page 27).
RIgHt oRgAnISAtIon
We maintained key stakeholder relationships in the areas in which we operate by communicating regularly and supporting regional events and community organisations (Community relations page 24).
RIgHt locAtIonS
We managed our impact on the environment and maintained our right to operate, with no Level 4 or 5 environmental incidents for the fifth consecutive year (Environmental performance page 35).
StRAtegIc dIRectIon
as the outcomes of the Shareholder Review of Queensland Government owned Corporation Generators, announced by the State Government in november 2010, affect Stanwell’s business moving forward, the strategic direction of the company will be a priority for the new Board and executive leadership Team.
YeAR In RevIeW

6 STanwell annual RepoRT 2011
peRFoRmAnce IndIcAtoRS
2010–11 2009–10
target ActualActual annual
change (%) target Actual
FInAncIAl
Total revenue ($m) 522.5 562.6 (15.13) 574.7 663.0
Earnings before interest and tax ($m) 102.9 0.5 (99.8) 242.0 237.4
Profit/(loss) after tax ($m) 44.0 (12.0) (108.0) 95.2 149.5
Net assets ($m) 531.9 610.4 (10.2) 328.9 679.9
Return on total assets (%) 6.3 0.0 (99.2) 8.3 11.7
Return on equity (after interest and tax) (%) 6.4 (1.9) (110.2) 17.3 18.3
Debt/debt + equity (%) 55.3 51.1 5.57 66.0 48.4
Interest cover (times) 2.6 0.0 (99.7) 5.4 5.8
Current ratio (times) 0.5 2.1 4.78 0.6 1.9
opeRAtIonAl
Annual availability (Stanwell Power Station) (%) 91.00 88.32 (3.61) 92.20 91.63
Forced outage factor (Stanwell Power Station) (%) 2.60 1.61 (18.27) 2.40 1.97
HeAltH And SAFetY
lost time Injury Frequency Rates
Employees only 0 1.43 (86.14) 0 10.32
Contractors and employees 0 1.71 (78.08) 0 7.80
envIRonment
environmental incidents
Level 4 or 5 0 0 0 0 0
Kareeya Hydro Power Station in Far North Queensland

STanwell annual RepoRT 2011 7
peRFoRmAnce oveRvIeW 2010–11
each year, we document the nature and scope of our strategies, objectives and actions in our Statement of Corporate Intent (SCI).
As a Queensland Government Owned Corporation, this document is part of our performance agreement with our shareholding Ministers. The SCI is consistent with and complements our five-year Corporate Plan. Our performance against our 2010–11 SCI is summarised below. A full copy of the SCI will be tabled in the Legislative Assembly in accordance with Section 121 of the Government Owned Corporations Act 1993.
StRAtegIc oBjectIve: RIgHt people – SkIlled people, StRong leAdeRSHIp
Initiative Actions desired outcomes Results
Drive to Zero Harm by providing a safe workplace through demonstrated leadership, safe practices, safe behaviours and improvements to the work environment.
Implement initiatives that continue to improve our safety performance and eliminate hazards for the benefit of our employees and contractors.
Equal to or greater than 15% improvement on the All Injury Frequency Rate (AIFR) for 2009–10.
Achieved
A 19.9% reduction in our AIFR was achieved (Health and safety page 19).
Occupational Health and Safety Management System Audits – zero major non-compliances.
Achieved
(Health and safety page 19).
Ensure our skills meet our business needs.
Implement actions arising from the skills capability review undertaken to assess current organisational capability in relation to the delivery of Stanwell’s strategic objectives.
Identified action plans implemented.
Achieved
(Employee relations page 21).
Optimise Stanwell’s recruitment and retention strategies to ensure competitiveness.
Review Stanwell’s key employee processes to ensure alignment with our future needs.
Staff turnover rate to be comparable to industry rates.
Achieved
A 9.29% turnover rate was achieved.
StRAtegIc oBjectIve: RIgHt mARketS – pRoFItABle mARket gRoWtH
Initiative Actions desired outcomes Results
Engage our customers to develop positive, long-term, commercial relationships.
Pursue revenue opportunities with both existing and new customers with the aim to improve gross margin.
One or more significant large structured value adding transaction completed.
Achieved
(Market trading page 31).
Updating our trading systems to flexibly manage our future trading needs.
Achieved
A new Deal Capture and Settlement system was implemented to better manage and measure our financial risk.
Develop and implement emissions trading processes and systems.1
Implement systems and processes that will allow Stanwell to comply with the Carbon Pollution Reduction Scheme (CPRS) and associated emissions trading scheme.
Systems and processes implemented to ensure compliance to legislation prior to commencement.
on track
Awaiting carbon tax legislation.
Monitor and review alternative carbon reduction schemes or variations to CPRS that may emerge.
Plans adjusted to accommodate any change of timing or approach.
on track
Awaiting carbon tax legislation.
1 The need for emissions trading processes and systems is dependent upon the finalisation of legislation.

8 STanwell annual RepoRT 2011
StRAtegIc oBjectIve: RIgHt mARketS – pRoFItABle mARket gRoWtH (ConTInued)
Initiative Actions desired outcomes Results
Match plant performance to portfolio and market needs.
Operate our existing portfolio plant to a regime that best meets the needs of the market.
Portfolio average availability >91%.
Further action required
Conscious commercial decisions based on market price expectations impacted availability, which was 87.62%.
Portfolio average forced outage factor ≤2.6%.
Achieved
Portfolio average forced outage factor was 1.9%.
Stanwell Power Station summer availability >96%.
Further action required
Conscious commercial decisions based on market price expectations impacted summer availability, which was 90.46%.
Stanwell Power Station 2015 and beyond project to review asset life plans and refurbishment requirements substantially progressed.
Achieved
Manage costs to improve profitability.
Reduce controllable costs across the organisation to improve the return to shareholders.
Provide an efficiency dividend to shareholders each year in the form of cost savings of $5 million for the years 2010–11 to 2013–14.
Further action required
The Stanwell directors have recommended that no dividend be provided in 2010–11.
StRAtegIc oBjectIve: RIgHt FuelS – dIveRSIFY ouR Fuel mIx
Initiative Actions desired outcomes Results
Create options to reduce Stanwell’s carbon footprint and carbon dioxide (CO2) intensity with a mixture of coal, gas and renewable energy resources.
Identify and secure access to potential energy resources.
Additional gas resource opportunities identified and progressed after the current gas positions are resolved.
Achieved
Commenced exploration activities with Icon and completed Tri-Star gas transaction (Project development page 33).
Solar data monitoring program under way at a number of locations.
Achieved
Under way at two locations.
Ensure long-term certainty of supply and fuel cost for Stanwell Power Station.
Review Stanwell Power Station’s key fuel arrangements to achieve a better match between supply chain flexibility and forecast market conditions.
Stanwell Power Station rail agreement revised to provide long-term flexibility by June 2011.
Achieved
Stanwell finalised a new Rail Transport Agreement with QR National Coal on 22 June 2011 (Project development page 33).
Complete sale of Mineral Development License 162.
Achieved
Completed the sale of MDL 162 in September 2010, delivering a substantial profit (Project development page 33).

STanwell annual RepoRT 2011 9
StRAtegIc oBjectIve: RIgHt plAnt – loWeR ouR cARBon IntenSItY
Initiative Actions desired outcomes Results
Develop a pipeline of new projects with varying life spans that will deliver a sustainable long-term portfolio of lower CO2 intensive plant and secure cost effective electricity supply.
Investigate a range of project opportunities that will lead to future low emission plant.
Gas plant prefeasibility study complete.
Achieved
Prefeasibility study into the development of a 300 MW gas peaking plant completed (Project development page 33).
Gas plant feasibility study initiated.
Further action required
Deferred, pending the restructure implementation (Project development page 33).
One South East Queensland gas generating site permitting in progress.
Achieved
Site secured and environmental studies have commenced (Project development page 33).
Burdekin Hydro feasibility study complete.
Further action required
The Burdekin Hydro feasibility study is expected to be completed by the end of the 2011 calendar year (Project development page 33).
Electric Power Research Institute carbon capture technology trials completed.
on track
Of the two sponsored sites, one has completed and the other has commenced operations.
Accelerated the pre-feasibility study to complete the Wandoan Power Project.
Achieved
Study completed in February 2011 (Project development page 33).
Solar thermal concept study initiated.
on track
Study to be completed by September 2011.
Business positioned to learn and participate in a large-scale solar initiative.
Further action required
Deferred, pending the restructure implementation.
Improve performance of Stanwell’s existing plant.
Continue to develop and implement performance improvements that have a positive impact on portfolio emission intensity.
Stanwell Power Station Unit 4 low pressure turbine upgrade and generator rewind completed by December 2010.
Achieved
Completed in November 2010 (Operations page 27).
StRAtegIc oBjectIve: RIgHt oRgAnISAtIon – ImpRove oRgAnISAtIonAl cApABIlItY And ReSponSIveneSS
Initiative Actions desired outcomes Results
Create an agile and responsive organisation.
Ensure we have the right systems and processes to deliver our strategic plan.
Plant Information Management System (PIMS) commitment decision reached.
Achieved
PIMS implementation largely completed.
Engage stakeholders to ensure a clear understanding of Stanwell’s business.
Improve and maintain key stakeholder perceptions in areas where Stanwell has, or intends to have, operations.
Key stakeholders have a clear understanding of Stanwell’s business.
Achieved

10 STanwell annual RepoRT 2011
StRAtegIc oBjectIve: RIgHt locAtIonS – QueenSlAnd BASed, RegIonAllY FocuSed
Initiative Actions desired outcomes Results
Maintain our Right to Operate. Manage our impact on the environment to meet legislative and permit conditions.
Stanwell Power Station Unit 4 low NOx burners complete by December 2010.
Achieved
Completed in November 2010 (Operations page 27).
Zero Level 4 and 5 environmental incidents.
Achieved
(Environmental performance page 35).
No material external environmental audit non-conformances.
Achieved
(Environmental performance page 35).
YeAR AHeAd 2011–12
as a result of the restructure of the Queensland Government owned generation sector, announced on 25 november 2010 and with effect from 1 July 2011, Stanwell’s plans for the year ahead are subject to consideration by the restructured company’s Board and executive leadership Team.
Barron Gorge Hydro Administration and Visitors Centre in Far North Queensland

STanwell annual RepoRT 2011 11
The financial year ended 30 June 2011 marks the end of the initial phase of Stanwell since its formation in July 1997. From 1 July 2011, Stanwell is operating under a new structure in line with the Shareholder Review of Queensland Government Owned Corporation Generators (Genco Review), issued in november 2010.
Stanwell has incurred a net loss after tax of $12.0 million for the 2010–11 year. This loss would have been significantly higher without the contribution of:
• profit on the sale of assets surplus to ongoing requirements
• continuing revenue from our coal rebate arrangements.
Further information on the company’s performance is contained in the Directors’ Report.
The 2010–11 year has been a year of change and challenge particularly in the following areas:
SAFetY
Action to improve the safety of our employees and their workplaces has continued with the Safety Improvement Project and Zero Harm initiatives. The results have been encouraging to date and safety continues to remain our number one priority.
nAtuRAl dISASteRS
Our operations and staff experienced the impact of the floods in Brisbane and Central Queensland, and Cyclone Yasi in Far North Queensland during the year. These have been very difficult times for many, and Stanwell has been working to assist people and communities in the recovery effort. Our Business Continuity Plans were successfully enacted on each occasion and, while continued wet weather has delayed the rebuild of coal stockpile levels at both the Gladstone and Stanwell power stations, we have adjusted our generation to take this into account. The resilience of our people and the affected communities has been the outstanding trait exhibited during these times.
ReStRuctuRe
The Genco Review had been foreshadowed for some time and once announced, Stanwell’s directors, Acting Chief Executive Officer (CEO) and Executive Management Team focused on its successful implementation. This was a challenging time for Stanwell and its employees. It is a tribute to the calibre of our staff that ‘business as usual’ was able to continue while, at the same time, planning and involvement in the implementation teams for the restructure was taking place.
Wayne Collins, as Acting CEO, and his Executive Management Team have impressively steered the company and its activities during the year and I thank them most sincerely for their dedication and leadership. I also give my special thanks to my fellow directors Denis Byrne (former Chairman), Tony Andersen, Graeme Crow SC, Laurie Gillespie and Mark Williamson for their commitment and support.
On behalf of the Board, I thank our two shareholding Ministers for their support during the year: Minister for Finance, Natural Resources and The Arts, The Honourable Rachel Nolan MP, and Minister for Energy and Water Utilities, The Honourable Stephen Robertson MP.
I welcome the incoming Chairman and directors, and the new Chief Executive Officer and Executive Leadership Team appointed to the new Stanwell that is effective from 1 July 2011. It is a challenging environment in which we operate and I am sure that the new business will be invigorated by the changes and the challenges ahead.
julie leaver Chairman (17 March 2011 to 30 June 2011)
cHAIRmAn’S StAtement (StAnWell cHAIRmAn AS At 30 june 2011)

12 STanwell annual RepoRT 2011
meSSAge FRom IncomIng cHAIRmAn
as the incoming Chairman of the new Stanwell Board, I would like to pass on my thanks to former Stanwell directors for their stewardship during the past 14 years.
In particular, I would like to thank former chairmen Denis Byrne and Julie Leaver for their leadership in recent years. The 2010–11 financial year presented a unique set of challenges as Stanwell prepared for the restructure following the Genco Review.
The Stanwell Board’s commitment and support during this time ensured that Stanwell’s people, systems and assets were well-positioned for a smooth and effective restructure.
My immediate focus, and that of my fellow directors, will be to define the corporate values and strategy for the new organisation, while ensuring that we maintain our focus on safety, performance and profitability.
The new business brings with it new challenges and new opportunities, which I am sure we will greet with the enthusiasm, professionalism and dedication that has ensured Stanwell’s success in the past.
graham carpenter Incoming Chairman
Stanwell Power Station in Central Queensland

STanwell annual RepoRT 2011 13
This year, we delivered significant financial and operational achievements, while maintaining our focus on safety. This was done despite the challenges we faced when natural disasters affected our corporate office in Brisbane and three of our main operational sites.
Adding to the challenges we faced this year was the announcement of the outcome of the review into the Queensland Government owned generating sector (Genco Review) and the transition period that followed.
Prior to the announcement of the carbon tax, the business was on track to deliver a record profit. Asset impairment and onerous contract provisions associated with the announcements will turn this into a loss of $12.0 million.
In addition to carrying out major planned maintenance activities and completing substantial plant upgrades, we have also made significant progress towards our Zero Harm goal. Almost 20% fewer people were hurt in this past year and this has provided great encouragement to continue the investment in our leadership group, our workforce, our plant and our systems, in pursuit of this goal.
ReSpondIng to cHAnge
In November 2010, following the announcement of the Genco Review, we began preparing our business for the transition. General managers Brad Neven and Michael O’Rourke took on important leadership roles for the transition and employees from all levels across the business were seconded to the two implementation teams at various times. As a consequence of their work, the foundations for a smooth and effective transition to the new business were laid.
As a result of the movement of people into the transition teams, many of our remaining staff willingly took on additional responsibility to ensure the existing business continued to perform. My thanks go to all who kept the business on track during this period. I particularly wish to thank Ian Gilbar, Jason Mahoney, Michelle Forrest, Trevor Hooper and Chris Walker, who very capably stepped in to the executive team for varying periods, for their sound leadership under difficult conditions.
opeRAtIng In A cHAllengIng envIRonment
Flooding in Central Queensland during December 2010 and January 2011 affected employee access and coal supplies to Stanwell and Gladstone power stations. It also affected access to our Rockhampton office for some employees. Prudent risk management and business continuity planning meant that we had enough coal in our stockpile at Stanwell Power Station to allow the station to continue to generate. Essential employees were flown in via helicopter to Stanwell Power Station while others used technology to continue to work remotely.
The rain continued south and, on 11 January 2011, our Brisbane corporate office was evacuated in preparation for flooding in Brisbane. We were unable to return to the office for a fortnight. Again, our business continuity planning and the distribution of our key systems allowed us to continue trading remotely for the 14 days that the office was out of commission. Mercifully, only a small number of our staff suffered property damage from the flooding.
Less than one month later, Barron Gorge and Kareeya hydro power stations were evacuated in preparation for Cyclone Yasi, which crossed the North Queensland coast on the night of Wednesday 2 February 2011. Almost all employees at Kareeya Hydro suffered some form of damage to their personal properties. Both hydros suffered minor damage and returned to service within a few days of the cyclone passing.
conSolIdAtIng ouR BuSIneSS
The effects of flooding on coal supplies and coal rebates, combined with a very soft electricity market, resulted in total revenue of $562.6 million for the 2010–11 year, which is $100 million less than the previous year.
The outstanding result achieved with the sale of Mineral Development Licence 162 saw the culmination of a long-term strategy to most profitably utilise and monetise our coal reserves.
Further, in June 2011, we completed the sale of two wind assets— the Emu Downs Wind Farm and the Badgingarra Wind Development Project, both in Western Australia. This sale will allow the business to focus on optimisation of our Queensland based portfolio of fuel and generation assets.
ActIng cHIeF executIve oFFIceR’S RevIeW

14 STanwell annual RepoRT 2011
A new Rail Transport Agreement with QR National Coal was signed, providing long-term certainty for the delivery of coal from Central Queensland to Stanwell Power Station. It also has the potential to facilitate coal deliveries to the Port of Gladstone.
upgRAdIng ouR ASSetS
The major overhaul of Stanwell Power Station’s Unit 4 included a low pressure turbine upgrade and generator rewind, delivering a 2.38% improvement in efficiency. As part of the outage, we also installed low NOx burners, which will reduce NOx emissions by about 40% when all units are modified.
At Barron Gorge, Unit 1 returned to service in August 2010 following a generator stator rebuild and rewind, and refurbishment of other key components. The same project commenced on Unit 2 in April 2011.
commIttIng to ZeRo HARm
We continued to make positive progress towards our target of Zero Harm to all employees and contractors. We have hurt less people this year, compared with the same time last year.
There were two Lost Time Injuries in 2010–11, which is significantly less than the nine recorded in 2009–10. The All Injury Frequency Rate reduced by 19.9%. However, even with the reduced number of injuries, there is still more to be done and we will continue to focus on keeping our people safer.
InveStIng In ouR communItIeS
In response to the December–January floods and Cyclone Yasi, Stanwell contributed more than $190,000 to recovery initiatives. A substantial portion of this support was directed to heavily impacted community organisations, schools and sporting clubs in the vicinity of our affected operations. Stanwell employees and contractors donated almost $20,000 to the Premier’s Disaster Relief Appeal and Rockhampton Wildlife Rescue. Stanwell matched these donations dollar-for-dollar.
RecognISIng ouR people
I would like to pay tribute to our Board, Executive Management Team and staff for their dedication and professionalism. I would particularly like to acknowledge the contribution of Denis Byrne and Julie Leaver, the two chairs of Stanwell during this past year. I have greatly appreciated their sage counsel and their unwavering support for staff throughout this period of uncertainty.
I must also recognise the efforts of our shareholders’ representatives: the Office of Government Owned Corporations and the Department of Employment, Economic Development and Innovation – Mines and Energy.
The past 18 months as Acting Chief Executive Officer have been extremely rewarding and I have been proud to see everyone step up and meet the challenges that we have encountered, while remaining positive and focused on the job at hand. Our achievements, as always, are a direct reflection of the high quality of the people we have working in the business.
Wayne collins Acting Chief Executive Officer

STanwell annual RepoRT 2011 15
BoARd oF dIRectoRS (AS At 30 june 2011)
denIS BYRnechairman*(July 2006–March 2011)
Independent non-executive directorTerm of appointment: July 2006–June 2011
tonY AndeRSenIndependent non-executive directorTerm of appointment: October 2009–June 2011
julIe leAveRchairman (March 2011–June 2011)
chairman Audit and Risk management committee (October 2009–April 2011)
Independent non-executive directorTerm of appointment: October 2009–present
gRAeme cRoW ScIndependent non-executive directorTerm of appointment: October 2008–present
lAuRIe gIlleSpIechairman Human Resources and Workplace Health and Safety committee(August 2007–June 2011)
Independent non-executive directorTerm of appointment: July 2006–June 2011
mARk WIllIAmSonchairman Audit and Risk management committee(April 2011–June 2011)
chairman of the project Advisory group(October 2009–June 2011)
Independent non-executive directorTerm of appointment: July 2001–June 2011
For full biographies, please refer to page 51 of the Directors’ Report.
*Mr Byrne was appointed Interim Chairman of the CS Energy Advisory Board and, accordingly, at the 16 March 2011 Board meeting was granted an unpaid indefinite leave of absence from the Stanwell Board.

16 STanwell annual RepoRT 2011
WAYne collInSBEng (Electrical), BBus, CPEng, GAICD
Acting chief executive officer(January 2010–June 2011)
gARRY ButtonBCom (UNSW), FCPA, FFTP, MAICD
Acting general manager corporate Services (April 2011–June 2011)
Acting general manager trading (April 2011–May 2011)
chief Financial officer(February 2008–April 2011)
mIcHelle FoRReStBCom, Adv Dip Fin Services (Financial Markets), AFMA Accredited
Acting general manager trading (May 2011–June 2011)
Wayne has worked in the electricity industry for almost 30 years, in a variety of engineering, managerial and business development roles, principally associated with power generation.
In January 2010, Wayne was appointed Acting Chief Executive Officer of Stanwell.
He has been a senior executive with Stanwell for 13 years, with previous management roles in business services, asset management and technical services, and business development.
As Acting General Manager Corporate Services, Garry is responsible for the internal departments of secretariat, legal, internal audit, insurance and quality.
Prior to this, Garry held the position of Stanwell Chief Financial Officer (from February 2008–April 2011). He has also held several senior financial and corporate roles within Queensland Rail, Fairfax and Unilever Australia.
Garry resigned as a non-executive director of Blue Energy Limited on 30 June 2011.
As Acting General Manager Trading, Michelle is responsible for managing the operations of the Trading division to maximise profitability through an integrated trading strategy within the risk management framework.
This includes the contract trading, spot trading, regulatory, strategy and analytical functions.
Prior to acting in the General Manager Trading role, Michelle held the positions of Trading Manager and Spot Trading Manager within Stanwell.
executIve mAnAgement teAm (AS At 30 june 2011)

STanwell annual RepoRT 2011 17
IAn gIlBARBEng (Electrical)
Acting chief operating officer(April 2010–June 2011)
tRevoR HoopeRAD Elect Eng, MBA
Acting general manager Business Services (January 2011–June 2011)
jASon mAHoneYBCompt (UNISA), Chartered Accountant
Acting chief Financial officer (April 2011–June 2011)
As Acting Chief Operating Officer, Ian is responsible for managing the organisation’s plant operations.
Ian has worked for Stanwell for 14 years and has almost 30 years’ experience in the electricity industry in various engineering and technical management roles.
During the past three years at Stanwell, Ian has been heavily involved in the renegotiation of the Gladstone Interconnection and Power Pooling Agreement.
As Acting General Manager Business Services, Trevor is responsible for managing health and safety, environment, information and communication technology, risk, facilities, quality, information resources and human resources.
Trevor has broad and extensive experience in the electricity industry in Queensland. He has performed various managerial roles across production, maintenance, commercial and more recently in the services areas. Trevor has been heavily involved in the implementation of the safety improvement initiatives across all Stanwell sites in recent times.
Jason is responsible for Stanwell’s finance, business improvement, energy and financial risk management, and procurement functions. Prior to being appointed the Acting Chief Financial Officer, Jason held the position of Financial Controller.
Jason has held a General Manager Finance role in an ASX 200 company and was a senior manager at Ernst & Young.

18 STanwell annual RepoRT 2011
BRAd nevenMBA (HRM), ComDec, MAHRI, MIRSQ
Seconded to the Implementation team for the restructured Stanwell(January 2011–June 2011)
general manager Business Services(May 2008–January 2011)
mIcHAel o’RouRkeBLaw, BCom, GDip Applied Finance and Management, GDip Company Secretarial Practice
Seconded to the Implementation team for the restructured Stanwell (April 2011–June 2011)
general manager corporate Services (September 2007–April 2011)
Acting general manager trading(March 2010–April 2011)
cHRIS WAlkeRBA, MBA (UQ)
Acting general manager Business development(April 2011–June 2011)
Brad Neven has worked for Stanwell for more than 10 years in a variety of human resource and managerial roles, including Employee Relations Manager.
In 2008, Brad was appointed the General Manager Business Services, responsible for managing health and safety, environment, information and communication technology, risk, land and property, and human resource management.
From January to June 2011, Brad was seconded to the Stanwell Implementation Team to assist with the smooth and effective transition to the new business.
Michael joined Stanwell in 1998 as Legal Counsel and was responsible for the strategic direction and operational performance of Stanwell’s legal team. In 2002, Michael was appointed Stanwell’s Company Secretary/Legal Counsel. As Company Secretary, Michael reported to the Stanwell Board on all secretariat related matters.
In 2008 Michael was appointed General Manager Corporate Services, responsible for the internal departments of secretariat, legal, internal audit, corporate communications, stakeholder relations, insurance and quality.
In March 2010, Michael was appointed Acting General Manager Trading and was responsible for the physical and financial trading of electricity and market forecasting.
From April to June 2011, Michael was seconded to the Stanwell Implementation Team to assist with the smooth and effective transition to the new business.
Chris Walker has more than 30 years of experience in the electricity industry in a variety of roles, including finance, power station operations and procurement.
For the past 13 years, Chris has worked for Stanwell in business development.
He is responsible for facilitating the development of corporate strategy, the operational and strategic fuel and water needs of existing assets, and investigating and securing investment opportunities in gas, clean coal, and renewable energy. He is also responsible for Corporate Communications.

STanwell annual RepoRT 2011 19
HeAltH And SAFetY
WHAt We Set out to AcHIeve tHIS YeAR HoW We peRFoRmed
Maintain the Zero Incident Process (ZIP). Achieved
The Health and Safety teams/site representatives have been trained as ZIP coaches, ensuring that the processes are maintained.
Maintain the Fitness for Duty (FFD) program. Achieved
Fatigue monitoring and alcohol and other drugs testing of employees and contractors continued.
Undertake compliance/improvement audits against health and safety corporate standards.
Achieved
Audits performed and non-compliances dealt with according to policy requirements.
Continue implementation of the Safety Performance Action Plan (Safety Improvement Project).
Achieved
The Safety Improvement Project is progressing according to project plan. Employees have received Zero Harm training and have been provided with tools to assist with personal risk assessment and performance of safety observations.
Retain AS/NZS 4801:2001 certification. Achieved
Undertake ongoing work environment improvements.
Achieved
Site safety committees continued to identify and implement safety improvement initiatives across all sites, with more than 20 site driven improvements noted by the Board.
Target Zero Harm. on track
All Stanwell performance indicators show a steady trend towards Zero Harm. However, there is still more to be done.
Continue to lower our All Injury Frequency Rate (AIFR).
on track
A 19.9% reduction was recorded this year.
SAFe people
Stanwell’s safety vision, “we will manage health and safety risks with a goal that no one gets hurt”, is being embedded in Stanwell’s safety culture through the Safety Improvement Project (SIP).
SAFe pRActIceS
Stanwell’s safe work systems (including Authority to Work) have been fully implemented, with a major upgrade of the computer software supporting this system successfully completed during the year.
Supporting these systems of work are new behavioural-based safety tools: Safety Observation Guides and TAKE 1 (a personal risk management process).
Underpinning these practices is an established network of health and safety meetings, including the Central Safety Committee and onsite safety meetings, which encourage teams to identify health and safety improvement initiatives.
SAFe WoRk envIRonment
During the year, Stanwell continued to identify and implement safety initiatives to improve the standard of safety in our working environments.
At Stanwell Power Station, traffic management improvements in the main workshop, new protocols for security gates and line marking for pedestrian access separated vehicle and pedestrian traffic across the site.
We developed a hydraulic system at Barron Gorge Hydro to eliminate the difficulties of working in a confined space and the risk of entrapment when replacing turbine runners.
We also endeavoured to assist our staff to be safe outside of work, by issuing high visibility vests, personal safety glasses and first aid kits to corporate staff.
SocIAl peRFoRmAnce
SAFetY ReSultS
Stanwell’s safety performance continues to show an improvement in line with our target of Zero Harm to all employees and contractors.
During the year, there were two Lost Time Injuries, which is significantly less than the nine recorded in 2009–10.
Stanwell recorded a Lost Time Injury Frequency Rate (LTIFR) of 1.43 for employees and 2.12 for contractors, resulting in a combined LTIFR of 1.71 (compared with 7.80 in 2009–10).
Most pleasing was the 19.9% reduction in the All Injury Frequency Rate.

20 STanwell annual RepoRT 2011
cASe StudYAudItIng And ImpRovIng ouR SYStemS
Stanwell’s Occupational Health and Safety Management System has retained certification to AS/NZS 4801:2001.
Selected occupational health and safety corporate standards were audited by an external auditor for compliance and to identify improvements. No major non-conformances were reported.
SAFe SpIne pRogRAm
In response to a number of strain injuries reported in office-based work environments, a safe spine program was implemented to prevent/reduce musculoskeletal strain injuries.
The safe spine program provided staff with tools and assistance to prevent back injuries, focusing on posture, workstation set-up, exercise and stress management. The program sought to protect people’s backs in their everyday working environments, as well as at home, on a plane and in the garden.
The safe spine program was delivered to the corporate offices during April and May 2011 with great success.
On a daily basis, corporate office workers complete a series of short exercises and stretches in their work groups to help mobilise and stretch their bodies, in order to help prevent future harm and increase health and wellbeing. These exercises are led by Stanwell employees who volunteered to attend the Safe Spine Leader training session.
“Leading the stretches has proven a great way to refresh not just the body, but the mind to ensure I am focused on the next job.”
– Safe Spine Leader
loSt tIme InjuRY FReQuencY RAte
4.29
5.79
3.08 3.57
1.52
9.73 10
.32
1.43
7.80
1.71
2006
–07
Employees Employees and contractors
2007
–08
2008
–09
2009
–10
2010
–11
This year we had a decrease in Lost Time Injuries, particularly during the Stanwell Power Station outage.
All InjuRY FReQuencY RAte
58.9
6
147.
67
120.
41*
173.
43
65.3
5 96.4
5
Employees Employees and contractors
2009
–10
2008
–09
2010
–11
A reduction in the AIFR can be attributed to fewer injuries throughout the year.* This figure has been changed following the submission of data for reporting. The figure provided in the 2009–10 Annual Report was 108.28.
loSt tIme InjuRY duRAtIon RAte
18.0
011
.60
3.00 3.50
16.0
03.
91
6.71
1.00
7.78
2.00
2006
–07
Employees Employees and contractors
2007
–08
2008
–09
2009
–10
2010
–11
The decrease in the LTIDR can be attributed to a decrease in the days lost per injury.
loSt tIme InjuRY SeveRItY RAte
Employees Employees and contractors
69.2
860
.64
1.43 3.41
2009
–10
24.3
6 40.7
020
08–0
9
2010
–11
A significant decrease in the LTISR was recorded due to fewer days lost for the two lost time injuries.

STanwell annual RepoRT 2011 21
emploYee RelAtIonS
WHAt We Set out to AcHIeve tHIS YeAR HoW We peRFoRmed
Finalise new workplace agreements for Stanwell Power Station, Barron Gorge Hydro and Kareeya Hydro.
on track
Negotiations with the unions regarding the new workplace agreements are continuing, with completion expected in the second half of 2011.
Implement e-Recruitment – a technology to improve efficiency in the recruitment process.
Further action required
Project placed on hold due to the Genco Review.
Implement a new performance management system.
Further action required
Project placed on hold due to the Genco Review.
Stanwell’s employee relations strategy recognises the importance of providing individual development opportunities to foster the potential of our people.
Stanwell’s strategies are also cognisant of our broader corporate obligations to ensure that a skilled and trained workforce exists to assure management, technical and operational resources in our industry, into the future.
Our current workforce includes 371 employees and approximately 250 Full Time Equivalent contractors.
BuIldIng A StRong RegIonAl WoRkFoRce
As many of our employees are located in regional areas, Stanwell has continued to focus its workforce development initiatives in these locations.
In 2010–11, Stanwell continued to review the location of Brisbane-based professional and administrative roles as vacancies occurred. Where sensible, these have been filled in Rockhampton.
AddReSSIng tHe SkIllS gAp
Stanwell supports an integrated approach to employee development, recognising that it is an essential part of planning, management and day-to-day operations. Stanwell’s capability review, completed in
2010, provided the basis for ensuring that gaps in identified key capabilities were addressed via a combination of targeted recruitment and individual development (via training plans).
To remain competitive, and to attract and retain skilled employees, Stanwell has in place a range of initiatives, including:
• training and development programs, including the Leadership Development Program, graduate programs, study support, and apprentice and trainee programs
• improvements to recruitment processes, including improved branding and a review of Stanwell’s Recruitment Guidelines
• the Power Generation Skills Development Program which, in conjunction with three Queensland universities, offers professional engineers and paraprofessionals the opportunity to accelerate their technical competency. There are currently 13 employees participating in this program
• hosting engineering students and lecturers from CQUniversity at Stanwell Power Station to demonstrate engineering career opportunities
• participating in career fairs and expos across Queensland
• providing part-time study support to 43 employees across the company.
SuppoRtIng gRAduAteS, AppRentIceS And tRAIneeS
Stanwell’s Apprentice and Trainee Program offers one-year Business Administration trainee positions, two-year Warehousing trainee positions, and four-year trade and five-year dual-trade apprentice placements. As of 30 June 2011, there were 16 apprentices and five trainees placed throughout Stanwell.
In February 2011, Stanwell welcomed two new apprentices in the electrical, and fitting and turning fields. This year, the apprentices undertook a portion of their training at Gladstone Area Group Apprenticeships Ltd’s state-of-the-art training centre in Gladstone.
Stanwell’s Graduate Development Program is a two-year or three-year structured program that includes extensive on-the-job training and development. At 30 June 2011, there were seven graduates enrolled in the program across disciplines such as electrical and mechanical engineering, industrial chemistry and land management.
InveStIng In ouR FutuRe leAdeRS
In 2011, seven employees completed Stanwell’s Leadership Development Program. The program is designed to harness the leadership and management capabilities of participants through initiatives such as:
• professionally accredited business courses
• coaching and mentoring programs
• leadership benchmark assessments, prior to and at the end of the program, to gauge leadership skill improvement
• involvement in special company projects and/or geographical and functional rotation within Stanwell
• exposure to guest speakers and networking opportunities
• technical skills training.
Many past participants have now moved onto more senior roles and special projects within the company, and provide ongoing support and encouragement to new program participants.

22 STanwell annual RepoRT 2011
WoRkFoRce numBeRS*
2006–07 2007–08 2008–09 2009–10 2010–11
360 368 395 383 371
Workforce numbers have reduced during the past three years. Last year’s reductions can be attributed to a freeze on recruitment of non-critical roles due to the Genco Review.*Workforce numbers do not include positions within the organisation that were vacant at the time of reporting and which are intended to be filled in the future.
SecuRIng condItIonS oF emploYment
There are four certified agreements that contain the conditions of employment for our employees: Stanwell Power Station, Barron Gorge Hydro, Kareeya Hydro and Stanwell Corporate Offices.
The renegotiation of the Stanwell Power Station, Barron Gorge Hydro and Kareeya Hydro certified agreements commenced in the second half of the 2010–11 financial year. Stanwell is working towards renegotiating these agreements by 30 September 2011.
HelpIng ouR people StAY HeAltHY And Well
Stanwell has a health and wellbeing initiative called Stanwellbeing. This initiative focuses on proactively improving the health, wellness and fitness of all employees. It includes health assessments and cancer screenings; a free, confidential and voluntary counselling service; flu vaccinations; first aid training; access to a child care referral service; ergonomic assessments; and a range of educational newsletters and fact sheets addressing key health and wellbeing topics.
In 2010–11:
• 77 employees took up Stanwell’s offer of a flu vaccination
• 135 employees received a health assessment
• Stanwell nominated first aiders received annual training
• 14 employees volunteered to undertake cancer screenings
• 141 corporate staff participated in safe spine training
• 200 Stanwell employees and contractors participated in the Global Corporate Challenge (a pedometer-based challenge to ‘virtually’ walk around the world)
• 100 people received an ergonomic assessment
• three employees utilised Stanwell’s childcare referral service.
SuppoRtIng eQuAl emploYment oppoRtunItY And dIveRSItY
Stanwell provides all employees with easy access to Equity Referral Officers (EROs) who are specially trained to engage with employees who require information or support relating to discrimination or harassment issues. These officers are situated at each site.
Stanwell regularly monitors Equal Employment Opportunity (EEO) statistics and focuses on both its EEO provisions and promotion of EEO within the workplace. Stanwell provides the Public Service Commissioner with an annual report on the outcomes of any actions, as required under section 30 of the Public Service Act 2008.
Initiatives to further improve the diversity of the corporation’s workforce are currently being developed.
EEO discrimination and harassment training is provided as part of our induction process for all new employees, with all employees undergoing EEO refresher training every two years.
cASe StudY
WoRkplAce mentoRIng FoR Women
Stanwell introduced a workplace mentoring program to develop our future female leaders and to assist us to achieve genuine diversity within the organisation.
The program provides participants with the tools, skills and awareness to enhance business productivity and align with Stanwell’s ongoing commitment to best practice. The program runs for 12 weeks, with 12 modules to be completed during that time.
The modules provide information on, and practical strategies for, planning and managing a career; understanding gender differences in leadership styles; personal branding and adding value; and negotiation and communication skills required for leadership.

STanwell annual RepoRT 2011 23
eeo numBeRS
eeo*
numBeR oF emploYeeS AS At 30 june 2011 poSItIon cAtegoRY
Female 97 Managerial, professional and clerical
Male 274 Managerial, professional, trade or related, clerical
Non-English speaking background
19 Managerial, professional, clerical
Aboriginal and Torres Strait Islander (ATSI)
3 Professional, clerical
People with a disability 17 Managerial, professional, trade or related, clerical
The number of Aboriginal and Torres Strait Islander employees remained consistent with last year. * Employees have the option not to respond to our EEO questionnaire. As at 30 June 2011, 32 employees had not responded. The number of respondents that chose not to respond to each of the EEO categories is:
• Non-English speaking background: 32
• ATSI: 32
• People with a disability: 32
cAReeR development pRogRAmS
poSItIonS numBeR oF poSItIonS AS At 30 june 2011
Trainees 7
Apprentices 16
Graduate development 6
Paraprofessional 0
Co-op engineers 2
Total 31
Approximately 9% of the workforce is involved in a formal career development program.
emploYee tuRnoveR
2006
–07
70
60
50
40
30
20
10
0
Number of departures
Annual turnover rate
2007
–08
2008
–09
2009
–10
2010
–11
There has been a significant reduction in the turnover rate during the past five years. However, there was a slight increase from last year to this year.

24 STanwell annual RepoRT 2011
communItY RelAtIonS
WHAt We Set out to AcHIeve tHIS YeAR HoW We peRFoRmed
Apply agreed social investment protocols to ensure support remains regionally focused and relevant to the communities in which we operate, and to achieve mutually beneficial outcomes from sponsor partnerships.
Achieved
Adhered to approved processes and procedures with regard to consideration of sponsorship proposals, support agreed to during the period and ongoing partnerships. Delivered positive outcomes for Stanwell and sponsored organisations.
Explore and continue to develop our stakeholder database system to improve reporting and the management and analysis of interactions with stakeholders.
on track
Used database effectively to record stakeholder interactions and outcomes, and for monitoring and reporting purposes. Continued to develop and make improvements to the system.
ouR SocIAl InveStment StRAtegY
Stanwell’s social investment strategy focuses support on three key areas to effectively address the company’s social interests:
• education – support for youth in areas of educational and self development, with particular focus on regional Queensland, and support for opportunities to improve the outlook for skilled engineering and other professions related to Stanwell’s core business
• environment – support for positive environmental initiatives, particularly those aligning with Stanwell’s business direction and/or those that are of benefit to our regional communities
• Health and Safety – support for initiatives that seek to promote a healthy, active and safe lifestyle and which demonstrate Stanwell’s commitment to a positive work-life balance and to the communities in which we operate.
InveStIng In ouR communItIeS
During 2010–11, we continued to focus our social investment activities in the regions where Stanwell operates, and to provide opportunities for local communities and employees to engage in positive ways through financial and non-financial support for these activities.
We maintained support for our existing major sponsorships, committing to another three years’ support for Beacon Foundation, Life Stream Foundation and the Central Queensland Comets. In addition, Stanwell committed to sponsor Capricorn Netball (to December 2013) and the Central Queensland NRL Bid’s Junior Development Program (to December 2011).
capricorn netball
In January 2011, Stanwell committed major sponsorship for Capricorn Netball’s new ‘Train Well…Play Well…Stanwell’ player and volunteer development strategy for the region’s netballing community. The program will help identify and nurture promising young players, and provide development pathways for talented juniors, and education and training opportunities for the sport’s volunteers.
the Beacon Foundation
As part of our support for Beacon, Stanwell Power Station hosted a ‘Lunch with the Girls’ program for 15 to 16 year-old Mount Morgan State High School girls, providing an opportunity for students to engage with professional women and increase their knowledge of work culture, employer expectations and potential career paths. Stanwell also worked with Beacon to progress development of a similar ‘BBQ with the Boys’ program, expected to be rolled out in 2011–12. In addition, we conducted student and teacher tours at our power stations and offices, provided
guest speakers at Beacon events, and attended No Dole program charter signing ceremonies.
life Stream Rockhampton
Stanwell continued to have a representative on Life Stream’s Board and to provide office space to Life Stream Rockhampton to assist with the expansion of services to people in Central Queensland who have an intellectual disability. During the year, Life Stream delivered weekly sporting programs to local schools and the Endeavour Club, catering for ages ranging from six to 60. Disability workshops and practical community programs were also organised, along with interschool athletics competitions.
central Queensland Rugby league development programs
In January 2011, Stanwell renewed its major sponsorship of the Central Queensland Comets Rugby League Under 16 and Under 18 Development Squads, and committed to sponsor the CQ NRL Bid’s new Junior Development Program for Under 13 players from Central Queensland. Stanwell’s support aims to provide opportunities for local youth to stay and play in the region longer, while offering a path for young players through to higher levels in the game.
otHeR SponSoRed InItIAtIveS• Rotary club of Rockhampton
Stanwell power Station Rocky River Run – Held on 12 June 2011, the annual community fun run has continued to grow, attracting approximately 500 registered entrants this year, including representatives from Stanwell and local Stanwell-sponsored organisations. Proceeds from the event were again directed to local charities working for the prevention of youth suicide.
• Southern cross Soloists SunWater and Stanwell music School – Held in Rockhampton in July 2010 and April 2011, the week-long annual educational event was attended by more than 90 talented young high school music students from around the State.

STanwell annual RepoRT 2011 25
• tennis Queensland Stanwell Far north Queensland Regional development program – This initiative encouraged physical activity by providing opportunities to play tennis at free Stanwell Community Fun Days, held by participating tennis clubs in and around Cairns. It also provided professional development for leading regional junior tennis players. Stanwell also supported the inaugural Cairns Tennis International.
• Yalari – The annual ‘Stanwell Classic’ lawn bowls fundraiser was hosted by Stanwell in Brisbane on 28 October 2010, raising more than $40,000 for youth charity Yalari to provide scholarships to indigenous students.
• cQ Zero Harm conference – Held in Rockhampton in October 2010, this has become an annual event aimed at increasing the profile of workplace health and safety in Central Queensland.
• Queensland natural disaster Recovery initiatives – In response to the December/January floods and Cyclone Yasi, Stanwell contributed more than $190,000 to recovery initiatives, including the Premier’s Disaster Relief Appeal, Rockhampton Wildlife Rescue, local schools and sporting clubs in Rockhampton and Tully, and essentials kits provided by Baked Relief.
emploYee SuppoRt Employee-driven support of charitable programs saw our staff commit their personal time to assist community fundraising initiatives:
• In Rockhampton in May 2011, Stanwell Power Station’s Live Wires team competed in the local annual Cancer Council’s Relay for Life for the eighth consecutive year, raising more than $5,000. Stanwell acknowledged the Live Wires’ support by matching this amount dollar-for-dollar.
• In Brisbane in November 2010, a team of Stanwell employees took part in the annual Cool Night Classic corporate run/walk in the CBD to raise funds for chosen beneficiaries The Pyjama Foundation and Street Swags.
• In Cairns in November 2010, Stanwell employees participated in the Cairns Crocs Triathlon Club time trial event to raise funds for the Movember male health initiatives, specifically prostate cancer and depression in men.
• In early 2011, Stanwell employees and contractors donated almost $20,000 to the Premier’s Disaster Relief Appeal and Rockhampton Wildlife Rescue. Stanwell matched these donations dollar-for-dollar.
engIneeRIng ouR FutuReAs an organisation that relies on the expertise of skilled engineers to conduct our core business, Stanwell recognises the importance of promoting engineering-related careers and fostering the development of the next generation of engineers.
To assist in ensuring the long-term capacity of the energy industry, we have continued our support of several educational initiatives, including:
• Australian Power Institute, which promotes power engineering in universities and assists undergraduate students in areas of engineering relevant to the energy sector
• Queensland Minerals and Energy Academy, a joint venture between the Queensland Resources Council and the Queensland Government, which aims to attract school leavers to careers in the resources sectorTalented young musicians participate in the Southern Cross Soloists SunWater and Stanwell Music
School in Rockhampton

26 STanwell annual RepoRT 2011
cASe StudY
RockHAmpton HoStS ecomAn
In April 2011, Stanwell sponsored the delivery of an Economics and Management (ECOMAN) program for Year 11 and 12 business students from Rockhampton State High School.
The ECOMAN course, which is designed to prepare young people for the business world, was held at Stanwell’s Rockhampton office from 27 to 29 April.
Stanwell supplied in-kind sponsorship by providing conference facilities to Queensland Private Enterprise Centre (QPEC), Griffith Business School, to run the program.
ECOMAN is a computerised business simulation program, used extensively in schools in Europe.
Participating students spend three working days in the premises of a sponsoring business. Under the guidance of experienced facilitators, the students simulate four years in the life of a company, negotiating business opportunities and presenting their outcomes to ‘annual general meetings’.
In addition to providing the venue for the three-day course, Stanwell representatives attended proceedings to act as ‘shareholders’ and ask questions of the student directors about their business reports.
QPEC was responsible for introducing the course to Queensland and has since expanded its delivery to more than 50 schools across the State.
Stanwell has been a sponsor of the ECOMAN Program for several years and has hosted a number of student groups in the Brisbane office. However, this was the first time ECOMAN had been offered in Rockhampton.
My experience of the ECOMAN program was highly enjoyable and worthwhile. The program was a great start to the term and taught me the key concepts of business management and economics, as well as valuable skills of teamwork, leadership and confidence. ECOMAN gave me the opportunity to apply these skills to a simulated manufacturing company, which is an experience that cannot be offered in the classroom. The facilitators of the program were friendly and engaging, and the venue where the program was held added to the realism of my business experience. The knowledge that I gained from ECOMAN will help me with my future endeavours in the business industry, and I cannot recommend highly enough the benefit of this program to students and schools.
– Taralee Cosstick, Student – Rockhampton State High School
• The Engineering Link Group, a not-for-profit organisation established to facilitate the introduction of secondary school students from regional Queensland to the discipline of engineering, through practical projects conducted in Rockhampton during school holidays
• Power Generation Skills Development Program, a collaboration by the three Queensland Government-owned generators and leading Queensland universities to offer innovative professional development for engineers and paraprofessionals.
SuppoRtIng locAl pRocuRement
This year, we remained committed to promoting local economic development and fostering relationships with our suppliers.
During the Stanwell Power Station Unit 4 planned maintenance outage, from September to November 2010, goods and services were purchased locally wherever possible, representing a significant injection into the region’s economy.
During the outage, more than 660 additional personnel were required. Providing local accommodation, transportation, catering and other goods and services for the increased workforce meant considerable additional business for local suppliers.
connectIng WItH ouR communItIeS
We are aware of the impact our activities can have on the communities located near our operational and project sites. As such, we focus considerable resources on developing proactive relationships with local communities.
During 2010–11, Stanwell Power Station hosted regular community meetings for neighbours and other local stakeholders, as well as educational tours for school students and community groups.
Both Kareeya and Barron Gorge hydros supported local commercial rafting activities on the Tully and Barron rivers through scheduled water releases.
Stanwell provided regular updates on the organisation’s regional activities through our Central Queensland, North Queensland and Far North Queensland community newsletters.
We continued to consult with key stakeholders associated with the proposed Burdekin Hydro Project, including the Birri people, the traditional owners of the land
surrounding the Burdekin Falls Dam and proposed transmission line.
Engagement with local indigenous groups in North Queensland was also progressed in relation to cultural heritage protocols for future property works and duty of care obligations for strategic land assets in the region.

STanwell annual RepoRT 2011 27
BuSIneSS peRFoRmAnce
opeRAtIonS
WHAt We Set out to AcHIeve tHIS YeAR HoW We peRFoRmed
Undertake a major overhaul on Stanwell Power Station Unit 4.
Achieved
Stanwell Power Station Unit 4 returned to service on 10 November 2010, following the completion of the major overhaul.
Implement low pressure turbine and generator upgrade on Unit 4.
Achieved
The low pressure turbine and generator upgrade on Unit 4 was completed during the planned maintenance outage.
Implement low NOx burners at Stanwell Power Station Unit 4.
Achieved
Low NOx burners were installed as part of the major maintenance outage.
Complete ash storage extensions at Stanwell Power Station.
Achieved
The ash storage area extension was completed by the end of 2010.
Prepare for Unit 2 generator rewind at Barron Gorge Hydro.
Achieved
The Unit 2 generator rewind commenced on 25 April 2011.
Clean and inspect the penstock at Barron Gorge Hydro.
Achieved
The station returned to service on 25 October 2010, following the completion of the penstock inspection.
during the year, we focused on maintaining and selectively upgrading our assets and reducing our emissions, while ensuring we continued to operate reliably, despite several natural disasters impacting our sites.
StAnWell poWeR StAtIon
Stanwell Power Station achieved a total availability of 88.32% (2009–10: 91.63%) against a budget of 91.0%, with a forced outage factor of 1.61%. The total
generation from Stanwell Power Station was 6,327.5 GWh (2009–10: 8,063.2 GWh), which was lower than expected due to the impact of flooding on coal supplies.
Substantial flooding in Central Queensland during December 2010 and January 2011 resulted in the closure of the rail line between Stanwell’s coal source, Curragh Mine, and Stanwell Power Station from 1 to 19 January 2011. The coal stockpile at Stanwell Power Station allowed the station to continue to generate, although generation was reduced to minimise consumption while still protecting against
high pool exposure. Curragh Mine suffered water ingress in its pits due to the flooding and, as a result, Stanwell Power Station received coal deliveries of varying quantity and quality after the rail line reopened on 19 January 2011. Stanwell Power Station also experienced operational issues due to the reduced quality of the coal.
major planned outage
Stanwell Power Station Unit 4 returned to full availability for commercial load on 10 November 2010 following its planned major maintenance outage. During the 67-day outage, 8,560 maintenance activities were completed. This work is designed to deliver continuous, reliable operation of Unit 4 until its next planned outage in 2014.
During the outage, more than 260,000 hours of work were completed, requiring the assistance of more than 660 additional personnel. The daily site population peaked in mid-September when more than 495 people were on site—275 more than periods of normal operation.
The outcome from a safety perspective was favourable, with 50% less injuries reported than during a similar outage completed on Unit 3 in 2009. This performance was the result of strong leadership in the team’s drive towards the goal of Zero Harm.
In addition to planned refurbishments, a number of capital improvements were also completed during the outage. These included the installation of low NOx burners, and a low pressure turbine and generator upgrade to improve efficiency and capacity. The rated electrical output of Unit 4 has increased from 350 MW to 365 MW.

28 STanwell annual RepoRT 2011
unit 4 B Id fan
Cracking was identified in the B induced draft (ID) fan impeller during the Unit 4 major outage. Weld repairs were completed, however, a planned follow-up inspection in January 2011 found new cracks in the same vicinity. The cracks were more extensive and the fan impeller was not fit for continued service. The repair took nine weeks and, during that time, Unit 4 operated at a maximum load of 180 MW. A spare impeller has been procured and will be available for installation in the second half of 2011.
kAReeYA HYdRo
Kareeya Hydro Power Station achieved a total availability of 95.89% (2009–10: 95.28%) against a budget of 90.7%, with a forced outage factor of 0.60%. The total generation from Kareeya Power Station was 656.3 GWh (2009–10: 349.9 GWh).
cyclone Yasi
Kareeya Hydro was evacuated on 2 February in preparation for Cyclone Yasi, which crossed the coast near Mission Beach. Kareeya Hydro was in the direct path of the cyclone and access to the site was blocked for several days. The power station survived intact and returned to service less than a week after the cyclone. The main damage caused by the cyclone was to the overhead electrical distribution network at Koombooloomba Dam and the intake works. Diesel generators at these locations allowed normal production to occur while the overhead lines were repaired.
Water Resource plan and a Resource operations plan for the tully River
Stanwell has been actively engaging with the Department of Environment and Resource Management (DERM) on the development of the Water Resource Plan (WRP) and a Resource Operations Plan (ROP) for the Wet Tropics that will include the Tully River. The WRP and ROP have the potential to impact the operations of Kareeya and Koombooloomba power stations. Therefore, Stanwell’s involvement in the process continues to be critical. Stanwell has also been conducting environmental assessments of the Tully
River to assist our input into the WRP and ROP development process.
BARRon goRge HYdRo
Barron Gorge Power Station achieved a total availability of 65.58% (2009–10: 48.77%) against a budget of 75.6%, with a forced outage factor of 5.03%. The total generation from Barron Gorge Power Station was 256.1 GWh (2009–10: 157.2 GWh).
cyclone Yasi
Barron Gorge Hydro was evacuated on 2 February 2011 in preparation for Cyclone Yasi, which crossed the coast near Mission Beach. There was no damage to Barron Gorge Hydro and it returned to full production by 4 February.
generator rewinds
Unit 1 returned to service in August 2010 after the completion of the generator rewind and major planned outage, which started in June 2009. A number of generator and turbine defects were detected during the outage and several natural disasters around the world postponed deliveries, which impacted the schedule. The outage involved the installation of new core and stator windings, and the refurbishment of the rotor.
As a result of the delays on Unit 1, the planned outage and generator rewind for Unit 2 was rescheduled and commenced on 25 April 2011 with a target completion date of December 2011.
penstock inspection
The penstock inspection was completed on time and within the approved budget, with the station returned to service on 25 October 2010. The penstock (including tail race) was in sound condition, with no major defects identified. Repairs were performed on each turbine’s draft tubes.
koomBooloomBA HYdRo
Koombooloomba’s availability was 35.33% (2009–10: 88.4%), which was much lower than the budgeted availability of 84.5%. This was due to a turbine runner failure in December 2010, which resulted in an unplanned outage.
In December 2010, inspections found a turbine blade had broken off its runner and damaged other equipment. The repair will involve the manufacture and installation of a new turbine runner, and the overhaul and repair of other damaged equipment. The plant is expected to return to full service in December 2011.
A major planned five-year overhaul was also completed during the year and other maintenance was performed as scheduled.
WIvenHoe SmAll HYdRo
Wivenhoe Small Hydro achieved 83.71% availability (2009–10: 93.35%) against a budget of 94%.
The unit tripped on 12 October 2010 and inspection found water had leaked into the hydro from seep holes in the dam walls. There was no significant damage to the main equipment, and the unit was returned to service after it dried out and the leaks were rectified.
Water ingress was also discovered in the turbine thrust bearing. The damaged bearing was repaired and re-installed during the annual overhaul in March 2011.
emu doWnS WInd FARm
Emu Downs Wind Farm performed strongly during the year, with availability of 97.56% (2009–10: 97.14%) against a budget of 97%.
On 30 June 2011, we completed the sale of Emu Downs Wind Farm and the associated Badgingarra Wind Development Project in Western Australia, in conjunction with our joint venture partner Griffin Energy. The sale process attracted a strong field of potential bidders. A successful sale was negotiated and settled with the APA Group.
mAckAY gAS tuRBIne
Availability at Mackay Gas Turbine was 88.50% (2009–10: 98.08%) against a budget of 94.4%. In January 2010, Ergon Energy tested the main breaker and determined that the circuit breaker was not suitable for service. The Mackay Gas Turbine was removed from service until its main circuit breaker was replaced in February 2011.

STanwell annual RepoRT 2011 29
ASSet peRFoRmAnce
Year
energy sent out
(gWh)
capacity factor
(%) Budgeted
availability
Availability (12 month average)
(%)
planned outage factor
(%)A
Forced outage factor
(%)
coal (tonnes) or water (ml) used and
returned to river (hydros only)*
StAnWell poWeR StAtIon (1,434 mW)
2010-11 6328 55.6 91.0 88.32 10.07 1.61 2,453,065
2009-10 8063 70.3 92.2 91.63 6.40 1.97 3,013,743
2008-09 7845 68.7 92.3 95.06 4.45 0.49 2,914,089
2007-08 8713 76.5 94.1 95.42 2.90 1.68 3,254,110
2006-07 8842 77.8 92.2 94.72 3.11 2.17 3,249,854
kAReeYA HYdRo (86.4 mW)
2010-11 656 87.1 90.7 95.89 3.51 0.60 656,240
2009-10 350 47.3 91.9 95.28 4.49 0.23 349,900
2008-09 495 67.1 86.5 89.57 8.78 1.65 498,016
2007-08 490 64.8 88.9 92.05 5.39 2.56 490,000
2006-07 620 81.8 93.7 94.97 3.50 1.53 B620,000
BARRon goRge HYdRo (60 mW)
2010-11 256 48.9 75.6 65.58 29.39 5.03 393,905
2009-10 157 30.0 79.7 48.77 50.62 0.61 235,800
2008-09 264 50.5 93.0 91.58 7.95 0.47 416,500
2007-08 256 48.8 91.3 96.36 2.15 1.49 384,000
2006-07 235 44.7 88.9 95.09 1.96 2.95 352,500
koomBooloomBA HYdRo (7.3 mW)
2010-11 12.6 20.7 84.5 35.33 8.58 C56.09 193,678
2009-10 18.0 29.7 92.5 88.40 0.93 10.67 279,083
2008-09 22.7 37.3 92.5 87.96 5.97 6.07 396,565
2007-08 23.6 41.5 89.5 91.63 6.37 2.00 355,972
2006-07 29.2 61.4 88.8 D80.73 12.02 7.25 785,875
WIvenHoe SmAll HYdRo (4.3 mW)e
2010-11 15.2 40.1 94.0 83.71 11.12 F5.17 **301,699
2009-10 9.0 23.7 95.0 93.35 6.02 0.63 143,960
2008-09 4.1 10.9 95.0 93.20 2.01 4.79 99,562
2007-08 4.6 11.6 93.1 96.61 3.29 0.10 114,519
2006-07 4.6 12.1 93.1 96.63 2.25 1.12 123,393
mAckAY gAS tuRBIne (34 mW)
2010-11 0.0 0.03 94.4 88.50 0.40 11.10
2009-10 0.1 0.04 92.9 98.08 1.64 0.28
2008-09 0.1 0.04 94.4 99.05 0.64 0.31
2007-08 0.3 N/A N/A 98.73 0.00 1.27
2006-07 0.4 N/A N/A 72.91 0.26 G26.83

30 STanwell annual RepoRT 2011
Year
energy sent out
(gWh)
capacity factor
(%) Budgeted
availability
Availability (12 month average)
(%)
planned outage factor
(%)A
Forced outage factor
(%)
coal (tonnes) or water (ml) used and
returned to river (hydros only)*
emu doWnS WInd FARm (80 mW)H
2010–11 134 39.95 97.0 97.56 0.69 1.75
2009–10 119 35.60 97.0 97.14 0.77 2.09
2008–09 128 38.30 98.0 91.05 0.37 8.58
2007–08 262 38.30 98.0 97.34 0.73 1.93
2006–07I 184 39.60 95.5 96.34 0.73 2.93
ASSet peRFoRmAnce (ConTInued)
* Water use figures are calculation based as opposed to measured flow
** Water release figures are supplied from Wivenhoe Dam Operator
A Stanwell’s planned outage factor calculation includes the planned outage factor and maintenance outage factor, using Energy Supply Association of Australia definitions
B Based on 1 MWh = 1 ML water used
C Turbine runner damage
D Dam gate rail repairs and transmission restraints reduced Koombooloomba Hydro’s output
E Wivenhoe Small Hydro uses water releases for other primary purposes without commanding dedicated water releases
F Impact of Brisbane flooding event
G Failed gas generator reduced output to 50% capacity for the first half of 2006–07
H 100% of the energy sent out (Stanwell owns a 50% share in the wind farm)
I Data is from the period of practical completion – 20 October 2006
StAnWell poWeR StAtIon HIStoRIcAl AvAIlABIlItY And outAge FActoRS
1998
–99
1997
–98
2006
–07
2002
–03
2010
–11
2000
–01
2008
–09
2004
–05
1999
–00
2007
–08
2003
–04
2001
–02
2009
–10
2005
–06
94.6
7
94.7
0
94.4
0
95.7
0
96.7
1
96.6
7
94.6
8
94.4
7
94.2
3
94.7
2
95.4
2
95.0
6
91.6
3
88.3
2
2.76
3.03 4.
68
2.30 2.
23 2.86
3.55 4.55
4.01
3.11 2.90 4.
45
6.40
10.0
7
2.57
2.27
0.92
2.00
1.06
0.47
1.77
0.98
1.76
2.17
1.68
0.49
1.97
1.61
Availability % Planned outage factor %
Forced outage factor %
Barron Gorge Hydro Power Station in Far North Queensland
Stanwell Power Station’s availability was below budget due to a combination of coal supply constraints arising from flooding in the region and soft electricity market conditions throughout the year.

STanwell annual RepoRT 2011 31
mARket tRAdIng
WHAt We Set out to AcHIeve tHIS YeAR HoW We peRFoRmed
Develop robust commercial relationships and identify potential opportunities for market development.
Achieved
Develop and implement Trading Settlements System.
Achieved
The new Deal Capture and Settlements system was successfully implemented.
Identify opportunities to develop and launch new products.
Achieved
WeAtHeR InFluence on tHe electRIcItY Spot mARket
During the year, Queensland spot prices averaged below budget. Summer temperatures were cooler than long-term averages, which placed downward pressure on demand. Oversupply of generation and the impact of vertical integration also resulted in subdued market outcomes. As shown in the graph on page 32 (Demand growth versus installed capacity and spot price), New South Wales experienced record demand of 14,580 MW on 1 February 2011, resulting in high prices across the market on that day. Although winter temperatures were very low, demand
response to these cool conditions was extremely muted, resulting in continued low spot prices.
During the year, rainfall in Brisbane was among the highest on record and the subsequent floods resulted in transmission line security issues from 17 January 2011. Network constraints at the beginning of the year were due to outages on three transmission lines and resulted in high volatility and price separation. High market prices were then offset by negative settlement residue constraints.
extReme WeAtHeR pRovIdeS mARket volAtIlItY
During the first quarter of the 2011 calendar year, floods in Queensland reduced generation and this, combined with a heatwave in New South Wales, saw record demand and very high spot prices. This caused the contract market to jump to its highest level in many months.
Participants, without a physical portfolio, were placed under stress during this time and several international players withdrew from the Australian contract market.
cHAngIng RegulAtoRY envIRonment
During 2010−11, the general increase in retail prices (primarily attributable to increases in network charges and the Renewable Energy Target’s subsidy of solar photovoltaic systems) were the subject of regulatory discussions. The proposed carbon tax also influenced regulatory discussions and the forward curve. Notwithstanding the implications of such developments, the regulatory environment has become challenging as the sector faces greater scrutiny from policy makers.
QueenSlAnd AnnuAl AveRAge AvAIlABle geneRAtIon, demAnd And Spot pRIceS
Demand was below expectations due to milder weather and reduced response to cool temperatures, combined with the high availability of generation plant. This contributed to the continued low spot price.
5000
10,000$50.00
$60.0011,000
4000 $20.00
9000
3000
8000$40.00
2000 $10.00
7000
1000
6000$30.00
Average available generation (MW)
Average demand (MW) Time weighted average spot price ($/MWh)
2001
–02
2002
–03
2003
–04
2004
–05
2005
–06
2006
–07
2007
–08
2008
–09
2009
–10
2010
–11

32 STanwell annual RepoRT 2011
demAnd gRoWtH veRSuS InStAlled cApAcItY And Spot pRIce
There were limited price events above the $100/MWh daily average during the year. These were caused by New South Wales’ high demand and the network constraints associated with post flood restoration.
$150.00
$200.00
$250.00
$300.00
8000
10,000
12,000
2000 $50.00
6000
$0.000
4000 $100.00
Average daily demand (MW)
Average daily availability (MW)
Average daily spot price ($/MWh)
Jul-1
0
aug
-10
Sep-
10
oct-1
0
nov
-10
dec-
10
Jan-
11
Feb-
11
Mar
-11
apr
-11
May
-11
Jun-
11
Although there was a rally after the Federal Election in August 2010, prices fell until the Federal Government announced the design elements for a carbon price mechanism in February 2011.
$35.00
$36.00
$37.00
$38.00
$39.00
$40.00
$41.00
$42.00
$33.00
$32.00
$34.00
Price (AUD)
Jul-1
0
aug
-10
Sep-
10
oct-1
0
nov
-10
dec-
10
Jan-
11
Feb-
11
Mar
-11
apr
-11
May
-11
Jun-
11
contRAct FoRWARd cuRve (daIly pRICeS FoR Cal 2012 Qld BaSe eleCTRICITy FuTuReS. SouRCe: ThoMSon ReuTeRS, Sydney FuTuReS exChanGe)
STanwell annual RepoRT 2011 33
pRoject development
WHAt We Set out to AcHIeve tHIS YeAR HoW We peRFoRmed
Complete Burdekin Hydro feasibility study. Further action required
The Burdekin Hydro feasibility study is expected to be completed by the end of the 2011 calendar year.
Complete accelerated pre-feasibility study for the Wandoan Power Project.
Achieved
Accelerated pre-feasibility study for the Wandoan Power Project completed in February 2011.
Complete pre-feasibility study for gas generation project.
Achieved
Pre-feasibility study into the development of a 300 MW gas peaking plant completed.
Continue to monitor developments in lower emissions coal technology.
on track
Develop and obtain stakeholder support for renewable energy strategy.
on track
Some projects were deferred due to Genco Review announcement.
Stanwell has actively sought to reduce the impact of our electricity generation on the environment by examining and developing opportunities to reduce the carbon emission intensity of our portfolio, and improving our existing assets’ performance.
We continued to progress a feasibility study into a proposed hydro power station on the Burdekin Falls Dam in North Queensland. The project proposes to use the energy in the stored water, which is already being released from the existing dam, to operate a 37 MW hydro power station.
The feasibility study, expected to be completed by the end of the 2011 calendar year, will determine project costs and revenues to enable a final investment decision to be made.
As part of the feasibility study, tenders for the construction of the power line, the civil works, and the mechanical and electrical works have all been received and are being evaluated. Stanwell has also received several licences and permits necessary for the project, and finalised all major
environmental assessment reports and other supporting documentation for the Development Application.
During the year, Stanwell and joint venture partner GE Energy (as Wandoan Power) completed an accelerated pre-feasibility study into the development of a 341 MW power station with 90% CO2 capture, located at Wandoan in the Surat Basin.
The Wandoan Power pre-feasibility study confirmed that it is technically possible to capture up to 90% of the CO2 from the project’s syngas fuel stream. The site selected for this project was found to be technically and environmentally suitable with good access to fuel and water supply. This site also has excellent access to the transmission grid and is located in a region which contains geological structures that appear to be suitable for long-term storage of CO2.
This carbon capture and storage (CCS) project, which would use integrated gasification combined cycle (IGCC) technology, was one of four CCS projects initially shortlisted by the Australian Government CCS Flagships Program. In June 2011, Stanwell was advised that the Australian Government had selected a Western Australian project to proceed under a phased and gated approach,
with an initial focus on proving up sufficient geological storage. However, the Australian Government did note that there was benefit in engaging in further discussions with Wandoan Power and we will continue to work with our partner, GE Energy, on our proposal.
Stanwell has also completed a pre-feasibility study into the development of a 300 MW gas fuelled peaking plant project. In support of this project, Stanwell has secured a site and developed a portfolio of up-stream gas interests, including shares in and an alliance agreement with Blue Energy and a farm-in agreement with Icon Energy.
Stanwell crystallised a 1% interest in ATPs 606/972 from Tri-Star in June 2011, with an associated 30 petajoules (PJ) of 2P gas reserves. This increase is highly desirable, with development and production linked to the well progressed LNG project being developed by Origin Energy and Conoco Phillips (APLNG).
On 1 September 2010, Stanwell achieved a significant milestone, receiving full and final payment for the sale of the Mineral Development Licence (MDL) 162 coal resource. This is a key deliverable listed in our 2010–11 Statement of Corporate Intent.
The sale of MDL 162 forms part of our response to a request by shareholding Ministers to review our asset holdings to identify surplus, non-core assets. Stanwell Power Station has a secure, cost competitive coal supply agreement in place to meet the future needs of the station to 2030 without the need for additional resources from MDL 162.
The finalisation of this sale process is a significant outcome for Stanwell and further enhances our track record for delivering large, complex commercial transactions.
To provide long-term certainty for the delivery of coal from Central Queensland to Stanwell Power Station, we finalised arrangements for a new Rail Transport Agreement (RTA). The new RTA was finalised with QR National Coal on 22 June 2011 to come into effect on 1 July 2011 and operate until 31 December 2020. The new

34 STanwell annual RepoRT 2011
RTA will provide greater flexibility to match transport requirements with generation, coal supply and coal export opportunities. Another benefit of the arrangement with QR is its greater involvement in developing strategies to secure rail haulage to optimise Stanwell’s export coal opportunities.
tHe RIgHt dIRectIon FoR ouR ReSeARcH
This year we supported a range of research memberships and collaborative research efforts, including:
• the Clean Energy Council
• Cooperative Research Centre for Greenhouse Gas Abatement Technologies (CO2CRC)
• Electric Power Research Institute (EPRI)
• Queensland Centre for Low Emissions Technology (cLET)
• Welding Trades Industry Association (WRIA)/Industry Cooperation Innovation Program (ICIP) Optimum Welded Plant Research Program.
We also support the National Clean Coal Initiative by providing advice on the cost of generation technologies, and research and development needs.
cASe StudY
SAle oF mIneRAl development lIcence (mdl) 162
On 1 September 2010, we completed the sale of MDL 162. This was the culmination of a long-term strategy to most profitably utilise and monetise our coal reserves.
We have a long-term agreement with Wesfarmers Resources for the secure supply of coal to Stanwell Power Station. In July 2007, we commenced a joint study with Wesfarmers Resources into the expansion of Curragh Mine.
Wesfarmers Resources completed extensive exploration drilling at Stanwell’s reserved area within Wesfarmers Resources Curragh North mining lease. In parallel, we completed exploration drilling at the coal resource within MDL 162 and studies of the coal required for the anticipated future life of Stanwell Power Station.
The joint studies revealed that we held coal resources excess to our future requirements. Prudently, we moved to monetise these resources. We completed negotiations with Wesfarmers Resources to deliver additional coal to Curragh Mine, enabling its expansion from 7MTpa to 8.5MTpa export in return for an increase in coal rebates.
The next step was to sell MDL 162.
In December 2009, we engaged consultants KPMG and embarked on a broad marketing campaign to domestic and international bidders, followed by a competitive bidding process. The coal assets attracted a very strong response.
On 1 September 2010, we completed the sale of MDL 162 to MCG Pty Ltd, a vibrant local civil contractor and aspiring mining company.
The sale process was a great outcome for Stanwell and further enhanced our track record of delivering large, complex commercial transactions.
Inside Stanwell Power Station in Central Queensland

STanwell annual RepoRT 2011 35
WHAt We Set out to AcHIeve tHIS YeAR HoW We peRFoRmed
Maintain Environment Management System in line with ISO14001.
on track
Next audit is scheduled for August/September 2011.
Achieve no major non conformances. Achieved
Achieve no level 4 or 5 incidents*. Achieved
Continue to meet our obligations under the Energy Supply Association of Australia (esaa) Code of Sustainable Practices.
on track
Our esaa obligations continue to be met under the Energy Efficiency Opportunities Act (see below).
Review operational water monitoring programs.
Achieved
* Refer to glossary on page 126 for definition.
geneRAtIon InveStment
Stanwell Power Station installed low NOx burners on Unit 4 in September 2010. This follows the installation of low NOx burners on Unit 3 in August 2009. The station now has two units which produce 40% less NOx emissions. Work is currently underway in preparation for similar installations on the remaining two units.
polIcY And RegulAtIon
Stanwell continues to meet its reporting obligations under the National Greenhouse and Energy Reporting Scheme (NGERS) and engages with the ongoing development of the NGERS process through participation in the Department of Climate Change and Energy Efficiency consultation programs.
The Federal Government is currently moving to amend legislation to include electricity generation within the scope of the Energy Efficiency Opportunities Act. Stanwell has reviewed the requirements of the Act and the implementation, as well as its potential impact on Stanwell’s
operations. Stanwell is actively participating in the consultation process with the Department of Resources, Energy and Tourism through the National Generators Forum and will continue to actively participate in the program’s implementation trials.
cARBon pRIcIng FRAmeWoRk
In February 2011, the Australian Government announced plans to establish a price on carbon. This position was clarified on 10 July 2011 when the Government unveiled its Securing a Clean Energy Future plan. At the time of preparing this report, the proposed legislation had not yet been introduced into Federal Parliament. It is proposed that a carbon price would start at a fixed permit price on 1 July 2012 for three years until a variable price and emission trading scheme commences on 1 July 2015. The introduction of a carbon tax significantly decreases the carrying value of our operating sites and will add a considerable operating cost, comparable to our fuel costs.
clImAte AdAptAtIon
Stanwell has maintained a watching brief on policy development in this area and we remain ready to respond quickly once regulatory clarity is available. Our efforts have focused on:
• the use of climate change modelling predictions (temperature, rainfall, humidity, etc) in asset life planning processes
• incorporating carbon cost forecasts in asset life planning processes
• tailoring research and development expenditure to focus on technologies that are more applicable to a carbon constrained economy
• modifying existing business processes to ensure climate change becomes part of normal business planning.
delIveRIng on ouR envIRonmentAl commItmentS
Stanwell power Station
The ash storage area extension at Stanwell Power Station was completed by the end of 2010, adding four years of storage capacity. The new storage facility has been designed and constructed to minimise the impact on the environment and includes improvements such as a compacted clay liner in the evaporation pond. The project has now moved into a second phase to reduce the slurry pipe length, which will increase the asset life of the slurry pumps.
Hydro
Stanwell continued to meet monitoring and reporting requirements under the Department of Environment and Resource Management (DERM) Barron River Resource Operations Plan (ROP).
Baseline studies of the aquatic ecology of the Tully River were finalised in preparation
envIRonmentAl peRFoRmAnce

36 STanwell annual RepoRT 2011
for the DERM ROP, which will include the Tully River. Stanwell continues to conduct ecology assessments of the river to enable early detection of any changes to the aquatic environment.
Stanwell maintained its permit under the Wet Tropics Management Plan for hydro operations. This permit will be renewed in 2011–12.
land management and indigenous relations
Stanwell has a close working relationship with the Darumbal People, on whose land the Stanwell Power Station and buffer zone are located. Under the Aboriginal Cultural Heritage Act 2003, Stanwell has a duty of care to protect and preserve Aboriginal cultural heritage areas, objects or evidence of archaeological or historic significance.
To ensure that its duty of care obligations are met, Stanwell has entered into a voluntary Cultural Heritage Management Plan. This management plan, which was officially endorsed by the Darumbal in June 2011, documents Stanwell’s commitment to managing cultural heritage, the responsibilities of both parties, and the protocol for the protection and preservation of cultural heritage.
envIRonmentAl IncIdentS BY SIte 2010–11
SIte level 1, 2 oR 3 level 4 oR 5
Stanwell Power Station 83 0
Kareeya Hydro, Koombooloomba Hydro and Barron Gorge Hydro
17 0
Mackay Gas Turbine 2 0
Stanwell Energy Park 4 0
Compared to 2009–10, there has been an increase in events reported at the hydro power stations. This can be attributed to an increase in the identification and reporting of hazards. The number of incidents reported at Stanwell Power Station was lower than the previous year.
mAjoR envIRonmentAl IncIdentS 2010–11
YeAR IncIdentS*
2006–07 0
2007–08 0
2008–09 0
2009–10 0
2010–11 0
Stanwell has had five consecutive years of recording no Level 4 or 5 environmental incidents. * Refers to Level 4 or 5 incidents
Barron Gorge Visitors Centre in Far North Queensland

STanwell annual RepoRT 2011 37
cASe StudY
envIRonmentAl AppRovAlS RISk mInImISAtIon pRoject
During the year, the Environmental Approvals Risk Minimisation Project was extended to include our hydro power stations. This process identified potential engineering and procedural improvements, which could minimise the risk of non-compliance with an environmental approval or a release of contaminant from site.
Actions progressed to date at the hydros include:
• Procedures, check sheets and operational manuals reviewed for relevant environmental controls and checks.
• Lead acid batteries replaced with sealed units that will not spill or leak in the event of a failure.
• Pumps within the station pits at Barron Gorge Hydro, which originally contained oil or glycol to cool the motors, replaced with pumps that do not require oil or glycol. Leaks or spills from these pumps failing could have resulted in the direct release of a small amount of oil or glycol to the receiving environment due to the location of these pumps. Kareeya’s pumps are due for replacement in the 2011–12 financial year.
17.5
2.13
17.8
2.08
19.1
16.8
2.44
2.20
2006
–07
Water used (GL)
*Water Intensity (ML/GWh)
2007
–08
2008
–09
2009
–10
2010
–11
Total water used during the year was less than previous years due to lower generation. * Calculations based on water delivered to the RWD. This figure includes the RWD as part of the station’s operations, and therefore includes any uncontrollable losses from the dam such as seepage and evaporation.
WAteR uSed And WAteR IntenSItY At StAnWell poWeR StAtIon
13.1
2.07
807.
0
825.
1 852.
3
874.
1
815.
8
2006
–07
Carbon intensity (kg/MWh)
2007
–08
2008
–09
2009
–10
2010
–11
The carbon intensity remained below the forecasted intensity during 2010–11. This can largely be attributed to the very strong performance of the hydros due to unseasonably high levels of rainfall and reduced generation at Stanwell Power Station.
3.49 3.63
3.29 3.
72
3.50 3.
69
3.50 3.
86
3.47
3.24
2006
–07
SOx (kg/MWh)
NOx (kg/MWh)
2007
–08
2008
–09
2009
–10
2010
–11
NOx emissions were lower during the year due to the installation of low NOx burners on Unit 4 at Stanwell Power Station.
cARBon IntenSItY Sox And nox emISSIonS

38 STanwell annual RepoRT 2011
economIc peRFoRmAnce
Stanwell has recorded an after tax loss for the financial year of $12.0 million (2009–10: profit after tax of $149.5 million).
The significant profit from the disposal of a mineral development licence ($189.7 million after tax) and the Western Australian wind farms ($3.8 million after tax) has been offset by reduced electricity and export coal revenues, an increase in the onerous contract provision and an impairment of the generating assets relating to the proposed introduction of the Federal Government’s carbon pricing mechanism.
Stanwell recorded electricity revenue of $345.0 million (2009–10: $447.4 million), a reduction of $102.4 million on prior year. This reflects lower generation resulting from a combination of coal supply constraints arising from the severe weather events in summer and soft electricity market conditions throughout the year resulting from continued oversupply in the electricity market.
Export coal revenue sharing arrangements and coal on-sales contributed $88.3 million to Stanwell’s after tax result (2009–10: $116.6 million). The fall in revenue is due to lower export volumes (again due to severe weather events) and the strengthening of the Australian dollar against the United States dollar. The impact of the stronger Australian dollar is likely to continue for the foreseeable future.
The net loss after tax includes charges for the impairment of the generation assets, exploration and evaluation expenditure and financial assets available-for-sale of $175.9 million after tax (2009–10: $6.4 million). The increase in the onerous contract provision relating to the Gladstone Interconnection and Power Pooling
Agreement (IPPA) resulted in a charge of $98.7 million after tax in the current year (2009–10: $11.5 million after tax).
The financial position of the Group remains strong with a significant cash balance ($419.3 million) at 30 June 2011 as a result of the sale of the mineral development licence and the Western Australian wind farms. Total assets at 30 June 2011 were $1,814.7 million (2009–10: $1,982.0 million), a decrease of $167.3 million which is primarily attributable to the impairment of the generation assets.
StAtement oF compReHenSIve Income
Revenue from sales of electricity decreased from $447.4 million in 2009–10 to $345.0 million in 2010–11 as a result of a 14.5% reduction in gross generation sent out from 15,565.0 GWh in 2009–10 to 13,302.8 GWh in 2010–11. This was marginally offset by an increase of 0.2% in realised electricity prices from $45.59/MWh in 2009–10 to $45.70/MWh in 2010–11.
Energy costs decreased from $124.6 milllion in 2009–10 to $109.8 million in 2010–11 due to lower generation. Similarly, network charges were $8.3 million lower, reducing from $57.5 million in 2009–10 to $49.2 million in the current year as a result of the lower generation. Production process costs increased from $94.2 million in 2009–10 to $100.7 million in 2010–11 due to increased charges associated with the Gladstone Power Station IPPA.
Stanwell’s long-term strategy of monetising non-core or surplus assets resulted in the sale of a mineral development licence (MDL 162), which contributed $189.7 million to the after tax result, and the sale of the Western Australian wind assets—Emu Downs
Wind Farm and the Badgingarra Wind Development Project—with a net profit after tax of $3.8 million.
The interest expense for the year increased to $45.1 million from $31.9 million in 2009–10. The additional debt cost is directly attributable to the increase in debt during 2009–10 of $380.0 million to facilitate the payment of the capital repatriation to the Queensland Government.
The directors have recommended that no dividend be provided in 2010–11 (2009–10: $116.7 million).
BAlAnce SHeet
The financial position of Stanwell at 30 June 2011 was strong with a cash balance of $419.3 million (2009–10: $212.0 million including cash held in assets held for sale). The strategy of holding cash on deposit rather than repaying debt continued during the year due to the risk of capital erosion through market yield movements. The cash held is supplemented by undrawn debt facilities of $83.1 million providing total available cash of $502.4 million.
The impairment adjustments and the increase in the Gladstone IPPA onerous contract provision have contributed to a decline in the total equity of the Group. This has resulted in an increase in Stanwell’s debt gearing (measured as debt to debt plus equity) from 48.4% in 2009–10 to 51.1% in 2010–11. If the cash balance was offset against debt, the gearing ratio would reduce to 26.3% (2009–10: 37.8%) reflecting a very robust financial position.
cASH FloW
Stanwell generated net cash inflows from operating activities of $66.0 million (2009–10: $273.0 million) after the payment of tax and interest. This represents a decrease of $207.0 million or 75.8% from the previous

STanwell annual RepoRT 2011 39
financial year. The reduced cash inflow represents a weaker trading result coupled with an increase in tax payments due to non-operating revenues from the sale of MDL 162 and the divestment of the wind assets.
Net cash inflows from investing activities of $246.2 million have increased by $320.6 million compared with last year (2009–10: $74.4 million outflow). The cash inflow predominately relates to the cash proceeds received from the sale of the mineral development licence and the Western Australian wind farms of $370.6 million.
outlook
Stanwell continues to operate in an oversupplied electricity market. The current outlook for the electricity pool price and contract markets is lower demand growth reflected in subdued electricity prices.
However, the generator restructure has provided a new suite of diverse generation assets, including coal, gas and hydros. This provides Stanwell with new opportunities to optimise this larger portfolio to provide improved returns for its shareholders.
Stanwell will continue to benefit from the coal revenue sharing arrangements. However, the 2011–12 outlook reflects
the impact of declining export coal prices. The continued strength of the Australian dollar to United States dollar will subdue
the impact of any upward export coal price improvements.
The decrease in Stanwell’s interest cover is a direct result of the current year loss. *Based on net interest received – prior years restated
InteReSt coveR
33.0
167.
8
22.12
5.83
0.0
2006
–07
Interest cover (times)*
2007
–08
2008
–09
2009
–10
2010
–11
The decreased return on total asset was as a result of Stanwell’s current year loss.
RetuRn on totAl ASSetS
10.7
7.5
14.5
11.7
0.0
Return on total assets (%)
2007
–08
2006
–07
2008
–09
2009
–10
2010
–11
The current year loss can be attributed to the impairment and onerous contract adjustments of $489.9 million before tax.
eARnIngS BeFoRe InteReSt And tAx
229.
9
168.
6
278.
5
228.
3
0.5
2006
–07
Earnings before interest and tax (EBIT) ($m)
2007
–08
2008
–09
2009
–10
2010
–11
Our debt/debt + equity increased due to the reduction in equity as a result of the current year loss.
deBt to deBt + eQuItY
35.3
15.1 21
.1
48.4 51
.1
2006
–07
Debt/debt + equity (%)
2007
–08
2008
–09
2009
–10
2010
–11
Sharing of export coal revenue from the Curragh North Coal Mine continued to contribute to the year’s revenue result.
Revenue
Sales of electricityCoal Revenue Sharing ArrangementsSales of CoalInterest received/receivableOther
2006
–07
2007
–08
2008
–09
2009
–10
2010
–11
700
600
500
400
300
200
100
0
$m

40 STanwell annual RepoRT 2011
coRpoRAte goveRnAnce
AppRoAcH to coRpoRAte goveRnAnce
Stanwell is committed to achieving the highest standards of corporate governance to enable the organisation to function efficiently and effectively.
As part of its ongoing commitment to best practice corporate governance, the Board developed and implemented Stanwell’s corporate governance framework in the form of a Board Handbook in 2004.
Stanwell is required to comply with the Corporate Governance Guidelines for Government Owned Corporations developed by the Queensland Government.
These guidelines summarise the expectations of shareholding Ministers in relation to the corporate governance of all Government Owned Corporations (GOCs) and provide a framework to develop, implement, review and report on corporate governance arrangements. The guidelines are based on eight principles of good corporate governance (Office of Government Owned Corporations principles and reporting requirements table page 44).
Further information relating to corporate governance at Stanwell, including a copy of our Board Handbook, can be found on our website at www.stanwell.com
SHAReHoldIng mInISteRS
As at 30 June 2011, Stanwell’s shareholding Ministers were:
• The Honourable Rachel Nolan MP, Minister for Finance, Natural Resources and The Arts
• The Honourable Stephen Robertson MP, Minister for Energy and Water Utilities.
SuBSIdIARIeS
As at 30 June 2011, Stanwell had two wholly owned subsidiaries:
• Energy Portfolio Pty Ltd
• Goondi Energy Pty Ltd.
The directors of Stanwell’s subsidiaries were Mr Wayne Collins and Mr Michael O’Rourke. Mrs Karesse Biggs was the Company Secretary for these two subsidiaries.
On 30 June 2011, we completed the sale of Emu Downs Wind Farm and Badgingarra Wind Development Project, resulting in the sale of the following subsidiaries:
• EDWF Holdings 1 Pty Ltd
• Wind Portfolio Pty Ltd.
BoARd And commItteeS
As at 30 June 2011, Stanwell’s Board consisted of six non-executive directors, who were all appointed in accordance with the Government Owned Corporations Act 1993 (GOC Act). As a result of the Genco Review, a number of changes were made to director appointments with effect from 1 July 2011. New committees were also established and the charters for these committees may be found on our website at www.stanwell.com
Role oF BoARd oF dIRectoRS
The GOC Act establishes that the Board is ultimately responsible for all matters related to the running of Stanwell. Within this regulatory framework, the Board’s overall role is to govern the organisation rather than manage it.
It is the purpose of the Executive Management Team to manage the organisation in accordance with the direction and delegations of the Board. It is the responsibility of the Board to
oversee the activities of management in carrying out these delegated duties. The Board is responsible for and has the authority to determine all matters relating to the policies, practices, management and operations of Stanwell, except where shareholding Ministers exercise their reserve powers of policy and direction under the GOC Act.
The Board is required to do all things necessary to carry out the objectives of Stanwell and, subject to the reserve powers of our shareholding Ministers, has the final responsibility for the successful operation of the company.
The principal functions and responsibilities of the Board include:
• health, safety and wellbeing of employees
• leadership of the organisation
• strategy formulation
• overseeing planning activities
• stakeholder liaison
• monitoring, compliance and risk management
• matters relating to the Chief Executive Officer
• delegation of authority.
dIRectoR Independence
All of Stanwell’s directors are considered by the Board to be independent. In determining the independent status of a director, the Board has considered whether the director:
• is a material supplier or customer of Stanwell or its subsidiaries
• has a material contractual relationship with Stanwell other than as a director.
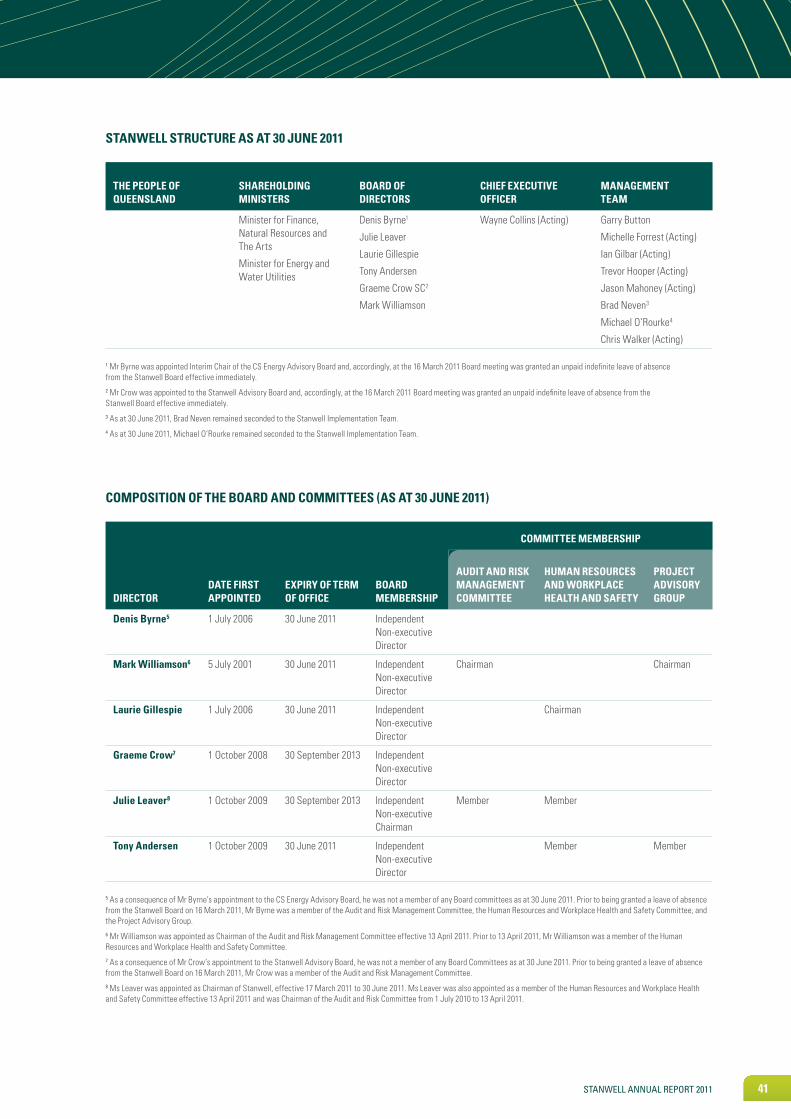
STanwell annual RepoRT 2011 41
StAnWell StRuctuRe AS At 30 june 2011
tHe people oF QueenSlAnd
SHAReHoldIng mInISteRS
BoARd oF dIRectoRS
cHIeF executIve oFFIceR
mAnAgement teAm
Minister for Finance, Natural Resources and The Arts
Minister for Energy and Water Utilities
Denis Byrne1
Julie Leaver
Laurie Gillespie
Tony Andersen
Graeme Crow SC2
Mark Williamson
Wayne Collins (Acting) Garry Button
Michelle Forrest (Acting)
Ian Gilbar (Acting)
Trevor Hooper (Acting)
Jason Mahoney (Acting)
Brad Neven3
Michael O’Rourke4
Chris Walker (Acting) 1 Mr Byrne was appointed Interim Chair of the CS Energy Advisory Board and, accordingly, at the 16 March 2011 Board meeting was granted an unpaid indefinite leave of absence from the Stanwell Board effective immediately.2 Mr Crow was appointed to the Stanwell Advisory Board and, accordingly, at the 16 March 2011 Board meeting was granted an unpaid indefinite leave of absence from the Stanwell Board effective immediately.3 As at 30 June 2011, Brad Neven remained seconded to the Stanwell Implementation Team.4 As at 30 June 2011, Michael O’Rourke remained seconded to the Stanwell Implementation Team.
compoSItIon oF tHe BoARd And commItteeS (AS At 30 june 2011)
commIttee memBeRSHIp
dIRectoRdAte FIRSt AppoInted
expIRY oF teRm oF oFFIce
BoARd memBeRSHIp
AudIt And RISk mAnAgement commIttee
HumAn ReSouRceS And WoRkplAce HeAltH And SAFetY
pRoject AdvISoRY gRoup
denis Byrne5 1 July 2006 30 June 2011 Independent Non-executive Director
mark Williamson6 5 July 2001 30 June 2011 Independent Non-executive Director
Chairman Chairman
laurie gillespie 1 July 2006 30 June 2011 Independent Non-executive Director
Chairman
graeme crow7 1 October 2008 30 September 2013 Independent Non-executive Director
julie leaver8 1 October 2009 30 September 2013 Independent Non-executive Chairman
Member Member
tony Andersen 1 October 2009 30 June 2011 Independent Non-executive Director
Member Member
5 As a consequence of Mr Byrne’s appointment to the CS Energy Advisory Board, he was not a member of any Board committees as at 30 June 2011. Prior to being granted a leave of absence from the Stanwell Board on 16 March 2011, Mr Byrne was a member of the Audit and Risk Management Committee, the Human Resources and Workplace Health and Safety Committee, and the Project Advisory Group. 6 Mr Williamson was appointed as Chairman of the Audit and Risk Management Committee effective 13 April 2011. Prior to 13 April 2011, Mr Williamson was a member of the Human Resources and Workplace Health and Safety Committee.7 As a consequence of Mr Crow’s appointment to the Stanwell Advisory Board, he was not a member of any Board Committees as at 30 June 2011. Prior to being granted a leave of absence from the Stanwell Board on 16 March 2011, Mr Crow was a member of the Audit and Risk Management Committee.8 Ms Leaver was appointed as Chairman of Stanwell, effective 17 March 2011 to 30 June 2011. Ms Leaver was also appointed as a member of the Human Resources and Workplace Health and Safety Committee effective 13 April 2011 and was Chairman of the Audit and Risk Committee from 1 July 2010 to 13 April 2011.

42 STanwell annual RepoRT 2011
BoARd commItteeS
During 2010–11, Stanwell had three Board committees:
• Audit and Risk Management Committee1
• Human Resources and Workplace Health and Safety Committee2
• Project Advisory Group.
In each case, the committee has no executive powers with regard to its findings and recommendations. These executive powers remain with the Board.
Each committee has a charter, which sets out the objectives, composition, term of office, duties and responsibilities of each committee. The charters of each committee are reviewed and updated, as appropriate, on a regular basis.
During 2010–11, Stanwell also had four executive management committees that report through to the Audit and Risk Management Committee at every committee meeting. These were the Trading Risk Management Committee, Trading Compliance Committee, Financial Risk Management Committee and Markets Risk Trading Compliance Committee.
BoARd And commIttee evAluAtIon
The Board conducts a review of its performance and the performance of each committee on a regular basis. These reviews ensure that the Stanwell Board is maintaining best practice corporate governance standards.
external review
An independent third-party consultant undertook a Board and Board committee performance evaluation, which was completed at the beginning of 2011 (after approximately a 12 month process). The objectives of the review were to:
• focus on continuous improvement
• provide directors with an opportunity to respond openly in an independent environment
• strengthen relationships within the Board
• enhance the effectiveness of the Board’s operations and corporate governance practices
• strengthen the culture of performance and accountability
• continue to align Board development opportunities with Stanwell’s core values and the competitive environment in which Stanwell operates.
Internal review
Since February 2008, the Board has conducted internal reviews where the Board’s individual and collective performance and the performance of committees has been reviewed and evaluated. These reviews have been conducted on a quarterly basis during the Non-Executive Director sessions of the meeting.
etHIcAl And ReSponSIBle decISIon mAkIng
code of conduct
Stanwell is committed to high standards of integrity, honesty and accountability. We value ethical behaviour and actions that are consistent with our six key strategic objectives. Stanwell’s commitment to this is reflected in the codes of conduct which apply to directors and employees.
Avoidance of conflicts of interest
Stanwell’s Constitution and Board Handbook require directors to disclose to the Board potential, perceived or actual conflicts of interest that may exist between the director and any other parties in carrying out the activities of Stanwell. On appointment, directors must disclose to the Board any potential, perceived or actual conflicts of interest in accordance with the Conflict of Interest Probity Protocol (which forms part of the Board Handbook) and must keep these disclosures up to date.
Any director with a material personal interest in a matter being considered by the Board must declare their interest and, unless the Board resolves otherwise, can not participate in boardroom discussion or vote on matters in respect of which they have a conflict.
The Conflict of Interest Probity Protocol provides for the appointment of an external probity auditor to carry out an audit function regarding the management of conflicts of interest as they occur from time to time. During the 2010–11 financial year, there were no outstanding material issues raised by Stanwell’s external probity auditor.
Access to information and independent professional advice
All directors have a right of access to company books and receive regular detailed financial and operational reports from executive management.
Directors may request, via the Chairman, independent professional advice at Stanwell’s expense. A copy of advice received by a director is provided to all other Board members.
FInAncIAl RepoRtIng
ceo and cFo certificate
The Audit and Risk Management Committee (ARMC) reviews and makes recommendations to the Board on all significant accounting policy changes and the annual financial statements, including the auditor’s report. The ARMC considers the annual financial accounts and endorses the accounts to be submitted for approval by the Board.
Stanwell’s Chief Executive Officer and Chief Financial Officer also provide a certificate stating that, in their opinion, Stanwell’s annual financial statements and notes give a true and fair view of the financial position and performance of Stanwell, as the parent entity and the group consisting of Stanwell and its subsidiaries, and that the accounting policies of the parent entity and the group are in accordance with the relevant standards and legislation.
1 For details of the Audit and Risk Management Committee from 1 July 2011, please refer to the Board of Directors profiles in the Directors’ Report. 2 For details of the People and Safety Committee from 1 July 2011, please refer to the Board of Directors profiles in the Directors’ Report.

STanwell annual RepoRT 2011 43
This certification is based on implementation of the policies adopted by the Board and the company’s risk management system and internal compliance and control measures, which operate efficiently and effectively in all material respects in relation to financial reporting risks.
RISk mAnAgement
Risk management system
Stanwell has a comprehensive risk management system to identify, analyse, evaluate, treat and monitor material business risks.
Stanwell’s Risk Management Policy aligns with International/Australian Standard 31000:2009 and assigns responsibility to each General Manager for the management of business risks pertaining to their divisions. To fulfil this responsibility, they are supported by the Corporate Risk Manager, business wide common risk language and a risk register database. The Board has approved a Risk Evaluation Framework to guide the business in the measurement of risk and setting management approaches according to risk tolerance.
In addition, significant domains of business risk are supported by specialist staff, processes and systems designed to address specific regulatory and professional requirements while simultaneously integrating with the corporate risk framework. These domains include health and safety, environment, energy trading, financial risk, legal compliance and production.
Risk reports and risk maps are tabled at each meeting of the ARMC. These advise the ARMC of risks with a current rating of high, emerging issues in the business environment, internal control issues and internal control improvements.
Each General Manager reports to the Board on a quarterly basis regarding material compliance exceptions. The Board is continuously advised of the effectiveness of the risk management system and the internal control system through these processes.
dIScloSuRe And communIcAtIonS WItH SHAReHoldeRS
Shareholding Ministers have a general right to obtain information from Stanwell about its operations by virtue of the accountability of Stanwell to the government, Parliament and the public.
Stanwell respects the rights of shareholding Ministers and their representatives, having regard to the requirements of responsible government, and facilitates the effective exercise of those rights.
We actively consult with shareholding Ministers and give them ready access to balanced and understandable information about the company and corporate proposals.
This is achieved via the following mechanisms:
• Annual Report (containing those matters outlined in Section 120 of the GOC Act)
• Corporate Plan
• Statement of Corporate Intent
• Quarterly Reporting (pursuant to Section 119 of the GOC Act)
• Interim Report
• Forecast Report
• Ministerial Briefing Notes, as required
• fortnightly updates to the Office of Government Owned Corporations from the Chief Executive Officer
• regular meetings between Stanwell’s Chairman/Chief Executive Officer and the portfolio minister.
In accordance with Section 122 of the GOC Act, Stanwell:
• keeps shareholding Ministers reasonably informed of the operations, financial performance and financial position of Stanwell and its subsidiaries, including the assets and liabilities, profits and losses, and prospects of Stanwell and its subsidiaries
• gives to shareholding Ministers reports and information that they require to enable them to make informed assessments of matters relating to operations, financial performance and the financial position of Stanwell and its subsidiaries
• if matters arise that in the Board’s opinion may prevent, or significantly affect, achievement of Stanwell’s objectives outlined in the Statement of Corporate Intent or targets under Stanwell’s Corporate Plan, will immediately inform shareholding Ministers of the matters and its opinion in relation to them.

44 STanwell annual RepoRT 2011
oFFIce oF goveRnment oWned coRpoRAtIonS (ogoc) pRIncIpleS And RepoRtIng ReQuIRementS
Stanwell reports against the Corporate Governance Guidelines for Government Owned Corporations. The table below outlines our compliance against the eight principles of good corporate governance.
Recommendation Annual Report requirement Reference material
pRIncIple 1 – FoundAtIonS oF mAnAgement And oveRSIgHt
The Board should have a formal statement or Board Charter, which clearly defines the roles and responsibilities of the Board and individual directors, and the matters which are delegated to management. This also applies to any committee established by the Board.
A Board Handbook should be available to facilitate Board operations, and induction and self-evaluation processes.
Appropriate induction processes should be developed for new members in relation to their Board and committee functions and for senior executives to allow them to participate fully and actively in management decision making at the earliest opportunity.
A register of committees and their functions should be maintained.
The process for performance evaluation of the Chief Executive Officer and senior executives should be disclosed.
Disclose whether a performance evaluation for the Chief Executive Officer and senior executives has taken place in the reporting period and how it was conducted.
Performance evaluations for Stanwell’s Chief Executive Officer and senior executives for the 2009–10 financial year were carried out in August 2010 and will be carried out in August 2011 for the 2010–11 financial year.
The performance evaluation for the Chief Executive Officer was conducted by the Board.
The performance evaluation for senior executives was carried out by the Board and the Chief Executive Officer.
Both the performance evaluation for the Chief Executive Officer and the senior executives were undertaken in accordance with Stanwell’s Executive Management – Recruitment, Appointment and Remuneration Policy against agreed key performance indicators.
pRIncIple 2 – StRuctuRe tHe BoARd to Add vAlue
A majority of the Board should be independent directors.
The Board should develop and implement a plan for identifying, assessing and enhancing director competencies.
Disclose the process for performance evaluation of the Board, committees and individual directors.
The Board and committees regularly review their information needs (quality, quantity and timeliness) to ensure the information they receive is appropriate for the effective discharge of their duties.
Develop and implement appropriate, formal self-evaluation processes for the Board and committees.
Skills, experience and expertise relevant to the position of director held by each director in office at the date of the report.
See Board member biographies on page 51 of the Directors’ Report.
Names of the directors considered to be independent and Stanwell’s materiality thresholds.
See Director independence on page 40.
A statement as to whether there is a procedure agreed by the Board to take independent professional advice at the expense of Stanwell.
See Access to information and independent professional advice on page 42.
The term of office held by each director in office at the date of the report, including the date the director was first appointed.
See Composition of Board and committees as at 30 June 2011 page 41.
Whether a performance evaluation for the Board and its members has taken place in the reporting period and how it was conducted.
See Board and committee evaluation on page 42.
pRIncIple 3 – pRomote etHIcAl And ReSponSIBle decISIon mAkIng
Establish and disclose a code of conduct outlining the practices necessary to maintain confidence in the company’s integrity and to guide compliance with legal and other obligations to stakeholders.
Establish and disclose the policy for trading in securities by directors, officers and employees.
Establish the code of conduct in line with best practice.
For a copy of Stanwell’s codes of conduct for directors and employees, please refer to our website.

STanwell annual RepoRT 2011 45
Recommendation Annual Report requirement Reference material
pRIncIple 4 – SAFeguARd IntegRItY In FInAncIAl RepoRtIng
The Board should establish an audit committee.
The Chief Executive Officer and Chief Financial Officer (or equivalent) state in writing that the financial reports present a true and fair view and are in accordance with accounting standards.
Details of the names and qualifications of those appointed to the Audit and Risk Management Committee (ARMC), or those who perform the function of an ARMC member.
See Composition of the Board and committees as at 30 June 2011 on page 41 and Board member biographies in the Directors’ Report.
The number of meetings held by the ARMC and the names of the attendees.
See Meetings in the Directors’ Report.
pRIncIple 5 – mAke tImelY And BAlAnced dIScloSuReS
Establish written policies and procedures to ensure compliance with disclosure requirements (including those in the GOC Act) and generally ensure the accountability of senior management for that compliance.
For a copy of Stanwell’s Board Handbook, please refer to our website.
pRIncIple 6 – ReSpect tHe RIgHtS oF SHAReHoldeRS
Design and disclose a communication strategy to promote effective communication with shareholding Ministers.
See Disclosure and communications with shareholders on page 43.
pRIncIple 7 – RecognISe And mAnAge RISk
The Board or an appropriate committee should establish policies in risk management and oversight.
Management should design and implement a risk management and internal control system to manage material business risks.
Ensure the integration and alignment of the risk management system with corporate and operational objectives.
Ensure clear communication throughout Stanwell of the Board and senior management’s position on risk.
Ensure a common risk management terminology across Stanwell.
Ensure risk management is undertaken as part of normal business practice and not as a separate task at set times.
Ensure information systems for reporting on risk are integrated to enable aggregation and reporting at a corporate level.
Undertake a risk assessment to identify any high-risk fraud areas and develop strategies to mitigate any significant fraud risks.
Implement policies and procedures which include:
• staff responsibilities in relation to fraud, prevention and identification
• responsibility for fraud investigation once a fraud has been identified
• processes for reporting on fraud related matters to management
• reporting and recording processes to be followed to record allegations of fraud
• requirements for staff training to be conducted on fraud prevention and identification
• a reference to Stanwell’s code for ethical behaviour.
Implement a fraud control plan for ongoing monitoring and compliance of fraud control activities which identifies fraud risk, incorporates control strategies, action plans and a timetable for implementation, and sets out responsibilities and accountabilities for fraud control at all levels of Stanwell.
The Chief Executive Officer and the Chief Financial Officer (or equivalent) state to the Board that the statement given under the recommendations applying to Principle 4 is founded on a sound system of risk management and internal compliance and control which implements Board policies; and the risk management and control system is operating efficiently and effectively in all material respects.
Disclose that Stanwell’s management has reported to the Board as to the effectiveness of Stanwell’s management of its material business risks.
See Financial reporting on page 42 and Risk management on page 43.

46 STanwell annual RepoRT 2011
Recommendation Annual Report requirement Reference material
pRIncIple 8 – RemuneRAte FAIRlY And ReSponSIBlY
Stanwell should disclose its remuneration policies to show the broad structure and objectives of the policies and the link between remuneration of the Chief Executive Officer and senior executives and corporate performance.
The Board should establish a remuneration committee.
Disclosure of Stanwell’s remuneration policies.
Stanwell has an Executive Management – Recruitment, Appointment and Remuneration Policy. The policy applies to the Chief Executive Officer and senior executives of Stanwell, who report directly to the Chief Executive Officer and whose position is commensurate with an office held by a senior executive under the Public Service Act 1996.
The names of the members of the remuneration committee and their attendance at meetings of the committee.
See Meetings of directors on page 54.
goveRnment oWned coRpoRAtIonS Act ReQuIRementS
Summary of Statement of Corporate Intent for the year ended 30 June 2011.
Introduction
Section 102 of the GOC Act requires Stanwell to have a Statement of Corporate Intent (SCI) for each financial year.
The SCI represents a formal performance agreement between Stanwell’s Board of Directors and its shareholding Ministers with respect to the financial and non-financial targets specified for the financial year. The SCI also represents an acknowledgment and agreement on major activities, the objectives, undertakings, policies, investments and borrowings of Stanwell for the financial year.
Strategy
Stanwell’s corporate strategies, actions and performance outcomes are summarised in the Performance overview 2010–11 on page 7.
performance monitoring
The SCI specifies Stanwell’s financial and non-financial performance targets for its activities during the 2010–11 financial year. Please refer to page 6 for performance against financial
indicators and performance against non-financial indicators.
other matters
No community service obligations were identified for Stanwell for the year ending 30 June 2011.
dividend policy
Stanwell’s dividend policy takes into account the return that shareholders expect from their investments. The Board of Stanwell will recommend a dividend amount equivalent to 80% of Stanwell’s audited net profit after tax for the 2010–11 financial year, after adjustment to exclude unrealised gains from the upward revaluation of financial instruments.
The Board will adopt such a recommendation on the basis of shareholding Ministers agreeing to provide the necessary funding for projects which have received Board and shareholding Ministers’ approval or for the maintenance of Stanwell’s approved capital structure or for ensuring the operational viability of Stanwell.
For the 2010–11 year, due to the recognition of significant impairments in the value of our assets and increased onerous contract obligations, Stanwell has a net loss after tax and therefore no dividend has been declared.
directions and notifications
Section 120(e) of the GOC Act requires Stanwell to provide, in its Annual Report, particulars of any directions and notifications given to Stanwell by shareholding Ministers that relate to the relevant financial year. The Shareholder Review of Queensland Government Owned Corporation Generators included a recommendation to restructure the Queensland Government owned generating companies from three companies into two. To facilitate this restructure, Stanwell Corporation Limited received three formal Ministerial directions from its shareholding Ministers pursuant to Section 299 of the Electricity Act 1994 on 25 November 2010, 10 February 2011 and 5 April 2011.
On 25 November 2010, Stanwell’s shareholding Ministers directed the Board of Stanwell to:
• undertake consultation with unions and employees on the restructure
• provide full cooperation and assistance to the State and its advisors
• ensure that employees and contractors provide full cooperation and assistance to the State and its advisors.
On 10 February 2011, Stanwell’s shareholding Ministers directed the Board of Stanwell to:

STanwell annual RepoRT 2011 47
coRpoRAte enteRtAInment And HoSpItAlItY
The following table identifies all corporate entertainment and hospitality over $5,000 which was undertaken in 2010–11.
event dAte coSt ($)
Staff end of year Christmas functions held across Stanwell sites
December 2010 $23,148
Stanwell Power Station Annual Community Dinner December 2010 $5,206
Flags flying at Stanwell Power Station in Central Queensland
• provide the State and its advisors with such assistance as required to give effect to the restructure, including the provision of access to documents and other information pertaining to the business units of Stanwell.
On 5 April 2011, Stanwell’s shareholding Ministers directed the Board of Stanwell to:
• provide full cooperation and assistance, and ensure that employees, officers, agents, consultants, advisors and contractors provide all cooperation and assistance, as is reasonably requested by a Recipient or otherwise required to implement the restructure.
AmendmentS to StAnWell’S 2010–11 StAtement oF coRpoRAte Intent
The Genco Review included a recommendation that the Queensland Government owned generating companies immediately refocus their corporate strategies from new business development and growth to cost performance and efficiency. As a consequence, Stanwell amended its Statement of Corporate Intent to reflect this recommendation.
Given that the additional expenditure due to the Genco Review was absorbed through changes in the business in the lead up to 1 July 2011 and that the change in capital expenditure was not material to either the balance sheet or cash flows, it was considered appropriate that the financial results remain unchanged.
oveRSeAS tRAvel
During the year, Stanwell’s Renewable Energy Technologies Manager visited Spain and Germany to gain knowledge about the design and operation of a concentrated solar thermal (CTS) plant, and to discuss opportunities for future cooperation in the deployment of CST. During his visit to Spain, he also met with Alstom Hydro to discuss design aspects for the proposed Burdekin Hydro.
The Manager Fuel and Water visited the USA to discuss the Wandoan Power Project at the annual conference of the Gasification Technologies Council, and with the Electric Power Research Institute (EPRI) and GE Energy.
The Design Engineer visited the USA on two occasions during the year. The first time was to discuss the Wandoan Power Project with EPRI and GE Energy. The second visit was to inspect a post combustion CO2 capture demonstration project.
Stanwell’s Burdekin Hydro Project Civil Engineering Manager visited New Zealand on two separate occasions to meet with a number of AECOM engineers to discuss
aspects of the civil engineering reference design.
Two turbine plant mechanical technicians visited Japan to witness a low pressure turbine high-speed dynamic balance test and to meet with Hitachi engineers to discuss issues related to the ongoing maintenance and inspection of Stanwell’s plant.

48 STanwell annual RepoRT 2011
FInAncIAl ReSultS 2011
dIRectoRS’ RepoRt _______________________________________________________ 49
AudItoR’S Independence declARAtIon _____________________ 55
AnnuAl FInAncIAl RepoRt __________________________________________ 56
Statements of comprehensive income ______________________________ 57
Balance sheets _______________________________________________________________ 58
Statements of changes in equity _______________________________________ 59
cash flow statements ______________________________________________________ 61
notes to the financial statements _____________________________________ 62
1 Summary of significant accounting policies ______________________ 62
2 Financial risk management ___________________________________________ 72
3 Critical accounting estimates and judgements __________________ 83
4 Revenue ___________________________________________________________________ 86
5 Other income ____________________________________________________________ 86
6 Expenses _________________________________________________________________ 87
7 Income tax equivalent benefit or expense ________________________ 88
8 Current assets – Cash and cash equivalents ____________________ 89
9 Current assets – Trade and other receivables ___________________ 89
10 Current assets – Inventories _________________________________________ 90
11 Derivative financial instruments ____________________________________ 91
12 Non-current assets and liabilities and disposal groups classified as held for sale or distribution ________________ 93
13 Non-current assets – Available-for-sale financial assets__________________________________________________________ 95
14 Non-current assets – Other financial assets ____________________ 95
15 Non-current assets – Property, plant and equipment _________ 96
16 Non-current assets – Intangible assets ___________________________ 97
17 Non-current assets – Biological assets ___________________________ 98
18 Non-current assets – Exploration and evaluation expenditure ________________________________________________ 99
19 Non-current assets – Deferred tax equivalent assets _________ 99
20 Non-current assets – Retirement benefit obligations _______ 101
21 Non-current assets – Other non-current assets _______________ 104
22 Current liabilities – Trade and other payables __________________ 104
23 Current liabilities – Provisions ______________________________________ 104
24 Other current liabilities _______________________________________________ 105
25 Non-current liabilities – Borrowings ______________________________ 105
26 Non-current liabilities – Deferred tax equivalent liabilities ___________________________________________________ 106
27 Non-current liabilities – Provisions _______________________________ 107
28 Other non-current liabilities _________________________________________ 109
29 Contributed equity ____________________________________________________ 109
30 Reserves, other owner contributions and retained profits ___________________________________________________ 110
31 Dividends ________________________________________________________________ 111
32 Key management personnel disclosures _________________________ 111
33 Remuneration of auditors____________________________________________ 115
34 Contingencies _________________________________________________________ 116
35 Commitments ___________________________________________________________ 117
36 Related party transactions __________________________________________ 119
37 Subsidiaries _____________________________________________________________ 121
38 Interests in joint ventures __________________________________________ 121
39 Reconciliation of loss or profit after income tax equivalent benefit or expense to net cash inflow from operating activities_____________________________________________ 122
40 Cross border leases ___________________________________________________ 122
41 Events occurring after the balance sheet date _________________ 123
directors’ declaration ___________________________________________________ 124
Independent AudItoR’S RepoRt _______________________________ 125

STanwell annual RepoRT 2011 49
The directors present their report on the consolidated entity (referred to hereafter as the Group) consisting of Stanwell Corporation Limited and the entities it controlled at the end of, or during, the year ended 30 June 2011.
pRIncIpAl ActIvItY
The principal activity during the financial year was to generate electricity for sale to customers within Australia.
There have been no significant changes in the principal activities during the year.
FInAncIAl ReSultS
The Group loss after tax for the year was $12.0 million against the previous year’s profit after tax of $149.5 million. The main contributors to this result were:
• The impairment of the Stanwell Power Station cash-generating unit of $162.4 million after tax as a result of the Federal Government’s proposal to implement a carbon price mechanism;
• The impairment of exploration and evaluation expenditure of $5.2 million after tax and the impairment on available for sale financial assets of $6.8 million after tax;
• An increase to the onerous contract provision of $98.7 million after tax reflecting declining electricity prices and the impact of the proposed carbon pricing mechanism; and
• Offset in part by the gain on sale of a mineral development licence of $189.7 million after tax and the gain on sale of the Western Australian wind farm assets of $3.8 million after tax.
The coal revenue sharing arrangements provided revenue of $85.8 million after tax (2010: $107.7 million). The decrease resulted from lower export volumes and the strengthening Australian Dollar but these arrangements will continue to provide strong revenue flows into the future.
dIvIdendS – StAnWell coRpoRAtIon lImIted
In accordance with the Government Owned Corporations Act 1993, the following dividends of Stanwell Corporation Limited have been paid or declared since the end of the preceding financial year:
total amount $’000
As declared and provided for in last year’s report:
Final ordinary dividend paid on 9 December 2010 116,700
In respect of the current financial year:
None declared or paid –
RevIeW oF opeRAtIonS
Safety
The Group’s safety performance continues to show an improvement in line with the target of Zero Harm to all employees and contractors.
During the year, there were two Lost Time Injuries (one employee and one contractor), which is significantly less than the nine recorded in 2010. The Group recorded a Lost Time Injury Frequency Rate (LTIFR) of 1.43 for employees and 2.12 for contractors, resulting in a combined LTIFR of 1.71 (2010: 7.80).
operations
During the year, the Group focused on maintaining and selectively upgrading its assets, while ensuring operations continued reliably, despite several natural disasters impacting the Group’s sites.
Stanwell Power Station achieved a total availability of 88.32% (2010: 91.63%) with a forced outage factor of 1.61% (2010: 1.97%). The total generation from Stanwell Power Station was 6,327.5 GWh (2010: 8,063.2 GWh), which was lower than expected due to the impact of flooding and continuing wet weather on coal supplies.
The Group’s key priorities—the safety of people, the security of supply for the people of Queensland and compliant trading in a competitive market—were all successfully achieved.
market trading
Queensland wholesale electricity prices reflected the continued surplus of capacity in the market with the Queensland average price falling to $30.97 MWh from $33.40 MWh in the prior year. Overall, summer temperatures were cooler than long-term averages, which together with the significant flood event, placed downward pressure on demand. Although winter temperatures were very low, demand response to these cool conditions was extremely muted, resulting in continued low spot prices through winter.
SIgnIFIcAnt cHAngeS In tHe StAte oF AFFAIRS
Restructure of the Queensland government owned corporation generators
On 25 November 2010, the Queensland Government announced the restructure of the three Queensland Government Owned Corporation generators being Tarong Energy Corporation Limited, CS Energy Limited and Stanwell Corporation Limited. The restructure was effected by regulation under the Government Owned Corporations Act 1993, which was gazetted on 24 June 2011 and was effective on 1 July 2011. The restructure resulted in certain net assets and contracts being distributed to the Queensland Government and redistributed between CS Energy Limited and Stanwell Corporation Limited.
The following assets were transferred from Tarong Energy Corporation Limited to Stanwell Corporation Limited with effect from 1 July 2011:
• Tarong Power Station;
• Tarong North Power Station; and
• Coal mining assets, including the Meandu Mine and Kunioon coal mine.
Immediately following the transfer of assets, Tarong Energy Corporation Limited’s status as a Government Owned Corporation was revoked. The shares in Tarong Energy Corporation Limited and its wholly owned subsidiaries were then transferred to Stanwell Corporation Limited.
dIRectoRS’ RepoRt 30 june 2011

50 STanwell annual RepoRT 2011
SIgnIFIcAnt cHAngeS In tHe StAte oF AFFAIRS (contInued)
Restructure of the Queensland government owned corporation generators (continued)
The following assets and contracts were transferred from CS Energy Limited to Stanwell Corporation Limited with effect from 1 July 2011:
• Mica Creek Power Station;
• Swanbank B and E Power Stations; and
• Collinsville Power Purchase Agreement.
In accordance with the regulation, the Gladstone Interconnection and Power Pooling Agreement was transferred from Stanwell Corporation Limited to CS Energy Limited with effect from 1 July 2011.
Sale of mineral development licence
During the year, Stanwell Corporation Limited sold an interest in a mineral development licence in Queensland. The sale of the licence and associated land resulted in a gain for the Group of $271.0 million before tax (after tax gain of $189.7 million).
Sale of remaining Wind Asset in Western Australia
On 30 June 2011, Stanwell Corporation Limited concluded the sale of Wind Portfolio Pty Ltd and EDWF Holdings 1 Pty Ltd which held its interests in the Emu Downs Wind Farm in Western Australia. The sale resulted in a gain for the Group of $5.4 million before tax (after tax gain of $3.8 million).
mAtteRS SuBSeQuent to tHe end oF tHe FInAncIAl YeAR
Restructure of the Queensland government owned corporation generators
The restructure of the Queensland Government Owned Electricity Generator Corporations outlined in this report took effect from 1 July 2011.
Federal government’s proposed carbon pricing mechanism
On 10 July 2011 the Federal Government announced a proposal, ‘Securing a Clean Energy Future – the Australian Government’s Climate Change Plan’, to implement a two-stage carbon pricing mechanism for the Australian economy. The proposed carbon price plan will effectively embed a carbon price into the Australian economy. Commencing on 1 July 2012, the proposal sets a fixed price path for the first three years ($23 per tonne of CO2-equivalent emissions adjusted in real terms by 2.5 per cent per annum) before moving to a flexible price mechanism from 1 July 2015. It proposes a framework for setting a cap on greenhouse gas emissions by capping the number of carbon units available once the flexible price period commences, which can be adjusted over time to ensure that the Government’s reduction targets are met. The commencement of the scheme is subject to the ability to negotiate agreement with a majority in both Houses of Parliament to pass legislation during the 2011 calendar year.
On 28 July 2011, the Australian Government released exposure draft legislation, including consequential and associated tax measures, in relation to its recently announced Climate Change Plan. Legislation is expected to be tabled in Parliament during the September 2011 sitting following a period of consultation which concluded on 22 August 2011.
Notwithstanding the lack of an enacted legislation for a carbon pricing mechanism in Australia at the date of this financial report, the introduction of a price on carbon is becoming increasingly more likely. Existing legislation requires an increasing number of entities to monitor their carbon emissions and the uncertainty surrounding a carbon price is being reflected in market transactions in industries heavily exposed to a carbon price. Implications of this are contained in note 3 of the financial statements.
legal proceedings
On 28 July 2009, the Australian Energy Regulator announced that it had instituted proceedings against the Company in the Federal Court, alleging that the Company did not make several of its offers to generate electricity in ‘good faith’ contrary to the National Electricity Rules. The trial commenced on 15 June 2010 and concluded on 5 July 2010. On 30 August 2011, the Federal Court handed down its judgement. The Court found in favour of Stanwell Corporation Limited and the full impact of this decision is yet to be determined. The Australian Energy Regulator has 28 days to determine whether or not to lodge an appeal against this decision. The compensation in relation to legal costs incurred by the Company defending the allegations has not been determined at the date of this report.
Other than the matters discussed above, there has not been any matter or circumstance occurring subsequent to the end of the financial year that has significantly affected, or may significantly affect, the operations of the Group, the results of those operations, or the state of affairs of the Group in future financial years.
envIRonmentAl RegulAtIon
The Group’s operations are subject to significant environmental regulation under both Commonwealth and State legislation. The primary environmental legislation governing the Group’s activities in Queensland is the Environmental Protection Act 1994.
The Group undertakes a number of systematic processes to manage its environmental activities. These systems include line management environmental responsibilities for day-to-day activities, specialist environmental personnel providing environmental advice and monitoring compliance, and a reporting regime which involves the Chief Executive Officer providing monthly environmental performance reports to the Board.
dIRectoRS’ RepoRt 30 june 2011

STanwell annual RepoRT 2011 51
g j carpenter MBA, FAICD, FCA
Mr Carpenter joined Stanwell Corporation Limited as a non-executive director and Chairman on 1 July 2011. He is a member of the People and Safety Committee and Audit and Risk Management Committee.
Mr Carpenter brings expertise in the areas of corporate governance, financial management consulting, accounting, audit, risk management and performance management.
Mr Carpenter is Chair of the Audit Committees of South Bank Corporation, Queensland Police Service, Department of Premier & Cabinet, Local Government Association of Queensland, Urban Land Development Authority and Scenic Rim Regional Council. He serves on committees for the Office of State
envIRonmentAl RegulAtIon (contInued)
The directors are not aware of any significant breaches of environmental regulation occurring during the period covered by this report.
greenhouse gas and energy data reporting requirements
The Group is subject to the reporting requirements of both the Energy Efficiency Opportunities Act 2006 and the National Greenhouse and Energy Reporting Act 2007.
Revenue (Queensland Treasury), Griffith University, Construction Skills Queensland and Hassad Australia Pty Ltd. He provides consulting services to BDO where he previously was a Partner.
k l collins MBA, BEng (Elec), GAICD
Ms Collins joined Stanwell Corporation Limited as a non-executive director on 1 July 2011. She is a member of the People and Safety Committee.
Ms Collins is an electrical engineer, experienced in project operations and risk management in the commercial construction industry. She was State Manager for Siemens Ltd, Building Automation and provided project management and design for building automation, energy and access control systems.
The Energy Efficiency Opportunities Act 2006 requires the Group to assess its energy usage, including the identification, investigation and evaluation of energy saving opportunities, and to report publicly on the assessments undertaken, including what action the entity intends to take as a result. The requirement to comply with this Act commenced on 1 July 2011.
The National Greenhouse and Energy Reporting Act 2007 requires the Group to report its annual greenhouse gas emissions and energy use. The Group has implemented systems and processes for
Ms Collins currently provides project management and engineering design services on major projects in South East Queensland through her own consultancy company.
g F crow Sc BCom, LLB (Hons)
Mr Crow joined Stanwell Corporation Limited as a non-executive director on 1 October 2008. He is a member of the People and Safety Committee.
Mr Crow is a Barrister who has practised in personal injury, commercial and estate litigation for the past 20 years. Mr Crow is currently Chairman of the Rockhampton Leagues Club and a panel Barrister to WorkCover Queensland, Suncorp, Allianz, several other major insurers and a large international mining corporation.
the collection and calculation of the data required and submitted its 2009/10 report to the Greenhouse and Energy Data Officer on 27 October 2010.
InFoRmAtIon on dIRectoRS
As at 30 August 2011, the Stanwell Corporation Limited’s directors were as follows:
nAme poSItIon YeAR oF InItIAl AppoIntment YeAR oF Re-AppoIntment
g j carpenter Chair, non-executive director 2011
k l collins Non-executive director 2011
g F crow Sc Non-executive director 2008 2011
A A Fitzpatrick Non-executive director 2011
R j kempnich Non-executive director 2011
j A leaver Non-executive director 2009 2011
S R Rochester Non-executive director 2011
R j Welford Non-executive director 2011 A brief biography for each of the directors as at 30 August 2011 is presented below:
dIRectoRS’ RepoRt 30 june 2011

52 STanwell annual RepoRT 2011
InFoRmAtIon on dIRectoRS (contInued)
g F crow Sc BCom, LLB (Hons) (continued)
Prior to his career in law, he worked as an accountant with Coopers & Lybrand Brisbane prior to taking up an appointment as a Judge’s Associate. After completing his Bachelor of Commerce in 1987, Mr Crow worked as a tutor in financial and managerial accounting and law at The University of Queensland and Queensland University of Technology and lectured and tutored in commercial and corporate law at Central Queensland University.
A A Fitzpatrick BA, LLB, GAICD
Ms Fitzpatrick joined Stanwell Corporation Limited as a non-executive director on 1 July 2011. She is a member of the People and Safety Committee.
Ms Fitzpatrick has practised as a lawyer for 25 years and for the past two years has been sitting as a Tribunal member, first in the Anti-Discrimination Tribunal and currently in the Queensland Civil and Administrative Tribunal (QCAT). For 13 years she was a partner in two major law firms. A partner of McCullough Robertson for ten years, she retired from private practice in 2008. Ms Fitzpatrick’s speciality is as an employment, industrial and anti-discrimination lawyer, with a large part of her work at QCAT involving conciliation and determination of building disputes and anti- discrimination matters. In the first half of her career, she practiced as a commercial litigator specialising in intellectual property and construction law.
R j kempnich BEng (Mech), MAICD
Mr Kempnich joined Stanwell Corporation Limited as a non-executive director on 1 July 2011. He is the Chair of the People and Safety Committee.
Mr Kempnich has more than 30 years experience in coal resource evaluation, process plant design, construction and commissioning gained both in Australia and internationally. He commenced his career in 1977 as an engineer with the Australian Coal Industry Research Laboratories where
he was responsible for the coal preparation pilot plant facilities at Maitland, NSW.
Mr Kempnich is a founding partner of Sedgman & Associates Pty Ltd, the original company established in 1980, from which the publicly listed group Sedgman Limited has grown. As Managing Director of Sedgman from 1991, he led the organisation’s growth from a consulting and engineering firm to a market leader in coal preparation, design and construction. He was responsible for the expansion of the company’s operations internationally including the SEI licence arrangement which established the US licensee business in 1993.
In 1998 Mr Kempnich became the Executive Chairman of Sedgman Limited, having responsibility at the time for the corporate direction of the overall group and business development. He is now the non- executive Chairman of Sedgman Limited and oversees the international activities of one of Australia’s most successful mining services groups.
j A leaver BCom, FCPA, MAICD
Ms Leaver joined Stanwell Corporation Limited as a non-executive director on 1 October 2009. She is the Chair of the Audit and Risk Management Committee.
Ms Leaver has extensive financial expertise gained through her former executive roles in the telecommunications and mining industries as well as various board positions. She has worked in companies listed on the ASX, the US SEC and with State and Federal Government Owned Corporations.
During her 10 years with Telstra Corporation, Ms Leaver had responsibility for the group’s financial reporting requirements in Australia and the US. She was the Telstra Group coordinator of the US prospectus for T2, the second tranche of the sale of the Federal Government’s interest in its ownership of Telstra. Her experience extends to 15 years with the former mining group MIM, including 5 years at Mount Isa, and membership of the Australian Accounting Standards Board (AASB).
S R Rochester BEc, FCPA, MAICD
Mr Rochester was appointed a non-executive director of Stanwell Corporation Limited on 1 July 2011. He is a member of the Audit and Risk Management Committee.
Mr Rochester is an established leader in public sector financing, the banking and finance industry and the global financial markets, with a career spanning more than 35 years.
Mr Rochester is currently the Chairman of the Queensland Treasury Corporation (QTC) and is also the Chairman of the QTC Human Resources Committee and a member of the Risk Management Committee. Previously, Mr Rochester was QTC’s inaugural Chief Executive and held the position for 22 years before taking up the appointment of Chairman on 1 September 2010.
R j Welford BA (Hons), LLB, Grad Dip Leg Prac, Grad Dip Ind Rel, MSc (Env Mgt)
Mr Welford was appointed a non-executive director of Stanwell Corporation Limited on 1 July 2011. He is a member of the Audit and Risk Management Committee.
Mr Welford is a former Queensland Attorney General and Minister for Justice, Minister for Education and Training, and Minister for the Arts, and also Minister for Environment and Heritage and Minister for Natural Resources. He is currently engaged in the fields of recycling, energy efficiency and renewable energy. Prior to his election to the Queensland Parliament, he was a Solicitor of the Supreme Court of Queensland and barrister of the High Court of Australia.
Mr Welford is the Chief Executive of the Australian Council of Recycling, Chairman of the Energy Management Institute, Deputy Chair of Astivita Renewables Limited, and Managing Director of Integrated Resource Planners.
Brief biographies of the former directors are presented on the next page:
dIRectoRS’ RepoRt 30 june 2011

STanwell annual RepoRT 2011 53
InFoRmAtIon on dIRectoRS (contInued)
t Andersen BE, MIE (Aust)
Mr Andersen was appointed a non-executive director on 1 October 2009. He was a member of the Project Advisory Group and Human Resources and Work Place Health and Safety Committee. Mr Andersen resigned as a director on 30 June 2011.
d m Byrne LLB
Mr Byrne was appointed a non-executive director and Chair on 1 July 2006. Mr Byrne was granted unpaid leave of absence from his duties to the Stanwell Corporation Limited Board upon being appointed to the Advisory Board of the putative Genco 1 (CS Energy Limited) for the period 16 March 2011 to 30 June 2011. Mr Byrne resigned as a director on 30 June 2011.
l m j gillespie GAICD
Mr Gillespie was appointed a non-executive director on 1 July 2006. He was Chair of the Human Resources and Workplace Health and Safety Committee. Mr Gillespie resigned as a director on 30 June 2011.
m d Williamson Assoc Dip Ind Eng, MAICD
Mr Williamson was appointed a non-executive director on 5 July 2001. He was Chair of the Project Advisory Group and a member of the Audit and Risk Management Committee and Human Resources and Workplace Health and Safety Committee. Mr Williamson resigned as a director on 30 June 2011.
compAnY SecRetARY
The names and qualifications of those persons who were company secretaries of the Group during the financial year and up to the date of this report are detailed below:
karen Buckley BA, GCert Law, Certmember CSA
Ms Buckley was appointed company secretary on 1 July 2011.
Ms Buckley has extensive experience of both listed company and Government Owned Corporations statutory and regulatory compliance obligations.
michael o’Rourke BLaw, BCom, GDip Applied Finance, GDip Company Secretarial Practice
Mr O’Rourke was appointed company secretary in 2002.
Mr O’Rourke was appointed Executive General Manager Governance and Strategy of Stanwell Corporation Limited on 1 July 2011. In that role he is responsible for audit, secretariat, legal, risk, compliance, insurance and information management functions. Mr O’Rourke was previously General Manager Corporate Services for Stanwell Corporation Limited.
karesse Biggs BCom, LLB, GDip App Corp Gov and ACIS
Ms Biggs was appointed company secretary on 31 January 2011 and resigned from that office on 30 June 2011.
Ms Biggs was admitted as a solicitor of the Queensland Supreme Court and High Court of Australia in January 2001 and holds a current Queensland Practicing Certificate. She is a Chartered Secretary and an Associate of Chartered Secretaries Australia. Ms Biggs worked in private legal practice for 5 years before joining Stanwell Corporation Limited and since then has worked as the Assistant Company Secretary and Company Secretary managing areas of corporate governance, legal, compliance, insurance and internal audit.
dIRectoRS’ RepoRt 30 june 2011

54 STanwell annual RepoRT 2011
IndemnIFIcAtIon And InSuRAnce oF oFFIceRS
Indemnification
Every person who is, or has been, an officer of the company, is indemnified by the company against a liability for costs and expenses incurred by that person (as an officer) in defending any proceedings in which a judgement has been given in favour of that person, or where the Court has granted relief. This indemnity is detailed in Section 8 of Stanwell Corporation Limited’s constitution (as approved by shareholding Ministers on 29 September 2008). This indemnity excludes actions arising from conduct involving a lack of good faith or improper use of position.
The directors, company secretaries and executive officers (current and former) receive benefit of this indemnity.
Insurance premiums
During the financial year the Group has paid an insurance premium for an insurance policy, for the benefit of the directors and officers.
g j carpenter Chairman
j A leaver Director
Brisbane 30 August 2011
The insurance premium relates to:
• costs and expenses incurred by the relevant officers in defending proceedings, whether civil or criminal, and whatever their outcome; and
• other liabilities that may arise from their position, with the exception of conduct involving a wilful breach of duty or improper use of information or position to gain a personal advantage.
AudItoR’S Independence declARAtIon
A copy of the auditor’s independence declaration as required under section 307C of the Corporations Act 2001 is set out on page 55.
RoundIng oF AmountS
The Corporation is of a kind referred to in Class Order 98/100, issued by the Australian Securities and Investments Commission, relating to the ‘’rounding off’’ of amounts in the directors’ report. Amounts in the directors’ report have been rounded off in accordance with that Class
Order to the nearest thousand dollars, unless otherwise stated.
AudItoR
The Queensland Audit Office continues in office in accordance with section 327 of the Corporations Act 2001.
This report is made in accordance with a resolution of directors:
dIRectoRS’ RepoRt 30 june 2011
meetIngS oF dIRectoRS
The number of directors’ meetings held, and the number attended by each of the directors of Stanwell Corporation Limited during the period 1 July 2010 to 30 June 2011 are detailed in the table below:
commItteeS
BoARd
AudIt And RISk mAnAgement
commIttee
HumAn ReSouRceS And WoRkplAce
HeAltH And SAFetY commIttee
pRoject AdvISoRY
gRoup
A B A B A B A B
d m Byrne(c) 4 4 4 4 3 3 3 3
j A leaver 6 6 5 5 1 1 – –
t Andersen 6 6 – – 4 4 3 3
g F crow Sc(c) 4 4 4 3 – – – –
l m j gillespie 6 6 – – 4 4 – –
m d Williamson 6 5 1 1 3 2 3 2 A = Number of meetings held during the time the director held office or was a member of the committee during the year
B = Number of meetings attended
C = Advisory Boards were appointed to assist the Government in implementing the recommendations of the Shareholder Review of Government Owned Corporation Generators. Mr Byrne and Mr Crow were appointed respectively to the Advisory Boards of the putative Genco 1 (CS Energy Limited) and Genco 2 (Stanwell Corporation Limited). In order for them to give their full attention to the Advisory Boards and to avoid any actual or perceived conflicts of interest, the Stanwell Corporation Limited Board granted them unpaid leave of absence from their duties to participate in the affairs of the Group from 16 March 2011 until 30 June 2011.

STanwell annual RepoRT 2011 55
to tHe dIRectoRS oF StAnWell coRpoRAtIon lImIted
This audit independence declaration has been provided pursuant to section 307C of the Corporations Act 2001.
Independence declARAtIon
As lead auditor for the audit of Stanwell Corporation Limited for the year ended 30 June 2011, I declare that, to the best of my knowledge and belief, there have been:
(a) no contraventions of the auditor independence requirements of the Corporations Act 2001 in relation to the audit; and
(b) no contraventions of any applicable code of professional conduct in relation to the audit.
g g poole Brisbane Auditor-General of Queensland 26 August 2011
AudItoR’S Independence declARAtIon 30 june 2011
56 STanwell annual RepoRT 2011
AnnuAl FInAncIAl RepoRt 30 june 2011
FInAncIAl RepoRt _________________________________________________________________________________________56
Statements of comprehensive income _________________________________________________________________ 57
Balance sheets _______________________________________________________________________________________________ 58
Statements of changes in equity _________________________________________________________________________ 59
Cash flow statements_______________________________________________________________________________________ 61
Notes to the financial statements _______________________________________________________________________ 62
Directors’ declaration ______________________________________________________________________________________ 124
Independent auditor’s report to the members _______________________________________________________ 125
This financial report covers the separate financial statements of Stanwell Corporation Limited as an individual entity and the consolidated financial statements for the consolidated entity consisting of Stanwell Corporation Limited and its subsidiaries. The financial report is presented in the Australian currency.
Stanwell Corporation Limited is a company limited by shares, incorporated and domiciled in Australia. Its registered office and principal place of business is:
Stanwell Corporation Limited ABN 37 078 848 674 Level 13 42 Albert Street Brisbane QLD 4001
Stanwell Corporation Limited is an integrated wholesale energy provider operating predominately in Queensland.
The financial report was authorised for issue by the directors on 30 August 2011.

STanwell annual RepoRT 2011 57
StAtementS oF compReHenSIve Income FoR tHe YeAR ended 30 june 2011
conSolIdAted pARent entItY
notes2011
$’0002010
$’0002011
$’0002010
$’000
Revenue 4 562,619 662,955 554,933 656,716
Other income 5 288,429 25,299 309,225 25,299Cost of sales (226,039) (218,948) (223,814) (217,021)Depreciation and amortisation expense 6 (81,580) (78,934) (81,580) (78,934)Other expenses (37,555) (31,571) (37,555) (31,571)Employee expenses (49,437) (49,532) (49,433) (49,525)Business support costs (35,345) (37,899) (35,112) (37,678)Net loss on disposal of property, plant and equipment (8,066) (8,068) (8,066) (8,068)Impairment loss 6 (251,286) (9,160) (246,873) (9,160)Research and development (302) (315) (302) (315)Onerous contract 23, 27 (140,951) (16,400) (140,951) (16,400)Finance costs 6 (45,066) (31,900) (45,022) (31,861)
(loss)/profit before income tax (24,579) 205,527 (4,550) 201,482
Income tax equivalent benefit/(expense) 7 12,587 (56,065) 9,067 (53,171)(Loss)/profit from continuing operations (11,992) 149,462 4,517 148,311
(loss)/profit for the year (11,992) 149,462 4,517 148,311
other comprehensive income
Cash flow hedges:
- effective portion of changes in fair value 30 24,574 151,168 24,574 151,168- net change in fair value transferred to profit or loss 30 (104,978) (49,997) (104,978) (49,997)- net change in fair value transferred to property
plant and equipment 30 (268) (1,088) (268) (1,088)Actuarial (losses)/gains on defined benefit plans 30 (307) 208 (307) 208Income tax equivalent relating to components of other comprehensive income 7(c) 24,294 (30,087) 24,294 (30,087)Other 30 (823) – (823) –
other comprehensive (loss)/income for the year, net of tax (57,508) 70,204 (57,508) 70,204
total comprehensive (loss)/income for the year (69,500) 219,666 (52,991) 218,515
(Loss)/profit is attributable to: Owners of Stanwell Corporation Limited
(11,992)
149,462 4,517
148,311
Total comprehensive (loss)/income for the year is attributable to: Owners of Stanwell Corporation Limited
(69,500)
219,666
(52,991)
218,515
The above statements of comprehensive income should be read in conjunction with the accompanying notes.

58 STanwell annual RepoRT 2011
BAlAnce SHeetS AS At 30 june 2011
conSolIdAted pARent entItY
notes2011
$’0002010
$’0002011
$’0002010
$’000
ASSetS
current assetsCash and cash equivalents 8 419,334 212,034 418,706 212,031Trade and other receivables 9 66,560 94,327 75,998 94,326Inventories 10 48,745 36,424 48,745 36,424Derivative financial instruments 11 12,234 106,288 12,234 106,288
546,873 449,073 555,683 449,069Assets of disposal group classified as held for sale or distribution 12 69,857 109,391 69,857 13,849Total current assets 616,730 558,464 625,540 462,918
non-current assetsDerivative financial instruments 11 73,440 60,911 73,440 60,911Available-for-sale financial assets 13 9,067 18,757 9,067 18,757Other financial assets 14 – – – 76,726Property, plant and equipment 15 1,039,244 1,297,523 1,039,244 1,297,523Intangible assets 16 9,315 4,351 9,315 4,351Biological assets 17 513 424 513 424Exploration and evaluation expenditure 18 42,217 6,132 37,804 6,132Deferred tax equivalent assets 19 18,590 24,177 17,266 24,141Retirement benefit surplus 20 3,133 3,379 3,133 3,379Other non-current assets 21 2,500 7,848 2,500 7,848Total non-current assets 1,198,019 1,423,502 1,192,282 1,500,192
total assets 1,814,749 1,981,966 1,817,822 1,963,110
lIABIlItIeS
current liabilitiesTrade and other payables 22 48,535 68,392 48,535 68,392Provisions 23 7,571 128,194 7,571 128,194Derivative financial instruments 11 5,059 17,406 5,059 17,406Current tax equivalent liabilities 49,292 39,489 49,292 39,489Other current liabilities 24 21 26,614 21 26,614
110,478 280,095 110,478 280,095Liabilities directly associated with assets of disposal group classified as held for sale or distribution 12 184,724 694 184,724 – Total current liabilities 295,202 280,789 295,202 280,095
non-current liabilitiesBorrowings 25 637,146 637,146 637,146 637,146Deferred tax equivalent liabilities 26 237,847 351,999 237,847 347,273Provisions 27 4,763 16,364 4,763 16,364Derivative financial instruments 11 26,870 13,247 26,870 13,247Other non-current liabilities 28 2,500 2,500 2,500 2,500Total non-current liabilities 909,126 1,021,256 909,126 1,016,530total liabilities 1,204,328 1,302,045 1,204,328 1,296,625net assets 610,421 679,921 613,494 666,485
eQuItYContributed equity 29 544,569 544,569 544,569 544,569Reserves 30(a) 37,121 93,591 37,121 93,591Other owner contributions 30(b) (148,309) (148,309) (148,309) (148,309)Retained profits 30(c) 177,040 190,070 180,113 176,634
total equity 610,421 679,921 613,494 666,485 The balance sheets should be read in conjunction with the accompanying notes.

STanwell annual RepoRT 2011 59
StAtementS oF cHAngeS In eQuItY FoR tHe YeAR ended 30 june 2011
conSolIdAtedcontRIButed
eQuItY ReSeRveSotHeR oWneR
contRIButIonSRetAIned
eARnIngStotAl
eQuItY
notes $'000 $'000 $'000 $'000 $'000
Balance at 1 july 2009 924,569 23,533 (148,309) 157,162 956,955
Profit for the year 30 – – – 149,462 149,462 Net change in fair value of cash flow
hedges transferred to profit and loss 30 – (49,997) – – (49,997) Effective portion of changes in fair value
of cash flow hedges 30 – 151,168 – – 151,168 Net actuarial gain on defined benefit plan 30 – – – 146 146 Net change in fair value of cash flow
hedges transferred to property, plant and equipment 30 – (1,088) – – (1,088)
Income tax equivalent relating to components of other comprehensive income 30 – (30,025) – – (30,025)
transactions with owners in their capacity as owners:
Capital repatriation (380,000) – – – (380,000)Dividends provided for or paid 31 – – – (116,700) (116,700)
Balance at 30 june 2010 544,569 93,591 (148,309) 190,070 679,921
Balance at 1 july 2010 544,569 93,591 (148,309) 190,070 679,921
(Loss) for the year 30 – – – (11,992) (11,992) Net change in fair value of cash flow hedges
transferred to profit and loss 30 – (104,978) – – (104,978) Effective portion of changes in fair value
of cash flow hedges 30 – 24,574 – – 24,574 Net actuarial gain on defined benefit plan 30 – – – (215) (215) Net change in fair value of cash flow hedges
transferred to property, plant and equipment 30 – (268) – – (268)
Income tax equivalent relating to components of other comprehensive income 30 – 24,202 – – 24,202
Other 30 – – – (823) (823)
Balance at 30 june 2011 544,569 37,121 (148,309) 177,040 610,421 The statements of changes in equity should be read in conjunction with the accompanying notes.

60 STanwell annual RepoRT 2011
pARent entItYcontRIButed
eQuItY ReSeRveSotHeR oWneR
contRIButIonSRetAIned
eARnIngStotAl
eQuItY
notes $'000 $'000 $'000 $'000 $'000
Balance at 1 july 2009 924,569 23,533 (148,309) 144,877 944,670
Profit for the year 30 – – – 148,311 148,311 Net change in fair value of cash flow hedges
transferred to profit and loss 30 – (49,997) – – (49,997) Effective portion of changes in fair value
of cash flow hedges 30 – 151,168 – – 151,168 Net actuarial gain on defined benefit plan 30 – – – 146 146 Net change in fair value of cash flow
hedges transferred to property, plant and equipment 30 – (1,088) – – (1,088)
Income tax equivalent relating to components of other comprehensive income 30 – (30,025) – – (30,025)
transactions with owners in their capacity as owners:
Capital repatriation (380,000) – – – (380,000)Dividends provided for or paid 31 – – – (116,700) (116,700)
Balance at 30 june 2010 544,569 93,591 (148,309) 176,634 666,485
Balance at 1 july 2010 544,569 93,591 (148,309) 176,634 666,485
Profit for the year 30 – – – 4,517 4,517 Net change in fair value of cash flow hedges
transferred to profit and loss 30 – (104,978) – – (104,978) Effective portion of changes in fair value
of cash flow hedges 30 – 24,574 – – 24,574 Net actuarial gain on defined benefit plan 30 – – – (215) (215) Net change in fair value of cash flow hedges
transferred to property, plant and equipment 30 – (268) – – (268)
Income tax equivalent relating to components of other comprehensive income 30 – 24,202 – – 24,202
Other 30 – – – (823) (823)
Balance at 30 june 2011 544,569 37,121 (148,309) 180,113 613,494 The statements of changes in equity should be read in conjunction with the accompanying notes.
StAtementS oF cHAngeS In eQuItY FoR tHe YeAR ended 30 june 2011 (contInued)

STanwell annual RepoRT 2011 61
cASH FloW StAtementS FoR tHe YeAR ended 30 june 2011
conSolIdAted pARent entItY
notes2011
$’0002010
$’0002011
$’0002010
$’000
cash flows from operating activities
Cash receipts in the course of operations 575,958 697,684 550,931 685,509
Cash payments in the course of operations (377,140) (337,110) (371,226) (334,674)Interest received 19,461 9,132 18,830 8,745Interest paid (44,744) (31,577) (44,743) (31,577)Income tax equivalents paid (107,572) (65,145) (107,572) (60,992)
net cash inflow from operating activities 39 65,963 272,984 46,220 267,011
cash flows from investing activities
Payments for property, plant and equipment (72,733) (71,297) (72,733) (71,157)
Payments for intangible assets (8,960) (1,819) (8,960) (1,819)Payments for biological assets (89) (82) (89) (82)Net payments for exploration and evaluation expenditure (43,717) (1,553) (34,891) (1,553)Proceeds from disposal of net assets held for sale in disposal groups 370,604 – 376,084 –
Proceeds from disposal of non-current assets 1,051 310 – 310Dividends received 36 – – 5,779 5,600
net cash inflow/(outflow) from investing activities 246,156 (74,441) 265,190 (68,701)
cash flows from financing activities
Capital repatriation – (380,000) – (380,000)
Proceeds from borrowings – 380,000 – 380,000Dividends paid 31 (116,700) (148,944) (116,700) (148,944)Receipts from subsidiary – – 11,965 –
net cash inflow/(outflow) from investing activities (116,700) (148,944) (104,735) (148,944)
net increase in cash and cash equivalents 195,419 49,599 206,675 49,366
Cash and cash equivalents at the beginning of the financial year 223,915 174,316 212,031 162,665
cash and cash equivalents at end of year 8 419,334 223,915 418,706 212,031 The cash flow statements should be read in conjunction with the accompanying notes.

62 STanwell annual RepoRT 2011
1 SummARY oF SIgnIFIcAnt AccountIng polIcIeS
The principal accounting policies adopted in the preparation of the financial report are set out below. These policies have been consistently applied to all the years presented, unless otherwise stated. The financial report includes separate financial statements for Stanwell Corporation Limited (‘company’ or ‘parent entity’) as an individual entity and the consolidated entity consisting of Stanwell Corporation Limited and its subsidiaries (together referred to as the ‘Group’).
(a) Basis of preparation
This general purpose financial report has been prepared in accordance with Australian Accounting Standards, other authoritative pronouncements of the Australian Accounting Standards Board, Interpretations and the Corporations Act 2001.
The consolidated financial statements and notes of Stanwell Corporation Limited comply with Australian Accounting Standards which incorporate Australian equivalents to International Financial Reporting Standards (AIFRS).
Going concern
The financial report has been prepared on the going concern basis, which assumes continuity of normal business activities and the realisation of assets and the settlement of liabilities in the ordinary course of business.
The Group made a loss from continuing operations before tax of $24.6 million and had cash inflows of $195.4 million during the year ended 30 June 2011 and, as of that date, the Group’s total current assets exceeded its current liabilities by $321.5 million. The Company made a loss from continuing operations before tax of $4.6 million and had cash inflows of $206.7 million during the year ended 30 June 2011 and, as of that date, the Company’s total current assets exceeded its current liabilities by $330.3 million.
On 25 November 2010, the Queensland Government released a report entitled ‘Shareholder Review of Queensland Government Owned Corporation Generators’ (Generator Review). A recommendation of the Generator Review was the restructure of the three Government Owned Generators into two. Pursuant to this, the publication of the Government Owned Corporations (Generator Restructure) Regulation 2011 was gazetted on 24 June 2011 and gave effect to the transfer of nominated net assets and liabilities on 1 July 2011.
The directors in their consideration of the appropriateness of the going concern basis for the preparation of the financial report have reviewed the Group’s cash flow forecasts and revenue projections based on current market conditions and business plans. As part of this review, consideration was also given to conditions associated with the borrowings provided by Queensland Treasury Corporation following the restructure.
The directors consider that there are reasonable grounds that the Company and the Group will be able to pay their debts as and when they become due and payable. This is on the basis that on the date of the restructure, the Group and the Company were dependent on the continued financial support of their shareholding Ministers and have received confirmation of such support.
Accordingly the directors have prepared the financial report on the going concern basis as they are of the opinion the Group and Company will realise their assets and settle their liabilities and commitments in the normal course of business and for at least the amounts stated in this financial report for assets. Therefore the financial report does not include any adjustment relating to the recoverability and classification of the recorded asset amounts of the amounts and classification of liabilities should the Group or Company not continue as a going concern.
Historical cost convention
These financial statements have been prepared under the historical cost convention, as modified by the revaluation of financial assets and liabilities (including derivative instruments) at fair value.
Critical accounting estimates
The preparation of financial statements in conformity with AIFRS requires the use of certain critical accounting estimates. It also requires management to exercise its judgement in the process of applying the Group’s accounting policies. Estimates and judgements are based on historical experience and other factors, including expectations of future events that may have a financial impact on the Group and that are believed to be reasonable under the circumstances.
The areas involving a high degree of judgement/complexity, or areas where assumptions and estimates are significant to the financial statements, are disclosed in note 3.
(b) principles of consolidation
(i) Subsidiaries
The consolidated financial statements incorporate the assets and liabilities of all subsidiaries of Stanwell Corporation Limited (‘company’ or ‘parent entity’) as at 30 June 2011 and the results of all subsidiaries for the year then ended. Stanwell Corporation Limited and its subsidiaries together are referred to in this financial report as the Group or the consolidated entity.
Subsidiaries are all those entities (including special purpose entities) over which the Group has the power to govern the financial and operating policies, generally accompanying a shareholding of more than one-half of the voting rights. The existence and effect of potential voting rights that are currently exercisable or convertible are considered when assessing whether the Group controls another entity.
noteS to tHe FInAncIAl StAtementS 30 june 2011

STanwell annual RepoRT 2011 63
1 SummARY oF SIgnIFIcAnt AccountIng polIcIeS (contInued)
(b) principles of consolidation (continued)
(i) Subsidiaries (continued)
Subsidiaries are fully consolidated from the date on which control is transferred to the Group and cease to be consolidated from the date that control is transferred out of the Group. Subsidiary acquisitions are accounted for using the purchase method of accounting.
The financial statements of controlled entities are prepared for the same reporting period as the Company, using consistent accounting policies. Adjustments are made to bring into line any dissimilar accounting policies that may exist.
Intercompany transactions, balances and unrealised gains on transactions between Group companies are eliminated. Unrealised losses are also eliminated unless the transaction provides evidence of the impairment of the asset transferred.
Investments in subsidiaries are accounted for at cost in the individual financial statements of Stanwell Corporation Limited.
(ii) Joint ventures
The proportionate interests in the assets, liabilities and expenses of joint venture operations have been incorporated in the financial statements under the appropriate headings. Details of joint ventures are set out in note 38.
(c) Foreign currency translation
Foreign currency transactions are translated to Australian currency at the exchange rates prevailing at the dates of the transactions. Amounts receivable and payable in foreign currencies at reporting date are translated at the rates of exchange prevailing on that date. Translation differences relating to amounts payable and receivable in foreign currencies are recognised in the
statement of comprehensive income in the financial year in which the exchange rates change, except when deferred in equity as qualifying cash flow hedges.
(d) Revenue recognition
Revenue is measured at the fair value of the consideration received or receivable. Amounts disclosed as revenue are net of amounts collected on behalf of third parties. Revenue is recognised for the major business activities as follows:
• Electricity: when the electricity generated is traded in the pool market, or in the period that the electricity is generated pursuant to a contract, as applicable. The net result of electricity derivatives, relating to electricity traded in the pool market, is recognised on a fair value basis over the period of the derivative contracts except when deferred in equity as qualifying cash flow hedges until the period to which the contract settlement relates;
• Coal revenue sharing arrangements: when coal is exported by the coal supplier;
• Coal on-sale: direct sale or export of coal as it accrues;
• Interest income: as it accrues; and
• Other revenue: on an accruals basis.
(e) Income tax equivalents
The Company and its wholly-owned Australian controlled entities as set out in note 37 have formed a tax consolidated group.
The Company as head entity in the tax consolidated group is required to make income tax equivalent payments to the State Government, based upon the value of benefits derived by the tax consolidated group and is not liable to pay Commonwealth tax that would be payable if it were not a Government Owned Corporation.
These payments are made pursuant to section 155(4) of the Government Owned Corporations Act 1993 and are based upon rulings set out in the Treasurer’s
Tax Equivalents Manual. The National Tax Equivalents Regime gives rise to obligations which reflect in all material respects those obligations for taxation which would be imposed by the Income Tax Assessment Act 1936 and the Income Tax Assessment Act 1997.
(f) tax effect accounting
The Group adopts the balance sheet approach to accounting for income tax equivalent payments.
The income tax equivalent expense or benefit for the period is the tax equivalent payable or receivable on the current period’s taxable profit or loss based on the national income tax rate for each jurisdiction adjusted by changes in deferred tax equivalent assets and liabilities attributable to temporary differences between the tax bases of assets and liabilities and their carrying amounts in the financial statements, and to unused tax losses.
Deferred tax equivalent assets and liabilities are recognised for temporary differences at the tax rates expected to apply when the assets are recovered or liabilities are settled, based on those tax rates which are enacted or substantively enacted for each jurisdiction. The relevant tax rates are applied to the cumulative amounts of deductible and taxable temporary differences to measure the deferred tax asset or liability. An exemption is made for certain temporary differences arising from the initial recognition of an asset or liability. No deferred tax equivalent asset or liability is recognised in relation to these temporary differences if they arose in a transaction, other than a business combination, that at the time of the transaction did not affect either accounting profit or taxable profit or loss.
Deferred tax equivalent assets are recognised for deductible temporary differences and unused tax losses only if it is probable that future taxable amounts will be available to utilise those temporary differences and losses.
noteS to tHe FInAncIAl StAtementS 30 june 2011

64 STanwell annual RepoRT 2011
1 SummARY oF SIgnIFIcAnt AccountIng polIcIeS (contInued)
(f) tax effect accounting (continued)
Deferred tax equivalent liabilities and assets are not recognised for temporary differences between the carrying amount and tax based of investments in controlled entities where the Company is able to control the timing of the reversal of temporary differences and it is probable that the differences will not reverse in the foreseeable future.
Deferred tax equivalent assets and liabilities are offset when there is a legally enforceable right to offset current equivalent tax assets and liabilities and when the deferred tax equivalent balances relate to the same taxation authority. Current tax equivalent assets and tax liabilities are offset where the entity has a legally enforceable right to offset and intends either to settle on a net basis, or to realise the asset and settle the liability simultaneously.
Current and deferred tax equivalent balances attributable to amounts recognised directly in equity are also recognised directly in equity.
(g) tax consolidation
As a consequence of the establishment of the tax consolidated group (refer note 1e), the current and deferred tax equivalent amounts for the tax consolidated group are allocated among the entities in the Group using a stand alone taxpayer approach whereby each entity in the tax consolidated group measures its current and deferred taxes as if it continued to be a separate taxable entity in its own right. Deferred tax equivalent assets and deferred tax equivalent liabilities are measured by reference to the carrying amounts of the assets and liabilities in the Company’s balance sheet and their tax values under consolidation.
Any current tax equivalent liabilities (or assets) and deferred tax equivalent
assets arising from unused tax equivalent losses assumed by the Company from the wholly-owned controlled entities in the tax consolidated group are recognised in accordance with the tax funding agreement (refer below). Any difference between these amounts is recognised by the Company as an equity contribution to or distribution from the wholly owned controlled entities. Distributions firstly reduce the carrying amount of the investment in the wholly-owned controlled entities and are then recognised as revenue.
The tax consolidated group has entered into a tax sharing agreement and tax funding agreement. The tax funding agreement requires each wholly-owned controlled entity to pay to the Company the current tax equivalent liability (asset) and any unused tax losses assumed by the Company. The tax sharing agreement sets out the allocation of income tax equivalent liabilities amongst the entities should the Company default on its tax equivalent payment obligations and the treatment of entities exiting the tax consolidated group.
(h) leases
Leases of property, plant and equipment where the Group has substantially all the risks and rewards of ownership are classified as finance leases. Assets held under finance leases are capitalised at the lease’s inception at the lower of the fair value of the leased property and the present value of the minimum lease payments. The corresponding rental obligations, net of finance charges, are included in other liabilities. Each lease payment is allocated between the liability and finance cost. The finance cost is charged to the statement of comprehensive income over the lease period so as to produce a constant periodic rate of interest on the remaining balance of the liability for each period. The property, plant and equipment acquired under finance leases is amortised over the term of the relevant lease, or where it is likely
the Group will obtain ownership of the asset, the life of the asset.
Leases in which a significant portion of the risks and rewards of ownership are retained by the lessor are classified as operating leases. Payments made under operating leases (net of any incentives received from the lessor) are charged to the statement of comprehensive income on a straight-line basis over the period of the lease.
For assets subject to cross border leases, see note 40.
(i) Impairment of assets
The carrying value of non-current assets are assessed when an indicator of impairment exists or annually for assets that have an indefinite useful life. Where an impairment indicator has been identified an assessment is undertaken to determine if the carrying value of the asset is in excess of its recoverable amount. An impairment loss is recognised in the profit and loss if the asset value is in excess of the recoverable amount.
Assets that have previously been impaired are assessed annually to determine if there has been a reversal in impairment. Where this exists the impairment is reversed through the statement of comprehensive income only to the extent that the carrying value does not exceed the original carrying value net of depreciation should the asset not have been impaired.
Reviews are undertaken on an asset by asset basis except where these assets do not generate cash flows independent of other assets. Where assets do not generate cash flows independent of each other the impairment assessment is based on the cash-generating unit.
noteS to tHe FInAncIAl StAtementS 30 june 2011

STanwell annual RepoRT 2011 65
1 SummARY oF SIgnIFIcAnt AccountIng polIcIeS (contInued)
(i) Impairment of assets (continued)
The recoverable amount is calculated based on either the fair value of the asset less costs to sell or value in use. Fair value less costs to sell is determined as the amount that would be obtained from the sale of the asset in an arm’s length transaction between knowledgeable and willing parties. The value in use calculation is determined on the future cash flows based on the continuing use of the assets, discounted to a present value using an appropriate market based pre-tax discount rate. The discount rate reflects the current market assessment of the time value of money and asset-specific risks for which the cash flow estimates have not been adjusted.
(j) cash and cash equivalents
Cash and cash equivalents includes cash on hand, deposits held at call with financial institutions, other short-term, highly liquid investments with original maturities of three months or less that are readily convertible to known amounts of cash and which are subject to an insignificant risk of changes in value, and bank overdrafts. Bank overdrafts are shown within borrowings in current liabilities on the balance sheet.
(k) trade receivables
Trade receivables are recognised initially at fair value. Subsequent measurement is at amortised cost less provision for impairment. Trade receivables are generally due for settlement within no more than 30 days.
(l) Inventories
Consumable fuel and stores
Consumable fuel and stores are carried at the lower of their weighted average cost per individual item of inventory and net realisable value. Costs of inventory are determined after deducting associated rebates and discounts. Net realisable value is estimated selling price in the ordinary
course of business less the estimated costs necessary to make the sale.
Environmental certificates
A number of the Group’s operating assets are accredited to create environmental certificates which can be used to either acquit the mandatory renewable energy liability of the Group or alternatively can be realised through the market. The environmental certificates are created through various Commonwealth and state legislation. Environmental certificates that are available-for-sale are recognised in the financial statements at fair market value.
(m) non-current assets and liabilities and disposal groups held for sale or distribution
Non-current assets and disposal groups are classified as held for sale or distribution, if their carrying amount will be recovered principally through a sale or distribution transaction rather than through continuing use. This condition is regarded as met only when the distribution is highly probable and the non-current asset or disposal group is available for immediate distribution in its present condition. Management must be committed to the distribution, which should be expected to qualify for recognition as a completed distribution within one year from the date of classification. Non-current assets and disposal groups classified as held for distribution are measured at the lower of their carrying amount and fair value less costs to sell or distribute, except for assets such as deferred tax assets, assets arising from employee benefits, financial assets, investment property and non-current biological assets that are carried at fair value and contractual rights under insurance contracts, which are specifically exempt from this requirement.
An impairment loss is recognised for any initial or subsequent write-down of the asset (or disposal group) to fair value less costs to sell or distribute. A gain is recognised for any subsequent increases in fair value less costs to sell or distribute of an asset (or disposal group), but not in excess of any cumulative impairment loss
previously recognised. A gain or loss not previously recognised by the date of sale or distribution of the non-current asset (or disposal group) is recognised at the date of derecognition.
The fair value of balances held for sale is determined on the basis of the price in a binding sale agreement in an arm’s length transaction. In the absence of a binding sale agreement the fair value is determined based on the best information available to reflect the amount that could be obtained from disposal in an arm’s length transaction between knowledgeable, willing parties. In determining this amount, consideration is given to the outcome of recent transactions for similar assets within the same industry, and where material, independent valuation prepared by external valuation experts may be used.
The fair value of balances held for distribution is determined on a discounted cash flow basis, based on market assumptions disclosed in notes 3 (b) and agreed to by the Transferee and Transferor entities.
Non-current assets (including those that are part of a disposal group) are not depreciated or amortised while they are classified as held for sale or distribution. Interest and other expenses attributable to the liabilities of a disposal group classified as held for sale or distribution continue to be recognised.
Non-current assets classified as held for sale or distribution and the assets of a disposal group classified as held for sale or distribution are presented separately from other assets in the balance sheet. The liabilities of a disposal group classified as held for sale are presented separately from other liabilities in the balance sheet.
noteS to tHe FInAncIAl StAtementS 30 june 2011
66 STanwell annual RepoRT 2011
1 SummARY oF SIgnIFIcAnt AccountIng polIcIeS (contInued)
(n) Financial instruments
Financial assets
Classification ‑ Financial assets
Financial assets in the scope of AASB 139 Financial Instruments: Recognition and Measurement are classified as either financial assets at fair value through profit or loss, loans and receivables or available-for-sale financial assets.
Financial Instruments: Recognition and Measurement
(i) Financial assets at fair value through profit or loss
Financial assets at fair value through profit or loss are financial assets held for trading. Derivatives are classified as held for trading unless they are designated as hedges. Assets in this category are classified as current and non-current assets based on their expected settlement date.
(ii) Loans and receivables
Loans and receivables are non-derivative financial assets with fixed or determinable payments that are not quoted in an active market. They are included in current assets, except for those with maturities greater than 12 months after the reporting date which are classified as non-current assets. Loans and receivables are included in trade and other receivables (note 9) and other non-current assets (note 21) in the balance sheet.
(iii) Available‑for‑sale financial assets
Available-for-sale financial assets, comprising principally marketable equity securities, are non-derivatives that are either designated in this category or not classified in any of the other categories. They are included in non-current assets unless management intends to dispose of the investment within 12 months of the reporting date. Investments are designated as available-for-sale if they do not have fixed maturities and fixed or determinable payments and management intends to hold them for the medium to long term.
Recognition and derecognition – Financial assets
Regular purchases and sales of financial assets are recognised on trade-date which is the date on which the Group commits to purchase or sell the asset. Investments are initially recognised at fair value plus transaction costs for all financial assets not carried at fair value through profit or loss. Financial assets carried at fair value through profit or loss are initially recognised at fair value and transaction costs are expensed in the statement of comprehensive income. Financial assets are derecognised when the rights to receive cash flows from the financial assets have expired or have been transferred and the Group has transferred substantially all the risks and rewards of ownership.
Subsequent measurement – Financial assets
Loans and receivables are carried at amortised cost using the effective interest method.
Available-for-sale and financial assets at fair value through profit and loss are subsequently carried at fair value. Gains or losses arising from changes in the fair value of the ‘financial assets at fair value through profit or loss’ category are presented in the statement of comprehensive income within other income or other expenses in the period in which they arise.
Details on how the fair value of financial instruments is determined are disclosed in note 2.
Classification – Financial liabilities
Financial liabilities are classified as either financial liabilities at fair value through profit or loss or other financial liabilities.
(i) Financial liabilities at fair value through profit or loss
Financial liabilities are classified as at fair value through profit or loss where the financial liability is either held for trading or it is designated as at fair value through profit or loss. Derivatives are classified as
held for trading unless they are designated as hedges.
Financial liabilities at fair value through profit or loss are stated at fair value, with any resultant gain or loss recognised in profit or loss. The net gain or loss recognised in profit or loss incorporates any interest paid on the financial liability. Fair value is determined in the manner described in note 2.
Financial liabilities at fair value through profit or loss are included in the balance sheets as derivative financial instruments (note 11).
(ii) Other financial liabilities
Other financial liabilities, including borrowings, are initially measured at fair value, net of transaction costs.
Other financial liabilities are subsequently measured at amortised cost using the effective interest method, with interest expense recognised on an effective yield basis.
The effective interest method is a method of calculating the amortised cost of a financial liability and of allocating interest expense over the relevant period. The effective interest rate is the rate that exactly discounts estimated future cash payments through the expected life of the financial liability, or, where appropriate, a shorter period.
Other financial liabilities are included in the balance sheets as trade and other payables (note 22), other current liabilities (note 24), borrowings (note 25) and other non-current liabilities (note 28).
(o) derivatives
The Group is potentially exposed to commodity price, interest rate and foreign currency fluctuations and enters into economic hedges to manage these risks. Derivative financial instruments including forward foreign exchange contracts and currency options, commodity price and interest rate swaps, exchange traded futures, commodity caps and collar and floor contracts are used to hedge these risks.
noteS to tHe FInAncIAl StAtementS 30 june 2011

STanwell annual RepoRT 2011 67
1 SummARY oF SIgnIFIcAnt AccountIng polIcIeS (contInued)
(o) derivatives (continued)
AIFRS have a strict definition of what qualifies as an accounting hedge and in some circumstances some economic hedges will not qualify as hedges for accounting purposes. Derivative financial instruments are not held for speculative purposes.
Derivatives are initially recognised at fair value on the date the derivative contract is entered into and are subsequently remeasured to their fair value in line with market fluctuations at each reporting date. The accounting for subsequent changes in fair value depends on whether the derivative is designated as a hedging instrument, and if so, the nature of the item being hedged. The Group designates certain derivatives as hedges of the cash flows of recognised assets and liabilities and highly probable forecast transactions (cash flow hedges).
The Group documents at the inception of the hedging transaction the relationship between hedging instruments and hedged items, as well as its risk management objective and strategy for undertaking various hedge transactions. The Group also documents its assessment, both at hedge inception and on an ongoing basis, of whether the derivatives that are used in hedging transactions have been and will continue to be highly effective in offsetting changes in fair values or cash flows of hedged items.
The fair values of various derivative financial instruments used for hedging purposes are disclosed in note 11. Movements in the hedging reserve in shareholders’ equity are shown in note 30. Derivative financial instruments spanning both current and non-current periods are split into their current and non-current components prior to valuation. The fair value of these components is then classified as a current asset or liability when the maturity profile is less than 12 months, and classified as a non-current
asset or liability when the maturity profile is greater than 12 months.
Cash flow hedge
The effective portion of changes in the fair value of derivatives that are designated and qualify as cash flow hedges are recognised in equity in the hedging reserve. The gain or loss relating to the ineffective portion is recognised immediately in the statement of comprehensive income.
Amounts accumulated in equity are recycled in the statement of comprehensive income in the periods when the hedged item will affect profit or loss (for instance when the forecast sale that is hedged takes place). The gain or loss relating to the effective portion of interest rate swaps hedging variable rate borrowings is recognised in the statement of comprehensive income within ‘finance costs’. The gain or loss relating to the effective portion of forward foreign exchange contracts hedging export sales is recognised in the statement of comprehensive income within ‘revenue’. However, when the forecast transaction that is hedged results in the recognition of a non-financial asset (for example, property, plant and equipment) or a non-financial liability, the gains and losses previously deferred in equity are transferred from equity and included in the measurement of the initial cost or carrying amount of the asset or liability.
When a hedging instrument expires or is sold or terminated, or when a hedge no longer meets the criteria for hedge accounting, any cumulative gain or loss existing in equity at that time remains in equity and is recognised when the forecast transaction is ultimately recognised in the statement of comprehensive income. When a forecast transaction is no longer expected to occur, the cumulative gain or loss that was reported in equity is immediately transferred to the statement of comprehensive income.
Derivatives not hedge accounted
Certain derivative instruments are not hedge accounted for either because they do not qualify for hedge accounting or through management decision. Changes in the fair value of any derivative instrument not hedge accounted for is recognised immediately in the statement of comprehensive income.
Embedded derivatives
There may be circumstances where derivatives are embedded in the Group’s sale and purchase contracts. This occurs when future transactions under such contracts are to be executed at prices which will depend on the market prices of the specified financial instruments which themselves are not closely related to the commodities which are the subject of the contracts. The Group has embedded derivatives, however, the financial instruments are closely related to the commodities which are the subject of the contracts.
Derivatives embedded in other financial instruments or other host contracts are treated as separate derivatives when their risks and characteristics are not closely related to those of the host contracts.
(p) property, plant and equipment
Property, plant and equipment is stated at historical cost less depreciation. Historical cost includes expenditure that is directly attributable to the acquisition of the items. Cost may also include transfers from equity of any gains or losses on qualifying cash flow hedges of foreign currency purchases of property, plant and equipment.
As part of the electricity industry restructure which established the parent entity, independent experts valued non-current assets at 30 June 1997 in conjunction with the Electricity Reform Unit (ERU) on the following basis:
noteS to tHe FInAncIAl StAtementS 30 june 2011

68 STanwell annual RepoRT 2011
1 SummARY oF SIgnIFIcAnt AccountIng polIcIeS (contInued)
(p) property, plant and equipment (continued)
• power stations at depreciated optimised replacement value except where otherwise noted. This approach arrived at values based on the optimum set of replacement assets to achieve the same service potential with no inappropriate surplus capacity;
• land at Valuer-General valuations or market values;
• buildings at market values;
• vehicles at market values; and
• other assets at depreciated historical cost where it was not material or reasonable to undertake a detailed revaluation exercise, otherwise at depreciated replacement cost.
These non-current asset values were taken up in the financial statements as cost to the parent entity as at 1 July 1997.
Assets acquired with a cost of $500 or lower are immediately expensed at the date of purchase. All other purchases are capitalised and depreciated where appropriate.
Subsequent costs
Subsequent costs are included in the asset’s carrying amount or recognised as a separate asset, as appropriate, only when it is probable that future economic benefits associated with the item will flow to the Group and the cost of the item can be measured reliably. All other repair and maintenance costs are charged to the statement of comprehensive income during the financial period in which they are incurred.
Where the Group has an obligation to dismantle or remove an asset, or rehabilitate a site, the obligation is recognised as a provision (see note 1(w)) and is included in the initial cost of the asset. This cost is depreciated over the asset’s useful life.
Business development project costs
Business development project costs are expensed as incurred until such time as it is determined that the relevant project should proceed to the bankable feasibility stage. Costs associated with the development of a bankable feasibility study are capitalised. Capitalised feasibility costs are expensed if subsequently the related project does not proceed. Acquisition bid costs are capitalised and treated in the same manner as feasibility costs.
Complex assets
The components of major assets that have materially different useful lives are effectively accounted for as separate assets and are separately depreciated.
Depreciation and amortisation
All physical non-current assets, with the exception of freehold land and non-current assets held for sale or distribution, have limited useful lives and are depreciated or amortised using the straight line method over their estimated useful lives, taking into account estimated residual values, except for finance lease assets. Finance lease assets are amortised over the term of the relevant lease, or where it is likely the Group will obtain ownership of the asset, the life of the asset.
Assets are depreciated or amortised from the date of acquisition or, in respect of internally constructed assets, from the time an asset is completed and held ready for use.
Depreciation and amortisation rates and methods are reviewed annually for appropriateness. When changes are made, adjustments are reflected prospectively in current and future periods only.
Major spares purchased specifically for particular plant are capitalised and depreciated on the same basis as the plant to which they relate. Expenditure relating to major power station overhauls is capitalised and then depreciated over the period of the expected benefits of the overhaul.
The effective lives used to calculate depreciation for each class of asset or component thereof excluding non-current assets (or disposal groups) held for sale or distribution are as follows:
Power stations – leased 6 – 47 years
Power stations – owned 4 – 47 years
Other property, plant and equipment – leased 4 – 45 years
Other property, plant and equipment – owned 2 – 45 years
The assets’ residual values and useful lives are reviewed, and adjusted if appropriate, at each balance sheet date.
An asset’s carrying amount is written down immediately to its recoverable amount if the asset’s carrying amount is greater than its estimated recoverable amount see (note 1(i)).
Gains and losses on disposals are determined by comparing proceeds with carrying amount. These are included in the statement of comprehensive income.
(q) Intangible assets
Capitalised software
Software which is not integral to the operation of property, plant and equipment is recognised as an intangible asset. Software which is integral to the operation of property, plant and equipment is treated as property, plant and equipment. Capitalised software is amortised using the straight-line method over its useful life, which ranges from 2 to 5 years.
noteS to tHe FInAncIAl StAtementS 30 june 2011
STanwell annual RepoRT 2011 69
1 SummARY oF SIgnIFIcAnt AccountIng polIcIeS (contInued)
(q) Intangible assets (continued)
Research and development
Research expenditure is recognised as an expense as incurred. Costs incurred on development projects are recognised as intangible assets when it is probable that the project will (after considering its commercial and technical feasibility) be completed and generate future economic benefits, and its costs can be measured reliably. The expenditure capitalised comprises all directly attributable costs, including costs of materials, services and direct labour. Other development expenditures that do not meet these criteria are recognised as an expense as incurred. Development costs previously recognised as an expense are not recognised as an asset in a subsequent period. Capitalised development costs are recorded as intangible assets and amortised over the period the related benefit is derived.
Rights to gas supply
The cost of acquiring or securing long term gas arrangements are recorded at the cost of acquisition less accumulated amortisation and any impairment in value. The intangible asset is amortised from commencement of supply over the life of the supply arrangement. Where the intangible asset is not amortised, it is reviewed annually for indicators of impairment or whenever events or circumstances indicate the carrying amount will not be recoverable.
(r) Biological assets
Biological assets comprise timber plantations that are stated at cost less any accumulated depreciation and any accumulated impairment losses.
Cost has been adopted as the basis of measurement as the fair value is not determinable at present as the plantation
is in its early stages of growth and there is no observable active and liquid market for this timber.
Once the fair value of the plantation becomes reliably measurable it will be measured at its fair value less estimated point-of-sale costs with all changes in fair value being recognised in the statement of comprehensive income in the period in which they arise.
(s) exploration, evaluation and development costs
Exploration, evaluation and development costs are accumulated in respect of each separate area of interest. Exploration and evaluation costs are carried forward where right of tenure of the area of interest is current and they are expected to be recouped through sale or successful development and exploitation of the area of interest, or, where exploration and evaluation activities in the area of interest have not yet reached a stage that permits reasonable assessment of the existence of economically recoverable reserves.
When an area of interest is abandoned or the Board decide that it is not commercial, any accumulated costs in respect of that area are written off in the financial period the decision is made.
(t) trade and other payables
Trade and other payables represent liabilities for goods and services provided to the Group prior to the end of financial year, which are unpaid. These amounts are unsecured and are usually paid within 30 days of recognition.
(u) Borrowings
Borrowings are initially recognised at fair value, net of transaction costs incurred. Borrowings are subsequently measured at amortised cost. The effective interest rate is the rate that exactly discounts estimated future cash payments or receipts through the expected life of the financial instrument.
Borrowings are classified as current liabilities unless the Group has an unconditional right to defer settlement of the liability for at least 12 months after the balance sheet date.
Stanwell Corporation Limited operates a debt-offset facility with Queensland Treasury Corporation as part of its debt management approach. This is a legally enforceable right to offset and it is anticipated that the assets and liabilities will be settled on a net basis.
(v) Borrowing costs
Borrowing costs are expensed as incurred unless they relate to qualifying assets. Qualifying assets are assets which generally take more than 12 months to get ready for their intended use or sale.
The capitalisation rate used to determine the amount of borrowing costs to be capitalised is the weighted average interest rate applicable to the entity’s outstanding borrowings.
(w) provisions
A provision is recognised when there is a legal, equitable or constructive obligation as a result of a past event and it is probable that a reliably estimated future sacrifice of economic benefits will be required to settle the obligation, the timing or amount of which is uncertain.
If the effect is material, a provision is determined by discounting the expected future cash flows required to settle the obligation at a pre-tax rate that reflects current market assessments of the time value of money and the risks specific to the liability. When discounting is used, the increase in the provision due to the passage of time is recognised as a borrowing cost.
noteS to tHe FInAncIAl StAtementS 30 june 2011

70 STanwell annual RepoRT 2011
1 SummARY oF SIgnIFIcAnt AccountIng polIcIeS (contInued)
(w) provisions (continued)
When some or all of the economic benefits required to settle a provision are expected to be recovered from a third party, the recovery receivable is recognised as an asset when it is virtually certain that the recovery will be received and is measured on a basis consistent with the measurement of the related provision. In the statement of comprehensive income, the expense recognised in respect of a provision is presented net of the recovery. In the balance sheet, the provision is recognised net of the recovery receivable only when the entity:
• has a legally recognised right to set-off the recovery receivable and the provision; and
• intends to settle on a net basis or to realise the asset and settle the provision simultaneously.
Dividends
A provision for dividends payable is recognised in the reporting period in which the dividends are declared, for the entire undistributed amount, regardless of the extent to which they will be paid in cash.
Restoration
Provisions for restoration costs are made for the remediation of soil, groundwater and untreated waste as soon as a legal, equitable and/or constructive obligation as a result of a past event is identified.
Rehabilitation and decommissioning
Provisions for rehabilitation and decommissioning costs are recognised for dismantling and removal of assets and site restoration costs where there is a legal, equitable and/or constructive obligation which arises as a result of the original construction of the asset.
Onerous contracts
A provision for onerous contracts is recognised when the expected benefits to be derived from a contract are lower
than the unavoidable costs of meeting the obligations under the contract.
(x) employee benefits
Wages and salaries
Liabilities for employee benefits in relation to wages and salaries resulting from employees’ service provided to reporting date are calculated at undiscounted amounts based on remuneration wage and salary rates that are expected to be paid as at each reporting date, including related on-costs.
Annual leave and long service leave
The annual leave accrual and long service leave provision are measured as the present value of expected future payments to be made in respect of services provided by employees up to the reporting date.
The annual leave accrual and long service provision are calculated using expected future increases in wage and salary levels, including related on-costs and experience of employee departures and periods of service. Future payments not expected to be settled within 12 months are discounted using market yields at the reporting date on national government bonds with terms to maturity and currency that match, as closely as possible, the estimated future cash outflows.
Retirement benefit obligations
The Group contributes on behalf of its employees to a number of defined contribution plans as well as to the industry multiple employer superannuation scheme, managed by Energy Super (previously known as the Electricity Supply Industry Fund (QLD) (ESI Super)), which consists of a defined benefit plan and a defined contribution plan. The defined benefit plan provides lump sum benefits based on years of service and final average salary. The defined contribution plan receives fixed contributions from the entity and the entity’s legal or constructive obligation is limited to these contributions. New employees are only entitled to join the defined contribution plan.
A liability or asset in respect of defined benefit plans is recognised in the balance sheet, and it is measured as the present value of the defined benefit obligation at the reporting date less the fair value of the plan’s assets at that date. The present value of the defined benefit obligation is based on expected future payments which arise from membership of the plan to the reporting date, calculated annually by an independent actuary using the projected unit credit method. Consideration is given to expected future wage and salary levels, experience of employee departures and periods of service.
Expected future payments are discounted using market yields at the reporting date on national government bonds with terms to maturity and currency that match, as closely as possible, the estimated future cash outflows.
Gains and losses arising from changes in actuarial estimates are recognised directly in equity.
Past service costs are recognised immediately in the statement of comprehensive income, unless the changes to the plan are conditional on the employees remaining in service for a specified period of time (the vesting period). In this case, the past service costs are amortised on a straight-line basis over the vesting period.
Future taxes, such as taxes on investment income and employer contributions, are taken into account in the actuarial assumptions used to determine the relevant components of the employer’s defined benefit liability or asset.
Contributions to the defined contribution plan are recognised as an expense as they become payable. Prepaid contributions are recognised as an asset to the extent that a cash refund or a reduction in the future payments is available.
Further information is set out in note 20.
noteS to tHe FInAncIAl StAtementS 30 june 2011

STanwell annual RepoRT 2011 71
1 SummARY oF SIgnIFIcAnt AccountIng polIcIeS (contInued)
(y) Financial guarantee contracts
Financial guarantee contracts are recognised as a financial liability at the time the guarantee is issued. The liability is initially measured at fair value, which is determined as the present value of the amount that would be payable to a third party for assuming the obligation, and subsequently at the higher of the amount of the obligation under the contract, as determined under AASB 137 Provisions, Contingent Liabilities and Contingent Assets and the amount initially recognised less cumulative amortisation, where appropriate.
(z) goods and Services tax
Revenues, expenses and assets are recognised net of the amount of Goods and Services Tax (GST), unless the GST incurred is not recoverable from the Australian Taxation Office (ATO). In these circumstances, the GST is recognised as part of the cost of acquisition of the asset or as part of the expense.
Receivables and payables are stated inclusive of the amount of GST receivable or payable. The net amount of GST recoverable from, or payable to, the ATO is included as a current asset or liability in the balance sheet.
Cash flows are presented on a gross basis. The GST components of cash flows arising from investing and financing activities which are recoverable from, or payable to the ATO, are presented as operating cash flows.
(aa) new accounting standards and interpretations
Certain new accounting standards and interpretations have been published that are not mandatory for 30 June 2011 reporting periods. The Group’s and the parent entity’s assessment of the impact of these new standards and interpretations is set out below.
(i) AASB 9 Financial Instruments, AASB 2009‑11 Amendments to Australian Accounting Standards arising from AASB 9 and AASB 2010‑7 Amendments to Australian Accounting Standards arising from AASB 9 (December 2010) (effective from 1 January 2013)
In December 2009 the AASB issued AASB 9 Financial Instruments which is part of phase one of the comprehensive project to replace AASB 139 Financial Instruments: Recognition and Measurement. It addresses the classification and measurement of financial assets and is likely to affect the Group’s accounting for its financial assets. The standard contains two primary measurement categories for financial assets: amortised cost and fair value. The standard eliminates the existing AASB 139 categories of held to maturity, available for sale and loans and receivables. The standard is not applicable until 1 January 2013 and the Group is yet to assess its full impact. However, initial indications are that it will affect the Group’s accounting for available for sale assets which will be reclassified as fair value assets under AASB 9. Any future movements on the valuation of these assets would be recognised as other comprehensive income instead of being recognised through the profit and loss.
(ii) Revised AASB 124 Related Party Disclosures and AASB 2009‑12 Amendments to Australian Accounting Standards (effective from 1 January 2011)
In December 2009 the AASB issued a revised AASB 124 Related Party Disclosures. It is effective for accounting periods beginning on or after 1 January 2011 and must be applied retrospectively. The amendment removes the requirement for government-related entities to disclose details of all transactions with the government and other government-related entities and clarifies and simplifies the definition of a related party. The Group will apply the amended standard from 1 July 2011. It is expected that the Group’s and Company’s related party disclosures will be reduced.
(iii) AASB 1053 Application of Tiers of Australian Accounting Standards and AASB 2010‑2 Amendments to Australian Accounting Standards arising from Reduced Disclosure Requirements (effective from 1 July 2013)
On 30 June 2010 the AASB officially introduced a revised differential reporting framework in Australia. It is effective for periods beginning on or after 1 July 2013. Under this framework, a two-tier differential reporting regime applies to all entities that prepare general purpose financial statements. Stanwell Corporation Limited is State Government owned and is therefore not eligible to adopt the new Australian Accounting Standards – Reduced Disclosure Requirements. The two standards have no impact on the financial statements of the Group.
(iv) AASB 2010‑5 Amendments to Australian Accounting Standards (effective from 1 January 2011)
In October 2010, the AASB made numerous editorial amendments to a range of Australian Accounting Standards and Interpretations, including amendments to reflect changes made to the text of IFRSs by the IASB. The standard is applicable to annual reporting periods beginning on or after 1 January 2011. The changes to the standards will have no impact on the financial statements of the Group.
(v) AASB 2010‑6 Amendments to Australian Accounting Standards – Disclosures on Transfers of Financial Assets (effective for annual reporting periods beginning on or after 1 July 2011)
In November 2010, the AASB amended disclosure requirements in respect of risk exposures arising from transferred financial assets. The amendments will affect particular entities that sell, factor, securities, lend or otherwise transfer financial assets to other parties. They are not expected to have any significant impact on the Group’s disclosures. The Group intends to apply the amendment from 1 July 2011.
noteS to tHe FInAncIAl StAtementS 30 june 2011

72 STanwell annual RepoRT 2011
noteS to tHe FInAncIAl StAtementS 30 june 2011
1 SummARY oF SIgnIFIcAnt AccountIng polIcIeS (contInued)
(ab) Rounding of amounts
The Company is of a kind referred to in Class order 98/100, issued by the Australian Securities and Investments Commission, relating to the rounding of amounts in the financial statements. Amounts in the financial statements have been rounded off in accordance with that Class Order to the nearest thousand dollars, or in certain cases, the nearest dollar.
(ac) parent entity disclosures
The Group has elected to adopt Class Order 10/654 allowing the disclosure of parent entity financial statements and notes thereto. The class order provides relief from the requirement preventing disclosure of single entity financial statements and disclosures of specific parent entity financial information under regulation 2M.3.01 of the Corporations Regulations.
2 FInAncIAl RISk mAnAgement
The Group’s activities expose it to a variety of financial risks: market risk (including interest rate risk and electricity commodity price risk), credit risk, liquidity risk and foreign exchange risk. The Group’s overall risk management program focuses mainly on the unpredictability of the electricity and financial markets and seeks to minimise potential adverse effects on the financial performance of the Group. The Group uses derivative financial instruments to hedge certain risk exposures. The Group uses different methods to measure different types of risk to which it is exposed. These methods include sensitivity analysis in the case of interest rate and electricity commodity price risks, a counterparty credit ratings analysis for credit risk and a contracts aging analysis for liquidity risk.
Financial risk management is carried out by the Energy and Financial Risk Management group under policies approved by the Board. The Trading group identifies, evaluates and hedges electricity market risks. The Board provides written principles for overall risk management, as well as policies covering specific areas, such as mitigating interest rate and credit risk, use of derivative financial instruments and investment of excess liquidity.
The Group and the parent entity hold the following financial instruments:
conSolIdAted pARent entItY
2011 $’000
2010 $’000
2011 $’000
2010 $’000
Financial assets
Cash and cash equivalents 419,334 212,034 418,706 212,031
Trade and other receivables 66,560 94,327 75,998 94,326Derivative financial instruments 85,674 167,199 85,674 167,199Available-for-sale financial assets 9,067 18,757 9,067 18,757Other financial assets – – – 76,726Other non-current assets 2,500 7,848 2,500 7,848
583,135 500,165 591,945 576,887
Financial liabilities
Trade and other payables 48,535 68,392 48,535 68,392
Borrowings 637,146 637,146 637,146 637,146Derivative financial instruments 31,929 30,653 31,929 30,653Other current liabilities 21 26,614 21 26,614Other non-current liabilities 2,500 2,500 2,500 2,500
720,131 765,305 720,131 765,305

STanwell annual RepoRT 2011 73
noteS to tHe FInAncIAl StAtementS 30 june 2011
2 FInAncIAl RISk mAnAgement (contInued)
(a) market risk
Foreign exchange risk
Foreign exchange risk arises when future transactions are denominated in non-Australian currency or where future transaction values are calculated by reference to a non-Australian currency.
Commodity price risk
The Group and parent entity are exposed to electricity price movements in the National Electricity Market. To manage its electricity commodity price risk the Group and parent entity have entered into a number of electricity derivatives (including over the counter swaps, futures, cap and option contracts) in accordance with the Board approved risk management
The Group and parent entity’s risk management policy is to hedge a proportion of anticipated transactions that are denominated in or calculated by reference to a foreign currency. Currency derivatives such as forward currency contracts and currency options are used to manage foreign exchange risk. The Group and the parent entity designate currency derivatives as cash flow hedges where
policy. For the majority of these contracts the Group and parent entity receive from counterparties a fixed price per megawatt hour and in return pay the actual observed pool price. These contracts assist the Group and parent entity to provide certainty in relation to revenue received.
Electricity price risk is measured weekly through the review of the Group and parent entity’s mark to market exposure of the net
they qualify for hedge accounting and measures them at fair value.
The carrying amounts of the Group and parent entity’s financial assets and liabilities denominated in foreign currencies are set out below:
derivative asset and liability position. The Group and the parent entity are exposed to environmental certificate price movements through their requirement to comply with various regulatory environmental schemes as part of their normal business operations. To manage their environmental certificate price risk the Group and the parent entity buy and sell these certificates in both the spot and forward markets.
2011 Aud
$’000
2010 Aud
$’000
Cash and cash equivalents- United States Dollars (USD) 395 40- Great British Pounds (GBP) 613 96- Euros (EUR) 23 46- Japanese Yen (JPY) – 2,613
1,031 2,795
Forward exchange contracts- buy foreign currency (USD cash flow hedges) (48) (12)- buy foreign currency (USD held for trading*) – 57- buy foreign currency (GBP cash flow hedges) – 64- buy foreign currency (Euro cash flow hedges) (283) (305)- buy foreign currency (JPY cash flow hedges) (31) 1,958- buy foreign currency (JPY held for trading*) (245) 1,326- sell foreign currency (JPY held for trading*) 159 (342)
(448) 2,746
Currency options- buy foreign currency (USD held for trading*) – 238- sell foreign currency (USD held for trading*) 8,968 786
8,968 1,024 * Contracts that do not meet the requirements of hedge accounting

74 STanwell annual RepoRT 2011
noteS to tHe FInAncIAl StAtementS 30 june 2011
-20% / -10% +20% / +10%
carrying amount $’000
profit $’000
other equity $’000
profit $’000
other equity $’000
Foreign exchange risk (-/+20%)
uSd2011 8,276 (5,940) 156 12,587 (104)2010 1,109 876 238 6,305 (159)
gBp2011 613 153 – (102) – 2010 160 24 338 (16) (225)
euro2011 (260) 6 176 (4) (117)2010 (259) 11 256 (8) (171)
jpY2011 (117) 703 575 (468) (383)2010 5,555 776 3,578 (518) (2,385)
commodity price risk (electricity and environmental products)2011 (-/+20%) 45,225 7,236 75,662 (7,692) (76,172)2010 (-/+10%) 132,833 1,326 56,021 (1,391) (55,984)
2 FInAncIAl RISk mAnAgement (contInued)
(a) market risk (continued)
Sensitivity analysis
The following table summarises the sensitivity of the Group and parent entity’s financial assets and financial liabilities to foreign exchange risk and commodity price risk. The analysis is based on similar information to that which would be provided to management and depicts the impact on the Group and parent
entity’s financial position should there be a 20% movement in the underlying foreign exchange risk variable and a 20% (2010: 10%) movement in the underlying commodity price risk variable. The analysis assumes that the movement occurs at the beginning of a year and that the rate would remain unchanged over the next financial year.
Foreign exchange risk
The sensitivity in the mark to market of the electricity derivative portfolio
at balance date was investigated by observing the price relative impact of annualised volatility in the forward curve over a selected period under observable market conditions. The analysis assumes an upward movement of 20% (2010: 10%) and a downward movement of 20% (2010: 10%), which reflects the market sensitivity of positions held by the Group and parent entity at balance date.

STanwell annual RepoRT 2011 75
noteS to tHe FInAncIAl StAtementS 30 june 2011
30 june 2011 30 june 2010
Weighted average interest rate
%Balance
$’000
Weighted average interest rate
%Balance
$’000
conSolIdAted
Financial assetsCash at bank and in hand 3.66% 666 3.65% 2,624Deposits at call - Queensland Treasury Corporation 5.58% 417,637 5.28% 206,615
Held for sale - cash and cash equivalents – % – 4.86% 11,881
418,303 221,120
Financial liabilitiesBorrowings 8.30% 637,146 7.05% 637,146
Net exposure to cash flow interest rate risk (218,843) (416,026)
pARent entItY
Financial assetsCash at bank and in hand 3.00% 42 3.65% 2,621Deposits at call - Queensland Treasury Corporation 5.58% 417,634 5.28% 206,615
417,676 209,236
Financial liabilitiesBorrowings 8.30% 637,146 7.05% 637,146
Net exposure to cash flow interest rate risk (219,470) (427,910)
The Group is exposed to changes in interest rates via its cash and cash equivalents and its borrowings. Group financial policies set the parameters for the management of interest rate risk and detailed risk management plans are approved at least annually by the Board.
The Group’s financier, Queensland Treasury Corporation (QTC), provides loan facility arrangements to assist in managing this risk. The Group specifies to QTC the overall target term structure of its debt portfolio. The term structure of the debt is set so as to reduce exposure to adverse interest rate movements, match
2 FInAncIAl RISk mAnAgement (contInued)
(a) market risk (continued)
underlying business cash flows and reduce the overall cost of funding. The Group’s pricing for the debt is set based on QTC’s financing cost to issue its own debt instruments of equivalent terms increased for a competitive neutrality fee, and QTC’s active management of their debt portfolio.
The following summarises the sensitivity of the Group and parent entity to cash flow interest rate risk.
At 30 June 2011 if interest rates applicable to these financial assets changed by 100 basis points from the reporting date with all other variables held constant, profit or loss in the subsequent year would be:
Cash flow interest rate risk
The Group and parent entity are exposed to interest rate risk through its entities’ loan facilities and deposits in interest bearing and debt offset accounts.
• Group $4,184,000 (2010: $2,239,000) higher or lower
• Parent Entity $4,178,000 (2010: $2,120,000) higher or lower
At 30 June 2011 if interest rates applicable to these financial liabilities changed by 100 basis points from the reporting date with all other variables held constant, profit or loss in the subsequent year would be:
• Group $1,070,000 (2010: $609,300) higher or lower
• Parent Entity $1,070,000 (2010: $609,300) higher or lower
As at the reporting date, the Group and the parent entity had the following mix of financial assets and liabilities exposed to variable interest rates:

76 STanwell annual RepoRT 2011
noteS to tHe FInAncIAl StAtementS 30 june 2011
2 FInAncIAl RISk mAnAgement (contInued)
(b) credit risk
Credit risk exposure refers to the situation where the Group may incur financial loss as a result of another party to a financial instrument failing to fulfil their obligation.
The Group utilises industry practice credit review processes and security instruments to manage its credit risks. The Group’s credit risk exposure is managed by trading with electricity industry counterparties under International Swaps and Derivatives Association (ISDA) agreements. The Group has a strict credit policy for all customers trading on credit terms. It has a range of measures for determining
counterparty credit worthiness relying on a risk adjusted assessment principally based on the counterparty’s credit rating determined by a recognised rating agency. Where appropriate, the Group also obtains acceptable credit support. Receivable balances are monitored on an ongoing basis with the result that the entity’s exposure to bad debts is not significant.
Concentrations of credit risk exist for groups of counterparties when they have similar economic characteristics that would cause their ability to meet contractual obligations to be similarly affected by changes in economic or other conditions. A concentration of credit risk for derivative instruments exists predominantly in the Queensland electricity market.
The credit exposure of derivative contracts is calculated utilising the value-at-risk methodology which takes into account the current market value, duration of exposure, diversification of the counterparty’s market operations, likelihood of default of the counterparty, the expected loss given default and the volatility of market prices.
The credit quality of financial assets that are neither past due nor impaired can be assessed by reference to external credit ratings (if available) or to historical information about counterparty default rates, as outlined in the table below. The carrying amount of financial assets recorded in the financial statements, net of allowances for losses, represents the Group’s maximum exposure to credit risk.
conSolIdAted pARent entItY
2011 $’000
2010 $’000
2011 $’000
2010 $’000
trade receivables
Counterparties with external credit rating (Standard & Poor’s)AA+ to AA- 4,070 3,628 4,070 3,628BBB+ to BBB- 5,423 21,715 5,423 21,715
9,493 25,343 9,493 25,343
Counterparties without external credit rating * 43,362 54,483 43,362 54,483
total trade receivables 52,855 79,826 52,855 79,826
cash at bank and short-term bank deposits
AA+ 418,787 211,375 418,784 211,372
AA 670 – 46 – Other (non-rated) (123) 659 (124) 659
419,334 212,034 418,706 212,031
other non-current assets
BBB – 5,348 – 5,348
Counterparties without external credit ratings 2,500 2,500 2,500 2,500
2,500 7,848 2,500 7,848
derivative financial assets
AA+ to AA- 33,773 89,200 33,773 89,200
BBB+ to BBB- 11,534 36,892 11,534 36,892Counterparties without external credit ratings** 40,367 41,107 40,367 41,107
85,674 167,199 85,674 167,199 * Existing customers (more than 6 months) with no defaults in the past.
** These counterparties include Government Owned Corporations and counterparties for whom credit support has been obtained.

STanwell annual RepoRT 2011 77
noteS to tHe FInAncIAl StAtementS 30 june 2011
2 FInAncIAl RISk mAnAgement (contInued)
(c) liquidity risk
The Group and parent entity is subject to cash flow volatility and prefers to minimise the risk by maintaining a highly contracted profile. To the extent that volatility still arises, the Group and parent
The overdraft facility is with the Australia and New Zealand Banking Group Ltd and has an approved limit of $1,000,000. The working capital facility is with Queensland Treasury Corporation and has an approved limit of $10,000,000. These facilities remained fully undrawn at 30 June 2011 and are available for use in the next reporting period.
entity manages liquidity risk by maintaining sufficient cash and undrawn facilities to meet any unexpected volatility. The Group and parent entity uses stress testing to measure extreme cash flow risk. The Group and parent entity has access to QTC funds as required once shareholding Ministers’ approval for the borrowing purpose has been received, subject to meeting credit
The Group is wholly owned by the State of Queensland and has been subject to review by an international credit rating agency. The public long term rating of the Group is AA+.
The tables below analyse the Group’s and the parent entity’s financial liabilities, net and gross settled financial instruments,
criteria set by QTC. The QTC borrowings have no fixed repayment date however the facility is assessed by QTC annually.
The Group and parent entity had access to the following undrawn borrowing facilities at the end of the reporting period:
into relevant maturity groupings based on the remaining period at the reporting date to the contractual maturity date. The amounts disclosed in the tables are the contractual undiscounted cash flows and include both interest and principal cash flows.
conSolIdAted pARent entItY
2011 $’000
2010 $’000
2011 $’000
2010 $’000
- Expiring within one year (bank overdraft and working capital facility) 11,000 11,000 11,000 11,000
- Expiring beyond one year (bank loans) 83,105 83,105 83,105 83,105
94,105 94,105 94,105 94,105
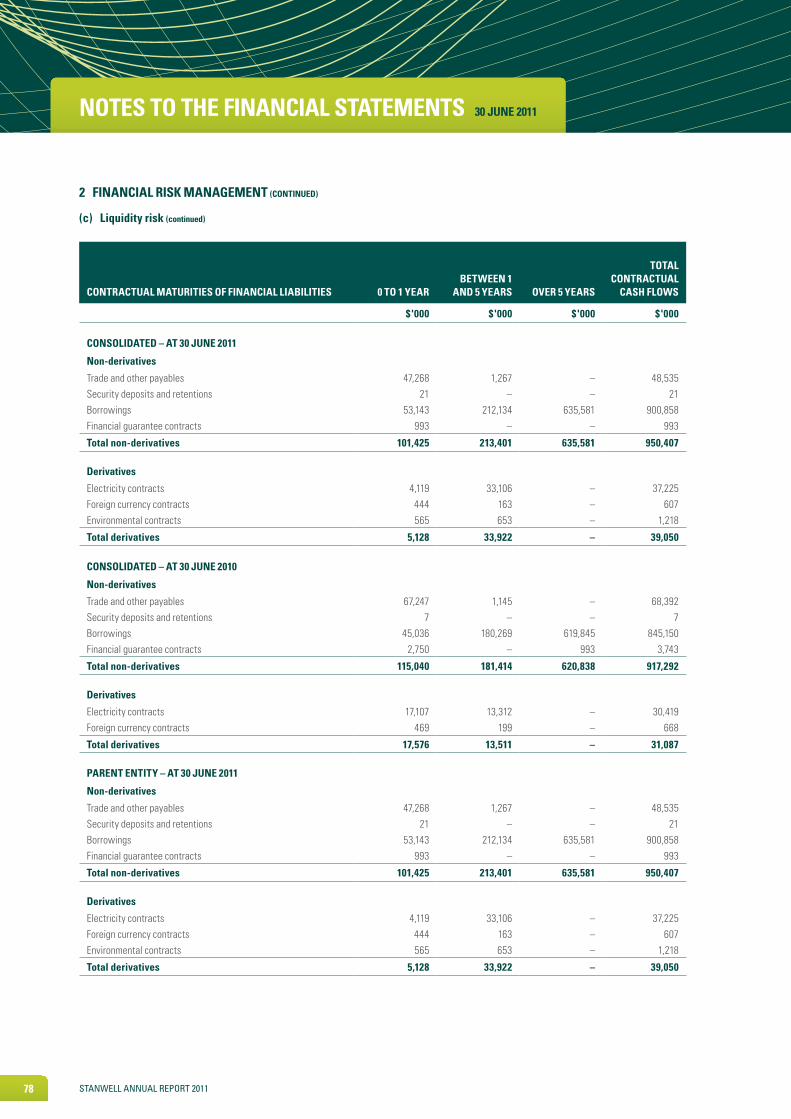
78 STanwell annual RepoRT 2011
noteS to tHe FInAncIAl StAtementS 30 june 2011
contRActuAl mAtuRItIeS oF FInAncIAl lIABIlItIeS 0 to 1 YeARBetWeen 1
And 5 YeARS oveR 5 YeARS
totAl contRActuAl
cASH FloWS
$'000 $'000 $'000 $'000
conSolIdAted – At 30 june 2011
non-derivatives
Trade and other payables 47,268 1,267 – 48,535Security deposits and retentions 21 – – 21Borrowings 53,143 212,134 635,581 900,858Financial guarantee contracts 993 – – 993
total non-derivatives 101,425 213,401 635,581 950,407
derivatives
Electricity contracts 4,119 33,106 – 37,225Foreign currency contracts 444 163 – 607Environmental contracts 565 653 – 1,218
total derivatives 5,128 33,922 – 39,050
conSolIdAted – At 30 june 2010
non-derivatives
Trade and other payables 67,247 1,145 – 68,392Security deposits and retentions 7 – – 7Borrowings 45,036 180,269 619,845 845,150Financial guarantee contracts 2,750 – 993 3,743
total non-derivatives 115,040 181,414 620,838 917,292
derivatives
Electricity contracts 17,107 13,312 – 30,419Foreign currency contracts 469 199 – 668
total derivatives 17,576 13,511 – 31,087
pARent entItY – At 30 june 2011
non-derivatives
Trade and other payables 47,268 1,267 – 48,535Security deposits and retentions 21 – – 21Borrowings 53,143 212,134 635,581 900,858Financial guarantee contracts 993 – – 993
total non-derivatives 101,425 213,401 635,581 950,407
derivatives
Electricity contracts 4,119 33,106 – 37,225Foreign currency contracts 444 163 – 607Environmental contracts 565 653 – 1,218
total derivatives 5,128 33,922 – 39,050
2 FInAncIAl RISk mAnAgement (contInued)
(c) liquidity risk (continued)

STanwell annual RepoRT 2011 79
noteS to tHe FInAncIAl StAtementS 30 june 2011
contRActuAl mAtuRItIeS oF FInAncIAl lIABIlItIeS 0 to 1 YeARBetWeen 1
And 5 YeARS oveR 5 YeARS
totAl contRActuAl
cASH FloWS
$'000 $'000 $'000 $'000
pARent entItY – At 30 june 2010
non-derivatives
Trade and other payables 67,247 1,145 – 68,392Security deposits and retentions 7 – – 7Borrowings 45,036 180,269 619,845 845,150Financial guarantee contracts 2,750 – 993 3,743
total non-derivatives 115,040 181,414 620,838 917,292
derivatives
Electricity contracts 17,107 13,312 – 30,419Foreign currency contracts 469 199 – 668
total derivatives 17,576 13,511 – 31,087
The tables below analyse the Group’s and the parent entity’s financial assets which are held for managing liquidity risk, into relevant maturity groupings based on the remaining period at the reporting date to the contractual maturity date. The amounts disclosed in the tables are the contractual undiscounted cash flows.
contRActuAl mAtuRItIeS oF FInAncIAl ASSetS 0 to 1 YeARBetWeen 1
And 5 YeARS oveR 5 YeARS
totAl contRActuAl
cASH FloWS
$'000 $'000 $'000 $'000
conSolIdAted – At 30 june 2011
Electricity contracts 2,755 87,497 – 90,252Foreign currency contracts 159 – – 159Environmental contracts 959 69 – 1,028
3,873 87,566 – 91,439
conSolIdAted – At 30 june 2010
Electricity contracts 105,411 64,378 – 169,789Foreign currency contracts 1,810 1,604 – 3,414
107,221 65,982 – 173,203
pARent entItY – At 30 june 2011
Electricity contracts 2,755 87,497 – 90,252Foreign currency contracts 159 – – 159Environmental contracts 959 69 – 1,028
3,873 87,566 – 91,439
pARent entItY – At 30 june 2010
Electricity contracts 105,411 64,378 – 169,789Foreign currency contracts 1,810 1,604 – 3,414
107,221 65,982 – 173,203
2 FInAncIAl RISk mAnAgement (contInued)
(c) liquidity risk (continued)

80 STanwell annual RepoRT 2011
noteS to tHe FInAncIAl StAtementS 30 june 2011
2 FInAncIAl RISk mAnAgement (contInued)
(d) Fair value measurements
The Group has adopted the amendments to AASB 7 Financial Instruments: Disclosures which requires disclosures of fair value measurements by level of the following fair value measurement hierarchy.
(a) Level 1 – quoted prices (unadjusted) in active markets for identical assets or liabilities;
(b) Level 2 – inputs other than quoted prices included within Level 1 that are observable for the asset or liability, either directly (as prices) or indirectly (derived from prices); and
(c) Level 3 – inputs for the asset or liability that are not based on observable market data (unobservable inputs).
The following tables presents the Group’s and the parent entity’s assets and liabilities measured and recognised at fair value.
level 1 level 2 level 3 totAl
$'000 $'000 $'000 $'000
gRoup – At 30 june 2011
Assets
Financial assets at fair value through profit or loss - trading derivatives 3,395 10,814 3,340 17,549Derivatives used for hedging – 30,186 37,939 68,125Available-for-sale financial assets- other – 9,067 – 9,067
total assets 3,395 50,067 41,279 94,741
liabilities
Financial liabilities at fair value through profit or loss – trading derivatives 9,991 3,673 2,366 16,030Derivatives used for hedging – 9,724 6,175 15,899
total liabilities 9,991 13,397 8,541 31,929
gRoup – At 30 june 2010
Assets
Financial assets at fair value through profit or loss - trading derivatives 4,535 21,403 – 25,938Derivatives used for hedging – 141,261 – 141,261Available-for-sale financial assets- other – 18,757 – 18,757
total assets 4,535 181,421 – 185,956
liabilities
Financial liabilities at fair value through profit or loss – trading derivatives 1,747 28,330 – 30,077Derivatives used for hedging – 576 – 576
total liabilities 1,747 28,906 – 30,653
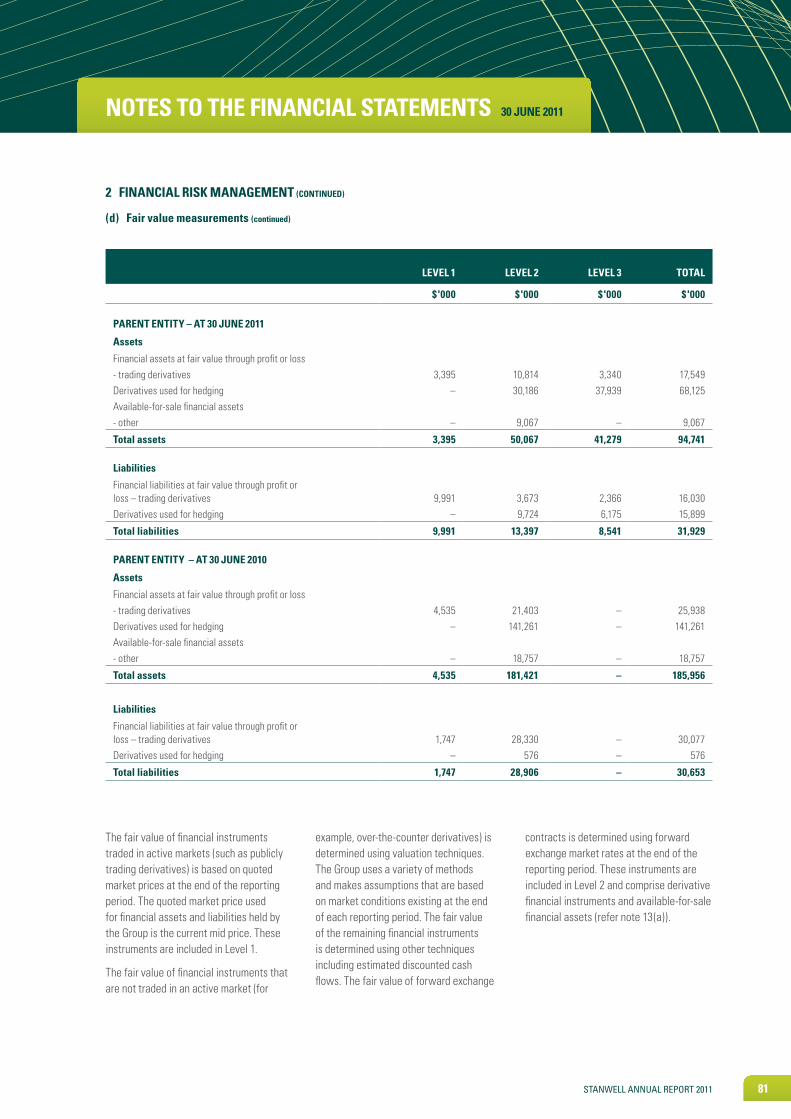
STanwell annual RepoRT 2011 81
noteS to tHe FInAncIAl StAtementS 30 june 2011
2 FInAncIAl RISk mAnAgement (contInued)
(d) Fair value measurements (continued)
level 1 level 2 level 3 totAl
$'000 $'000 $'000 $'000
pARent entItY – At 30 june 2011
Assets
Financial assets at fair value through profit or loss - trading derivatives 3,395 10,814 3,340 17,549Derivatives used for hedging – 30,186 37,939 68,125Available-for-sale financial assets- other – 9,067 – 9,067
total assets 3,395 50,067 41,279 94,741
liabilities
Financial liabilities at fair value through profit or loss – trading derivatives 9,991 3,673 2,366 16,030Derivatives used for hedging – 9,724 6,175 15,899
total liabilities 9,991 13,397 8,541 31,929
pARent entItY – At 30 june 2010
Assets
Financial assets at fair value through profit or loss - trading derivatives 4,535 21,403 – 25,938Derivatives used for hedging – 141,261 – 141,261Available-for-sale financial assets- other – 18,757 – 18,757
total assets 4,535 181,421 – 185,956
liabilities
Financial liabilities at fair value through profit or loss – trading derivatives 1,747 28,330 – 30,077Derivatives used for hedging – 576 – 576
total liabilities 1,747 28,906 – 30,653
The fair value of financial instruments traded in active markets (such as publicly trading derivatives) is based on quoted market prices at the end of the reporting period. The quoted market price used for financial assets and liabilities held by the Group is the current mid price. These instruments are included in Level 1.
The fair value of financial instruments that are not traded in an active market (for
example, over-the-counter derivatives) is determined using valuation techniques. The Group uses a variety of methods and makes assumptions that are based on market conditions existing at the end of each reporting period. The fair value of the remaining financial instruments is determined using other techniques including estimated discounted cash flows. The fair value of forward exchange
contracts is determined using forward exchange market rates at the end of the reporting period. These instruments are included in Level 2 and comprise derivative financial instruments and available-for-sale financial assets (refer note 13(a)).

82 STanwell annual RepoRT 2011
noteS to tHe FInAncIAl StAtementS 30 june 2011
2 FInAncIAl RISk mAnAgement (contInued)
(d) Fair value measurements (continued)
As at 30 June 2011 the Group and the parent entity had certain derivative financial instruments classified as Level 3. No instruments were classified as Level 3 for the year ended 30 June 2010.
The following tables present the changes in Level 3 instruments for the year ended 30 June 2011:
tRAdIng deRIvAtIveS At FAIR vAlue tHRougH
pRoFIt oR loSSdeRIvAtIveS uSed
FoR HedgIng totAl
$'000 $'000 $'000
conSolIdAted And pARent entItY - At 30 june 2011
Opening balance – – – Transfer into Level 3 974 31,764 32,738
closing balance 974 31,764 32,738
Although the Group and the parent entity believes that its estimates of fair value are appropriate, the use of different methodologies or assumptions could lead to different measurements of fair value. For fair value measurements in Levels 2 and 3 of the fair value hierarchy, changing one or more of the derived or unobservable inputs used could lead to a reasonably alternative fair value being reached. For fair value measurements in Level 3 of the fair value hierarchy, changing one or more of the unobservable inputs used, to reasonably possible alternative assumptions would have the following effects:
eFFect on pRoFIt oR loSS eFFect on HedgIng ReSeRve
Favourable $’000
(unfavourable) $’000
Favourable $’000
(unfavourable) $’000
conSolIdAted And pARent entItY
Derivative financial assets 1,906 (1,908) 13,621 (13,623)Derivative financial liabilities 526 (526) – –
total 2,432 (2,434) 13,621 (13,623)
The carrying amount of trade receivables and payables are assumed to approximate their fair values due to their short-term nature. The fair value of financial liabilities for disclosure purposes is estimated by discounting the future contractual cash flows at the current market interest rate that is available to the Group for similar financial instruments. The fair value of current borrowings approximates the carrying amount, as the impact of discounting is not significant.

STanwell annual RepoRT 2011 83
noteS to tHe FInAncIAl StAtementS 30 june 2011
3 cRItIcAl AccountIng eStImAteS And judgementS
Estimates and judgements are continually evaluated and are based on historical experience and other factors, including expectations of future events that may have a financial impact on the Group and that are believed to be reasonable under the circumstances.
(a) critical accounting estimates and assumptions
The Group makes estimates and assumptions concerning the future. The resulting accounting estimates will, by definition, seldom equal the related actual results. The estimates and assumptions that have a significant risk of causing material adjustment to the carrying amounts of assets and liabilities within the next financial year are discussed below.
Carbon pricing mechanism
On 10 July 2011 the Federal Government announced a proposal, ‘Securing a Clean Energy Future – the Australian Government’s Climate Change Plan’, to implement a two-stage carbon pricing mechanism for the Australian economy. The proposed carbon price plan will effectively embed a carbon price into the Australian economy.
Commencing on 1 July 2012, the proposal sets a fixed price path for the first three years ($23 per tonne of CO2-equivalent emissions adjusted in real terms by 2.5 per cent per annum) before moving to a flexible price mechanism from 1 July 2015. It proposes a framework for setting a cap on greenhouse gas emissions by capping the number of carbon units available once the flexible price period commences, which can be adjusted over time to ensure that the government’s reduction targets are met. The commencement of the scheme is subject to the ability to negotiate agreement with a majority in both Houses of Parliament to pass legislation during the 2011 calendar year.
In addition to the carbon price mechanism, the Federal Government proposal includes
strategies on renewable energy, energy efficiency and action on land to manage climate change. The Federal Government’s planned climate change strategies will have significant impact on thermal generation asset portfolio cost base and market share, depending on the projected impact of these strategies and other macro economic assumptions.
The carbon pricing framework has been agreed by government and Greens members of the government’s Multi-Party Climate Change Committee (MPCCC). The other members of the MPCCC, Mr Tony Windsor and Mr Robert Oakeshott, have agreed that the proposal should be released for community consultation. The Federal Opposition has and continues to oppose the introduction of the carbon pricing framework. Accordingly, there is still some uncertainty as to whether the carbon pricing mechanism will be implemented in accordance with the government’s current framework.
On 28 July 2011, the Australian Government released exposure draft legislation, including consequential and associated tax measures, in relation to its recently announced climate change plan. Legislation is expected to be tabled in Parliament during the September 2011 sitting following a period of consultation which concluded on 22 August 2011.
Notwithstanding the current lack of enacted legislation for a carbon pricing mechanism in Australia at the date of this financial report, the introduction of a price on carbon is becoming increasingly more likely. Existing legislation requires an increasing number of entities to monitor their carbon emissions and the uncertainty surrounding a carbon price is being reflected in market transactions in industries heavily exposed to a carbon price.
The impact of the proposed carbon pricing framework on the Company’s and Group’s critical accounting estimates and judgements are set out below.
(b) critical judgements in applying the entity’s accounting policies
(i) Impairment of assets
The Group assesses impairment at the end of each reporting period by evaluating conditions specific to it that may lead to indicators of impairment of assets in accordance with note 1(i). For the purposes of assessing impairment, assets are grouped at the lowest levels for which there are separately identifiable cash flows which are largely independent of the cash inflows from other assets or groups of assets (cash-generating units). Key estimates and assumptions made in determining the recoverable amount of assets, in the absence of quoted market prices are discussed below.
Under AASB 136 Impairment of Assets (AASB 136), cash flow projections should present management’s best estimate of the range of economic conditions that will exist over the remaining useful economic life of a particular asset, provided the assumptions are reasonable and supportable.
Cash flow projections should represent management’s best estimate of a market participant’s view of the potential range of economic conditions that will exist over the remaining useful economic life of a particular asset, provided the assumptions are reasonable and supportable.
Whilst the Federal Government’s carbon pricing mechanism was released subsequent to 30 June 2011, given the AASB 136 requirements for “management’s best estimates of economic conditions”, the announcement provides further information about assumptions that existed at reporting date as the proposal to introduce a price on carbon has existed for some time. While there is still some uncertainty regarding the final form of the carbon pricing mechanism and associated legislation, management and the directors are of the view that the information available can be incorporated into the impairment models and will enable the determination of the recoverable amounts of assets in accordance with AASB 136.

84 STanwell annual RepoRT 2011
noteS to tHe FInAncIAl StAtementS 30 june 2011
3 cRItIcAl AccountIng eStImAteS And judgementS (contInued)
(b) critical judgements in applying the entity’s accounting policies (continued)
(i) Impairment of assets (continued)
The valuation of the Group’s generation asset has incorporated management’s best estimate of uncertainty regarding the introduction or otherwise of carbon pricing, by adopting a scenario-based modelling approach using various probability weightings assigned to a range of possible carbon price trajectories.
The techniques and significant assumptions applied in the valuation modelling of the Group’s generation cash-generating unit are described below:
• Valuation techniques
As noted above, the Group used a value in use approach to measure the recoverable amount of the generation assets. A discounted cash flow method was used which involves projecting cash flows and converting them into a present value equivalent through discounting using a rate of return that is commensurate with the risk associated with the assets and the time value of money. These calculations use cash flow projections based on market assumptions (pricing, dispatch and carbon), and capital expenditure programs that willing market participants might reasonably adopt. The key assumptions used in these calculations are outlined below.
• Electricity demand and wholesale electricity prices
The Group has forecast electricity demand and estimated the electricity pool price and contract premiums until the end of the generation asset lives. In arriving at its forecasts, the Group considered past experience, economic trends, impact of a potential carbon price, escalation as well as industry and market trends. The projections also took into account further
efficiencies to be gained from capital expenditure projects over the asset’s life. The 2010 Electricity Statement of Opportunity published by the Australian Energy Market Operator has been used as a reference for electricity demand and growth forecasts. The median growth forecasts have been utilised in the forward modelling.
The gas price used in the modelling reflects the impact of the Liquefied Natural Gas developments on the domestic gas market. A median gas price has been used to reflect eventual domestic gas price parity with international markets. This price will impact new entrants and existing gas-fired electricity generation capacity factors.
• Carbon price scenarios
Carbon price scenarios have been developed taking into account the Commonwealth Treasury modelling of core policy and high price scenarios which were released in July 2011 ‘Strong growth, low pollution modelling a carbon price’. Management has also developed a median carbon price scenario which takes into account the Federal Government’s announced pricing for the fixed carbon permit pricing period and then moves to a curve which reflects the uncertainty surrounding the availability and pricing of international carbon permits. This price curve reflects management’s view of the forward curve necessary to achieve the government’s emissions reduction target of five per cent by 2020. The median falls between the Federal Government’s core and high price scenarios with a bias toward the core policy scenario.
• Weighting of carbon scenarios
Given the range of variables, the inherent uncertainty in the market and the uncertainty as to the eventual impact of the proposed carbon pricing scheme, management has assigned a probability weighting to each of the valuation outcomes based on the different carbon price scenarios to arrive at a final valuation of the generation assets of the Group.
• Discount rate
The Group assumed a discount rate in order to calculate the present value of its projected cash flows. The discount rate represented a weighted average cost of capital (WACC) for comparable companies operating in similar industries as the generation assets, based on publicly available information. The WACC is an estimate of the overall required rate of return on an investment for both debt and equity owners and serves as the basis for developing an appropriate discount rate. Determination of the WACC requires separate analysis of the cost of equity and debt, and considers a risk premium based on an assessment of risks related to the projected cash flows.
Other key assumptions that are critical to this assessment include:
• Fuel and operating costs;
• Timing and quantum of capital expenditure; and
• Consumer price index and other indexations.
The valuation modelling using a value in use methodology resulted in the generation assets being impaired by $231,973,000 for the year ended 30 June 2011 ($231,973,000 reduction in property, plant and equipment).
The uncertainties of the carbon pricing mechanism may potentially significantly impact on the assumptions outlined above and as a result there is inherent uncertainty on the resulting value of generation assets. The sensitivities include the impact of changes in assumptions used for the electricity price, discount rates and probability weightings assigned to the carbon price scenarios on the impairment charge as follows:

STanwell annual RepoRT 2011 85
noteS to tHe FInAncIAl StAtementS 30 june 2011
3 cRItIcAl AccountIng eStImAteS And judgementS (contInued)
(b) critical judgements in applying the entity’s accounting policies (continued)
(i) Impairment of assets (continued)
Sensitivity of impairment charge to changes in electricity price and discount rates
$’000 +5%
$’000 -5%
Wholesale electricity price – decrease/(increase) to impairment loss 231,973 (381,808)
+1% -1%
Discount rate (pre-tax) – (increase)/decrease to impairment loss (94,054) 112,274
Impairment charge depending on weighting of carbon price curves $’000
Carbon price scenario used by management which reflects a 70% weighting to a median carbon price as outlined above
231,973
Impact of using a scenario with a higher weighting (90%) to a median carbon price 321,074
Impact of using a scenario with a lower weighting (50%) to a median carbon price 202,734
(ii) Fair value of financial instruments
The fair value of financial instruments that are not traded in an active market (for example, certain types of electricity derivatives) is determined by using valuation techniques. The Group uses its judgement to select a variety of methods and makes assumptions that are mainly based on market conditions existing at each balance sheet date.
(iii) Rehabilitation provisions
The Group has to provide for site closure and restoration in accordance with the accounting policy stated in note 1(w). This calculation requires the use of key assumptions including the timing of restoration work, legal requirements and the use of a discount rate.
(iv) Retirement benefits
Various actuarial assumptions underpin the determination of the Group’s retirement benefit obligations. These assumptions and the related carrying amounts are outlined in note 20.
(v) Long service leave provision
As discussed in note 1(x).
(vi) Estimation of useful lives of assets
The estimation of the useful lives of assets has been based on historical experience as well as manufacturers’ design life. Depreciation and amortisation rates are reviewed annually for appropriateness. Adjustments to useful life are made when considered necessary. Effective lives are included in note 1(p).
(vii) Onerous contract provision
The Group recognises an onerous contract provision relating to the Gladstone Interconnection and Power Pooling Agreement. The methodology adopted to value this provision includes a number of key assumptions including estimates of future wholesale pool prices, generation output and the appropriate discount rate for net present value purposes.
(viii) Non‑current assets and disposal group classified as held for distribution
Non-current assets and disposal groups classified as held for sale or distribution are measured at the lower of their carrying amount and fair value less costs to sell or distribute, except for deferred tax balances, assets and liabilities associated with employee benefits, financial assets and liabilities, investment property and non-current biological assets.
The fair value less costs to distribute has been determined based on discounted cash flows using the assumptions detailed in note 3(b)(i).

86 STanwell annual RepoRT 2011
noteS to tHe FInAncIAl StAtementS 30 june 2011
4 Revenue
net gain on disposal of net assets held for sale in disposal groups
(a) The sales of EDWF Holdings 1 Pty Ltd and Wind Portfolio Pty Ltd were completed on 30 June 2011. Proceeds from the disposal after deducting related selling costs were $91.0 million while the net assets disposed
of were $85.6 million. The result was a consolidated gain on disposal of $5.4 million before tax (after tax gain of $3.8 million).
(b) An interest in a mineral development licence in Queensland was sold on 1 September 2010. Proceeds from the
disposal were $285.1 million while the net book value of the licence and associated land was $14.1 million. The result was a consolidated gain on disposal of $271.0 million before tax (after tax gain of $189.7 million).
conSolIdAted pARent entItY
2011 $’000
2010 $’000
2011 $’000
2010 $’000
From operating activities
Sales of electricity 344,958 447,413 338,505 441,743
Coal revenue sharing arrangements 122,576 153,919 122,576 153,919Other revenue 68,252 32,163 61,873 26,562Interest 20,004 9,134 19,371 8,746Dividends – – 5,779 5,600
555,790 642,629 548,104 636,570
From outside operating activities
Coal on-sale 3,505 19,085 3,505 19,085
Other revenue 3,324 1,241 3,324 1,061
6,829 20,326 6,829 20,146
562,619 662,955 554,933 656,716
5 otHeR Income
Grants 11,950 3,750 11,950 3,750Net gain on disposal of net assets held for sale in disposal groups notes 5(a) and (b) 276,479 – 297,275 – Renewable Energy Certificate income – 21,549 – 21,549
288,429 25,299 309,225 25,299

STanwell annual RepoRT 2011 87
noteS to tHe FInAncIAl StAtementS 30 june 2011
6 expenSeS
Impairment losses
Available-for-sale financial asset impairment relates to the Group’s investment in Blue Energy Limited (ASX: BUL) and is discussed further in note 13.
Exploration and evaluation expenditure impairment relates to the Group’s expenditure in Icon Energy Limited. The Group recognised partial impairment of
the expenditure to date based on drilling results indicating a reduced likelihood of commercial gas reserves being found in the future.
Property, plant and equipment impairment predominantly relates to impairment on leased power stations ($232.0 million). The impairment charge in the current year represents the impact of a reduction in
discounted cash flows from electricity generation. This has been driven by the introduction of a carbon pricing mechanism by the Federal Government and other factors discussed in note 3.
conSolIdAted pARent entItY
2011 $’000
2010 $’000
2011 $’000
2010 $’000
loss/profit before income tax includes the following specific expenses:
Depreciation Power stations 28,366 26,559 28,366 26,559 Other property, plant and equipment 7,092 3,981 7,092 3,981
total depreciation 35,458 30,540 35,458 30,540
Amortisation Power stations 41,656 44,199 41,656 44,199 Other property, plant and equipment 761 760 761 760 Intangible assets 3,705 3,435 3,705 3,435
total amortisation 46,122 48,394 46,122 48,394
total depreciation and amortisation 81,580 78,934 81,580 78,934
Finance costs Interest and finance charges paid/payable 45,066 31,900 45,022 31,861
Rental expense relating to operating leases 2,798 2,798 2,574 2,601
Net bad and doubtful receivables expense including movements in provision for doubtful receivables 13 158 13 158
Net expense from movement in employee entitlements provision 479 923 479 923
Defined contribution superannuation expense 3,450 3,381 3,450 3,381
Defined benefit plan expense 990 1,094 990 1,094
Impairment losses
Available-for-sale financial assets (note 13) 9,690 7,430 9,690 7,430
Exploration and evaluation expenditure (note 18) 7,413 – 3,000 –
Property, plant and equipment (note 15) 234,183 1,730 234,183 1,730
251,286 9,160 246,873 9,160

88 STanwell annual RepoRT 2011
noteS to tHe FInAncIAl StAtementS 30 june 2011
7 Income tAx eQuIvAlent BeneFIt oR expenSe
conSolIdAted pARent entItY
2011 $’000
2010 $’000
2011 $’000
2010 $’000
(a) Income tax equivalent (benefit)/expense
Current tax equivalent 127,559 86,293 125,635 83,466
Deferred tax equivalent (134,155) (24,463) (128,711) (24,530)Adjustments for current tax equivalent of prior periods (5,991) (5,765) (5,991) (5,765)
(12,587) (56,065) (9,067) (53,171)
Deferred income tax equivalent (benefit)/expense included in income tax equivalent (benefit)/expense comprises:
(Increase) in deferred tax equivalent assets (note 19) (42,821) (6,159) (41,533) (6,148)
(Decrease) in deferred tax equivalent liabilities (note 26) (89,858) (17,196) (85,132) (17,274) (Under) provision in prior year (1,476) (1,108) (2,046) (1,108)
(134,155) (24,463) (128,711) (24,530)
(b) numerical reconciliation of income tax equivalent (benefit)/expense to prima facie tax payable
(Loss)/profit before income tax equivalent (benefit)/expense (24,579) 205,527 (4,550) 201,482
Tax at the Australian tax rate of 30% (2010 - 30%) (7,374) 61,658 (1,365) 60,445Tax effect of amounts which are not deductible (taxable) in calculating taxable income: Non-deductible expenses 778 172 23 171 Dividends paid – – (1,734) (1,680)
(6,596) 61,830 (3,076) 58,936
Adjustments for current tax equivalent of prior periods (5,991) (5,765) (5,991) (5,765)
Income tax (benefit)/expense (2,587) 56,065 (9,067) 53,171
(c) tax equivalent benefit/(expense) relating to items of other comprehensive income
Cash flow hedges (note 30) 24,202 (30,025) 24,202 (30,025)
Actuarial gains/(losses) on defined benefit plans (note 30) 92 (62) 92 (62)
24,294 (30,087) 24,294 (30,087)
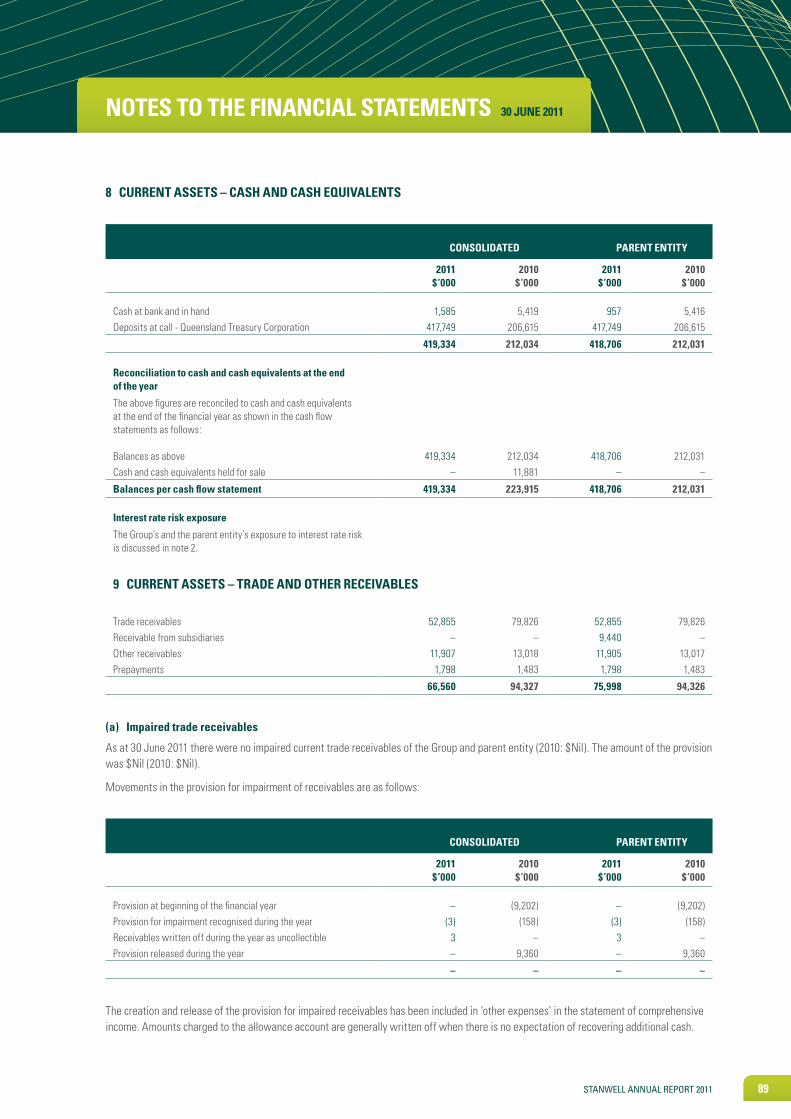
STanwell annual RepoRT 2011 89
noteS to tHe FInAncIAl StAtementS 30 june 2011
8 cuRRent ASSetS – cASH And cASH eQuIvAlentS
conSolIdAted pARent entItY
2011 $’000
2010 $’000
2011 $’000
2010 $’000
Cash at bank and in hand 1,585 5,419 957 5,416Deposits at call - Queensland Treasury Corporation 417,749 206,615 417,749 206,615
419,334 212,034 418,706 212,031
Reconciliation to cash and cash equivalents at the end of the year
The above figures are reconciled to cash and cash equivalents at the end of the financial year as shown in the cash flow statements as follows:
Balances as above 419,334 212,034 418,706 212,031Cash and cash equivalents held for sale – 11,881 – –
Balances per cash flow statement 419,334 223,915 418,706 212,031
Interest rate risk exposure
The Group’s and the parent entity’s exposure to interest rate risk is discussed in note 2.
9 cuRRent ASSetS – tRAde And otHeR ReceIvABleS
Trade receivables 52,855 79,826 52,855 79,826Receivable from subsidiaries – – 9,440 –Other receivables 11,907 13,018 11,905 13,017Prepayments 1,798 1,483 1,798 1,483
66,560 94,327 75,998 94,326
(a) Impaired trade receivables
As at 30 June 2011 there were no impaired current trade receivables of the Group and parent entity (2010: $Nil). The amount of the provision was $Nil (2010: $Nil).
Movements in the provision for impairment of receivables are as follows:
conSolIdAted pARent entItY
2011 $’000
2010 $’000
2011 $’000
2010 $’000
Provision at beginning of the financial year – (9,202) – (9,202)Provision for impairment recognised during the year (3) (158) (3) (158)Receivables written off during the year as uncollectible 3 – 3 – Provision released during the year – 9,360 – 9,360
– – – –
The creation and release of the provision for impaired receivables has been included in ‘other expenses’ in the statement of comprehensive income. Amounts charged to the allowance account are generally written off when there is no expectation of recovering additional cash.

90 STanwell annual RepoRT 2011
noteS to tHe FInAncIAl StAtementS 30 june 2011
9 cuRRent ASSetS – tRAde And otHeR ReceIvABleS (contInued)
(b) past due but not impaired
As at 30 June 2011, there were no material trade receivables past due but not impaired (2010: $Nil).
(c) other receivables
These amounts generally arise from transactions outside the usual operating activities of the Group. Interest may be charged at 9.5% per annum (2010: 9.5% per annum) where payment is after the due date.
(d) Foreign exchange and interest rate risk
Information about the Group’s and the parent entity’s exposure to foreign currency risk and interest rate risk in relation to trade and other receivables is provided in note 2.
(e) Fair value and credit risk
Due to the short-term nature of these receivables, their carrying amount is assumed to approximate their fair value.
The maximum exposure to credit risk at the reporting date is the carrying amount of
each class of receivables mentioned above. Refer to note 2 for more information on the risk management policy of the Group and the credit quality of the entity’s trade receivables.
10 cuRRent ASSetS – InventoRIeS
conSolIdAted pARent entItY
2011 $’000
2010 $’000
2011 $’000
2010 $’000
Fuel at weighted average cost 7,354 12,250 7,354 12,250Stores at weighted average cost 14,700 15,170 14,700 15,170Environmental certificates at fair market value 27,418 9,818 27,418 9,818Provision for write down of stores (727) (814) (727) (814)
48,745 36,424 48,745 36,424
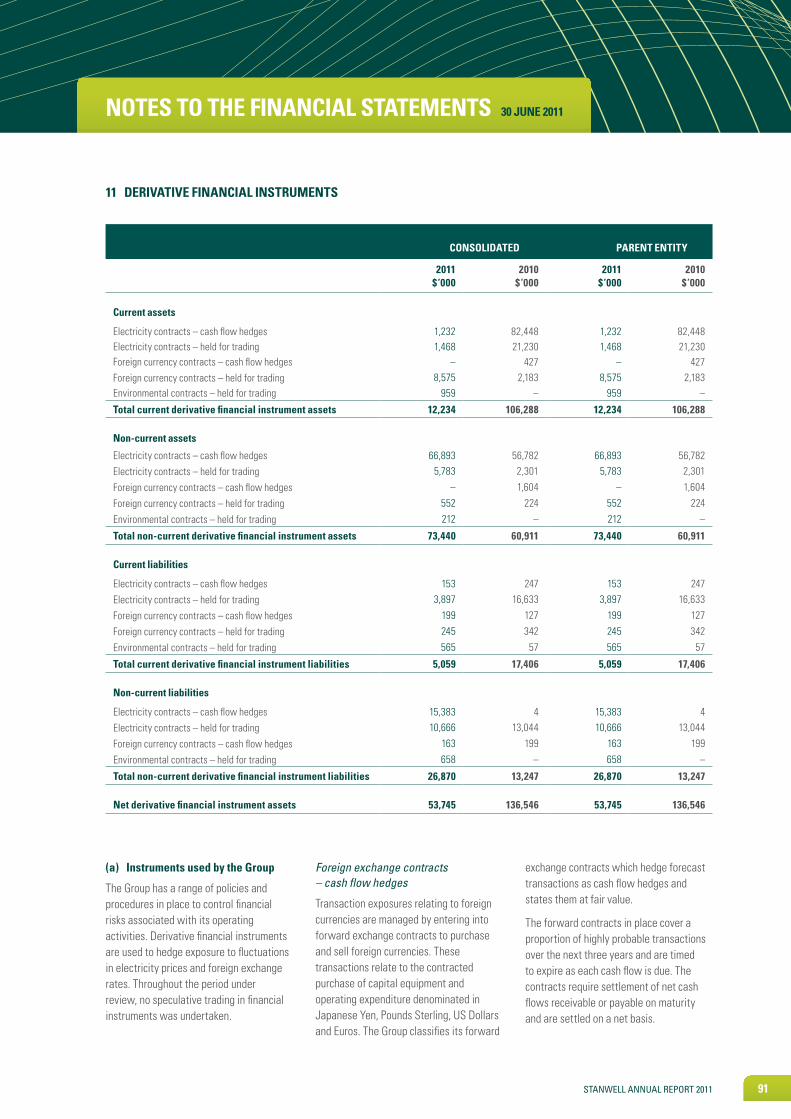
STanwell annual RepoRT 2011 91
noteS to tHe FInAncIAl StAtementS 30 june 2011
(a) Instruments used by the group
The Group has a range of policies and procedures in place to control financial risks associated with its operating activities. Derivative financial instruments are used to hedge exposure to fluctuations in electricity prices and foreign exchange rates. Throughout the period under review, no speculative trading in financial instruments was undertaken.
Foreign exchange contracts – cash flow hedges
Transaction exposures relating to foreign currencies are managed by entering into forward exchange contracts to purchase and sell foreign currencies. These transactions relate to the contracted purchase of capital equipment and operating expenditure denominated in Japanese Yen, Pounds Sterling, US Dollars and Euros. The Group classifies its forward
exchange contracts which hedge forecast transactions as cash flow hedges and states them at fair value.
The forward contracts in place cover a proportion of highly probable transactions over the next three years and are timed to expire as each cash flow is due. The contracts require settlement of net cash flows receivable or payable on maturity and are settled on a net basis.
11 deRIvAtIve FInAncIAl InStRumentS
conSolIdAted pARent entItY
2011 $’000
2010 $’000
2011 $’000
2010 $’000
current assets
Electricity contracts – cash flow hedges 1,232 82,448 1,232 82,448Electricity contracts – held for trading 1,468 21,230 1,468 21,230Foreign currency contracts – cash flow hedges – 427 – 427Foreign currency contracts – held for trading 8,575 2,183 8,575 2,183Environmental contracts – held for trading 959 – 959 –
total current derivative financial instrument assets 12,234 106,288 12,234 106,288
non-current assets
Electricity contracts – cash flow hedges 66,893 56,782 66,893 56,782Electricity contracts – held for trading 5,783 2,301 5,783 2,301
Foreign currency contracts – cash flow hedges – 1,604 – 1,604
Foreign currency contracts – held for trading 552 224 552 224
Environmental contracts – held for trading 212 – 212 –
total non-current derivative financial instrument assets 73,440 60,911 73,440 60,911
current liabilities
Electricity contracts – cash flow hedges 153 247 153 247Electricity contracts – held for trading 3,897 16,633 3,897 16,633
Foreign currency contracts – cash flow hedges 199 127 199 127
Foreign currency contracts – held for trading 245 342 245 342
Environmental contracts – held for trading 565 57 565 57
total current derivative financial instrument liabilities 5,059 17,406 5,059 17,406
non-current liabilities
Electricity contracts – cash flow hedges 15,383 4 15,383 4Electricity contracts – held for trading 10,666 13,044 10,666 13,044
Foreign currency contracts – cash flow hedges 163 199 163 199
Environmental contracts – held for trading 658 – 658 –
total non-current derivative financial instrument liabilities 26,870 13,247 26,870 13,247
net derivative financial instrument assets 53,745 136,546 53,745 136,546

92 STanwell annual RepoRT 2011
noteS to tHe FInAncIAl StAtementS 30 june 2011
11 deRIvAtIve FInAncIAl InStRumentS (contInued)
(a) Instruments used by the group (continued)
Foreign exchange contracts – cash flow hedges (continued)
The gain or loss from remeasuring the hedging instruments at fair value is deferred in equity in the hedging reserve, to the extent that the hedge is effective. When the cash flows occur for hedges of capital equipment purchases the Group adjusts the initial measurement of the capital equipment recognised in the balance sheet by the related amount deferred in equity. Gains and losses deferred in equity for hedges of revenue and expense transactions are reclassified into profit and loss when the hedged transaction is recognised.
All foreign exchange contracts were entered into by the parent entity.
Foreign exchange contracts – held for trading
The parent entity has further entered into forward exchange contracts and currency options which are economic hedges but do not satisfy the requirements for hedge accounting. These transactions relate to the contracted purchase of capital equipment denominated in Japanese Yen and the receipt of revenue from coal export sharing arrangements with prices referenced to US Dollars. These contracts are subject to the same risk management policies as all other derivative contracts, refer note 2 for details. However, they must be accounted for as held for trading.
The gain or loss on derivatives entered into for economic hedge purposes and which are not hedge accounted for are recognised in the statement of comprehensive income immediately. In the year ended 30 June 2011 a gain of $7,618,002 (2010: $474,878 gain) was included in the statement of comprehensive income.
Electricity contracts – cash flow hedges
The parent entity bids all electricity generated into the National Electricity Market (NEM). Cash flows received from the NEM can be volatile and accordingly the parent entity has entered into electricity derivatives such as price swaps under which it is obliged to receive cash flows at fixed electricity prices and pay cash flows at variable electricity prices.
Swaps currently in place cover a large proportion of the total load to be generated over the next three years and are timed to expire as each cash flow is received from the NEM. The contracts require settlement of net cash flows receivable or payable each week and are settled on a net basis.
The gain or loss from remeasuring the hedging instruments at fair value is deferred in equity in the hedging reserve, to the extent that the hedge is effective, and reclassified into profit and loss when the hedged electricity revenue is recognised. The mark-to-market movement in the year was a decrease of the in-the-money position of $86,390,805 (2010: an increase of the in-the-money position of $102,030,251).
All electricity contracts were entered into by the parent entity.
Electricity contracts – held for trading
The parent entity has further entered into electricity contracts which are economic hedges but do not satisfy the requirements for hedge accounting. These contracts are subject to the same risk management policies as all other derivative contracts, refer note 2 for details. However, they must be accounted for as held for trading.
The gain or loss on derivatives entered into for economic hedge purposes and which are not hedge accounted for are recognised in the statement of comprehensive income immediately. In the year ended 30 June 2011 a gain of $1,305,173 (2010: $16,421,913 gain) was included in the statement of comprehensive income.
Environmental contracts – held for trading
The parent entity creates environmental certificates which can then be traded in the open market. To derive additional income from these environmental certificates the parent entity trades in environmental derivative contracts, i.e. forwards and options.
The gain or loss on derivatives is recognised in the statement of comprehensive income immediately. In the year ended 30 June 2011 a loss of $2,095,125 (2010: $20,893 gain) was included in the statement of comprehensive income.
(b) Risk exposures
For an analysis of the sensitivity of derivatives to interest rate, foreign exchange and commodity price risk, see note 2.

STanwell annual RepoRT 2011 93
noteS to tHe FInAncIAl StAtementS 30 june 2011
12 non-cuRRent ASSetS And lIABIlItIeS And dISpoSAl gRoupS clASSIFIed AS Held FoR SAle oR dIStRIButIon
conSolIdAted pARent entItY
2011 $’000
2010 $’000
2011 $’000
2010 $’000
Assets of disposal group classified as held for sale (note (a)) – 109,391 – 13,849
Assets of disposal group classified as held for distribution (note (b)) 69,857 – 69,857 –
total assets held for sale or distribution 69,857 109,391 69,857 13,849
Liabilities of disposal group classified as held for sale (note (a)) – 694 – –
Liabilities of disposal group classified as held for distribution (note (b)) 184,724 – 184,724 –
total liabilities held for sale or distribution 184,724 694 184,724 –
(a) carrying amounts of assets and liabilities held for sale
The carrying amounts of the Group’s assets and liabilities held for sale as at balance date are:
Property, plant and equipment – 88,418 – 7,289
Cash and cash equivalents – 11,881 – –
Trade and other receivables – 2,119 – –
Other receivables – 636 – 223
Exploration and evaluation costs – 6,337 – 6,337
total assets – 109,391 – 13,849
Trade and other payables – (337) – –
Provision for rehabilitation and decommissioning – (357) – –
total liabilities – (694) – –
net assets – 108,697 – 13,849
In 2010, Stanwell Corporation Limited commenced a process for the sale of a surplus asset and associated land, being its interests in a mineral development licence in Queensland which was disclosed as a non-current asset held for sale in the prior year.
The sale process concluded in September 2010 and resulted in a net gain for the Group of $271.0 million before tax.
On 30 June 2011, Stanwell Corporation Limited concluded the sale of EDWF Holdings 1 Pty Ltd and Wind Portfolio
Pty Ltd which held its interests in the Emu Downs Wind Farm in Western Australia. The sale of the subsidiaries resulted in a consolidated gain on disposal of $5.4 million before tax.

94 STanwell annual RepoRT 2011
noteS to tHe FInAncIAl StAtementS 30 june 2011
12 non-cuRRent ASSetS And lIABIlItIeS And dISpoSAl gRoupS clASSIFIed AS Held FoR SAle oR dIStRIButIon (contInued)
(b) carrying amounts of assets and liabilities held for distribution
The carrying amounts valued using the assumptions disclosed in note 3(b) of the Group’s assets and liabilities held for distribution as at balance date are:
conSolIdAted pARent entItY
2011 $’000
2010 $’000
2011 $’000
2010 $’000
Trade and other receivables 21,158 – 21,158 –
Intangible assets 291 – 291 –
Deferred tax assets* 48,408 – 48,408 –
total assets 69,857 – 69,857 –
Trade and other payables (11,794) – (11,794) –
Other current liabilities (15,046) – (15,046) –
Provisions (157,884) – (157,884) –
total liabilities (184,724) – (184,724) –
net liabilities (114,867) – (114,867) –
* The deferred tax balances will be derecognised on 1 July 2011 and the new owner will account for the tax balance on transfer of the assets and liabilities.
On 25 November 2010, the Queensland Government announced the restructure of the three Queensland Government Owned Corporation generators being Stanwell Corporation Limited, Tarong Energy Corporation Limited and CS Energy Limited. The proposed final asset allocation was announced on 10 March 2011 and the completion date of the restructure was 1 July 2011. The Government Owned Corporation (Generator Restructure)Regulation 2011 was gazetted on 24 June 2011.
The assets and liabilities transferred on 1 July 2011 were transferred at the
value included in the balance sheet for the business unit for the day immediately before the transfer date. At any time within one year after the transfer date the shareholding Ministers may correct an error in the valuation of these assets and liabilities.
The assets and associated liabilities transferred on 1 July 2011 are accounted for as “disposal group(s) held for distribution to owners” from the date the regulation was approved by the Governor in Council on 24 June 2011. As at this date, the assets to be transferred were
substantially finalised and the restructure was considered highly probable to proceed.
In terms of the restructure, the Gladstone Interconnection and Power Pooling Agreement business unit transferred from Stanwell Corporation Limited to CS Energy Limited. The assets and liabilities detailed above related to the employees and supporting systems required to manage the contract together with the associated onerous contract provision.

STanwell annual RepoRT 2011 95
noteS to tHe FInAncIAl StAtementS 30 june 2011
13 non-cuRRent ASSetS – AvAIlABle-FoR-SAle FInAncIAl ASSetS
14 non-cuRRent ASSetS – otHeR FInAncIAl ASSetS
conSolIdAted pARent entItY
2011 $’000
2010 $’000
2011 $’000
2010 $’000
At 1 July 18,757 26,187 18,757 26,187
Losses from impairment (9,690) (7,430) (9,690) (7,430)
At 30 june 9,067 18,757 9,067 18,757
Available-for-sale financial assets include the following classes of financial assets:
Listed securities (note (a))
equity securities 9,067 18,757 9,067 18,757
conSolIdAted pARent entItY
2011 $’000
2010 $’000
2011 $’000
2010 $’000
Investments in subsidiaries (note 37) – – – 76,726
These financial assets are carried at cost.
(a) listed securities
The listed investment relates to a 12.09% (2010: 13.49%) holding in Blue Energy Limited (ASX:BUL). The acquisition included the shares in Blue Energy Limited at a premium to the market price and an option to a gas supply arrangement. At the date of acquisition the share price was 29 cents. At the reporting date the investment is required to be marked-to-market resulting in a reduction of the investment
value. At 30 June 2011 the market value of the shares was 6.4 cents resulting in the recognition of an impairment in the statement of comprehensive income of $6.2 million (2010: $7.4 million). Furthermore, at the reporting date the option to a Gas Development Alliance Agreement has been amended giving rise to a further impairment of $3.5 million (2010: $Nil).
The total impairment for the year was $9.7 million (2010: $7.4 million).
(b) Investments in related parties
See note 36.

96 STanwell annual RepoRT 2011
noteS to tHe FInAncIAl StAtementS 30 june 2011
poWeR StAtIonS
oWned At coSt
poWeR StAtIonS
oWned At RecoveRABle
Amount
poWeR StAtIonS
undeR FInAnce
leASe
otHeR pRopeRtY,
plAnt And eQuIpment
At coSt
otHeR pRopeRtY,
plAnt And eQuIpment
undeR FInAnce
leASe
WoRkS In pRogReSS
At coSt totAl
$'000 $'000 $'000 $'000 $'000 $'000 $'000
conSolIdAted And pARent entItY
At 1 july 2009
Cost 367,076 7,187 1,486,602 59,552 18,608 48,488 1,987,513Accumulated depreciation (154,046) (5,060) (482,577) (20,129) (7,405) – (669,217)
net book amount 213,030 2,127 1,004,025 39,423 11,203 48,488 1,318,296
Year ended 30 june 2010
Opening net book amount at 1 July 213,030 2,127 1,004,025 39,423 11,203 48,488 1,318,296
Additions – – – – – 72,178 72,178
Transfers between asset classes 50,727 (5) (78) 10,652 7 (61,303) –
Transfers to disposal groups held for sale – – – – – (7,289) (7,289)
Impairment loss – (1,730) – – – – (1,730)
Disposals (34) – (6,576) (1,823) – – (8,433)
Depreciation (26,388) (171) – (3,981) – – (30,540)Amortisation – – (44,199) (94) (666) – (44,959)
closing net book amount at 30 june 237,335 221 953,172 44,177 10,544 52,074 1,297,523
At 30 june 2010
Cost 417,721 7,181 1,470,894 69,608 18,402 52,074 2,035,880Accumulated depreciation (180,386) (6,960) (517,722) (25,431) (7,858) – (738,357)
net book amount 237,335 221 953,172 44,177 10,544 52,074 1,297,523
Year ended 30 june 2011
Opening net book amount at 1 July 237,335 221 953,172 44,177 10,544 52,074 1,297,523Additions – – – – – 63,440 63,440Transfers between asset classes 70,060 1,989 (1,642) 12,714 – (83,121) – Impairment loss – (2,210) (231,973) – – – (234,183)Disposals (66) – (7,289) (522) (444) (1,340) (9,661)Depreciation (28,366) – – (7,092) – – (35,458)Amortisation – – (41,656) (95) (666) – (42,417)
closing net book amount at 30 june 278,963 – 670,612 49,182 9,434 31,053 1,039,244
At 30 june 2011
Cost or recoverable amount 483,086 13,601 1,455,495 76,588 17,374 31,053 2,077,197Accumulated depreciation (204,123) (13,601) (784,883) (27,406) (7,940) – (1,037,953)
net book amount 278,963 – 670,612 49,182 9,434 31,053 1,039,244
15 non-cuRRent ASSetS – pRopeRtY, plAnt And eQuIpment

STanwell annual RepoRT 2011 97
noteS to tHe FInAncIAl StAtementS 30 june 2011
15 non-cuRRent ASSetS – pRopeRtY, plAnt And eQuIpment (contInued)
carrying amounts of land and buildings
The carrying amounts of land and buildings included in the tables above, are set out below:
16 non-cuRRent ASSetS – IntAngIBle ASSetS
conSolIdAted pARent entItY
2011 $’000
2010 $’000
2011 $’000
2010 $’000
Land and buildings 72,420 68,356 72,420 68,356
cApItAlISed SoFtWARe
$'000
conSolIdAted And pARent entItY
At 1 july 2009
Cost 23,094
Accumulated amortisation (17,127)
net book amount 5,967
Year ended 30 june 2010
Opening net book amount 5,967
Additions 1,819
Amortisation charge (3,435)
closing net book amount at 30 june 4,351
At 30 june 2010
Cost 24,906
Accumulated amortisation (20,555)
net book amount 4,351
Year ended 30 june 2011
Opening net book amount at 1 July 4,351
Additions 8,960
Amortisation charge (3,705)
Transfers to disposal groups held for distribution (291)
closing net book amount at 30 june 9,315
At 30 june 2011
Cost 33,547
Accumulated amortisation (24,232)
net book amount 9,315
Amortisation of $3,704,963 (2010: $3,434,750) is included in the depreciation and amortisation expense in the statement of comprehensive income.

98 STanwell annual RepoRT 2011
noteS to tHe FInAncIAl StAtementS 30 june 2011
17 non-cuRRent ASSetS – BIologIcAl ASSetS
The Group has two timber plantations situated at Rockhampton and the Tully River.
Rockhampton
The Group has an interest in a joint venture that consists of 99 hectares of hardwood plantation in the Rockhampton area (see note 38).
The Group’s timber plantation resources at Rockhampton are comprised of two hardwood species, the Western White Gum and a Spotted Gum hybrid. The trees are expected to be felled and sold in 2032 (25 years after planting).
The Western White Gum was planted on 69.2 hectares with 990 trees per hectare
(a) Financial risk management strategies
The Group is exposed to financial risks arising from changes in the price of timber. The Group does not anticipate that timber prices will decline significantly in the
and the Spotted Gum hybrid was planted on 28.2 hectares with 660 trees per hectare. As at 30 June 2011, stock counts indicate that there are approximately 990 trees per hectare of Western White Gum and 700 trees per hectare of Spotted Gum hybrid.
Tully River
In 2010, the Group prepared and planted a 20 hectare plantation on the Tully River with a further 60 hectares proposed to be established in late 2011.
The Group’s timber plantation resources at Tully River are comprised of Red Mahogany, Gympie Messmate, Hoop Pine and Quandong. The trees are expected to be felled and sold in 2035 (25 years after planting).
foreseeable future and, therefore, has not entered into derivative or other contracts to manage the risk of a decline in timber prices. The Group reviews its outlook for timber prices regularly in considering the need for active financial risk management.
The Red Mahogany was planted across about 5 hectares with approximately 1,000 trees per hectare planted, Quandong was planted on 5 hectares with approximately 250 trees per hectare planted and Spotted Gum was planted on 10 hectares with approximately 1,000 trees per hectare planted. The initial planting rates of the three species was impacted by Cyclone Yasi with post cyclone survival rates at 850 trees per hectare for Queensland Maple and Spotted Gum trees and 163 trees per hectare for the Quandong trees. Some replacement of Quandong stock may be required.
(b) contractual obligations
See note 35 for disclosure of any commitments to develop or acquire biological assets.
conSolIdAted pARent entItY
2011 $’000
2010 $’000
2011 $’000
2010 $’000
plantation growing timber
Carrying amount at 1 July 424 342 424 342Purchases 89 82 89 82
carrying amount at 30 june 513 424 513 424

STanwell annual RepoRT 2011 99
noteS to tHe FInAncIAl StAtementS 30 june 2011
18 non-cuRRent ASSetS – exploRAtIon And evAluAtIon expendItuRe
19 non-cuRRent ASSetS – deFeRRed tAx eQuIvAlent ASSetS
conSolIdAted pARent entItY
2011 $’000
2010 $’000
2011 $’000
2010 $’000
cost
Opening balance 6,132 10,916 6,132 10,916
Expenditure incurred 43,498 1,553 34,672 1,553
Less: expenditure transferred to disposal groups held for sale – (6,337) – (6,337)
Less: expenditure written off (7,413) – (3,000) –
closing balance 42,217 6,132 37,804 6,132
conSolIdAted pARent entItY
2011 $’000
2010 $’000
2011 $’000
2010 $’000
the balance comprises temporary differences attributable to:
Provisions and accrued employee entitlements not currently deductible 56,769 18,503 56,769 18,467
Development costs deductible in the future – 568 – 568
Sundry items 247 255 247 255
Investment writedown 9,982 4,851 8,658 4,851
Transfers to disposal groups held for distribution (48,408) – (48,408) –
total deferred tax equivalent assets 18,590 24,177 17,266 24,141
Deferred tax equivalent assets to be recovered within 12 months 6,314 12,987 6,314 12,987
Deferred tax equivalent assets to be recovered after more than 12 months 12,276 11,190 10,952 11,154
18,590 24,177 17,266 24,141

100 STanwell annual RepoRT 2011
noteS to tHe FInAncIAl StAtementS 30 june 2011
19 non-cuRRent ASSetS – deFeRRed tAx eQuIvAlent ASSetS (contInued)
emploYee BeneFItS
InveStment ImpAIRment otHeR totAl
$’000 $’000 $’000 $’000
movementS – conSolIdAted
At 1 july 2009 4,990 2,622 10,406 18,018
(Charged)/credited- to profit or loss 245 2,229 3,685 6,159
At 30 june 2010 5,235 4,851 14,091 24,177
At 30 june 2010 5,235 4,851 14,091 24,177
(Charged)/credited
- to profit or loss 234 5,131 37,456 42,821
Transfers to disposal groups held for distribution – – (48,408) (48,408)
At 30 june 2011 5,469 9,982 3,139 18,590
movementS – pARent entItY
At 1 july 2009 4,990 2,622 10,382 17,994
(Charged)/credited- to profit or loss 245 2,229 3,673 6,147
At 30 june 2010 5,235 4,851 14,055 24,141
At 30 june 2010 5,235 4,851 14,055 24,141
(Charged)/credited
- to profit or loss 234 3,807 37,492 41,533
Transfers to disposal groups held for distribution – – (48,408) (48,408)
At 30 june 2011 5,469 8,658 3,139 17,266

STanwell annual RepoRT 2011 101
noteS to tHe FInAncIAl StAtementS 30 june 2011
20 non-cuRRent ASSetS – RetIRement BeneFIt oBlIgAtIonS
(a) Superannuation plans
The Group contributes on behalf of its employees to a number of defined contribution funds as well as to the industry multiple employer superannuation scheme, managed by Energy Super
(previously known as the Electricity Supply Industry Fund (Qld) (ESI Super)), which consists of a defined benefit fund and a defined contribution fund. The defined benefit section provides lump sum benefits based on years of service and average salary. The defined contribution section receives fixed contributions from the Group and the Group’s legal or constructive obligation is limited to these contributions.
The following sets out details in respect of the defined benefit section only.
(b) Balance sheet amounts
The amounts recognised in the balance sheet are determined as follows:
conSolIdAted And pARent entItY
2011 $’000
2010 $’000
Present value of the defined benefit obligation (29,565) (25,870)
Fair value of defined benefit plan assets 32,228 28,742
Net asset before adjustment for contributions tax 2,663 2,872
Adjustment for contributions tax 470 507
net asset in the balance sheet 3,133 3,379
The Group intends to contribute to the defined benefit plan at a rate of 12.0% (2010: 12.0%) of salaries having consideration for the actuary’s latest recommendations.
(c) categories of plan assets
The major categories of plan assets are as follows:
conSolIdAted And pARent entItY
2011 $’000
2010 $’000
Cash 1,611 1,438
Fixed interest securities 4,834 4,311
Domestic equities 9,024 8,048
Private equity 6,446 5,748
International equities 7,090 6,323
Unlisted property 3,223 2,874
32,228 28,742
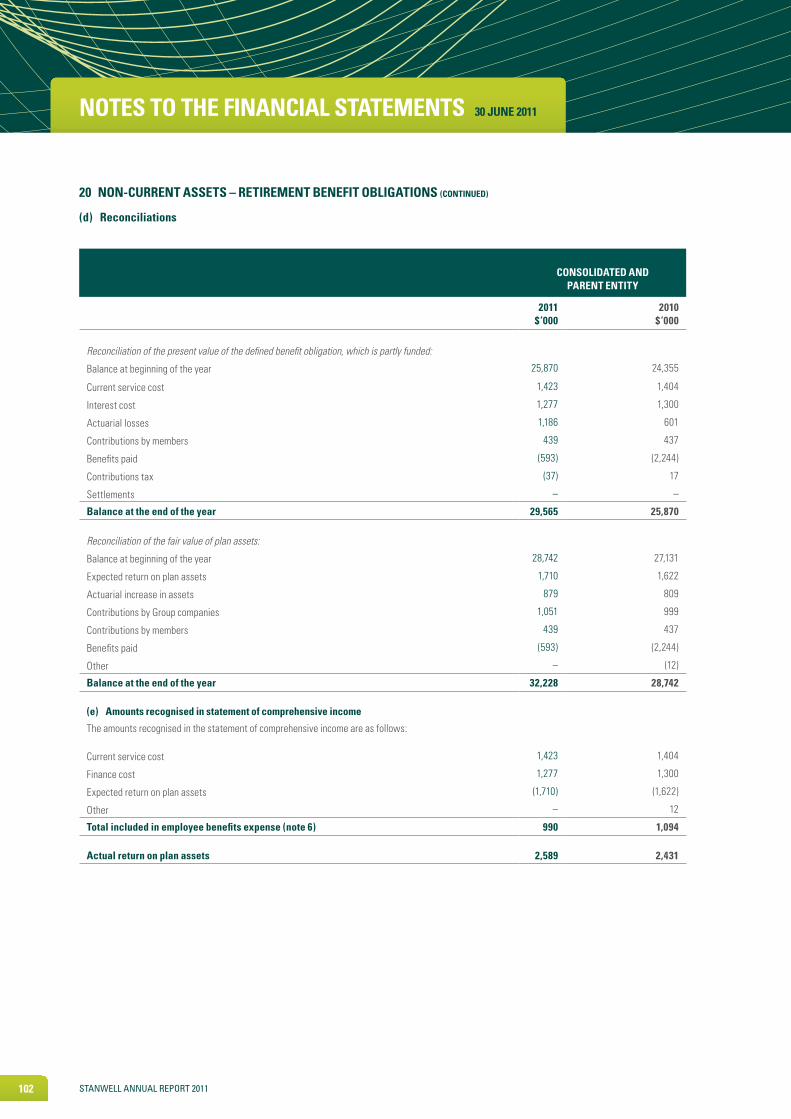
102 STanwell annual RepoRT 2011
noteS to tHe FInAncIAl StAtementS 30 june 2011
20 non-cuRRent ASSetS – RetIRement BeneFIt oBlIgAtIonS (contInued)
(d) Reconciliations
conSolIdAted And pARent entItY
2011 $’000
2010 $’000
Reconciliation of the present value of the defined benefit obligation, which is partly funded:
Balance at beginning of the year 25,870 24,355
Current service cost 1,423 1,404
Interest cost 1,277 1,300
Actuarial losses 1,186 601
Contributions by members 439 437
Benefits paid (593) (2,244)
Contributions tax (37) 17
Settlements – –
Balance at the end of the year 29,565 25,870
Reconciliation of the fair value of plan assets:
Balance at beginning of the year 28,742 27,131
Expected return on plan assets 1,710 1,622
Actuarial increase in assets 879 809
Contributions by Group companies 1,051 999
Contributions by members 439 437
Benefits paid (593) (2,244)
Other – (12)
Balance at the end of the year 32,228 28,742
(e) Amounts recognised in statement of comprehensive income
The amounts recognised in the statement of comprehensive income are as follows:
Current service cost 1,423 1,404
Finance cost 1,277 1,300
Expected return on plan assets (1,710) (1,622)
Other – 12
total included in employee benefits expense (note 6) 990 1,094
Actual return on plan assets 2,589 2,431

STanwell annual RepoRT 2011 103
noteS to tHe FInAncIAl StAtementS 30 june 2011
20 non-cuRRent ASSetS – RetIRement BeneFIt oBlIgAtIonS (contInued)
(f) principal actuarial assumptions
The principal actuarial assumptions used (expressed as weighted averages) were as follows:
conSolIdAted And pARent entItY
2011 2010
Discount rate 5.2% 5.1%
Expected return on plan assets 6.0% 6.0%
Future salary increases 4.5% 4.5%
The expected rate of return on plan assets has been calculated based on the current asset allocation to each of the major asset classes and the expected future investment return for each of these asset classes. This resulted in the selection of a 6.0% (2010: 6.0%) expected return (net of investment fees and tax).
(h) Historic summary
2011 $’000
2010 $’000
2009 $’000
2008 $’000
2007 $’000
Defined benefit plan obligation (29,565) (25,870) (24,355) (24,353) (21,271)
Plan assets 32,228 28,742 27,131 26,705 31,902
Surplus 2,663 2,872 2,776 2,352 10,631
Experience adjustments arising on plan liabilities 1,186 (601) 1,430 (1,092) 1,278
Experience adjustments arising on plan assets (879) 809 (3,031) (7,366) 4,211
(i) Restructure of the Queensland government owned electricity generator corporations
As part of the restructure (refer note 12), 4 employees who are members of the defined benefit plan, will transfer to CS Energy Limited from 1 July 2011. As a result, a retirement benefit surplus value of approximately $0.3 million transferred to CS Energy Limited on 1 July 2011.
(g) employer contributions
Employer contributions to the defined benefit section of the plan are based on recommendations by the plan’s actuary. Actuarial assessments are made at no more than three yearly intervals, and the last such assessment was made as at 1 July 2010 by Sunsuper Financial Services Pty Ltd.
The objective of funding is to ensure that the benefit entitlements of members and other beneficiaries are fully funded by the
time they become payable. To achieve this objective, the actuary has adopted a method of funding benefits known as the projected unit credit method. This funding method seeks to have the benefits funded by means of a total contribution which is expected to be a consistent percentage of members’ salaries over their working lifetime.
Using the projected unit credit method and particular actuarial assumptions as to the plan’s future experience the actuary
recommended, in the actuarial review as at 1 July 2010, the payment of employer contributions to the fund of 12.0% of defined benefit members salaries from 1 July 2011. A contribution rate of 12% has been adopted by the Group.
For the year ending 30 June 2012, total employer contributions of $1,022,000 (2011: $936,000) are expected to be paid by the Group based on the structure as at 30 June 2011.

104 STanwell annual RepoRT 2011
noteS to tHe FInAncIAl StAtementS 30 june 2011
21 non-cuRRent ASSetS –otHeR non-cuRRent ASSetS
conSolIdAted pARent entItY
2011 $’000
2010 $’000
2011 $’000
2010 $’000
other
Deferred receivable 2,500 7,848 2,500 7,848
22 cuRRent lIABIlItIeS – tRAde And otHeR pAYABleS
Trade payables 16,759 19,630 16,759 19,630
Other payables and accruals 31,776 48,762 31,776 48,762
48,535 68,392 48,535 68,392
(a) Amounts not expected to be settled within the next 12 months
Other payables and accruals include accruals for annual leave. The entire obligation is presented as current, since the Group does not have an unconditional right to defer settlement. However, based on past experience, the Group does not expect all employees to take the full amount of accrued leave within the next 12 months. The following amounts reflect leave that is not expected to be taken within the next 12 months:
conSolIdAted pARent entItY
2011 $’000
2010 $’000
2011 $’000
2010 $’000
Annual leave obligation expected to be settled after 12 months 1,267 1,145 1,267 1,145
(b) Risk exposure
Information about the Group’s and the parent entity’s exposure to foreign exchange risk is provided in note 2.
23 cuRRent lIABIlItIeS – pRovISIonS
Employee benefits 6,798 6,416 6,798 6,416
Onerous contracts – 4,400 – 4,400
Restoration 773 678 773 678
Dividends (note 31) – 116,700 – 116,700
7,571 128,194 7,571 128,194
(a) employee Benefits
Details of the calculations used for these benefits are included in note 27.
(b) onerous contracts
The onerous contracts provision has been calculated by projecting the revenue and expenditure attributable to the contract up to the contract expiry date and discounting back to present values using the Group’s cost of capital. The major factors contributing to the increase in the onerous provision ($141.0 million increase recognised in 2010/11), prior to its transfer to disposal groups held for distribution, are the introduction of a carbon pricing mechanism and the forecast electricity demand and estimated electricity pool price and contract premiums over the life of the contract.
As detailed in the Movement in provisions below, this contract has been transferred to disposal groups held for distribution in the current year.

STanwell annual RepoRT 2011 105
noteS to tHe FInAncIAl StAtementS 30 june 2011
23 cuRRent lIABIlItIeS – pRovISIonS (contInued)
(c) movements in provisions
Movements in each class of provision during the financial year, other than employee benefits, are set out below:
oneRouS contRActS ReStoRAtIon dIvIdendS totAl
$’000 $’000 $’000 $’000
conSolIdAted And pARent entItY – 2011
Opening balance at 1 July 4,400 678 116,700 121,778
Charged to the statement of comprehensive income
- additional provisions recognised 140,951 458 – 141,409
Dividends paid – – (116,700) (116,700)
Transfers to disposal groups held for distribution (145,351) – – (145,351)
Amounts used during the period – (363) – (363)
closing balance at 30 june – 773 – 773
(d) Amounts not expected to be settled within the next 12 months
Employee benefits includes the current provision for long service leave which includes all unconditional entitlements where employees have completed the required period of service and also those where employees are entitled to pro-rata payments in certain circumstances. However, based on past experience, the Group does not expect all employees to take the full amount of accrued long service leave or require payment within the next 12 months. The following amounts reflect leave that is not expected to be taken or paid within the next 12 months.
conSolIdAted pARent entItY
2011 $’000
2010 $’000
2011 $’000
2010 $’000
Long service leave obligation expected to be settled after 12 months 6,549 6,156 6,549 6,156
24 otHeR cuRRent lIABIlItIeS
Security deposits and retentions 21 7 21 7
Mandatory Renewable Energy Target obligations1 – 26,607 – 26,607
21 26,614 21 26,614
1The prior year Mandatory Renewable Energy Target obligations includes the Group’s obligation to the Office of Renewable Energy Regulator for the calendar year of 2001-2006 and 2010.
25 non-cuRRent lIABIlItIeS – BoRRoWIngS
Unsecured borrowings 637,146 637,146 637,146 637,146

106 STanwell annual RepoRT 2011
noteS to tHe FInAncIAl StAtementS 30 june 2011
25 non-cuRRent lIABIlItIeS – BoRRoWIngS (contInued)
(a) unsecured borrowings
The unsecured borrowings are provided by Queensland Treasury Corporation. An amount of $83.1 million (2010: $83.1 million) is held in a debt offset account, and is reported as a set-off against non-current borrowings. The net balance after offset is $637.1 million (2010: $637.1 million). Interest rates on the unsecured borrowings are at book rate which is reviewed and updated as necessary once per year to
reflect the evolving market rate of interest that Queensland Treasury Corporation pays to investors to service the underlying bond funding. The book rate of interest that Stanwell Corporation Limited pays to Queensland Treasury Corporation is therefore a weighted average of previous market rates of interest but this weighted average is only updated once per year for accounting purposes.
(b) Fair value
The fair value of unsecured borrowings for the Group and parent entity at 30 June
2011 was $655.6 million (2010: $655.4 million) compared to a carrying amount of $637.1 million (2010: $637.1 million). Quoted market prices or dealer quotes for similar instruments are used to estimate fair value for long-term debt for disclosure purposes.
(c) Risk exposures
For an analysis of the sensitivity of borrowings to interest rate risk see note 2.
conSolIdAted pARent entItY
2011 $’000
2010 $’000
2011 $’000
2010 $’000
the balance comprises temporary differences attributable to:Differences in depreciation and amortisation of property, plant and equipment for accounting and income tax equivalent purposes 206,938 296,661 206,938 291,935Expenditure currently deductible for tax equivalent purposes but deferred and amortised for accounting purposes 10,292 11,911 10,292 11,911Revenue recognised in accounting revenue but deferred for tax purposes 3,554 1,562 3,554 1,562Defined benefit plan asset 940 1,014 940 1,014Derivative assets 16,123 40,851 16,123 40,851
total deferred tax equivalent liabilities 237,847 351,999 237,847 347,273
Deferred tax equivalent liabilities to be settled within 12 months 16,196 15,802 16,196 11,654Deferred tax equivalent liabilities to be settled after more than 12 months 221,651 336,197 221,651 335,619
237,847 351,999 237,847 347,273
26 non-cuRRent lIABIlItIeS – deFeRRed tAx eQuIvAlent lIABIlItIeS

STanwell annual RepoRT 2011 107
conSolIdAted pARent entItY
2011 $’000
2010 $’000
2011 $’000
2010 $’000
Employee benefits 1,895 2,445 1,895 2,445Onerous contracts – 12,000 – 12,000Restoration 1,466 796 1,466 796Rehabilitation and decommissioning 1,402 1,123 1,402 1,123
4,763 16,364 4,763 16,364
noteS to tHe FInAncIAl StAtementS 30 june 2011
26 non-cuRRent lIABIlItIeS – deFeRRed tAx eQuIvAlent lIABIlItIeS (contInued)
27 non-cuRRent lIABIlItIeS – pRovISIonS
pRopeRtY, plAnt And eQuIpment
deFIned BeneFIt
plAn deRIvAtIveS
otHeR totAl
$’000 $’000 $’000 $’000 $’000
movementS – conSolIdAted
At 1 july 2009 308,889 980 10,826 19,892 340,587Charged/(credited)- to profit or loss (12,228) (28) – (6,419) (18,675)- to comprehensive income – 62 30,025 – 30,087
At 30 june 2010 296,661 1,014 40,851 13,473 351,999
At 30 june 2010 296,661 1,014 40,851 13,473 351,999Charged/(credited)- to profit or loss (89,723) 18 (526) 373 (89,858)- to comprehensive income – (92) (24,202) – (24,294)
At 30 june 2011 206,938 940 16,123 13,846 237,847
movementS – pARent entItYAt 1 july 2009 305,814 980 10,826 19,768 337,388Charged/(credited)- to profit or loss (13,879) (28) – (6,295) (20,202)- to comprehensive income – 62 30,025 – 30,087
At 30 june 2010 291,935 1,014 40,851 13,473 347,273
At 30 june 2010 291,935 1,014 40,851 13,473 347,273Charged/(credited)- to profit or loss (84,997) 18 (526) 373 (85,132)- to comprehensive income – (92) (24,202) – (24,294)
At 30 june 2011 206,938 940 16,123 13,846 237,847
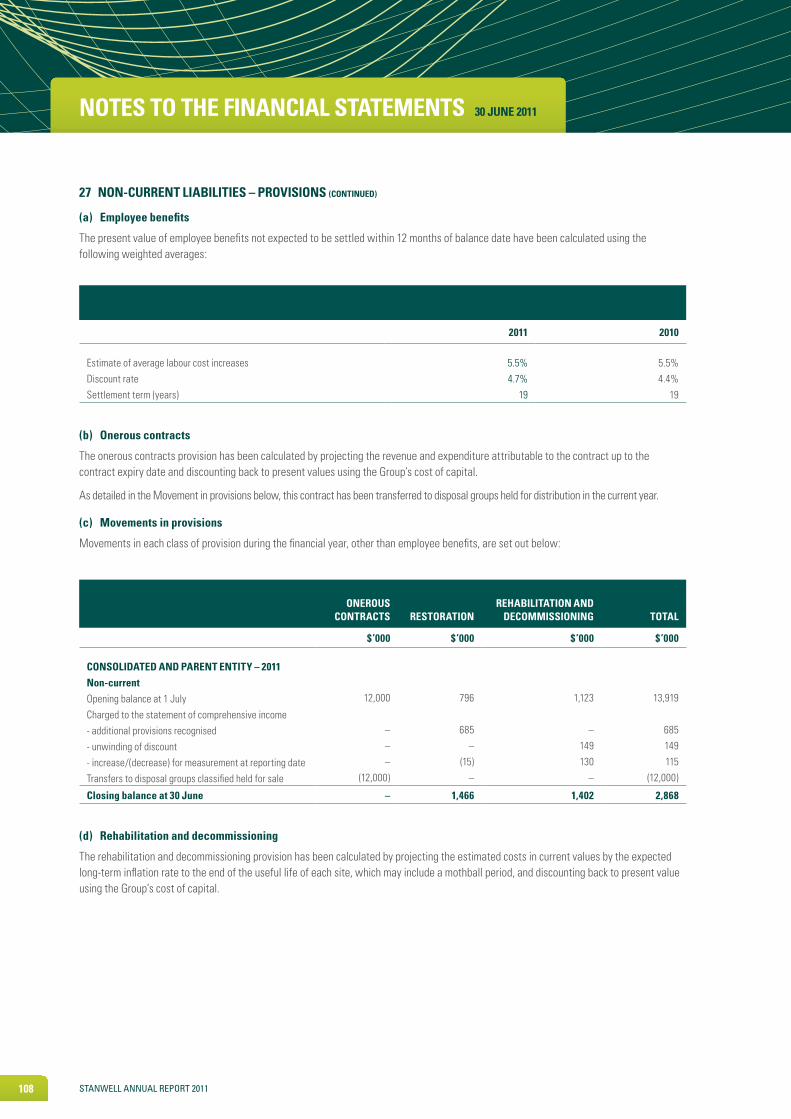
108 STanwell annual RepoRT 2011
noteS to tHe FInAncIAl StAtementS 30 june 2011
27 non-cuRRent lIABIlItIeS – pRovISIonS (contInued)
(a) employee benefits
The present value of employee benefits not expected to be settled within 12 months of balance date have been calculated using the following weighted averages:
(b) onerous contracts
The onerous contracts provision has been calculated by projecting the revenue and expenditure attributable to the contract up to the contract expiry date and discounting back to present values using the Group’s cost of capital.
As detailed in the Movement in provisions below, this contract has been transferred to disposal groups held for distribution in the current year.
(c) movements in provisions
Movements in each class of provision during the financial year, other than employee benefits, are set out below:
(d) Rehabilitation and decommissioning
The rehabilitation and decommissioning provision has been calculated by projecting the estimated costs in current values by the expected long-term inflation rate to the end of the useful life of each site, which may include a mothball period, and discounting back to present value using the Group’s cost of capital.
2011 2010
Estimate of average labour cost increases 5.5% 5.5%Discount rate 4.7% 4.4%Settlement term (years) 19 19
oneRouS contRActS ReStoRAtIon
ReHABIlItAtIon And decommISSIonIng totAl
$’000 $’000 $’000 $’000
conSolIdAted And pARent entItY – 2011non-currentOpening balance at 1 July 12,000 796 1,123 13,919
Charged to the statement of comprehensive income- additional provisions recognised – 685 – 685
- unwinding of discount – – 149 149
- increase/(decrease) for measurement at reporting date – (15) 130 115
Transfers to disposal groups classified held for sale (12,000) – – (12,000)
closing balance at 30 june – 1,466 1,402 2,868

STanwell annual RepoRT 2011 109
noteS to tHe FInAncIAl StAtementS 30 june 2011
conSolIdAted pARent entItY
2011 $’000
2010 $’000
2011 $’000
2010 $’000
Deferred revenue see note 34(b) 2,500 2,500 2,500 2,500
29 contRIButed eQuItY
conSolIdAted And pARent entItY
conSolIdAted And pARent entItY
2011 Shares
2010 Shares
2011 $’000
2010 $’000
SHARe cApItAl
Ordinary voting (A class), fully paid 4 4 – –
Ordinary non- voting (B class), fully paid 924,568,658 924,568,658 544,569 544,569
924,568,662 924,568,662 544,569 544,569
total consolidated and parent entity contributed equity 544,569 544,569
28 otHeR non-cuRRent lIABIlItIeS
(a) ordinary shares
The company is wholly owned by the Queensland Government.
Holders of ordinary shares are entitled to receive dividends as declared from time to time and holders of A class shares are entitled to one vote per share at a shareholders’ meeting.
In the event of winding up of the Company, ordinary shareholders rank after creditors and are fully entitled to any proceeds of liquidation.
(b) capital risk management
The Group’s and the parent entity’s objectives when managing capital are to safeguard their ability to continue as a going concern, so that they can continue to maintain the required credit rating for a Government Owned Corporation generator operating in a deregulated electricity market, to provide returns for shareholders and benefits for other stakeholders and to maintain an optimal capital structure to reduce the cost of capital.
In order to maintain or adjust the capital structure, the Group may adjust the amount of dividends paid to shareholders, return
capital to shareholders, issue new shares or sell assets to reduce debt.
Consistent with others in the industry, the Group and the parent entity monitor capital on the basis of the gearing ratio. This ratio is calculated as debt divided by total capital. Debt is calculated as total borrowings, including ‘borrowings’ disclosed within disposal groups classified as held for sale. Total capital is calculated as ‘equity’ as shown in the balance sheet plus debt.
During 2011, the Group’s Board continued to support a target debt range of between 30% and 50% of total capital. The gearing ratios at 30 June 2011 and 30 June 2010 were as follows:

110 STanwell annual RepoRT 2011
noteS to tHe FInAncIAl StAtementS 30 june 2011
30 ReSeRveS, otHeR oWneR contRIButIonS And RetAIned pRoFItS
conSolIdAted pARent entItY
2011 $’000
2010 $’000
2011 $’000
2010 $’000
(a) Reserves
Hedging reserve – cash flow hedges 37,121 93,591 37,121 93,591
movements:
Opening balance at 1 July 93,591 23,533 93,591 23,533
Gain on revaluation – gross: electricity contracts 26,593 152,828 26,593 152,828
(Loss) on revaluation – gross: foreign exchange contracts (2,019) (1,660) (2,019) (1,660)
Transfer to net profit – gross: electricity contracts (105,101) (49,997) (105,101) (49,997)
Transfer to net profit – gross: foreign exchange contracts 123 – 123 –
Transfer to property, plant and equipment – gross: foreign exchange contracts
(268) (1,088) (268) (1,088)
Deferred tax equivalent liabilities (note 26) 24,202 (30,025) 24,202 (30,025)
closing balance at 30 june 37,121 93,591 37,121 93,591
(b) other owner contributions (148,309) (148,309) (148,309) (148,309)
(c) Retained profits
Retained profits 177,040 190,070 180,113 176,634
movements:Opening balance at 1 July 190,070 157,162 176,634 144,877
Net (loss)/profit for the year (11,992) 149,462 4,517 148,311
Dividends – (116,700) – (116,700)
Actuarial (losses)/gains on defined benefit plans (307) 208 (307) 208
Deferred tax equivalent on actuarial gains/(losses) on defined benefit plans
92 (62) 92 (62)
Other movement (823) – (823) –
closing balance at 30 june 177,040 190,070 180,113 176,634
29 contRIButed eQuItY (contInued)
(b) capital risk management (continued)
conSolIdAted pARent entItY
2011 $’000
2010 $’000
2011 $’000
2010 $’000
Net debt (note 25(a)) 637,146 637,146 637,146 637,146
Total equity 610,421 679,921 613,494 666,485
total capital 1,247,567 1,317,067 1,250,640 1,303,631
gearing ratio 51% 48% 51% 49%
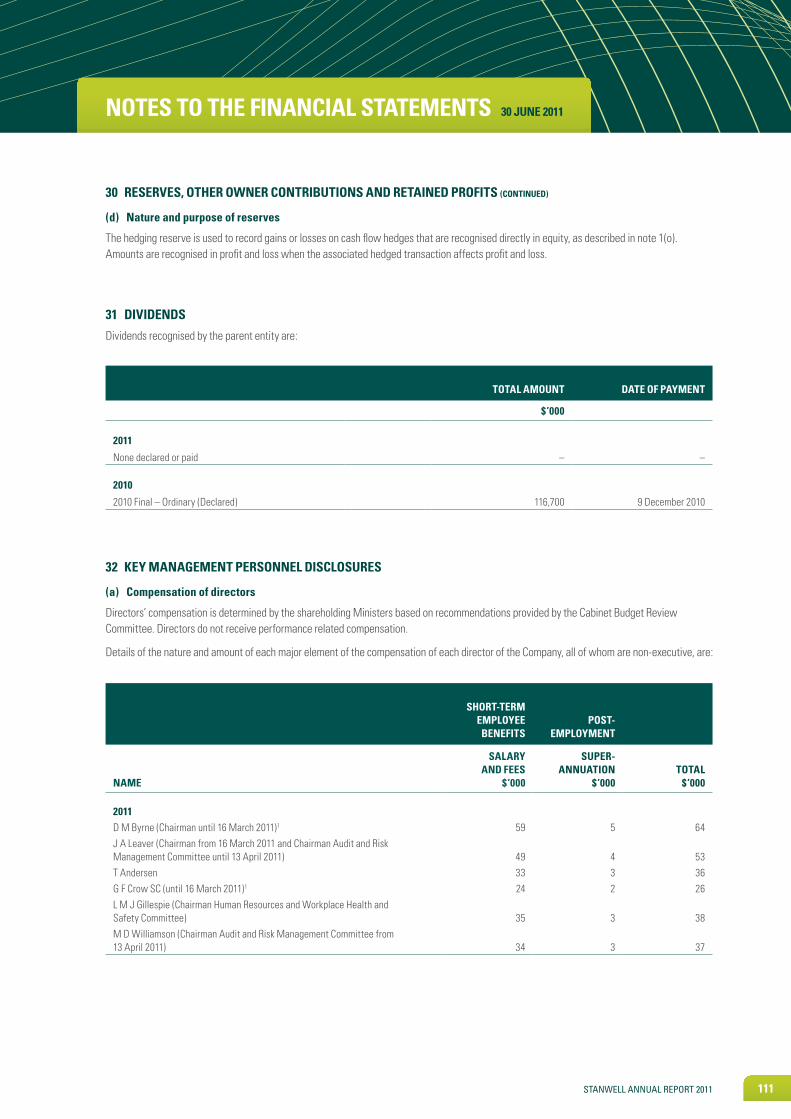
STanwell annual RepoRT 2011 111
noteS to tHe FInAncIAl StAtementS 30 june 2011
30 ReSeRveS, otHeR oWneR contRIButIonS And RetAIned pRoFItS (contInued)
(d) nature and purpose of reserves
The hedging reserve is used to record gains or losses on cash flow hedges that are recognised directly in equity, as described in note 1(o). Amounts are recognised in profit and loss when the associated hedged transaction affects profit and loss.
31 dIvIdendS
Dividends recognised by the parent entity are:
totAl Amount dAte oF pAYment
$’000
2011
None declared or paid – –
2010
2010 Final – Ordinary (Declared) 116,700 9 December 2010
SHoRt-teRm emploYee BeneFItS
poSt- emploYment
nAme
SAlARY And FeeS
$’000
SupeR- AnnuAtIon
$’000totAl
$’000
2011D M Byrne (Chairman until 16 March 2011)1 59 5 64J A Leaver (Chairman from 16 March 2011 and Chairman Audit and Risk Management Committee until 13 April 2011) 49 4 53T Andersen 33 3 36G F Crow SC (until 16 March 2011)1 24 2 26L M J Gillespie (Chairman Human Resources and Workplace Health and Safety Committee) 35 3 38M D Williamson (Chairman Audit and Risk Management Committee from 13 April 2011) 34 3 37
32 keY mAnAgement peRSonnel dIScloSuReS
(a) compensation of directors
Directors’ compensation is determined by the shareholding Ministers based on recommendations provided by the Cabinet Budget Review Committee. Directors do not receive performance related compensation.
Details of the nature and amount of each major element of the compensation of each director of the Company, all of whom are non-executive, are:

112 STanwell annual RepoRT 2011
noteS to tHe FInAncIAl StAtementS 30 june 2011
On 1 July 2011, a new Board of Directors was appointed for the Group being: Graham Carpenter (Chairman), Kym Collins, Graeme Crow SC, Ann Fitzpatrick, Russell Kempnich, Julie Leaver, Stephen Rochester, and Rodney Welford.
Directors’ compensation does not include insurance premiums paid by the Company or related parties in respect of directors’ and officers’ liabilities and legal expenses, as the insurance policies do not specify premiums paid in respect of individual directors. Further, the directors do not receive any compensation in the form of non-monetary or other benefits.
(b) compensation of other key management personnel
The Board approved the compensation policy and packages applicable to the senior executives of the Group. The compensation policies and packages are subject to Queensland State Government guidelines that may be issued from time to time.
Senior executives may receive an ‘at risk’ payment based on the achievement of specific goals related to the performance of the individual, team and Group (including operational results).
Executive officers are those officers involved in the strategic direction, management or control of business at a company or operating division level.
SHoRt-teRm emploYee BeneFItS
poSt- emploYment
nAme
SAlARY And FeeS
$’000
SupeR- AnnuAtIon
$’000totAl
$’000
2010D M Byrne (Chairman) 74 7 81T Andersen (from 1 October 2009) 23 2 25G F Crow SC 31 3 34L M J Gillespie (Chairman Human Resources and Workplace Health and Safety Committee) 32 3 35P A Gregg (Chairman Audit and Risk Management Committee until 30 September 2009) 8 1 9C C Hefner (from 1 October 2009 to 14 March 2010) 17 2 19B J Kelly (until 30 September 2009) 8 1 9J A Leaver (Chairman Audit and Risk Management Committee from 1 October 2009) 24 2 26D J H Watson (until 30 September 2009) 8 1 9M D Williamson 31 3 34
1 Mr Byrne and Mr Crow were appointed respectively to the Advisory Boards of the putative Genco 1 (restructured CS Energy Limited) and Genco 2 (restructured Stanwell Corporation Limited). In order for them to give their full attention to the Advisory Boards and to avoid any actual or perceived conflicts of interest, the Stanwell Board granted them unpaid leave of absence from their duties to participate in the affairs of the Group from 16 March 2011 until 30 June 2011.
32 keY mAnAgement peRSonnel dIScloSuReS (contInued)
(a) compensation of directors (continued)

STanwell annual RepoRT 2011 113
noteS to tHe FInAncIAl StAtementS 30 june 2011
32 keY mAnAgement peRSonnel dIScloSuReS (contInued)
(b) compensation of other key management personnel (continued)
Details of the nature and amount of each major element of the compensation of each executive of the Group are outlined in the following table:
pRImARYpoSt-
emploYment
nAme
SAlARY And FeeS
$’000
non- monetARY
BeneFItS $’000
SupeR- AnnuAtIon
$’000totAl
$’000
2011Chief Executive Officer1 483 – 48 531Chief Financial Officer1,2 263 13 24 300Chief Operating Officer2 241 – 24 265General Manager Business Services1,2 242 10 23 275General Manager Business Development1,2 312 5 24 341General Manager Trading1,2 259 10 24 293General Manager Corporate Services1 43 – 4 47
2010Chief Executive Officer1 502 27 50 579Chief Financial Officer 267 12 24 303Chief Operating Officer2 235 – 24 259General Manager Business Services 246 7 22 275General Manager Business Development 214 2 21 237General Manager Trading1 258 12 24 294General Manager Corporate Services2 147 9 15 171
1During part of the year these positions were performed by other senior executives or corporate employees until permanent appointments were made. The above disclosures relate to the total compensation provided by Stanwell Corporation Limited during the year in respect of each position.2During part of the year these positions were performed by other employees or external contractors while the permanent employee performed other duties. The costs of contractors are excluded on the basis that they are not employees.
Executives may earn performance based ‘at risk’ incentive bonuses which are not shown in this table.
Executives’ compensation does not include insurance premiums paid by the Group or related parties in respect of officers’ liabilities and legal expenses insurance contracts, as the insurance policies do not specify premiums paid in respect of individual officers.
(c) total key management personnel compensation
conSolIdAted pARent entItY
2011 $’000
2010 $’000
2011 $’000
2010 $’000
Short-term employee benefits 2,282 2,432 2,282 2,432
Termination – 18 – 18Post-employment benefits 208 230 208 230
2,490 2,680 2,490 2,680 Amounts disclosed for remuneration of key management personnel exclude insurance premiums paid by the Group or related parties in respect of officers’ liabilities and legal expenses insurance contracts, as the insurance policies do not specify premiums paid in respect of individual officers.

114 STanwell annual RepoRT 2011
noteS to tHe FInAncIAl StAtementS 30 june 2011
(d) compensation policy
The Group seeks to attract and retain high performing individuals to ensure that it exceeds its shareholders’ expectations of operational and value adding performance. One component of attracting and retaining such employees is a competitive compensation strategy that rewards based on a combination of personal, team and Group performance.
The Group has three broad categories of employees with each category having a specific compensation policy and framework.
Senior executives (inclusive of the Chief Executive Officer)
This category of employees is employed on individual employment agreements on salary and conditions outlined by
the shareholder’s policy ‘Remuneration Guidelines and Senior Executives in Government Owned Corporations’. The terms of these agreements and expiry dates for each senior executive position are detailed in the following table:
Separation benefits, in the event of termination by the Group (in circumstances other than by ill health, misconduct or poor performance) are allowed for in the agreements. Performance payments for senior executives are based on key performance indicators reflective of personal, division and Group performance over each financial year. Payment is subject to endorsement by the Board and approval by the shareholding Ministers. Payments are made in cash, or if appropriate notice has been provided, paid into the employee’s superannuation fund on a salary sacrifice basis.
Salaried employees
In line with shareholder guidelines, these employees are employed under a collective bargaining agreement framework but have some of their conditions, inclusive of salary,
established by an Alternative Employment Agreement (AEA). These employees have an open term of employment and separation benefits are in line with the relevant site bargaining agreements.
Performance payments for these employees are based on key performance indicators reflective of personal, site, team and corporate performance over each financial year. Payment is subject to endorsement by the Chief Executive Officer and approval by the Board. Payments are made in cash or, if appropriate notice has been given, paid into employees’ superannuation funds on a salary sacrifice basis.
Employees under Queensland Industrial Relations Commission
The majority of the employees of the Group are employed pursuant to site bargaining
agreements. There are four agreements, covering the major operating sites and offices. All agreements are certified by the Queensland Industrial Relations Commission. These employees have an open term of employment with the Group and separation benefits are in line with the relevant site bargaining agreements.
Each of the bargaining agreements has a clause allowing for the payment of team based performance bonuses which are paid six monthly. Performance is measured against mutually agreed indicators that are renewed for each payment period. Payments are made in cash, or if appropriate notice has been provided, paid into the employee’s superannuation fund on a salary sacrifice basis.
poSItIon teRm (YeARS) expIRY dAte
Chief Executive Officer1 – –Chief Financial Officer 3 31 December 2011Chief Operating Officer 3 31 December 2011General Manager Business Development 3 31 December 2011 General Manager Business Services 3 13 January 2012General Manager Trading1 – – General Manager Corporate Services 3 23 January 2012
1 These roles were not filled during the financial year on a permanent basis due to the impending generator restructure.
32 keY mAnAgement peRSonnel dIScloSuReS (contInued)

STanwell annual RepoRT 2011 115
noteS to tHe FInAncIAl StAtementS 30 june 2011
32 keY mAnAgement peRSonnel dIScloSuReS (contInued)
(e) performance payments
The following information is provided in respect of performance payments to Group employees:
2011 $’000
2010 $’000
Aggregate performance payment expense 3,395 2,929Total salaries and wages (including employer contributions to superannuation funds) paid to employees receiving bonuses 45,677 45,577The number of employees who received performance bonuses 396 400
The table below details the terms and grant dates of performance payments by category of employee:
cAtegoRY gRAnt dAte cRIteRIA nAtuRe
Senior executives (including Chief Executive Officer) Board approval Performance CashSalaried employees 1 July Performance CashEmployees – Queensland Industrial Relations Commission 1 January /1 July Performance Cash
33 RemuneRAtIon oF AudItoRS
During the year the following fees were paid or payable for services provided by the auditor of the parent entity, its related practices and non related audit firms:
conSolIdAted pARent entItY
2011 $
2010 $
2011 $
2010 $
Audit services
Queensland Auditor-General:- current year 328,845 249,139 328,845 249,139- underprovision from prior years 30,638 19,728 30,638 19,728
total remuneration for audit services 359,483 268,867 359,483 268,867

116 STanwell annual RepoRT 2011
noteS to tHe FInAncIAl StAtementS 30 june 2011
34 contIngencIeS
(a) contingent liabilities
Parent entity guarantees in favour of third parties:
2011 $’000
2010 $’000
Griffin Windfarm Pty Ltd – 2,750Other 993 993
993 3,743
All guarantees are provided in the form of unconditional undertakings provided by Queensland Treasury Corporation and are secured through indemnity agreements.
These guarantees may give rise to liabilities in the parent entity if the subsidiaries do not meet their obligations under the terms of the agreements or other liabilities subject to the guarantees.
In line with the policy set out in note 1(y) the fair value of the above guarantees is $Nil (2010: $Nil).
Investment in gas exploration venture
During the financial year ended 30 June 2009, the Group signed a Farm-in Agreement and Joint Operating and Gas Supply Agreements with Icon Energy Limited and invested $6 million for an initial pilot program covering four of the 30 blocks in Icon Energy Limited’s ATP 626P.
In August 2010, approval was received from the shareholding Ministers to commit $30 million to a farm-in to secure proven
and probable (2P) reserves. As at 30 June 2011, $21.2 million remains to be spent. The Group will earn a 50% interest in the four blocks on completion of the farm-in. Key commercial terms have been agreed for the Group to purchase 225 PJ from ATP 626P under a gas sale agreement, over a 15 year period, subject to completion of the second stage of the farm-in agreement.
(b) contingent assets
Legal proceedings
On 28 July 2009, the Australian Energy Regulator announced that it had instituted proceedings against the Company in the Federal court, alleging that the Company did not make several of its offers to generate electricity in ‘good faith’ contrary to the National Electricity Rules. The trial commenced on 15 June 2010 and concluded on 5 July 2010. On 30 August 2011, the Federal Government handed down its judgement. The Court found in favour of Stanwell Corporation Limited
and the full impact of this decision is yet to be determined. The Australian Energy Regulator has 28 days to determine whether or not to lodge an appeal against this decision. The compensation in relation to legal costs incurred by the company defending the allegations has not been determined at the date of this report.
Deferred revenue
During the financial year ended 30 June 2009, Stanwell Corporation Limited secured deferred revenue of $2.5 million and a contingent asset of $2.5 million to be realised between 30 June 2012 and 30 June 2014.

STanwell annual RepoRT 2011 117
noteS to tHe FInAncIAl StAtementS 30 june 2011
35 commItmentS
(a) capital expenditure commitments
conSolIdAted pARent entItY
2011 $’000
2010 $’000
2011 $’000
2010 $’000
Property, plant and equipment
Within one year 43,766 39,094 43,766 39,094
Later than one year but not later than five years 559 2,706 559 2,706
44,325 41,800 44,325 41,800
Biological assets Within one year 122 3 122 3 Later than one year but not later than five years 54 172 54 172 Later than five years 123 127 123 127
299 302 299 302
(b) operating lease commitments
Commitments for minimum lease payments in relation to non-cancellable operating leases are payable as follows:
Within one year 2,429 2,220 2,429 2,220 Later than one year but not later than five years 3,487 3,078 3,487 3,078 Later than five years 3,400 47 3,400 47
9,316 5,345 9,316 5,345
The Group has entered into operating lease agreements for commercial property, motor vehicles and equipment.
(c) operating expenditure commitments
Commitments in relation to operating expenditure are payable as follows:
Within one year 66,400 66,553 66,400 66,553 Later than one year but not later than five years 168,877 194,708 168,877 194,708 Later than five years 588,752 611,694 588,752 611,694
minimum lease payments 824,029 872,955 824,029 872,955
The Group has operating expenditure for various items of plant and equipment.
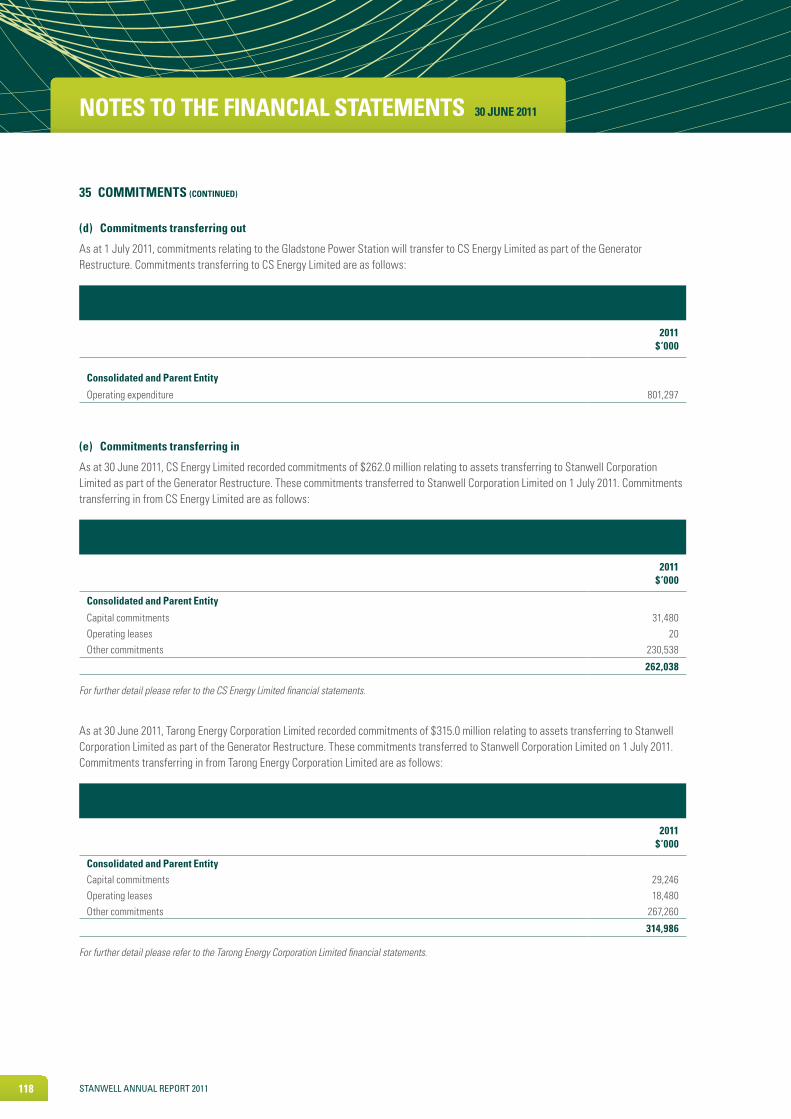
118 STanwell annual RepoRT 2011
noteS to tHe FInAncIAl StAtementS 30 june 2011
(d) commitments transferring out
As at 1 July 2011, commitments relating to the Gladstone Power Station will transfer to CS Energy Limited as part of the Generator Restructure. Commitments transferring to CS Energy Limited are as follows:
2011 $’000
consolidated and parent entity
Operating expenditure 801,297
(e) commitments transferring in
As at 30 June 2011, CS Energy Limited recorded commitments of $262.0 million relating to assets transferring to Stanwell Corporation Limited as part of the Generator Restructure. These commitments transferred to Stanwell Corporation Limited on 1 July 2011. Commitments transferring in from CS Energy Limited are as follows:
2011 $’000
consolidated and parent entity
Capital commitments 31,480Operating leases 20Other commitments 230,538
262,038
For further detail please refer to the CS Energy Limited financial statements.
As at 30 June 2011, Tarong Energy Corporation Limited recorded commitments of $315.0 million relating to assets transferring to Stanwell Corporation Limited as part of the Generator Restructure. These commitments transferred to Stanwell Corporation Limited on 1 July 2011. Commitments transferring in from Tarong Energy Corporation Limited are as follows:
2011 $’000
consolidated and parent entityCapital commitments 29,246Operating leases 18,480Other commitments 267,260
314,986
For further detail please refer to the Tarong Energy Corporation Limited financial statements.
35 commItmentS (contInued)

STanwell annual RepoRT 2011 119
noteS to tHe FInAncIAl StAtementS 30 june 2011
36 RelAted pARtY tRAnSActIonS
(a) parent entity
The parent entity is a Queensland Government Owned Corporation, with all shares held by the shareholding Ministers on behalf of the State of Queensland.
(b) Wholly owned group
The wholly owned Group consists of Stanwell Corporation Limited and its wholly owned entities. Details of the interests in subsidiaries are set out in note 37.
The following transactions occurred with subsidiaries during the year:
(c) joint venture
The Group is a party to the Woodlands Hardwood Plantation Joint Venture with Forestry Plantations Queensland.
The Group held a 50% participatory interest in the Emu Downs Wind Farm through EDWF Holdings 1 Pty Ltd until it was sold on 30 June 2011.
Details of the interest and transactions with the joint ventures are set out in note 38.
(d) key management personnel
Disclosures relating to key management personnel are set out in note 32.
Apart from specific compensation detailed in note 32, no director has entered into a contract with the Group since the end of the previous financial year.
A number of key management personnel of the Group are or were also directors of other organisations which have or
had transactions with the Group. During the financial year Stanwell Corporation Limited was reimbursed $65,000 (2010: $60,920) relating to the after tax value of directors fees for a position held relating to its investment in Blue Energy Limited. All other transactions are based on normal commercial terms and conditions. Material transactions with other State of Queensland controlled entities are disclosed in note 36 (e).
2011 $’000
2010 $’000
Loans provided during the year 9,440 –Dividends received 5,779 5,600

120 STanwell annual RepoRT 2011
noteS to tHe FInAncIAl StAtementS 30 june 2011
36 RelAted pARtY tRAnSActIonS (contInued)
(e) other State of Queensland controlled entities and post employment benefit plans
All State of Queensland controlled entities meet the definition of a related party in
AASB 124 Related Parties. The Group transacts with other State of Queensland controlled entities as part of its normal operations on terms equivalent to those that prevail in arms length transactions.
The following transactions occurred with other related parties:
conSolIdAted pARent entItY
2011 $’000
2010 $’000
2011 $’000
2010 $’000
Electricity financial instrument settlements and environmental certificates 30,587 15,727 30,587 15,727
Purchase of goods and services 13,557 24,322 13,557 24,322
Recharge of costs* 4,187 7,824 4,187 7,824Net interest expense 26,311 22,918 26,311 22,918Superannuation contributions 4,524 4,403 4,524 4,403Dividends paid and proposed – 116,700 – 116,700Income tax paid 107,572 65,145 107,572 60,992Capital repatriation – 380,000 – 380,000
The following balances are outstanding at the reporting date in relation to transactions with related parties:
Cash and cash equivalents 417,749 214,348 417,749 206,615Receivables 3,584 3,463 3,584 3,463Derivative financial instrument assets 28,127 50,095 28,127 50,095Deferred tax equivalent assets 18,590 24,177 17,266 24,141Payables 2,123 2,064 2,123 2,064Current tax equivalent liabilities 49,292 39,489 49,292 39,489Derivative financial instrument liabilities 7,702 3,965 7,702 3,965Deferred tax equivalent liabilities 237,847 351,999 237,847 347,273Borrowings 637,146 637,146 637,146 637,146Provision for dividends – 116,700 – 116,700
* The prior year recharge of costs figure of $7,824,000 includes $3,620,000 (2011: $Nil) of costs recharged under a project development agreement to ZeroGen Pty Ltd (ZeroGen), a related entity previously owned by the parent entity and sold to the Queensland Government on 16 March 2007. Costs were recharged to ZeroGen on normal terms and conditions.
No provisions for doubtful debts have been raised in relation to any outstanding balances, and no expense has been recognised in respect of bad or doubtful debts due from related parties.

STanwell annual RepoRT 2011 121
noteS to tHe FInAncIAl StAtementS 30 june 2011
37 SuBSIdIARIeS
The consolidated financial statements incorporate the assets, liabilities and results of the following subsidiaries in accordance with the accounting policy described in note 1(b):
38 InteReStS In joInt ventuReS
During the financial year, the Group disposed of a 50% participating interest in the Emu Downs Wind Farm Project, whose principal activity is the operation of a wind farm in Western Australia (refer note 12).
The Group has an 84% (2010: 84%) interest in an unincorporated joint venture, the Woodlands Hardwood Plantation Joint Venture, with Forestry Plantations Queensland. The principal activity of this venture is the establishment of a viable commercial hardwood plantation of trees (refer note 17).
The Group is an investor but not a joint venturer in an unincorporated joint venture, the Lydia farm-in area within the ATP 626P joint venture, with Icon Energy Limited. The principal activity of this venture is the exploration, and if appropriate, the exploitation of coal seam methane from ATP 626P in the Surat Basin. In August 2010, approval was received from the shareholding Ministers to commit $30 million to a farm-in to secure 2P reserves. An unusually wet summer has delayed appraisal activities such that expenditure to 30 June 2011 was $8.8 million. The Group will earn a 50% interest in the four
blocks on completion of the farm-in which is now anticipated for late 2012.
The Group’s share of assets employed in the joint ventures is included in the consolidated balance sheet, in accordance with the accounting policy described in note 1(b), under the following classification:
nAme oF entItYcountRY oF IncoRpoRAtIon
clASS oF SHAReS eQuItY HoldIng
2011 %
2010 %
Wind Portfolio Pty Ltd1 Australia Ordinary – 100
EDWF Holdings 1 Pty Ltd1 Australia Ordinary – 100
Energy Portfolio 1 Pty Ltd2 Australia Ordinary 100 100Goondi Energy Pty Ltd Australia Ordinary 100 100
1Wind Portfolio Pty Ltd and EDWF Holdings 1 Pty Ltd were sold on 30 June 2011. The sale of the subsidiaries resulted in a gain on disposal before tax of $5.4 million (see note 12).2Dormant for the year ended 30 June 2011.
conSolIdAted
2011 $’000
2010 $’000
non-current assets
Biological assets – at cost 513 424
For contingent liabilities relating to these joint ventures see note 34.

122 STanwell annual RepoRT 2011
noteS to tHe FInAncIAl StAtementS 30 june 2011
conSolIdAted pARent entItY
2011 $’000
2010 $’000
2011 $’000
2010 $’000
(Loss)/profit for the year (11,992) 149,462 4,517 148,311
Add items classified as investing/financing activities:
Net (gain) on disposal of net assets held for sale in disposal groups (276,479) – (297,275) – Net loss on disposal of non-current assets 8,066 8,068 8,066 8,068 Dividends received – – (5,779) (5,600)
Add non-cash items:
Depreciation and amortisation 81,580 78,934 81,580 78,934 Impairment loss 251,286 9,160 246,873 9,160 Non-cash retirement benefits expense 31 95 31 95
change in assets and liabilities:
Decrease in trade debtors and other receivables 27,767 8,189 18,328 8,189 (Increase)/decrease in inventories (12,321) 11,115 (12,321) 11,115 (Increase)/decrease in assets classified as held for sale (66,812) 726 (69,344) (223) Decrease/(increase) in deferred tax equivalent assets 5,587 (6,159) 6,875 (6,148) Decrease/(increase) in other non-current assets 5,348 (4,951) 5,348 (4,951) Decrease/(increase) in derivative financial instrument assets 81,525 (31,240) 81,525 (31,240) (Decrease) in trade and other payables (9,994) (8,151) (9,994) (8,151) Increase in current tax equivalent liabilities 9,803 15,753 9,803 18,751 Increase/(decrease) in liabilities directly associated with assets
classified as held for sale 184,030 (242) 184,724 – (Decrease)/increase in deferred tax equivalent liabilities (114,152) 11,350 (109,426) 9,826 Increase/(decrease) in derivative financial instrument liabilities 1,276 (59,531) 1,276 (59,531) (Decrease)/increase in provisions and other liabilities (42,116) 20,348 (42,117) 20,348 (Decrease)/increase in hedging reserve (56,470) 70,058 (56,470) 70,058
net cash inflow from operating activities 65,963 272,984 46,220 267,011
39 ReconcIlIAtIon oF loSS oR pRoFIt AFteR Income tAx eQuIvAlent BeneFIt oR expenSe to net cASH InFloW FRom opeRAtIng ActIvItIeS
40 cRoSS BoRdeR leASeS
Stanwell Power Station is subject to cross border leases which were entered into in 1995. In accordance with accounting standards, the leases are treated as finance leases. The leased assets are being amortised in the statement of comprehensive income over the estimated
life of the assets on a straight-line basis consistent with the Group’s policy on depreciation of power stations.
Any major changes to the operational configuration of the power station must be approved by the lessors. There is no lease liability as future lease payments were prepaid at the commencement of the lease.
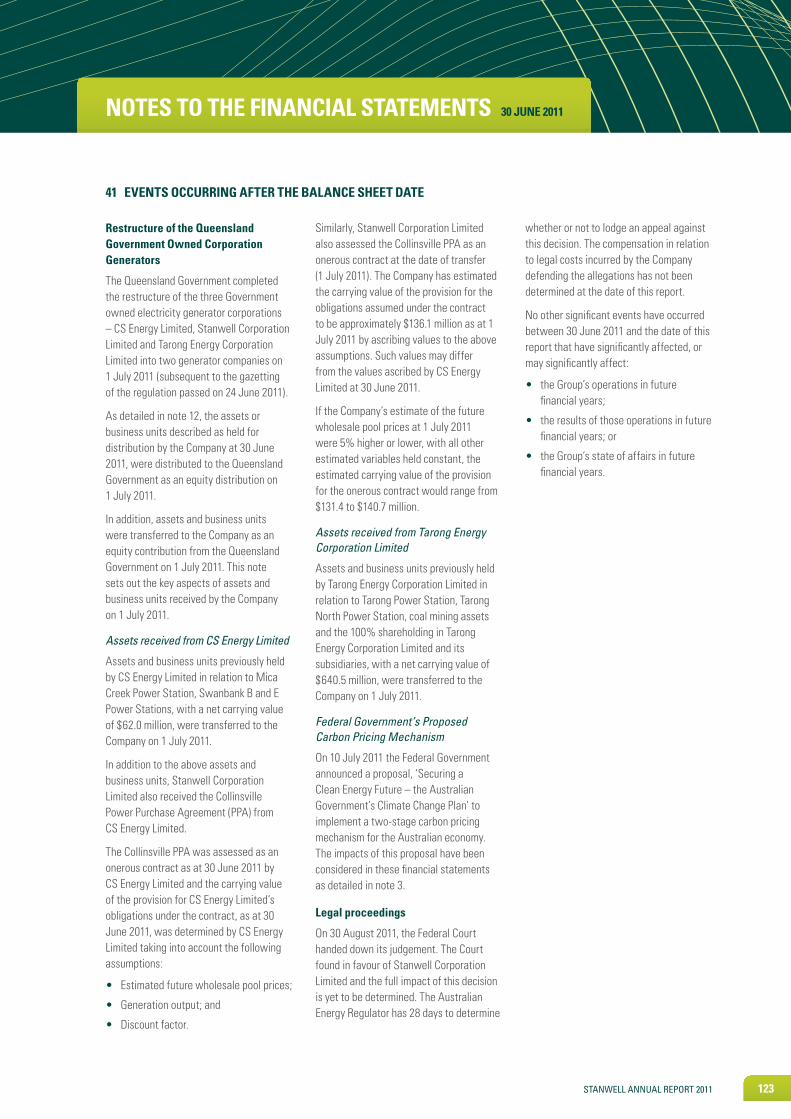
STanwell annual RepoRT 2011 123
noteS to tHe FInAncIAl StAtementS 30 june 2011
41 eventS occuRRIng AFteR tHe BAlAnce SHeet dAte
Restructure of the Queensland government owned corporation generators
The Queensland Government completed the restructure of the three Government owned electricity generator corporations – CS Energy Limited, Stanwell Corporation Limited and Tarong Energy Corporation Limited into two generator companies on 1 July 2011 (subsequent to the gazetting of the regulation passed on 24 June 2011).
As detailed in note 12, the assets or business units described as held for distribution by the Company at 30 June 2011, were distributed to the Queensland Government as an equity distribution on 1 July 2011.
In addition, assets and business units were transferred to the Company as an equity contribution from the Queensland Government on 1 July 2011. This note sets out the key aspects of assets and business units received by the Company on 1 July 2011.
Assets received from CS Energy Limited
Assets and business units previously held by CS Energy Limited in relation to Mica Creek Power Station, Swanbank B and E Power Stations, with a net carrying value of $62.0 million, were transferred to the Company on 1 July 2011.
In addition to the above assets and business units, Stanwell Corporation Limited also received the Collinsville Power Purchase Agreement (PPA) from CS Energy Limited.
The Collinsville PPA was assessed as an onerous contract as at 30 June 2011 by CS Energy Limited and the carrying value of the provision for CS Energy Limited’s obligations under the contract, as at 30 June 2011, was determined by CS Energy Limited taking into account the following assumptions:
• Estimated future wholesale pool prices;
• Generation output; and
• Discount factor.
Similarly, Stanwell Corporation Limited also assessed the Collinsville PPA as an onerous contract at the date of transfer (1 July 2011). The Company has estimated the carrying value of the provision for the obligations assumed under the contract to be approximately $136.1 million as at 1 July 2011 by ascribing values to the above assumptions. Such values may differ from the values ascribed by CS Energy Limited at 30 June 2011.
If the Company’s estimate of the future wholesale pool prices at 1 July 2011 were 5% higher or lower, with all other estimated variables held constant, the estimated carrying value of the provision for the onerous contract would range from $131.4 to $140.7 million.
Assets received from Tarong Energy Corporation Limited
Assets and business units previously held by Tarong Energy Corporation Limited in relation to Tarong Power Station, Tarong North Power Station, coal mining assets and the 100% shareholding in Tarong Energy Corporation Limited and its subsidiaries, with a net carrying value of $640.5 million, were transferred to the Company on 1 July 2011.
Federal Government’s Proposed Carbon Pricing Mechanism
On 10 July 2011 the Federal Government announced a proposal, ‘Securing a Clean Energy Future – the Australian Government’s Climate Change Plan’ to implement a two-stage carbon pricing mechanism for the Australian economy. The impacts of this proposal have been considered in these financial statements as detailed in note 3.
legal proceedings
On 30 August 2011, the Federal Court handed down its judgement. The Court found in favour of Stanwell Corporation Limited and the full impact of this decision is yet to be determined. The Australian Energy Regulator has 28 days to determine
whether or not to lodge an appeal against this decision. The compensation in relation to legal costs incurred by the Company defending the allegations has not been determined at the date of this report.
No other significant events have occurred between 30 June 2011 and the date of this report that have significantly affected, or may significantly affect:
• the Group’s operations in future financial years;
• the results of those operations in future financial years; or
• the Group’s state of affairs in future financial years.

124 STanwell annual RepoRT 2011
dIRectoRS’ declARAtIon 30 june 2011
In the opinion of the directors:
(a) the financial statements and notes set out on pages 48 to 123 are in accordance with the Corporations Act 2001, including:
(i) complying with Accounting Standards, the Corporations Regulations 2001 and other mandatory professional reporting requirements, and
(ii) giving a true and fair view of the Company’s and Group’s financial position as at 30 June 2011 and of their performance for the financial year ended on that date, and
(b) there are reasonable grounds to believe that the Company will be able to pay its debts as and when they become due and payable.
This declaration is made in accordance with a resolution of the directors.
g j carpenter Chairman
j A leaver Director
Brisbane 30 August 2011

STanwell annual RepoRT 2011 125
Independent AudItoR’S RepoRt 30 june 2011
Independent AudItoR’S RepoRt to tHe memBeRS oF StAnWell coRpoRAtIon lImIted
Report on the Financial Report
I have audited the accompanying financial report of Stanwell Corporation Limited, which comprises the balance sheets as at 30 June 2011, the statements of comprehensive income, statements of changes in equity and cash flow statements for the year then ended, notes comprising a summary of significant accounting policies and other explanatory information, and the directors’ declaration of the company and the consolidated entity comprising the company and the entities it controlled at the year’s end or from time to time during the financial year.
Directors’ responsibility for the Financial Report
The directors of the company are responsible for the preparation of the financial report that gives a true and fair view in accordance with the Australian Accounting Standards and the Corporations Act 2001, and for such internal control as the directors determine is necessary to enable the preparation of the financial report that is free from material misstatement, whether due to fraud or error.
Auditor’s responsibility
My responsibility is to express an opinion on the financial report based on the audit. The audit was conducted in accordance with the Auditor-General of Queensland Auditing Standards, which incorporate the Australian Auditing Standards. Those standards require compliance with relevant ethical requirements relating to audit engagements and that the audit is planned and performed to obtain reasonable assurance about whether the financial report is free from material misstatement.
An audit involves performing procedures to obtain audit evidence about the amounts and disclosures in the financial
report. The procedures selected depend on the auditor’s judgement, including the assessment of the risks of material misstatement of the financial report, whether due to fraud or error. In making those risk assessments, the auditor considers internal control relevant to the entity’s preparation of the financial report that gives a true and fair view in order to design audit procedures that are appropriate in the circumstances, but not for the purpose of expressing an opinion on the effectiveness of the entity’s internal control. An audit also includes evaluating the appropriateness of accounting policies used and the reasonableness of accounting estimates made by the directors, as well as evaluating the overall presentation of the financial report.
I believe that the audit evidence obtained is sufficient and appropriate to provide a basis for my audit opinion.
Independence
The Auditor-General Act 2009 promotes the independence of the Auditor-General and all authorised auditors. The Auditor-General is the auditor of all Queensland public sector entities and can only be removed by Parliament.
The Auditor-General may conduct an audit in any way considered appropriate and is not subject to direction by any person about the way in which audit powers are to be exercised. The Auditor-General has for the purposes of conducting an audit, access to all documents and property and can report to Parliament matters which in the Auditor-General’s opinion are significant.
In conducting the audit, the independence requirements of the Corporations Act 2001 have been complied with. I confirm that the independence declaration required by the Corporations Act 2001, which has been given to the directors of Stanwell Corporation Limited would be in the same terms if given to the directors as at the time of this auditor’s report.
Opinion
In my opinion the financial report of Stanwell Corporation Limited is in accordance with the Corporations Act 2001, including:
(i) giving a true and fair view of the company’s and consolidated entity’s financial position as at 30 June 2011 and of their performance for the year ended on that date; and
(ii) complying with Australian Accounting Standards and the Corporations Regulations 2001.
Emphasis of Matter – Significant Uncertainty Regarding the Impact of Carbon Pricing Mechanism
I draw your attention to Note 3 to the financial statements which describes the uncertainty related to the proposed introduction of the Federal Government’s “Securing a Clean Energy Future – the Australian Government Climate Change Plan”. This uncertainty impacts on impairment testing performed as at 30 June 2011 which resulted in the recognition of an impairment loss of $232.0 million as at 30 June 2011. This uncertainty will also impact on the value of the Gladstone Interconnection and Power Pooling Agreement transferred by Stanwell Corporation Limited and recognised by CS Energy Limited on 1 July 2011. My opinion is not modified in respect of this matter.
Other Matters – Electronic Presentation of the Audited Financial Report
This auditor’s report relates to the financial report of Stanwell Corporation Limited for the year ended 30 June 2011. Where the financial report is included on Stanwell Corporation Limited’s website the company’s directors are responsible for the integrity of Stanwell Corporation Limited’s website and I have not been engaged to report on the integrity of Stanwell Corporation Limited’s website.
126 STanwell annual RepoRT 2011
Independent AudItoR’S RepoRt 30 june 2011
Independent AudItoR’S RepoRt to tHe memBeRS oF StAnWell coRpoRAtIon lImIted (contInued)
Other Matters – Electronic Presentation of the Audited Financial Report (continued)
The auditor’s report refers only to the subject matter described above. It does not provide an opinion on any other information which may have been hyperlinked to/from these statements or otherwise included with the financial report. If users of the financial report are concerned with the inherent risks arising from publication on a website, they are advised to refer to the hard copy of the audited financial report to confirm the information contained in this website version of the financial report.
These matters also relate to the presentation of the audited financial report in other electronic media including CD Rom.
g g poole FcpA Auditor-General of Queensland
Brisbane 31 August 2011

STanwell annual RepoRT 2011 127
gloSSARY
Availability
The total energy available to the system, allowing for planned and forced maintenance, as a percentage of total energy capacity.
carbon intensity
Emissions of C02 (kg) per megawatt hour sent out.
carbon capture and storage
The capture and long-term storage of carbon dioxide in soil, plant, ocean or underground geological formations.
clean coal
Coal that has undergone treatment processes to reduce greenhouse gas emissions.
combined cycle
A combined cycle power plant is the most efficient way to generate electricity. The combined cycle unit reuses the waste heat in a heat recovery steam generator.
emissions trading
The buying and selling of unused emissions credits.
Farm-in-agreement
An arrangement in which one operator buys in or acquires an interest in a lease or concession owned by another operator, on which oil or gas has been discovered or is being produced. Often, a farm-in is negotiated to assist the original owner with development costs and to secure for the buyer a source of oil or gas.
Forced outage factor
The proportion of a plant’s capacity that is unavailable as a result of forced maintenance.
mandatory renewable energy target
The quantity of total energy sales sourced from renewable energy sources.
Renewable energy
Energy generated from natural resources such as sun, wind, rain and ocean.
output
Dispatched generation.
Rewind
The process of removing and replacing the generator stator and rotor windings to extend the life of the generator and improve safety, reliability and efficiency.
Spot market
The physical market managed by AEMO for the dispatch of generating units and dispatchable loads.
Spot price
The half-hour average of the five-minute dispatch prices set by marginal generator.

128 STanwell annual RepoRT 2011
Pictured on back cover: Koombooloomba spillway
ABBRevIAtIonS
Aemo Australian Energy Market Operator
AIFR All Injury Frequency Rate
co2 Carbon dioxide
co2cRc Cooperative Research Centre for Greenhouse Gas Technologies
eeo Equal employment opportunity
eRo Equity Referral Officer
eSAA Energy Supply Association of Australia
FFd Fitness for duty
gl Gigalitre(s). One GL = one thousand megalitres
goc A government owned corporation under the Government Owned Corporations Act 1993
gWh Gigawatt hour. One GWh = one thousand megawatt hours
Igcc Integrated gasification combined cycle
IppA Interconnection and Power Pooling Agreement
ISo14001 International standard for environmental management
ltI Lost Time Injury(ies)
ltIdR Lost Time Injury Duration Rate
ltIFR Lost Time Injury Frequency Rate
ltISR Lost Time Injury Severity Rate
ml Megalitre(s). One ML = one million litres
m Million
mW Megawatt(s). One MW = one million watts
mWh Megawatt hour. One MWh = one thousand kilowatt hours
mdl Mineral Development Licence
nem National Electricity Market. A competitive wholesale electricity market for eastern and south eastern Australia
ngeRS National Greenhouse and Energy Reporting Scheme
nox Nitrogen oxides
pj Petajoules
ppA Power Purchase Agreement
Rop Resource Operations Plan
RtA Rail Transport Agreement
ScI Statement of Corporate Intent
SIp Safety Improvement Project
Sox Sulphor oxides
WRp Water Resource Plan
ZIp Zero Incident Process

STanwell annual RepoRT 2011 129
Index
AuditsAudit and Risk Management Committee 42, 43External 19
Barron gorge Hydro 3, 5, 13, 14, 19, 27, 28, 29, 36
Blue energy limited 16, 33
BoardActivities 4, 15Appointments 4 Committees 4, 40, 41Composition 4, 41Corporate governance 40Directors 4, 15, 41
Burdekin Hydro 5, 9, 33
chairman’s Statement 11
chief executive officer’s Review 13
communityPerformance 24Sponsorships 24
companyStructure 3, 4, 41
economic performance 38
emissions trading 7
employees Apprentice and trainee 21, 23Career development programs 21, 22Certified agreements 22Equal employment opportunity 22Leadership Development Program 21
emu downs Wind Farm 2, 13, 28, 30, 38, 40
environmentAudits 35Climate Change Strategy 35Performance 35 executive management team 16–18 gas 2, 3, 5, 8, 9, 33 Health and safetyLTIDR 20LTIFR 20Performance 19–20Safety Improvement Project 3, 11, 19
Icon energy limited 8, 33
kareeya Hydro 3, 13, 28, 29, 36
koombooloomba Hydro 3, 28, 29, 36
mackay gas turbine 3, 28, 29, 36
market tradingContract market 31, 32Spot market 31, 32
message from incoming chairman 12
operations 27–30
project development 33–34
Risk management 43
Stakeholder engagement 5, 24
Stanwell power Station 3, 5, 6, 8, 13, 14, 19, 27, 28, 29, 30, 35
Statement of corporate Intent i, 7, 43, 46, 47
Wandoan power project 9, 33
Wesfarmers Resources 34
Wivenhoe Small Hydro 3, 28, 29
tABleSAsset performance 29–30Career development programs 23Composition of the Board and committees 41Corporate Entertainment and Hospitality 47EEO numbers 23Environmental incidents by site 36Financial Highlights 2Major environmental incidents 36Office of Government Owned Corporations (OGOC) principles and reporting requirements 44–46Performance indicators 6Performance overview 7–10Workforce numbers 22
gRApHSAll injury frequency rate 20Carbon intensity 37Contract forward curve 32Debt to Debt + Equity 39Demand growth versus installed capacity and spot price 32Earnings before interest and tax 39Employee turnover 23Interest cover 39Lost time injury duration rate 20Lost time injury frequency rate 20Lost time injury severity rate 20Queensland annual average available generation, demand and spot prices 31Return on total assets 39Revenue 39SOx and NOx emissions 37Stanwell Power Station historical availability and outage factors 30Water used and water intensity at Stanwell Power Station 37
130 STanwell annual RepoRT 2011
www.stanwell.com
GPO Box 800 Brisbane QLD 4001
Brisbane office (Registered office) Level 13 42 Albert Street Brisbane QLD 4001 T (07) 3228 4333 F (07) 3228 4300
Rockhampton office Suite 1 and 3, 74 Victoria Parade Rockhampton QLD 4700 T (07) 4931 3000 F (07) 4931 3050
Stanwell power Station T (07) 4930 3444 F (07) 4930 3272
Barron gorge Hydro T (07) 4036 6955 F (07) 4036 6950
kareeya Hydro T (07) 4036 6822 F (07) 4036 6800